
Urban Aerobiome and Effects on Human Health: A Systematic Review and Missing Evidence


Abstract
: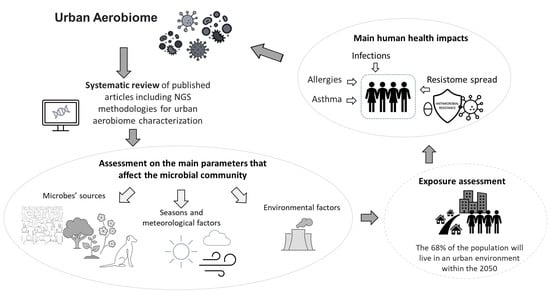
1. Introduction
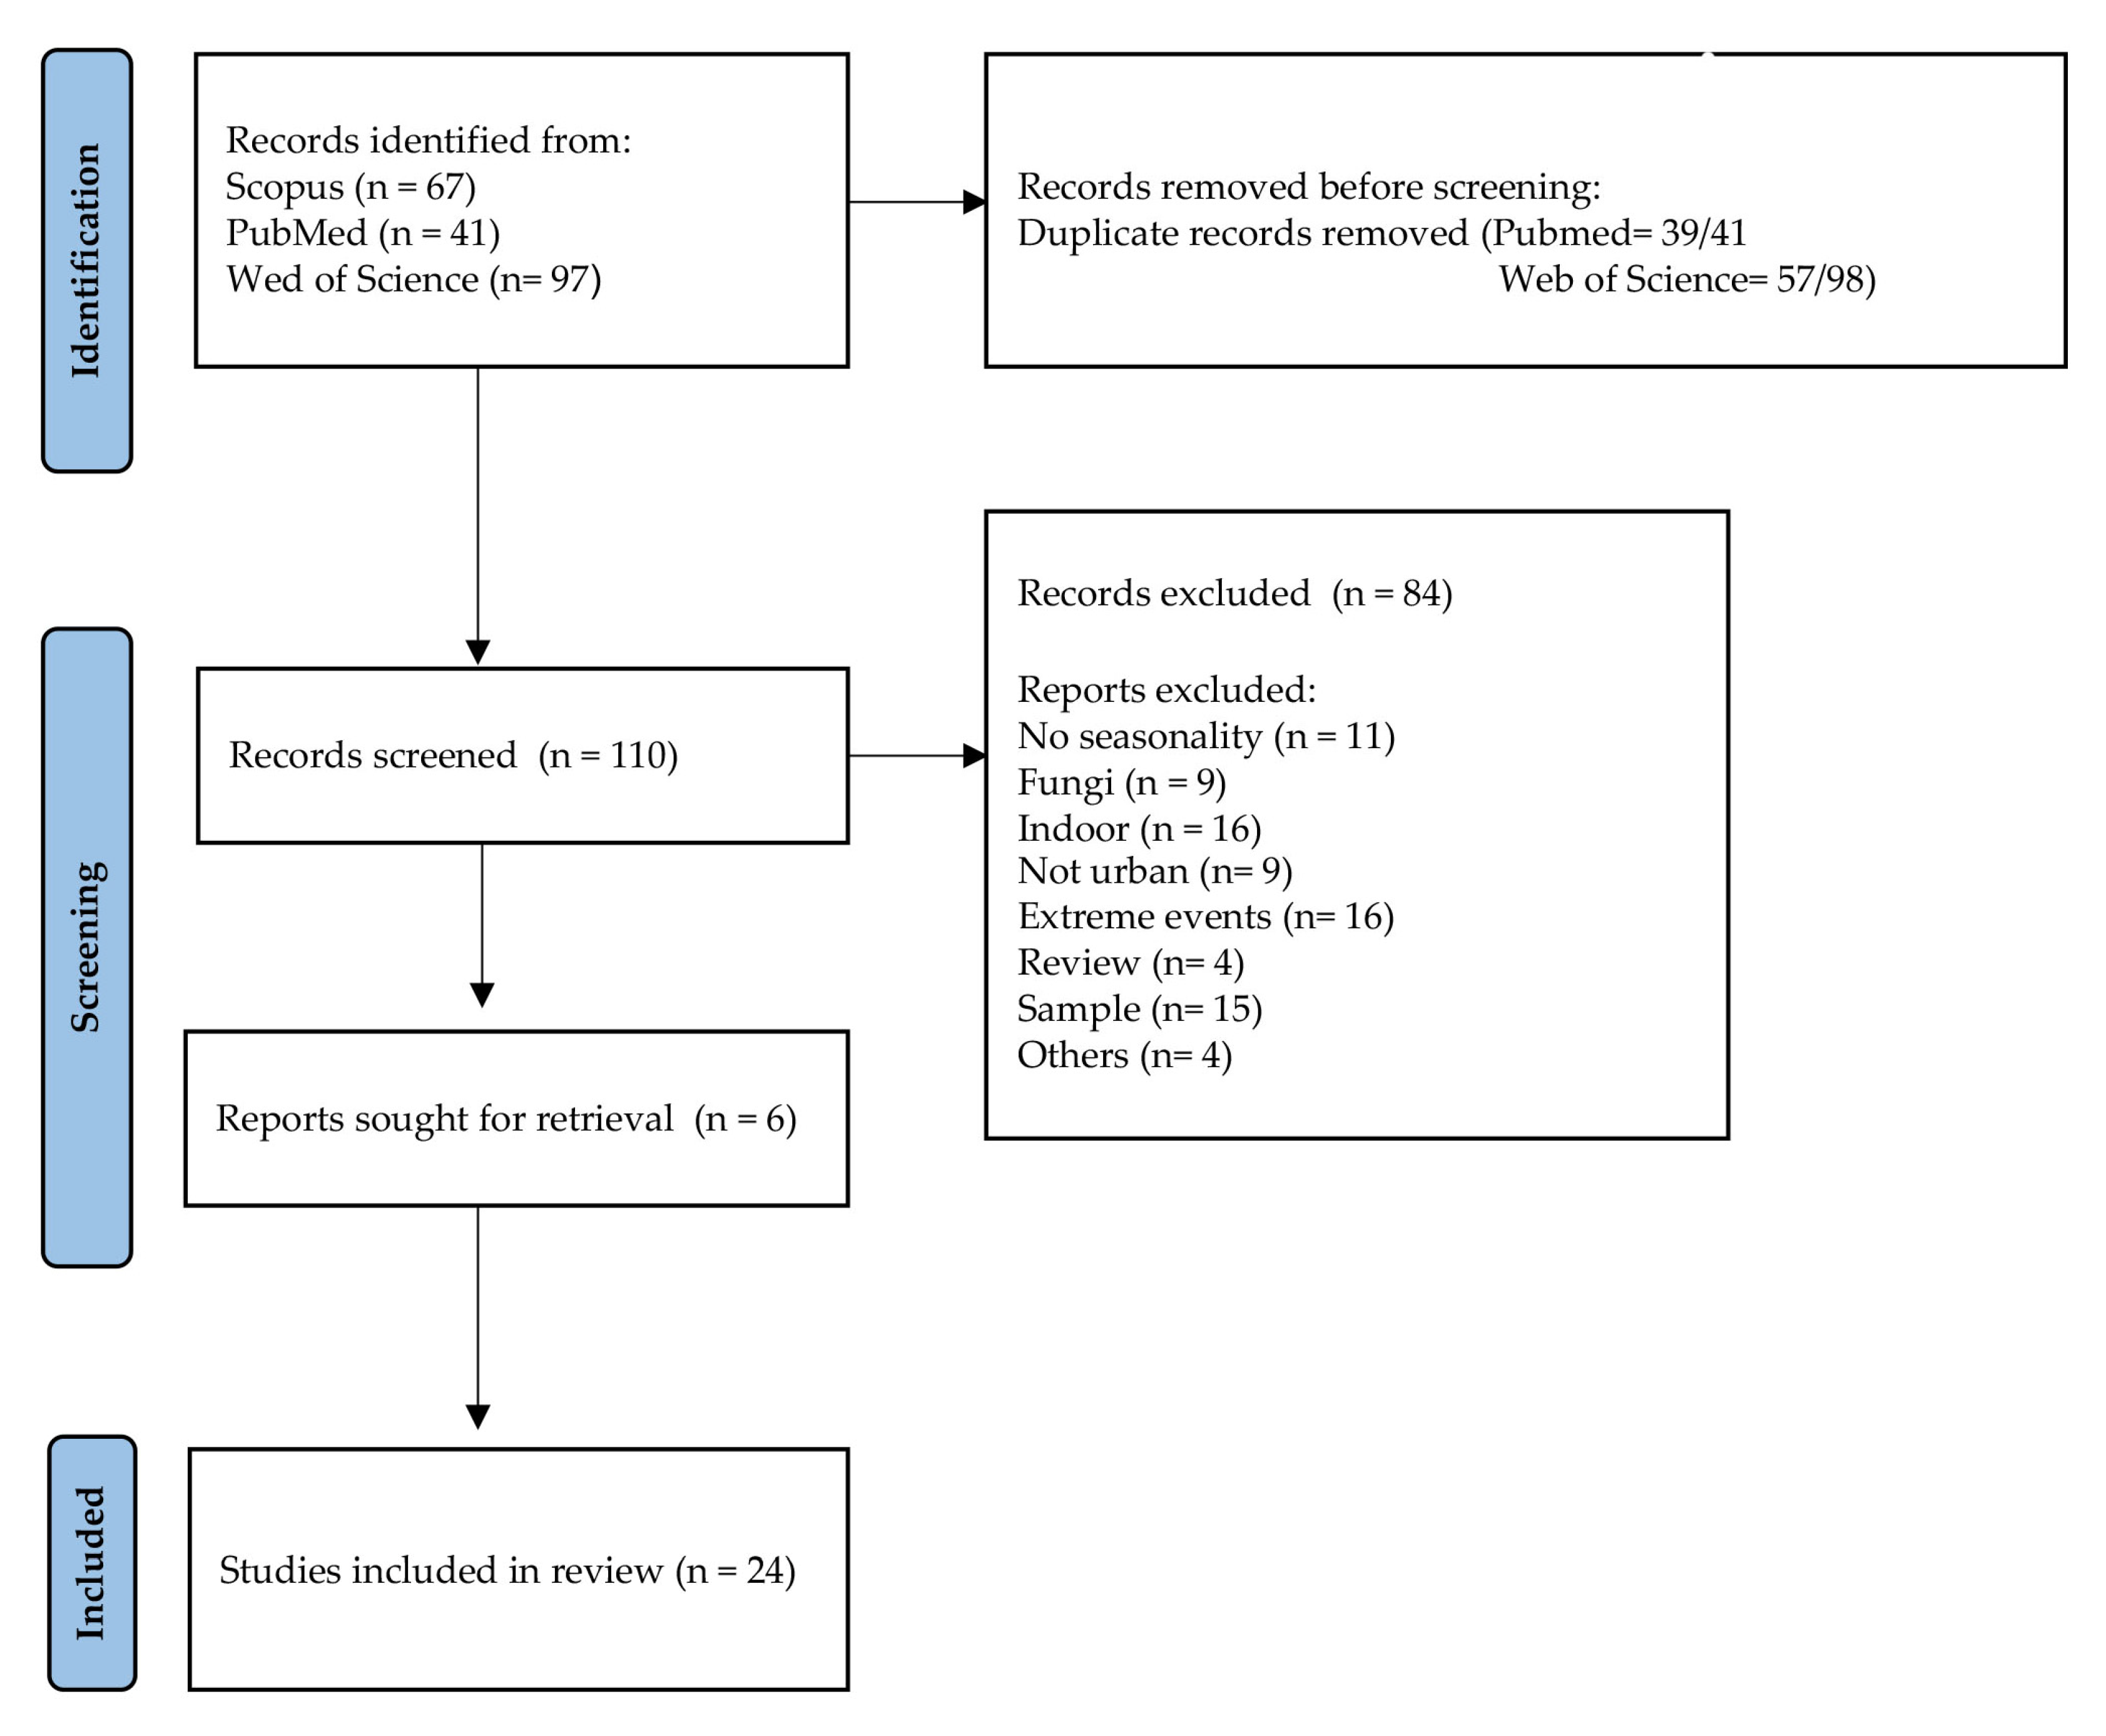
2. Materials and Methods
3. Results

| Reference | Location | Sequencing Method | Phyla More Abundant | Class and Order More Abundant | Genera and Species More Abundant | Pathogens |
|---|---|---|---|---|---|---|
| (Be et al., 2014) [17] | USA | Illumina | Bacteroidetes, Firmicutes, Fusobacteria | Bacillus cereus, B. clausii, B. coagulans, B. megaterium, B. psychrosaccharolyticus, B. pumilus, B. smithii, B. subtilis, B. thuringiensis, Klebsiella pneumoniae, Geobacillus caldoxylosilyticus, Ralstonia pickettii, R. solanacearum, Cupriavidus necator, C. basilensis, Staphylococcus epidermidis, S. hyicus, Stenotrophomonas maltophila | Bacillus cereus, Staphylococcus | |
| (Becsei et al., 2021) [15] | Hungary | Ion Torrent | Proteobacteria, Firmicutes | Bacillus, Acinetobacter, Paenibacillus, Atlantibacter, Citrobacter, Enterobacter, Klebsiella pneumoniae, Leclercia, Pseudoescherichia | ||
| (Bertolini et al., 2013) [41] | Italy | Illumina | Actinobacteria | Actinobacteriales, Chloroplast, Burkholderiales, Sphingobacteriales, Clostridiales, Rhizobiales, Sphingomonadales, Pseudomonadales, Lactobacillales, Bacillales, Rhodospirillales, Rhodobacterales, Flavobacteriales, Enterobacterales | ||
| (Bowers et al., 2013) [16] | USA | Pyrosequencing Illumina | Actinobacteria, Bacteroidetes, Firmicutes, Proteobacteria | Pseudomonadales, Sphingobacteriales, Rhizobiales, Rhodospirillales, Burkholderiales, Actinobacteriales, Bacteroidales, Lactobacillales, Clostridiales | ||
| (Calderón-Ezquerro et al., 2021) [43] | Mexico | Illumina | Actinobacteria, Proteobacteria, Firmicutes, Bacteroidetes, Cyanobacteria | Microbispora, Kocuria, Paracoccus, Corynebacterium, Friedmanniella, Propionicimonas, Aeromicrobium, Nocardioides, Modestobacter, Geodermatophillus, Arsenicoccus, Phycicoccus, Janibacter, Roseomonas, Bacillus, Staphylococcus, Jeotgalicoccus, Salinicoccus, Pseudomonas, Sphingomonas, Streptococcus, Rheinheimera, Janhtinobacterium, Enterobacteraceae | Corynebacterium diphteriae, Mycobacterium tubercolosis, Bacillus antracis, Clostridium botulinum, Clostridium tetani, Kocuria rhizophila, Staphylococcus spp., Acinetobacter spp., Psychrobacter sanguinis, Mycobacterium arupense, Rhodococcus fascians, Enterococcus cecorum, Pseudomonas viridiflava, Erwinia sp. | |
| (Chen et al., 2021) [37] | China | Illumina | Proteobacteria, Actinobacteria, Firmicutes | Myxobacteriales | Summer: Melittangium, Winter: Arthrobacter, Kocuria, Romboutsia, Clostridium sensu stricto 1, Bacillus, Fall: Sphingomonas, Methylobacterium, Paracoccus, Planomicrobium | Streptococcus, Acinetobacter lwoffii, Bacillus anthracis, Prevotella, Clostridium perfringens, C. novyi, Erysipelothrix, Corynebacterium minutissimum, Serratia marcescens, Pseudomonas aeruginosa, Nocardia carnea, N. asteroides, Bacteroides fragilis, Campylobacter jejuni, Legionella pneumophila, Fusobacterium necrophorum |
| (Du et al., 2018) [13] | China | Illumina | Actinobacteria, Proteobacteria, Firmicutes, Cyanobacteria, Ascomycota, Bacteroidetes, Gemmatimonadetes, Acidobacteria, Chloroflexi | Alphaproteobacteria, Clostridiales | Streptophyta, Pseudolabrys, Bacillus, Clostridium, Sphingomonas, Blastococcus, Segetibacter, Methylobacterium, Kocuria, Staphylococcus | |
| (Fan et al., 2019) [38] | China | Illumina | Proteobacteria, Actinobacteria, Firmicutes, Cyanobacteria | Alphaproteobacteria, Betaproteobacteria, Gammaproteobacteria | Ralstonia, Kocuria, Blastococcus, Planococcus, Arthrobacter, Paracocccus, Rubellimicrobium, Sphingomonas, Rhizobium, Propionibacterium, Bacillus, Pseudomonas, Acinetobacter Burkholderia, Bacteroides, Flavisolibacter, Halomonas, Psychrobacter, Candidatus jettenia, Nitrosomonas, Nitrosospria, Nitrosococcus | Spring: Streptococcus, Pseudomonas, Winter: Clostridium, Enterococcus, Air pollution: Escherichia, Shigella, Burkoholderia, Others: Staphylococcus, Mycobacterium, Aeromonas, Neisseria, Haemophilus, Vibrio, Campylobacter, Corynebacterium, Mycoplasma, Rickettsia |
| (Franzetti et al., 2011) [44] | Italy | Pyrosequencing | Proteobacteria, Firmicutes, Actinobacteria | Winter: Actinomycetales; summer: Bacillales, Clostridiales; air pollution: Sphingomonadales, Rhizobiales, Pseudomonadales, Sphingobacteriales, Burkholderiales, Clostridiales, Bacteroidales | Chloroplast | |
| (Gandolfi et al., 2015) [45] | Italy | Illumina | Burkholderiales, Actinomycetales Enterobacterales, Rhodobacterales, Sphingobacteriales, Rhizobiales, Flavobacteriales, Pseudomonadales, Xanthomonadales, Bacillales, Clostridiales | Chloroplast | ||
| (Genitsaris et al., 2017) [46] | Greece | Pyrosequencing | Proteobacteria, Firmicutes, Actinobacteria, Bacteroidetes, Cyanobacteria, Deinococcus-Thermus | Alphaproteobacteria, Betaproteobacteria, Hot: Gammaproteobacteria | Bacillus aquimaris, B. oceanisediminis, Pseudomonas, Synechococcus sp. | Pseudomonas, Propionibacterium, Staphylococcus, Streptococcus, Corynebacterium |
| (González-Martín et al., 2021) [35] | Spain | Illumina | Proteobacteria, Bacteroidetes, Actinobacteria, Firmicutes | Alphaproteobacteria, Betaproteobacteria, Gammaproteobacteria, Deltaproteobacteria, Lachnospiraceae | Cellvibrio, Blastomonas, Limnobacter, Sediminibacterium, Cloachibacterium, Enterococcus, Thermicanus, Terrisporobacter, Kocuria, Delftia, Mesorhizobium, Methylobacterium, Tepidisphaera, Alycobacillus, Acinetobacter, Bacillus, Brucella, Neisseria, Staphylococcus, Streptococcus, Pseudomonas, Brevundimonas, Corynebacterium, Sphingomonas, Blastomonas | Acinetobacter, Enterococcus, Pseudomonas, Bacillus, Brucella, Neisseria, Staphylococcus, Streptococcus |
| (Lee et al., 2017) [47] | China, South Korea and Japan | Illumina | Proteobacteria, Firmicutes, Actinobacteria, Deinococcus-Thermus | Rubellimicrobium, Streptomyces, Kaistobacter, Bacillus, Kocuria, Brevibacillus | ||
| (Li et al., 2019) [39] | China | Ion Torrent | Proteobacteria, Firmicutes, Actinobacteria, Cyanobacteria | Winter: Chloroplast Spring/summer: Lactobacillus Fall: Pseudomonas | ||
| (Hu Li et al., 2019) [48] | China | Illumina | Firmicutes, Proteobacteria, Acidobacteria | Bacillus, Acinetobacter, Brevibacillus, Sphingomonas, Pseudomonas, Kocuria, Paracoccus, Hymenobacter, Corynebacterium | ||
| (Mhuiereach et al., 2019) [49] | USA | Illumina | Proteobacteria, Actinobacteria, Firmicutes, Bacteroidetes, Planctomyces | Deinococci, Thermomicrobia, Anaerolineae, Alphaproteobacteria, Gammaproteobacteria, Flavobacteria | Gluconobacter, Granulibacter, Erwinia billingiae, Rubritepida, Acidicaldus, Citrobacter, Arsenophonus | |
| (Mu et al., 2020) [50] | China | Illumina | Proteobacteria | Cupriavidus, Lactobacillus, Bifidobacterium, Paraburkholderia, Burkholderia | ||
| (Núñez et al., 2019) [40] | Spain | Illumina | Actinobacteria, Proteobacteria | Micrococcales, Alphaproteobacteria, Sphingomonadales, Rhodobacterales, Rhizobiales, Acetobacterales, Bacillales, Clostridiales | Acinetobacter, Actinomyces, Aerococcus, Aeromonas, Arcobacter, Bacillus, Bacteroides, Campylobacter, Clostridium sensu stricto, Corynebacterium, Enterobacter, Enterococcus, Erysipelothrix, Escherichia, Shigella, Fusobacterium, Geodermatophilus, Gordonia, Haemophilus, Helicobacter, Klebsiella, Lactococcus, Legionella, Micrococcus, Micromonospora, Mycobacterium, Mycoplasma, Neisseria, Nocardia, Porphyromonas, Prevotella, Pseudomonas, Roseomonas, Serratia, Staphylococcus, Stenotrophomonas, Streptococcus, Thermoactinomyces, Thermomonospora, Vibrio | Roseomonas, Corynebacterium, Staphylococcus spp., Streptococcus spp., Enterococcus, Bacteroides, Prevotella, Fusobacterium, Enterobacteriaceae |
| (Stewart et al., 2020) [51] | USA | Ion Torrent | Proteobacteria, Firmicutes, Cyanobacteria, Deinococcus-Thermus, Bacteroidetes, Actinobacteria, Tenericutes, Fusobacteria | Alphaproteobacteria, Betaproteobacteria, Gammaproteobacteria | Klebsiella, Escherichia coli, Streptococcus, Salmonella | |
| (Tanaka et al., 2020) [52] | Japan | Illumina | Proteobacteria, Actinobacteria, Firmicutes | Alphaproteobacteria, Betaproteobacteria, Gammaproteobacteria | Bacillus, Staphylococcus, Propionibacterium, Corynebacterium, Sphingomonas, Methylobacterium, Streptococcus | |
| (Uetake et al., 2019) [53] | Japan | Illumina | Proteobacteria, Firmicutes, Cyanobacteria, Actinobacteria, Bacteroidetes, Acidobacteria, Parcubacteria | |||
| (Wang et al., 2021) [54] | China | Illumina | Proteobacteria, Actinobacteria, Firmicutes, Bacteroidetes | Halomonas, Aliihoeflea, Acinetobacter, Sphingomonas, Pelagibacterium, Methylobacterium, Clostridium_sensu_stricto, Prevotella_9, Halorubrum, Rhodococcus, Corynebacterium_1, Rubellimicrobium, Nocardioides, Paracoccus, Bacillus | ||
| (Woo et al., 2013) [55] | Hong Kong | Illumina | Cyanobacteria, Proteobacteria | Betaproteobacteria: Burkholderiales Gammaproteobacteria: Pseudonomadales, Chromatiales, Xanthomonadales | Legionella, Pseudomonas, Shigella, Salmonella, Staphylococcus, Streptococcus, E. coli O157:H7, Clostridium perfringens | |
| (Xu et al., 2020) [34] | China | Illumina | Proteobacteria, Actinobacteria, Cyanobacteria, Firmicutes, Bacteroidetes | Sphingomonas, Curvibacter, Acinetobacter, Bradyrhizobium, Methylobacterium, Halomonas, Aliihoeflea, Phyllobacterium |
 ) and criticalities (
  ) for each paper are reported.
) and criticalities ( ) for each paper are reported.
) for each paper are reported.
) and criticalities ( ) for each paper are reported.| Reference | Location | Sampling Method | Microbes’ Origin | Environmental and Meteorological Factors | Seasons (Highest Diversity →-> Lowest) | Strength and Weaknesses |
|---|---|---|---|---|---|---|
| (Be et al., 2014) [17] | USA | Bioaerosol | Soil, skin microflora | Summer (Bacillus thuringiensis, Staphylococcus spp.) → spring → winter (Firmicutes, Fusobacteria, Bacteroides) → fall Constant through the year: Ralstonia, Cupriavidus, Bacillus | 1 week sampling for each seasonUse whole genome sequencing Consider effects on human health | |
| (Becsei et al., 2021) [15] | Hungary | PM10 | Few samplesConsider ARGs | |||
| (Bertolini et al., 2013) [41] | Italy | Total suspended particles (TSP) | Plant, soil | Temperature (<+6.32 °C Actinobacteridae), PM fraction | Summer and Spring (Sphingomonadales and Rhizobiales), winter: lower (Actinobacteriales, Pseudomonadales e Burkholderiales) | No data about effects on human healthSampling 10 days for each season |
| (Bowers et al., 2013) [16] | USA | Bioaerosol | Soil, plants, cow feces | Air pollution, temperature | Summer → fall → winter (Actinobacteridae) → spring | No data about effects on human health Comparison of urban and rural aerobiome Samples collected every 6 days for 14 months |
| (Calderón-Ezquerro et al., 2021) [43] | Mexico | Bioaerosol | Plant, soil, human skin, water | Meteorological conditions, land-use type, anthropogenic activities, temperature | Dry season (Actinobacteria) → Rainy season (Bacteroidetes) | Comparison of urban and suburban aerobiome Sampling with Hirst-type spore trap Sampling weekly for a yearEvaluation presence of pathogens |
| (Chen et al., 2021) [37] | China | PM2.5 | Soil, water | T, humidity, UV, air pollution (decrease in the diversity) | winter (Streptomyces) → spring (Arthrobacter, Chlostridium sensu stricto 1, Corinebacterium)/fall (Sphingomonas, Methilobacterium, Melittangium) → summer (Bacillus) | Suburban area Samples taken at 30 m height Evaluate health effectsSampling 8–10 days for each season Comparison of 4 years (winter) |
| (Du et al., 2018) [13] | China | PM2.5 | Spring (Cyanobacteria: Streptophyta; Blastococcus, Kocuria, Sphingomonas, Rubellimicrobium) → winter (Actinobacteria, Pseudolabrys, Kocuria, Blastococcus, Staphylococcus) → fall (Firmicutes: Chlostridium; Bacillus, Sphingomonas) → summer (Actinobacteria; Pseudolabrys, Bacillus, Blastococcus, Streptophyta, Segetibacter) | Suburban area Samples taken at 30 m height More than 10 samples for each seasonEvaluation presence of pathogens | ||
| (Fan et al., 2019) [38] | China | PM2.5 | Plant, soil | Air quality index, NO2, SO2, T, RH: positively correlated; O3: negatively correlated | NoneSampling weekly for each season Air samples taken at 1.5 m Evaluation presence of pathogens | |
| (Franzetti et al., 2011) [44] | Italy | PM10-PM2.5 | Soil, plant | T: negatively correlation | Summer (α-proteobacteria: Sphingomonadales) → winter (Actinomycetales, Firmicutes) | Sampling 2 seasons No data about effects on human health Sampling daily for a month foreach season |
| (Gandolfi et al., 2015) [45] | Italy | PM10 | Soil, plants, water, feces | T: positively correlated to plant-associated mo; wind speed and humidity | Diversity between sites is higher in spring (Rhodobacterales) and winter (Flavobacteriales, Pseudomonales, Burkholderiales, Xhantomonadales). In autumn there are Sphingobacteriales and Actinomycetales, and summer Chloroplast | Comparison of urban and suburban aerobiome No data about effects on human health Sampling two days per week for a month for each season |
| (Genitsaris et al., 2017) [46] | Greece | Bioaerosol | Soil, wastewater, plants | Air pollution, T: positively correlated humidity: negatively correlated, precipitation | Summer → fall/winter → spring | Samples taken at 30 m heightSampling weekly for one month for each season Describe presence of pathogens |
| (González-Martín et al., 2021) [35] | Spain | Bioaerosol | Soil, water | Wind direction, temperature | Summer (Blastomonas) → spring (Cellvibrio) → fall (Sphingomonas, Sediminibacterium) → winter (Cellvibrio) | Comparison of Urban area of Tenerife (little island town) and rural areaSampling 3 times a week for 1 year Describe presence of pathogens |
| (Lee et al., 2017) [47] | China, South Korea, Japan | Bioaerosol | Water, soil, plant | Humidity, T: negative correlation; wind speed: positive correlation | Winter → fall/spring → summer | Samples taken above 10 m of height No data about effects on human health Comparison of 3 urban areasSampling the same day in 3 city |
| (Li et al., 2019) [39] | China | PM2.5 | Plant, soil, feces | Wind speed, O3, PM2.5: negatively correlated T: positively correlated, NO2 | Richness = spring (Proteobacteria, Actinobacteria, Firmicutes) Diversity = summer (Proteobacteria, Firmicutes (Lactobacillus), Actinobacteria) | Samples taken at 25 m of height 3 samples for each season Evaluation presence of pathogens |
| (Hu Li et al., 2019) [48] | China | Bioaerosol | Comparison of urban, suburban and rural aerobiomes Evaluates 2 seasons Evaluation presence of pathogensSamples taken at 1.5 m of height | |||
| (Mhuireach et al., 2019) [49] | USA | Bioaerosol | Soil, plant, water | Anthropogenic activities, geography, biotic processes, wind speed | Few samplesFocus on vegetation effects for human health | |
| (Mu et al., 2020) [50] | China | Bioaerosol | Plant, soil | Humidity | 2 seasons sampled Comparison of urban and rural aerobiomes No data about effects on human health Samples taken at 1.5 m of height | |
| (Núñez et al., 2019) [40] | Spain | Bioaerosol | Soil, water, plants | T, precipitation | Summer (Bacillales, Clostridiales, Corynebacteriales,) → fall/spring (Betaproteobacteriales, Sphingomondales, Pseudomonadales, Frankiales) → winter (Micrococcales, Sphingomonadales, Rhodobacteriales, Acetobacteriales) | Sampling 7 days for each season Used a sampling method validated by them: Hirst-type Spore Trap Evaluation presence of pathogens |
| (Stewart et al., 2020) [51] | USA | PM2.5-TSP | Few samples Comparison of urban and suburban aerobiome Evaluation presence of pathogens | |||
| (Tanaka et al., 2020) [52] | Japan | Bioaerosol | Human skin, soil, water | 2 seasonsEvaluation presence of pathogens | ||
| (Uetake et al., 2019) [53] | Japan | Bioaerosol | Soil, water | Humidity, wind speed | Collecting samples for 48–72 h Comparison of urban and suburban aerobiome No data on effects on human health Regular Sampling for 3 seasons | |
| (Wang et al., 2021) [54] | China | PM2.5 | Plant, soil, water | PM, CO, NO2, SO2, O3, AQI, T | Fall (Clostridium_sensu_stricto_1, Corynebacterium_1, Rubellimicrobium, Nocardioides, Paracoccus) → Spring → Summer (Bacillus)/ Winter (Halomonas, Aliihoeflea, Pelagibacterium, Halorubrum, Rhodococcus) | Samples taken at 36–39 m of heightEvaluation presence of pathogens Sampling 1 or 2 weeks for each season |
| (Woo et al., 2013) [55] | Hong Kong | Bioaerosol | T, wind speed, humidity and precipitation, CO2 affect species richness | Summer (Bacillariophyta and Chlorophyta) | NoneSamples taken at 2 m of height Sampling weekly for 2 months for each season Detection of pathogens | |
| (Xu et al., 2020) [34] | China | PM2.5 | Anthropogenic sources, atmospheric changes, air pollution | Comparison of urban and suburban aerobiome Urban samples taken at 21 m of height Detection of pathogens |
4. Discussion
5. Conclusions
Author Contributions
Funding
Institutional Review Board Statement
Informed Consent Statement
Data Availability Statement
Acknowledgments
Conflicts of Interest
References
- World Health Organization. Global Air Quality Guidelines: Particulate Matter (PM2.5 and PM10), Ozone, Nitrogen Dioxide, Sulfur Dioxide and Carbon Monoxide; WHO: Geneva, Switzerland, 2021; ISBN 9789812837134.
- Gerlofsnijland, M.E.; Kelly, F.J.; Cassee, F.R.; He, M. Particulate matter beyond mass: Recent health evidence on the role of fractions, chemical constituents and sources of emission. Inhal. Toxicol. 2013, 8378, 802–812. [Google Scholar]
- Després, V.; Huffman, J.A.; Burrows, S.M.; Hoose, C.; Safatov, A.; Buryak, G.; Fröhlich-nowoisky, J.; Andreae, M.; Pöschl, U.; Jaenicke, R.; et al. Primary biological aerosol particles in the atmosphere: A review. Tellus B Chem. Phys. Meteorol. 2012, 64, 15598. [Google Scholar] [CrossRef] [Green Version]
- Eduard, W.; Heederik, D.; De, C.D.; James, B. Bioaerosol exposure assessment in the workplace: The past, present and recent advances. J. Environ. Monit. 2012, 14, 334–339. [Google Scholar] [CrossRef] [PubMed] [Green Version]
- Marcovecchio, F.; Perrino, C. Chemosphere Contribution of Primary Biological Aerosol Particles to airborne particulate matter in indoor and outdoor environments. Chemosphere 2021, 264, 128510. [Google Scholar] [CrossRef]
- Peccia, J.; Hernandez, M. Incorporating polymerase chain reaction-based identification, population characterization, and quantification of microorganisms into aerosol science: A review. Atmos. Environ. 2006, 40, 3941–3961. [Google Scholar] [CrossRef]
- Duchaine, X.T.M.V.C.; Amato, M.T.F.; Martins, M.C.M.V.; Casamayor, E.D.M.E.O. Bioaerosols in the Barcelona subway system. Indoor Air 2017, 27, 564–575. [Google Scholar]
- Flies, E.J.; Mavoa, S.; Zosky, G.R.; Mantzioris, E.; Williams, C.; Eri, R.; Brook, B.W.; Buettel, J.C. Urban-associated diseases: Candidate diseases, environmental risk factors, and a path forward. Environ. Int. 2019, 133, 105187. [Google Scholar] [CrossRef]
- Senatore, V.; Zarra, T.; Buonerba, A.; Ho, K.; Shadi, C.; Gregory, W.H. Indoor versus outdoor transmission of SARS-COV-2: Environmental factors in virus spread and underestimated sources of risk. Euro-Mediterranean J. Environ. Integr. 2021, 6, 1–9. [Google Scholar] [CrossRef]
- Gandolfi, I.; Bertolini, V.; Ambrosini, R.; Bestetti, G.; Franzetti, A. Unravelling the bacterial diversity in the atmosphere. Appl. Microbiol. Biotechnol. 2013, 97, 4727–4736. [Google Scholar] [CrossRef]
- Filippidou, S.; Wunderlin, T.; Junier, T.; Jeanneret, N.; Dorador, C.; Molina, V.; Johnson, D.R.; Junier, P. A Combination of Extreme Environmental Conditions Favor the Prevalence of Endospore-Forming Firmicutes. Front. Microbiol. 2016, 7, 1707. [Google Scholar] [CrossRef]
- Sattier, B.; Puxbaum, H.; Psenner, R. Bacterial growth in supercooled cloud droplets the incorparation. Geophys. Res. Lett. 2001, 28, 239–242. [Google Scholar] [CrossRef]
- Du, P.; Du, R.; Ren, W.; Lu, Z.; Zhang, Y.; Fu, P. Variations of bacteria and fungi in PM 2.5 in Beijing, China. Atmos. Environ. 2018, 172, 55–64. [Google Scholar] [CrossRef]
- Flies, E.J.; Clarke, L.J.; Brook, B.W.; Jones, P. Urbanisation reduces the abundance and diversity of airborne microbes-but what does that mean for our health? A systematic review. Sci. Total Environ. 2020, 738, 140337. [Google Scholar] [CrossRef]
- Becsei, Á.; Solymosi, N.; Csabai, I.; Magyar, D. Detection of antimicrobial resistance genes in urban air. MicrobiologyOpen 2021, 10, e1248. [Google Scholar] [CrossRef] [PubMed]
- Bowers, R.M.; Clements, N.; Emerson, J.B.; Wiedinmyer, C.; Hannigan, M.P.; Fierer, N. Seasonal Variability in Bacterial and Fungal Diversity of the Near- Surface Atmosphere. Environ. Sci. Technol. 2013, 47, 12097–12106. [Google Scholar] [CrossRef]
- Be, N.A.; Thissen, J.B.; Fofanov, V.Y.; Allen, J.E.; Rojas, M.; Golovko, G.; Fofanov, Y.; Koshinsky, H.; Jaing, C.J. Metagenomic Analysis of the Airborne Environment in Urban Spaces. Microb. Ecol. 2014, 69, 346–355. [Google Scholar] [CrossRef] [Green Version]
- Bowers, R.M.; Mccubbin, I.B.; Hallar, A.G.; Fierer, N. Seasonal variability in airborne bacterial communities at a high-elevation site. Atmos. Environ. 2012, 50, 41–49. [Google Scholar] [CrossRef]
- Lagier, J.C.; Dubourg, G.; Million, M.; Cadoret, F.; Bilen, M.; Fenollar, F.; Levasseur, A.; Rolain, J.M.; Fournier, P.E.; Raoult, D. Culturing the human microbiota and culturomics. Nat. Rev. Microbiol. 2018, 16, 540–550. [Google Scholar] [CrossRef] [Green Version]
- Kim, K.; Kabir, E.; Jahan, S.A. Airborne bioaerosols and their impact on human health. J. Environ. Sci. 2017, 67, 23–35. [Google Scholar] [CrossRef]
- Jaenicke, R. Abundance of Cellular Material and Proteins in the Atmosphere. Science 2005, 308, 73. [Google Scholar] [CrossRef]
- Kawanaka, Y.; Tsuchiya, Y.; Yun, S.; Sakamoto, K. Size Distributions of Polycyclic Aromatic Hydrocarbons in the Atmosphere and Estimation of the Contribution of Ultrafine Particles to Their Lung Deposition. Environ. Sci. Technol. 2009, 43, 6851–6856. [Google Scholar] [CrossRef] [PubMed]
- Zhao, R.; Guo, Z.; Zhang, R.; Deng, C.; Xu, J.; Dong, W.; Hong, Z.; Yu, H.; Situ, H.; Liu, C.; et al. Nasal epithelial barrier disruption by particulate matter ≤2.5 μm via tight junction protein degradation. J. Appl. Toxicol. 2018, 38, 678–687. [Google Scholar] [CrossRef] [PubMed]
- Samake, A.; Uzu, G.; Martins, J.M.F.; Calas, A.; Vince, E.; Parat, S.; Jaffrezo, J.L. The unexpected role of bioaerosols in the Oxidative Potential of PM. Sci. Rep. 2017, 7, 10978. [Google Scholar] [CrossRef]
- Groulx, N.; Urch, B.; Duchaine, C.; Mubareka, S.; Scott, J.A. The Pollution Particulate Concentrator (PoPCon): A platform to investigate the effects of particulate air pollutants on viral infectivity. Sci. Total Environ. 2018, 628–629, 1101–1107. [Google Scholar] [CrossRef] [PubMed]
- Qin, T.; Zhang, F.; Zhou, H.; Ren, H.; Du, Y.; Liang, S.; Wang, F.; Cheng, L.; Xie, X.; Jin, A.; et al. High-Level PM2.5/PM10 exposure is associated with alterations in the human pharyngeal microbiota composition. Front. Microbiol. 2019, 10, 54. [Google Scholar] [CrossRef] [PubMed] [Green Version]
- Mariani, J.; Favero, C.; Spinazzè, A.; Cavallo, D.M.; Carugno, M.; Motta, V.; Bonzini, M.; Cattaneo, A.; Pesatori, A.C.; Bollati, V. Short-term particulate matter exposure influences nasal microbiota in a population of healthy subjects. Environ. Res. 2018, 162, 119–126. [Google Scholar] [CrossRef]
- Rylance, J.; Kankwatira, A.; Nelson, D.E.; Toh, E.; Day, R.B.; Lin, H.; Gao, X.; Dong, Q.; Sodergren, E.; Weinstock, G.M.; et al. Household air pollution and the lung microbiome of healthy adults in Malawi: A cross-sectional study. BMC Microbiol. 2016, 16, 1–7. [Google Scholar] [CrossRef] [Green Version]
- Mousavi, S.E.; Delgado-Saborit, J.M.; Adivi, A.; Pauwels, S.; Godderis, L. Air pollution and endocrine disruptors induce human microbiome imbalances: A systematic review of recent evidence and possible biological mechanisms. Sci. Total Environ. 2022, 816, 151654. [Google Scholar] [CrossRef]
- Jochum, L.; Stecher, B. Label or Concept–What Is a Pathobiont? Trends Microbiol. 2020, 28, 789–792. [Google Scholar] [CrossRef]
- Kraemer, J.G.; Aebi, S.; Hilty, M.; Oppliger, A. Nasal microbiota composition dynamics after occupational change in animal farmers suggest major shifts. Sci. Total Environ. 2021, 782, 146842. [Google Scholar] [CrossRef]
- Janvier, X.; Alexandre, S.; Boukerb, A.M.; Souak, D.; Maillot, O.; Barreau, M.; Gouriou, F.; Grillon, C.; Feuilloley, M.G.J.; Groboillot, A. Deleterious Effects of an Air Pollutant (NO2) on a Selection of Commensal Skin Bacterial Strains, Potential Contributor to Dysbiosis? Front. Microbiol. 2020, 11, 591839. [Google Scholar] [CrossRef] [PubMed]
- Page, M.J.; McKenzie, J.E.; Bossuyt, P.M.; Boutron, I.; Hoffmann, T.C.; Mulrow, C.D.; Shamseer, L.; Tetzlaff, J.M.; Akl, E.A.; Brennan, S.E.; et al. The PRISMA 2020 statement: An updated guideline for reporting systematic reviews. BMJ 2021, 74, 790–799. [Google Scholar]
- Xu, C.; Chen, J.; Wang, Z.; Chen, H.; Feng, H.; Wang, L.; Xie, Y.; Wang, Z.; Ye, X.; Kan, H.; et al. Diverse bacterial populations of PM2.5 in urban and suburb Shanghai, China. Front. Environ. Sci. Eng. 2021, 15, 37. [Google Scholar] [CrossRef]
- González-Martín, C.; Pérez-González, C.J.; González-Toril, E.; Expósito, F.J.; Aguilera, Á.; Díaz, J.P. Airborne Bacterial Community Composition According to Their Origin in Tenerife, Canary Islands. Front. Microbiol. 2021, 12, 732961. [Google Scholar] [CrossRef]
- Kim, B.R.; Shin, J.; Guevarra, R.B.; Lee, J.H.; Kim, D.W.; Seol, K.H.; Lee, J.H.; Kim, H.B.; Isaacson, R.E. Deciphering diversity indices for a better understanding of microbial communities. J. Microbiol. Biotechnol. 2017, 27, 2089–2093. [Google Scholar] [CrossRef] [Green Version]
- Chen, H.; Du, R.; Zhang, Y.; Du, P.; Zhang, S.; Ren, W.; Yang, M. Evolution of PM 2.5 bacterial community structure in Beijing’s suburban atmosphere. Sci. Total Environ. 2021, 799, 149387. [Google Scholar] [CrossRef]
- Fan, X.; Gao, J.; Pan, K.; Li, D.; Dai, H.; Li, X. More obvious air pollution impacts on variations in bacteria than fungi and their co-occurrences with ammonia-oxidizing microorganisms in. Environ. Pollut. 2019, 251, 668–680. [Google Scholar] [CrossRef]
- Li, H.; Shan, Y.; Huang, Y.; An, Z.; Xu, G.; Wei, F.; Zhang, G.; Wu, W. Bacterial Community Specification in PM 2.5 in Different Seasons in Xinxiang, Central China. Aerosol Air Qual. Res. 2019, 19, 1355–1364. [Google Scholar] [CrossRef]
- Núñez, A.; Amo, G.; Paz, D.; Rastrojo, A.; Ferencova, Z.; Alcamí, A.; Moreno, D.A.; Guantes, R.; Técnica, E.; De Ingenieros, S.; et al. Temporal patterns of variability for prokaryotic and eukaryotic diversity in the urban air of Madrid (Spain). Atmospheric Environ. 2019, 217, 116972. [Google Scholar] [CrossRef]
- Bertolini, V.; Gandolfi, I.; Ambrosini, R.; Bestetti, G.; Innocente, E.; Rampazzo, G.; Franzetti, A. Temporal variability and effect of environmental variables on airborne bacterial communities in an urban area of Northern Italy. Appl. Microbiol. Biotechnol. 2013, 97, 6561–6570. [Google Scholar] [CrossRef] [Green Version]
- Kanchan, K.; Gorai, A.K.; Goyal, P. A review on air quality indexing system. Asian J. Atmos. Environ. 2015, 9, 101–113. [Google Scholar] [CrossRef] [Green Version]
- Calderón-Ezquerro, M.d.C.; Serrano-Silva, N.; Brunner-Mendoza, C. Aerobiological study of bacterial and fungal community composition in the atmosphere of Mexico City throughout an annual cycle. Environ. Pollut. 2021, 278, 116858. [Google Scholar] [CrossRef] [PubMed]
- Franzetti, A.; Gandolfi, I.; Gaspari, E.; Ambrosini, R. Seasonal variability of bacteria in fine and coarse urban air particulate matter. Appl. Microbiol. Biotechnol. 2011, 90, 745–753. [Google Scholar] [CrossRef]
- Gandolfi, I.; Bertolini, V.; Bestetti, G.; Ambrosini, R. Spatio-temporal variability of airborne bacterial communities and their correlation with particulate matter chemical composition across two urban areas. Appl. Microbiol. Biotechnol. 2015, 99, 4867–4877. [Google Scholar] [CrossRef] [PubMed]
- Genitsaris, S.; Stefanidou, N.; Katsiapi, M.; Kormas, K.A.; Sommer, U.; Moustaka-Gouni, M. Variability of airborne bacteria in an urban Mediterranean area (Thessaloniki, Greece). Atmos. Environ. 2017, 157, 101–110. [Google Scholar] [CrossRef]
- Lee, J.Y.; Park, E.H.; Lee, S.; Ko, G.; Honda, Y.; Hashizume, M.; Deng, F.; Yi, S.; Kim, H. Airborne Bacterial Communities in Three East Asian Cities of China, South Korea, and Japan. Sci. Rep. 2017, 7, 5545. [Google Scholar] [CrossRef] [Green Version]
- Li, H.; Zhou, X.; Yang, X.; Zhu, Y.; Hong, Y.; Su, J. Spatial and seasonal variation of the airborne microbiome in a rapidly developing city of China. Sci. Total Environ. 2019, 665, 61–68. [Google Scholar] [CrossRef]
- Mhuireach, G.; Betancourt-Román, C.M.; Green, J.L.; Johnson, B.R. Spatiotemporal controls on the urban aerobiome. Front. Ecol. Evol. 2019, 7, 43. [Google Scholar] [CrossRef] [Green Version]
- Mu, F.; Li, Y.; Lu, R.; Qi, Y.; Xie, W.; Bai, W. Source identification of airborne bacteria in the mountainous area and the urban areas. Atmos. Res. 2020, 231, 104676. [Google Scholar] [CrossRef]
- Stewart, J.D.; Shakya, K.M.; Bilinski, T.; Wilson, J.W.; Ravi, S.; Seok, C. Variation of near surface atmosphere microbial communities at an urban and a suburban site in Philadelphia, PA, USA. Sci. Total Environ. 2020, 724, 138353. [Google Scholar] [CrossRef]
- Tanaka, D.; Fujiyoshi, S.; Maruyama, F.; Goto, M. Size resolved characteristics of urban and suburban bacterial bioaerosols in Japan as assessed by 16S rRNA amplicon sequencing. Sci. Rep. 2020, 10, 12406. [Google Scholar] [CrossRef] [PubMed]
- Uetake, J.; Tobo, Y.; Uji, Y.; Hill, T.C.J.; Demott, P.J. Seasonal Changes of Airborne Bacterial Communities Over Tokyo and Influence of Local Meteorology. Front. Microbiol. 2019, 10, 1572. [Google Scholar] [CrossRef] [PubMed] [Green Version]
- Wang, S.; Liu, W.; Li, J.; Sun, H.; Qian, Y.; Ding, L.; Ma, H.; Li, J. Seasonal variation characteristics of bacteria and fungi in pm2.5 in typical basin cities of Xi’an and Linfen, China. Atmosphere 2021, 12, 809. [Google Scholar] [CrossRef]
- Woo, A.C.; Brar, M.S.; Chan, Y.; Lau, M.C.Y.; Leung, F.C.C.; Scott, J.A.; Vrijmoed, L.L.P.; Zawar-reza, P.; Pointing, S.B. Temporal variation in airborne microbial populations and microbially- derived allergens in a tropical urban landscape. Atmos. Environ. 2013, 74, 291–300. [Google Scholar] [CrossRef]
- Hyvönen, S.; Lohi, J.; Tuuminen, T. Moist and Mold Exposure is Associated with High Prevalence of Neurological Symptoms and MCS in a Finnish Hospital Workers Cohort. Saf. Health Work 2020, 11, 173–177. [Google Scholar] [CrossRef]
- Xu, R.; Rahmandad, H.; Gupta, M.; DiGennaro, C.; Ghaffarzadegan, N.; Amini, H.; Jalali, M.S. Weather, air pollution, and SARS-CoV-2 transmission: A global analysis. Lancet Planet. Health 2021, 5, e671–e680. [Google Scholar] [CrossRef]
- Liu, H.; Zhang, X.; Zhang, H.; Yao, X.; Zhou, M.; Wang, J. Effect of air pollution on the total bacteria and pathogenic bacteria in different sizes of particulate matter. Environ. Pollut. 2018, 233, 483–493. [Google Scholar] [CrossRef]
- Fan, C.; Li, Y.; Liu, P.; Mu, F.; Xie, Z.; Lu, R.; Qi, Y.; Wang, B.; Jin, C. Characteristics of airborne opportunistic pathogenic bacteria during autumn and winter in Xi’an, China. Sci. Total Environ. 2019, 672, 834–845. [Google Scholar] [CrossRef]
- Vargas Buonfiglio, L.G.; Comellas, A.P. Mechanism of ambient particulate matter and respiratory infections. J. Thorac. Dis. 2020, 12, 134–136. [Google Scholar] [CrossRef]
- Rodriguez, A.; Brickley, E.; Rodrigues, L.; Normansell, R.A.; Barreto, M.; Cooper, P.J. Urbanisation and asthma in low-income and middle-income countries: A systematic review of the urban–rural differences in asthma prevalence. Thorax 2019, 74, 1020–1030. [Google Scholar] [CrossRef] [Green Version]
- Mao, Q.; Jiang, F.; Yin, R.; Wang, J.; Xia, W.; Dong, G.; Ma, W.; Yang, Y.; Xu, L.; Hu, J. Interplay between the lung microbiome and lung cancer. Cancer Lett. 2018, 415, 40–48. [Google Scholar] [CrossRef] [PubMed]
- WHO Antimicrobial Resistance. Available online: https://www.who.int/news-room/fact-sheets/detail/antimicrobial-resistance (accessed on 5 April 2022).
- Li, J.; Cao, J.; Zhu, Y.; Chen, Q.; Shen, F.; Wu, Y.; Xu, S.; Fan, H.; Da, G.; Huang, R.; et al. Global Survey of Antibiotic Resistance Genes in Air. Environ. Sci. Technol. 2018, 52, 10975–10984. [Google Scholar] [CrossRef] [PubMed] [Green Version]
- Pulliero, A.; Traversi, D.; Franchitti, E.; Barchitta, M.; Izzotti, A.; Agodi, A. The Interaction among Microbiota, Epigenetic Regulation, and Air Pollutants in Disease Prevention. J. Pers. Med. 2022, 12, 14. [Google Scholar] [CrossRef] [PubMed]
- He, P.; Wu, Y.; Huang, W.; Wu, X.; Lv, J.; Liu, P.; Bu, L.; Bai, Z. Characteristics of and variation in airborne ARGs among urban hospitals and adjacent urban and suburban communities: A metagenomic approach. Environ. Int. 2020, 139, 105625. [Google Scholar] [CrossRef] [PubMed]
- Flies, E.J.; Jones, P.; Buettel, J.C.; Brook, B.W. Compromised Ecosystem Services from Urban Aerial Microbiomes: A Review of Impacts on Human Immune Function. Front. Ecol. Evol. 2020, 8, 568902. [Google Scholar] [CrossRef]
- Núñez, A.; de Paz, G.A.; Rastrojo, A.; García, A.M.; Alcamí, A.; Montserrat Gutiérrez-Bustillo, A.; Moreno, D.A. Monitoring of airborne biological particles in outdoor atmosphere. Part 2: Metagenomics applied to urban environments. Int. Microbiol. 2016, 19, 69–80. [Google Scholar]
- WHO Urban Health. Available online: https://www.who.int/health-topics/urban-health#tab=tab_1 (accessed on 7 April 2022).
Publisher’s Note: MDPI stays neutral with regard to jurisdictional claims in published maps and institutional affiliations. |
© 2022 by the authors. Licensee MDPI, Basel, Switzerland. This article is an open access article distributed under the terms and conditions of the Creative Commons Attribution (CC BY) license (https://creativecommons.org/licenses/by/4.0/).
Share and Cite
Franchitti, E.; Caredda, C.; Anedda, E.; Traversi, D. Urban Aerobiome and Effects on Human Health: A Systematic Review and Missing Evidence. Atmosphere 2022, 13, 1148. https://doi.org/10.3390/atmos13071148
Franchitti E, Caredda C, Anedda E, Traversi D. Urban Aerobiome and Effects on Human Health: A Systematic Review and Missing Evidence. Atmosphere. 2022; 13(7):1148. https://doi.org/10.3390/atmos13071148
Chicago/Turabian StyleFranchitti, Elena, Chiara Caredda, Elisa Anedda, and Deborah Traversi. 2022. "Urban Aerobiome and Effects on Human Health: A Systematic Review and Missing Evidence" Atmosphere 13, no. 7: 1148. https://doi.org/10.3390/atmos13071148
APA StyleFranchitti, E., Caredda, C., Anedda, E., & Traversi, D. (2022). Urban Aerobiome and Effects on Human Health: A Systematic Review and Missing Evidence. Atmosphere, 13(7), 1148. https://doi.org/10.3390/atmos13071148