Article

Evaluation of Observed and Future Climate Change Projection for Uttarakhand, India, Using CORDEX-SA

1
State Environment, Conservation and Climate Change Directorate, Dehradun 248001, India
2
Delhi School of Climate Change & Sustainability, Institution of Eminence, University of Delhi, Delhi 110007, India
3
Department of Geography, Delhi School of Economics, University of Delhi, Delhi 110007, India
4
Earth Science Center, Japan Meteorological Corporation Limited, Osaka 5300011, Japan
*
Authors to whom correspondence should be addressed.
Atmosphere 2022, 13(6), 947; https://doi.org/10.3390/atmos13060947
Submission received: 7 April 2022 / Revised: 29 May 2022 / Accepted: 7 June 2022 / Published: 10 June 2022
(This article belongs to the Special Issue New Approaches to Complex Climate Systems)

Abstract

:
The climate change scenarios, especially global warming, have raised significant concerns, and the Himalayan regions such as Uttarakhand are highly vulnerable to such climatic shifts. Considering 10 Coordinated Regional Climate Downscaling Experiments in South Asia (CORDEX-SA), experiments with 3 regional climate models (RCMs), driven by 13 global climate models, historical estimates and future projections are analyzed from the mid-century (MC) i.e., from 2021–2050 to the end of the century (EC) i.e., from 2070–2099 to characterize annual and seasonal variations in precipitation and temperature. The analysis shows a decrease in the annual average precipitation by 5.92% at MC and an increase of 5.97% at EC for the Representative Climate Pathway (RCP) 4.5, while precipitation may likely increase from 2.83% to 15.89% towards MC and EC in the RCP 8.5. The maximum temperature may likely increase from 0.42 °C to 3.07 °C from MC to EC in the RCP 4.5 and from 0.83 °C to 5.49 °C in the RCP 8.5. In addition, the minimum temperature may increase from 0.80 °C to 3.25 °C from MC to EC in the RCP 4.5 and from 0.30 °C to 5.86 °C from MC to EC in the RCP 8.5. Notably, a decrease in the pre-monsoon precipitation at EC and a higher increase in the maximum temperature during the monsoon season are observed. An increase in the maximum temperature along with precipitation may lead to an increase in the frequency of the monsoon season’s extreme rainfall events.

1. Introduction

The global carbon cycle is known to be a crucial component of future climate change. It has close linkages with anthropogenic CO2 emissions, which change the atmospheric CO2 concentration and, consequently, the climate [1]. Climate change is a major challenge for Uttarakhand in the Himalayas as it faces not only large-scale climate variability but also direct impacts on livelihoods [2]. The mountainous region of Uttarakhand is endowed with a variety of medicinal plants with huge demand in the domestic and international markets [3,4,5], forest area, perennial rivers, biodiversity, and sustainable tourism [6]. The majority of the area in Uttarakhand is mountainous, and people are dependent on the natural ecosystems. Agriculture is a major contributor to Uttarakhand’s gross state domestic product (11% in 2011–2012), and it is the source of livelihood for 70% of its population [7].
Forests, agriculture, glaciers, and rivers are highly vulnerable to climate impacts such as flash floods, landslides, and other natural calamities. The majority of the area in Uttarakhand is under forest, and because of the high intensity of extreme events in the hill region, forests are becoming highly fragile [8]. The intensity and frequency of extreme events may increase with changes in climate at different spatial scales [9,10], and therefore the most important task is to document future changes in the climate variables such as precipitation and temperature. The general trend of rainfall [11] and temperature [12] in India has been changing in the past [11,13,14], and therefore it is pertinent to analyze the projections for the mountainous region of Uttarakhand as well. Recent studies in future projections have also revealed the high possibility of an increase in the sea surface temperature in different emission scenarios, and therefore, because of the continuous oceanic warming, changes in the climate dynamics may impact the precipitation and temperature pattern over inland regions such as Uttarakhand [15].
Agriculture is vulnerable to climate variability because of the changes linked with temperature, rainfall, and crop cycles [16,17] (https://www.prepdata.org/dashboards/uttarakhand-agriculture-dashboard (accessed on 9 January 2022)). Agriculture is one notable piece of evidence that shows that anthropogenic activities are affecting the present climate [18], which is leading to the warming of the Himalayas at a higher rate than the global average [13]. Shrestha et al. (2012) highlighted the climate change in the Himalayan region and its repercussion on the local ecosystem [19] and noted the high importance of the critical climate parameters such as temperature and precipitation concerning their impact on the vegetation phenology.
The topography of the hilly region remains very complex and unstable, with much regional heterogeneity and poor representation of mesoscale processes; therefore, general circulation model (hereafter GCM) is not suitable for climate study in the Himalayan region [20]. The resolution of the GCM data is too coarse for a small region of Uttarakhand that a few grid points can easily cover the whole region. Because of the coarse resolution (~250 and 600 km) of the GCM data, it becomes very difficult to obtain an accurate projection of the climatic parameters of temperature and rainfall for Uttarakhand [21]. Therefore, GCM data are unable to represent the local phenomena accurately, and RCM data, or downscaling process, are necessary in such a case. Nowadays, regional climate models (hereafter RCMs) are widely used to analyze present climate, future climate, and paleoclimate in different regions across the world [22,23]. In the RCM, the finer resolution is used at a larger scale, which is in the interest of the regional domain [24]. In RCM, the dynamical downscaling technique is used [25]. The RCM intends downscaling techniques to generate a realistic regional climate at finer resolution across the world [26] with higher resolution and model skill over a smaller domain of interest [24]. The use of high-resolution data is always a high priority of the scientific community. PRECIS data (high-resolution dataset) were used earlier to know the projections over the Hindu Kush Himalayan region, and it showed significant warming trend in Uttarakhand towards the end of the 21st century [27].
Similarly, an analysis based on the CMIP3 and CMIP5 data also provides the estimates of the extreme temperature and precipitation over the Hindu Kush Himalayas [28]; however, the central Himalayan region, covers the Uttarakhand state, was not the part of the analysis. Using the station data over the northwestern Himalayan region, a study revealed that the temperature range over the region increased particularly due to the rise in maximum temperature [29]. Sanjay et al. (2017) discussed the seasonal projections of temperature and precipitation over the Hindu Kush Himalayan region using CORDEX-SA and highlighted the need for the improvement by incorporating regional processes and feedback to narrow the uncertainty in the regional climate models [30].
Scientists are engaged in various research studies over the Himalayan region for analyzing precipitation patterns using different Coordinated Regional Climate Downscaling Experiments (CORDEX) in South Asia experiments for the southwest monsoon season in India [31] and its future projection [32]. CORDEX is a framework of the World Climate Research Programme (WCRP), and it was implemented for the detailed and accurate projections and their use in the provision of robust regional climate information for application in vulnerability, impact, and adaptation analysis-related studies [33]. CORDEX data have been used and tested for the study of seasonal climatology and its performance over the Asian region [34] and have been adopted for the assessment of RCMs in the CORDEX South Asia (CORDEX-SA) for evaluating their ability to capture and characterize the rainfall pattern [35]. CORDEX is a high-resolution simulation model for regional climate downscaling and consists of 17 domains, and CORDEX-SA is one of them. CORDEX RCMs have a resolution of 0.44° (~50 km) over the CORDEX-SA domain. This domain consists of 11 different suites with different RCMs driven by GCM’s initial and boundary conditions. All CORDEX historical or future datasets were developed by different modeling groups and centers working across the world.
CORDEX experiments can simulate the climate of the Himalayas for the present climate of the monsoon season and identify the best-performing model through many statistical analyses [31]. However, winter precipitation is not verified for its future projection suitability using an RCM [36]. Understanding CORDEX experiments, the study focuses on identifying better-performing experiments for winter precipitation analysis over the region and its future projection under Representative Climate Pathways (RCPs)—radiative forcing scenarios intended to support research on impacts and potential policy responses to climate change [37]. They are the product of an innovative collaboration between integrated assessment modelers, climate modelers, terrestrial ecosystem modelers, and emission inventory experts. The changes represented in these RCPs are radiative forcing at the tropopause by 2100 relative to preindustrial levels. There are four RCPs (RCP 2.6, RCP 4.5, RCP 6, and RCP 8.5) and are named based on their changing radiative force (+2.6, +4.5, +6.0, and +8.5 W/m2, respectively) by 2100 [38,39,40].
The objective of the present study is to analyze the future projections of the annual average precipitation, maximum temperature, and minimum temperature in RCP 4.5 (moderate emission scenario) and RCP 8.5 (high emission scenario) for mid-century (MC), i.e., from 2021–2050, and end of the century (EC), i.e., from 2070–2099. The years 1976–2005 are the historical period Climate Research Unit (hereafter CRU) reference data for the Uttarakhand. Along with the annual analysis, the seasonal projections, i.e., for January–February (hereafter JF) [41,42], March–April–May (hereafter MAM) [42], June–July–August–September (hereafter JJAS) [11,42], October–November–December (hereafter OND) [42,43,44,45] are also presented in the present study. Many studies on temperature trend in the Himalayan region have shown a high rate of increase in the minimum and maximum temperature over the high altitudinal regions [13,46]. In the present study, districtwise annual analysis using the CORDEX-SA data is presented specifically for Uttarakhand, and therefore the present study provides the estimate of the historical and future projection-based analysis of temperature and precipitation.

2. Materials and Methods

2.1. Study Area

Uttarakhand is a region in the northern part of India (Figure 1), and India’s two important rivers (Ganga and Yamuna) originate in the region. The region can be divided into two distinct hydrogeological regions, the Himalayan Mountain belt and the Gangetic alluvial plain. Uttarakhand is broadly divided into two subregions, Garhwal and Kumaon having a total of 13 districts. Uttarakhand’s 80% of the total area is hill-covered, and the rest falls under plains [47]. It has a total geographical area of 53,483 km2, and 65% of it is covered by forest [48].
Uttarakhand is a region quite rich in natural resources, especially water and forests, with many glaciers, rivers, dense forests, and snow-clad mountain peaks. It is blessed with rare biodiversity, including, 175 rare species of aromatic & medicinal plants, and major climatic zones, making it amenable to a variety of commercial opportunities in horticulture, floriculture, and agriculture [49]. It has vast tourism potential in adventure, leisure, and ecotourism. The Himalayan ecosystem of this region is unique and plays host to a large number of animals, plants, and rare herbs [50]. Because of the region’s particular terrain and its favourable climate conditions, agriculture continues to be the primary source of income for more than three-fourths of the State’s population. However, the region experiences a variety of climates, from tropical in the foothills to alpine in high altitude regions [27]. The monsoon season of Uttarakhand falls in JJAS and receives more than 70% of total annual rainfall. The average temperature range lies between 15 °C to 25 °C in most places, and the annual average rainfall varies between 500 mm to 1900 mm [51]. The rise in the temperature generally takes place in March, and the maximum temperature is observed from May to mid-June. During this time of the year, the mean maximum temperature in the southern Uttarakhand region ranges between 34 °C to 38 °C, and the mean minimum remains at 20 °C to 24 °C (https://www.imdpune.gov.in/library/public/Climate%20of%20Uttarakhand.pdf (accessed on 18 January 2022)).

2.2. Data

The precipitation, maximum, and minimum temperature data are obtained from CORDEX-SA (https://esg-dn1.nsc.liu.se/search/cordex/ (accessed on 9 December 2021)) and CRU (https://crudata.uea.ac.uk/cru/data/hrg/cru_ts_3.23/ (accessed on 9 December 2021)). There is a list of 10 CORDEX-SA RCMs used in this study (Table 1), where RCP 4.5 (moderate emission scenario) and RCP 8.5 (high emission scenario) [52] were used to calculate the multimodel mean or ensemble for precipitation and maximum and minimum temperature data. Each model is evaluated concerning the ensemble and observed datasets [31].
The CRU TS 3.23 version incorporates the monthly climatological variables, i.e., precipitation, daily maximum and minimum temperatures, cloud cover, and other variables, and the principal sources used for the routine updating of the CRU monthly climate archives come through the auspices of the World Meteorological Organization (WMO) in collaboration with the US National Oceanographic and Atmospheric Administration (NOAA), via its National Climate Data Center (NCDC) [53]. The series has an interpolation function for improving data discontinuities in regions with sparse observations from 1901 to 2017 [54]. The future was divided into two parts, namely MC and EC. CRU data are used to estimate the simulation model data at 0.5° × 0.5° grid-scale resolution from 1901 to 2017 [55] on the basis of an analysis of over 4000 individual weather station records.

2.3. Methods

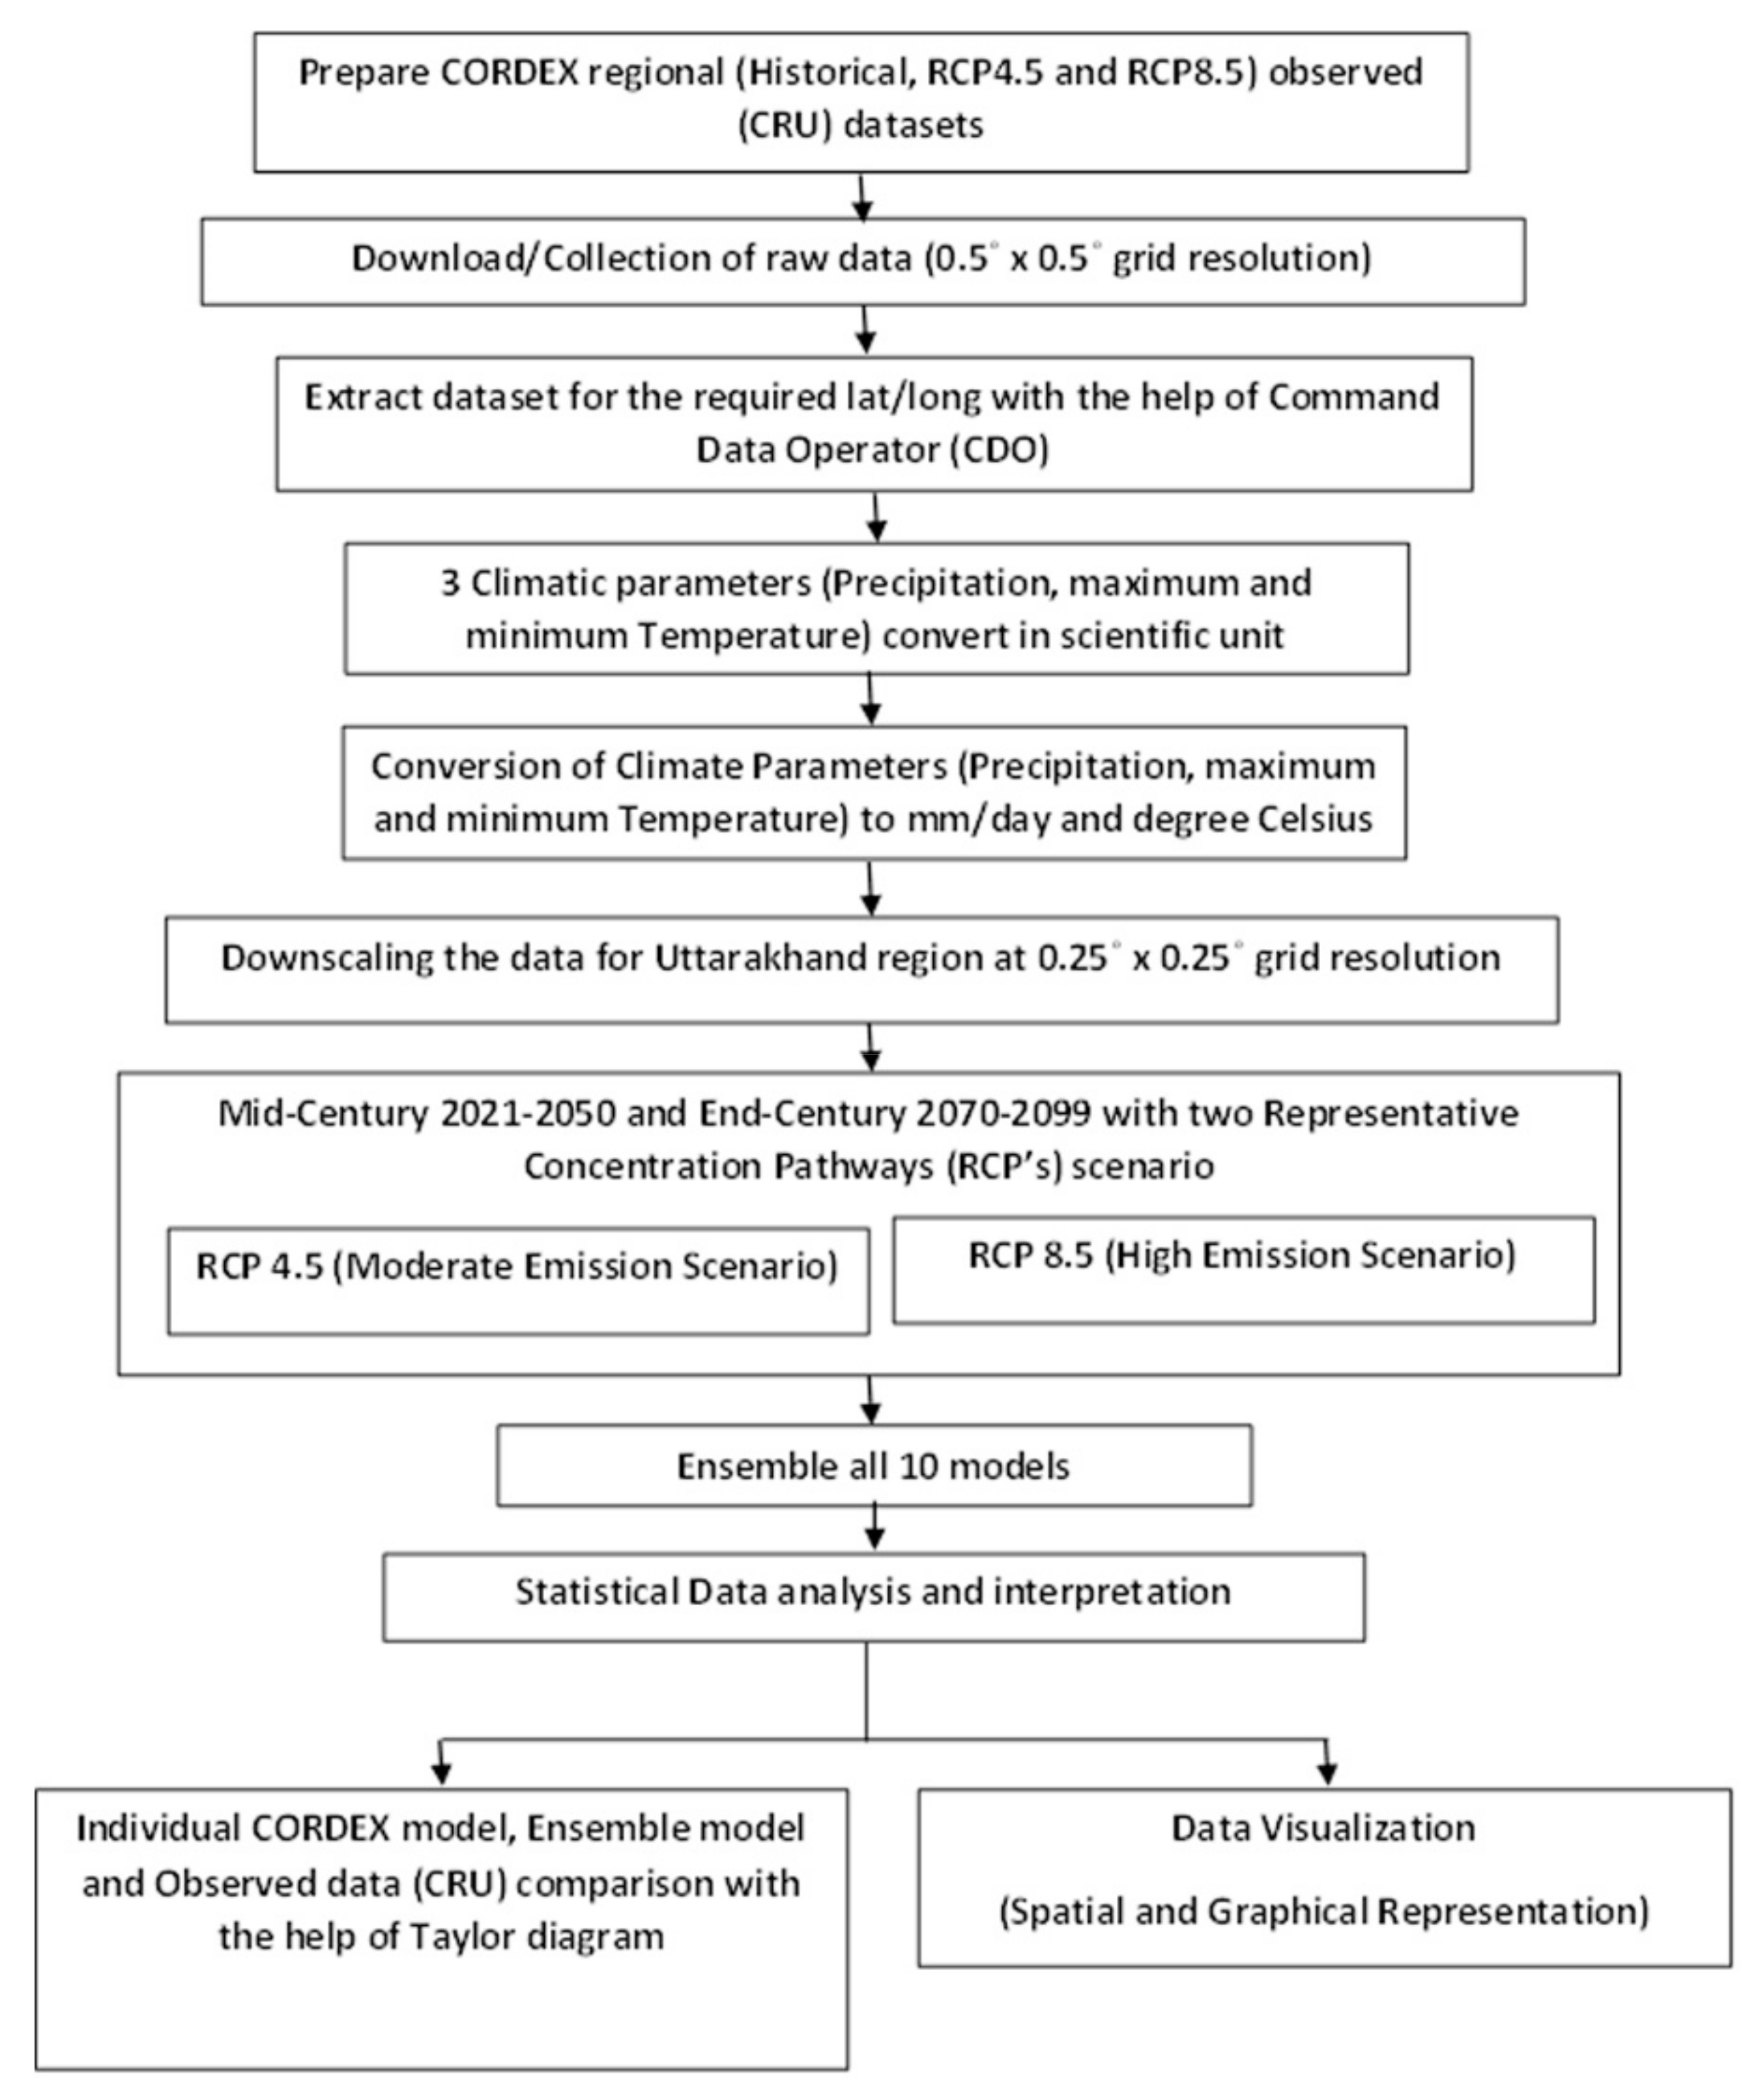
The annual average and seasonal data of precipitation and temperature are used in the study to evaluate future changes under the RCP 4.5 and RCP 8.5 scenarios [7,56] for 30 years of historical data. Each experiment is compared with CRU data as a reference for the historical period data. Periods 1976–2005 (historical), 2021–2050 (MC), and 2070–2099 (EC) were selected after bias correction of the CORDEX dataset (Figure 2). The various dataset used for this study had a spatial resolution of 0.5° × 0.5°, but for improving dataset quality downscaling, (Delta) methods [57,58] were processed, and the scale of the dataset improved to 0.25° × 0.25°.
The historical data (1976–2005) were used in model experiments as well as observational data to assess the spatial distribution of precipitation over the region. The comparison between the observed and model data over the region is made to examine the long-term and short-term spatial representation of two RCPs. An evaluation of multiple aspects of the model and various studies for model intercomparison is performed with the help of the Taylor diagram [59,60,61]. Taylor diagram is suitable and useful for valuing scalar quantities such as precipitation and temperature, but it is not suitable for vector quantities such as wind direction, etc. [62]. The diagram represents how closely each simulated model is related to the referenced or observed data. The representation of spatial projections for precipitation, maximum temperature, and minimum temperature, and also changes and variability of climatology towards MC and EC concerning the historical period, has been analyzed by graphical representation. The change factor is defined as the difference between the long-term (30-year) mean of a climate variable in the future and the historical period [7]. The study further analyzes seasons compared with the cumulative annual rainfall, including all seasons JF, MAM, JJAS, and OND, representing winter, pre-monsoon, monsoon, and post-monsoon, respectively.

3. Results and Discussion

3.1. Intercomparison of Historical Data (CRU and CORDEX-SA)

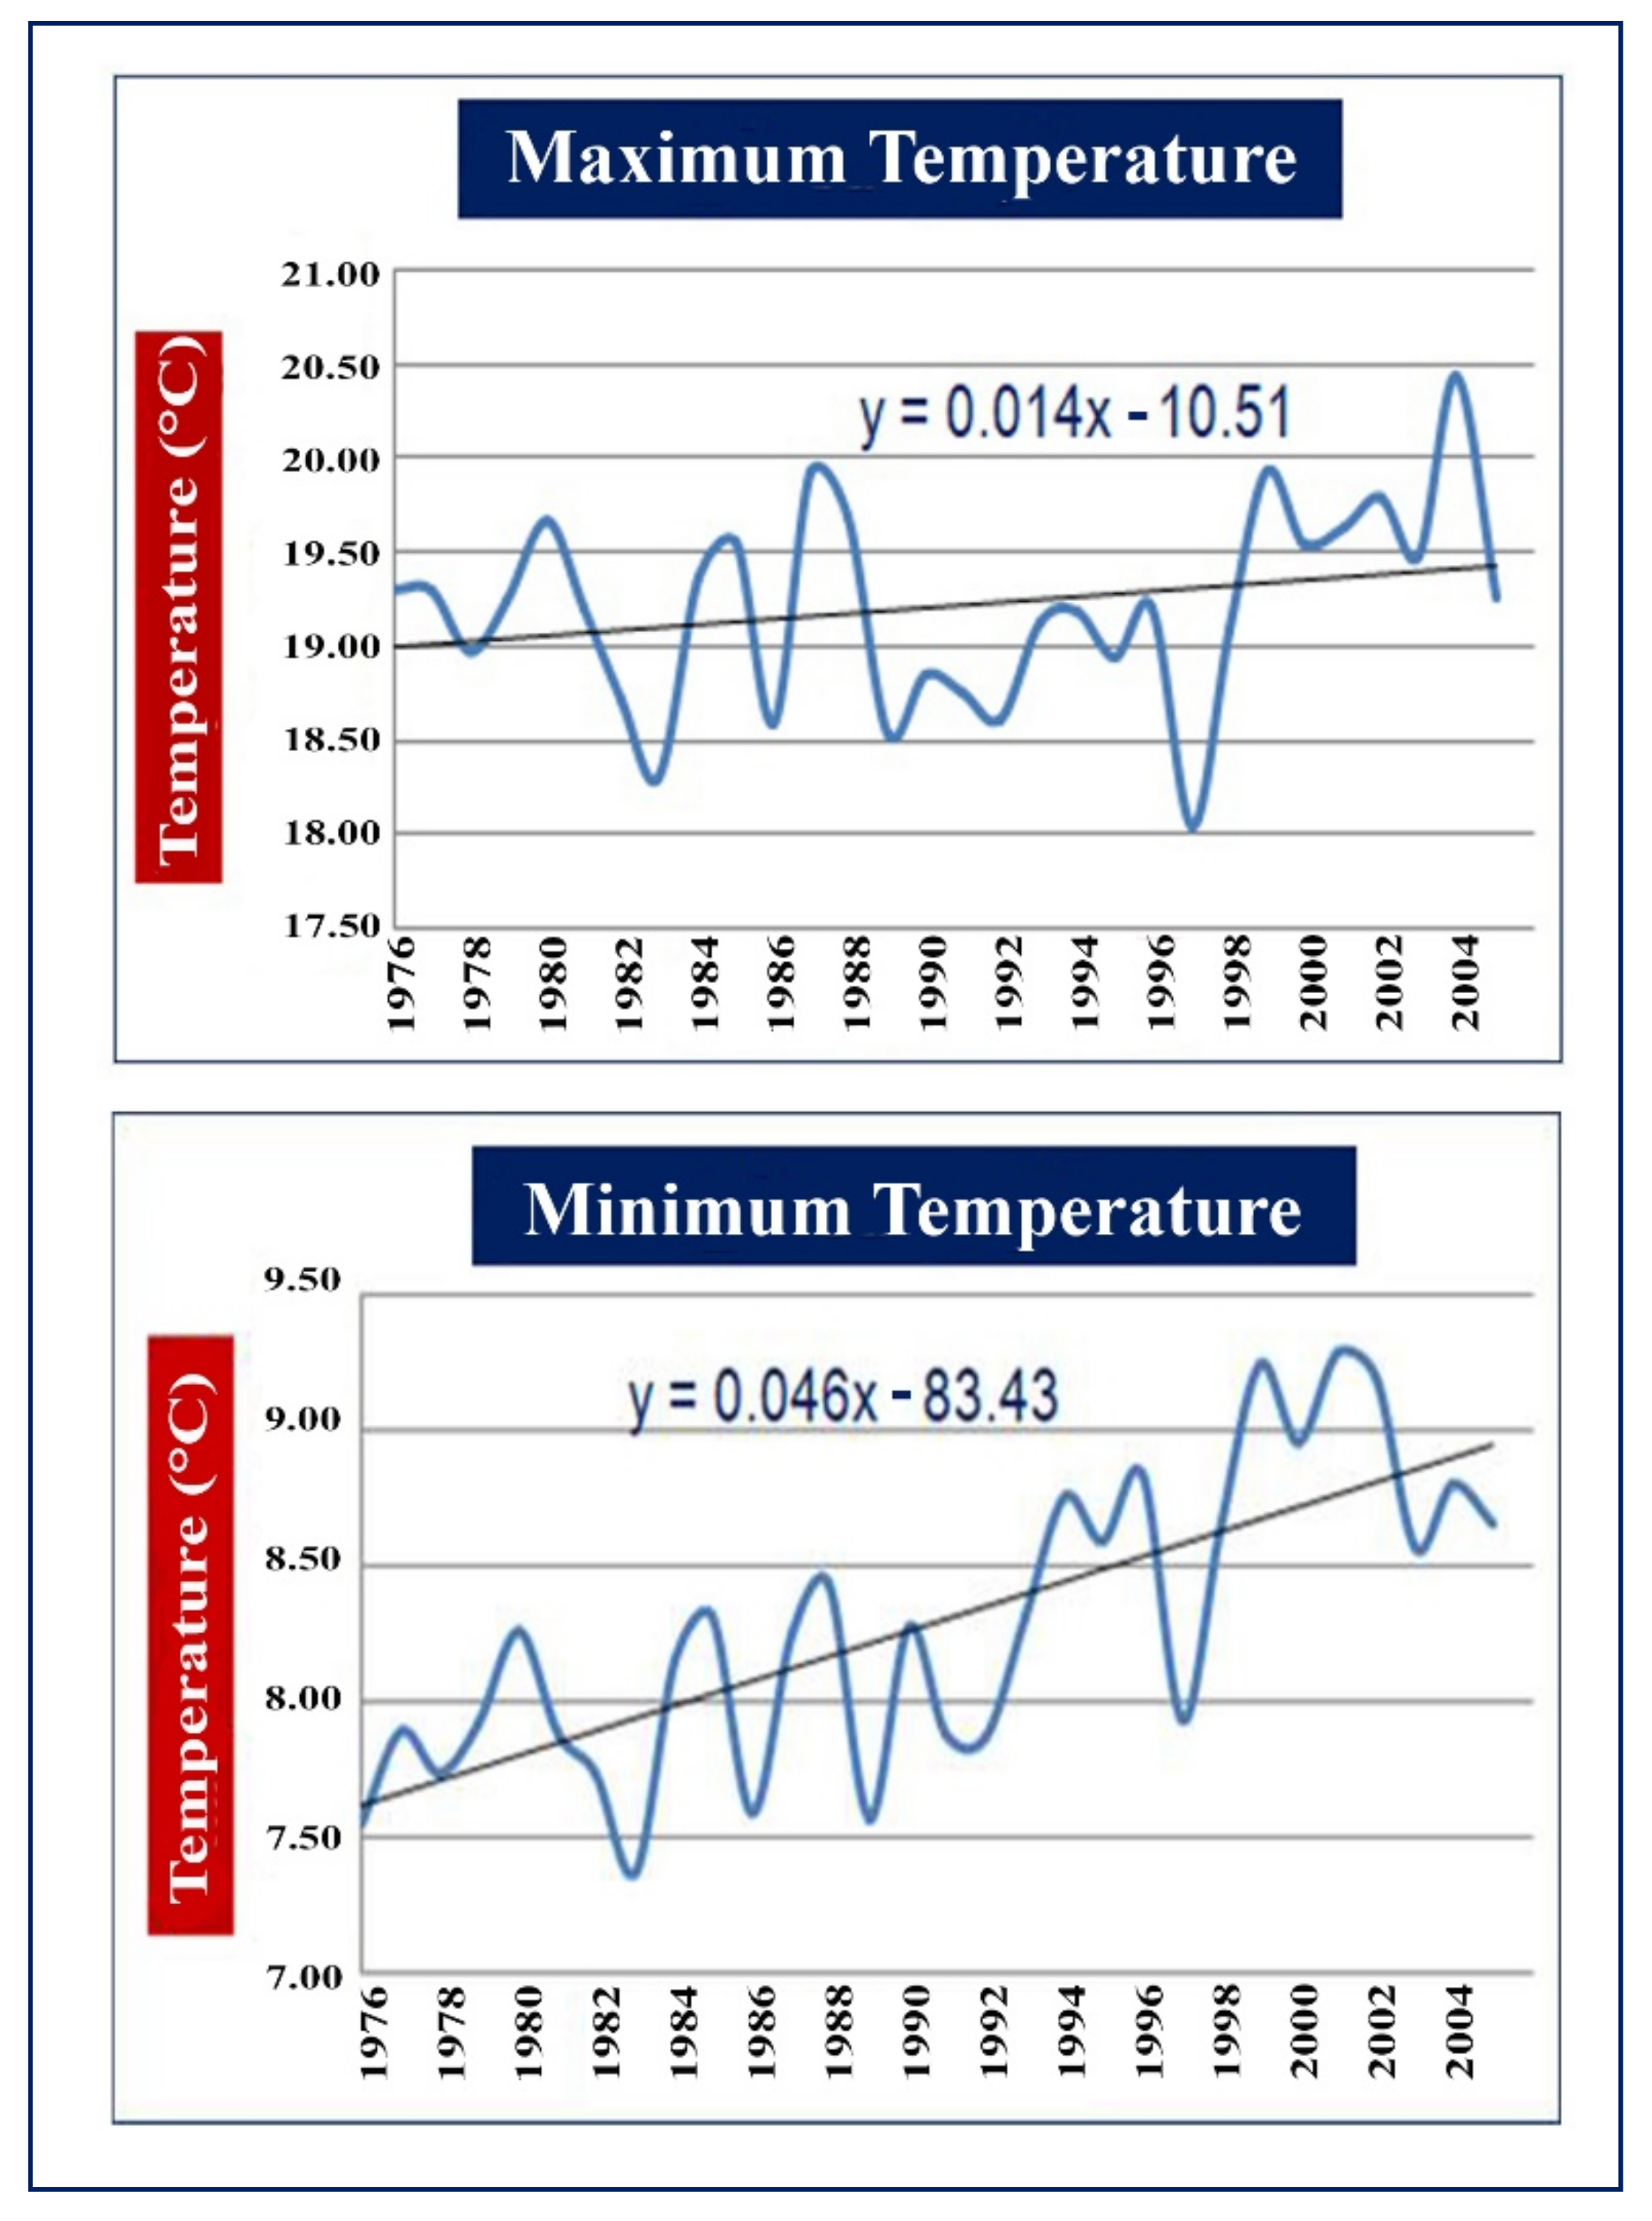
CRU maximum and minimum temperature are represented with a trend line in Figure 3. The range of average annual maximum temperature lies between 26.62 °C to 28.09 °C, and the average annual minimum temperature lies between 14.65 °C to 16.52 °C. The mean value of the maximum temperature is 27.57 °C, and the minimum temperature is 15.48 °C. The maximum and minimum temperature trend is positive, which represents the changing climate.
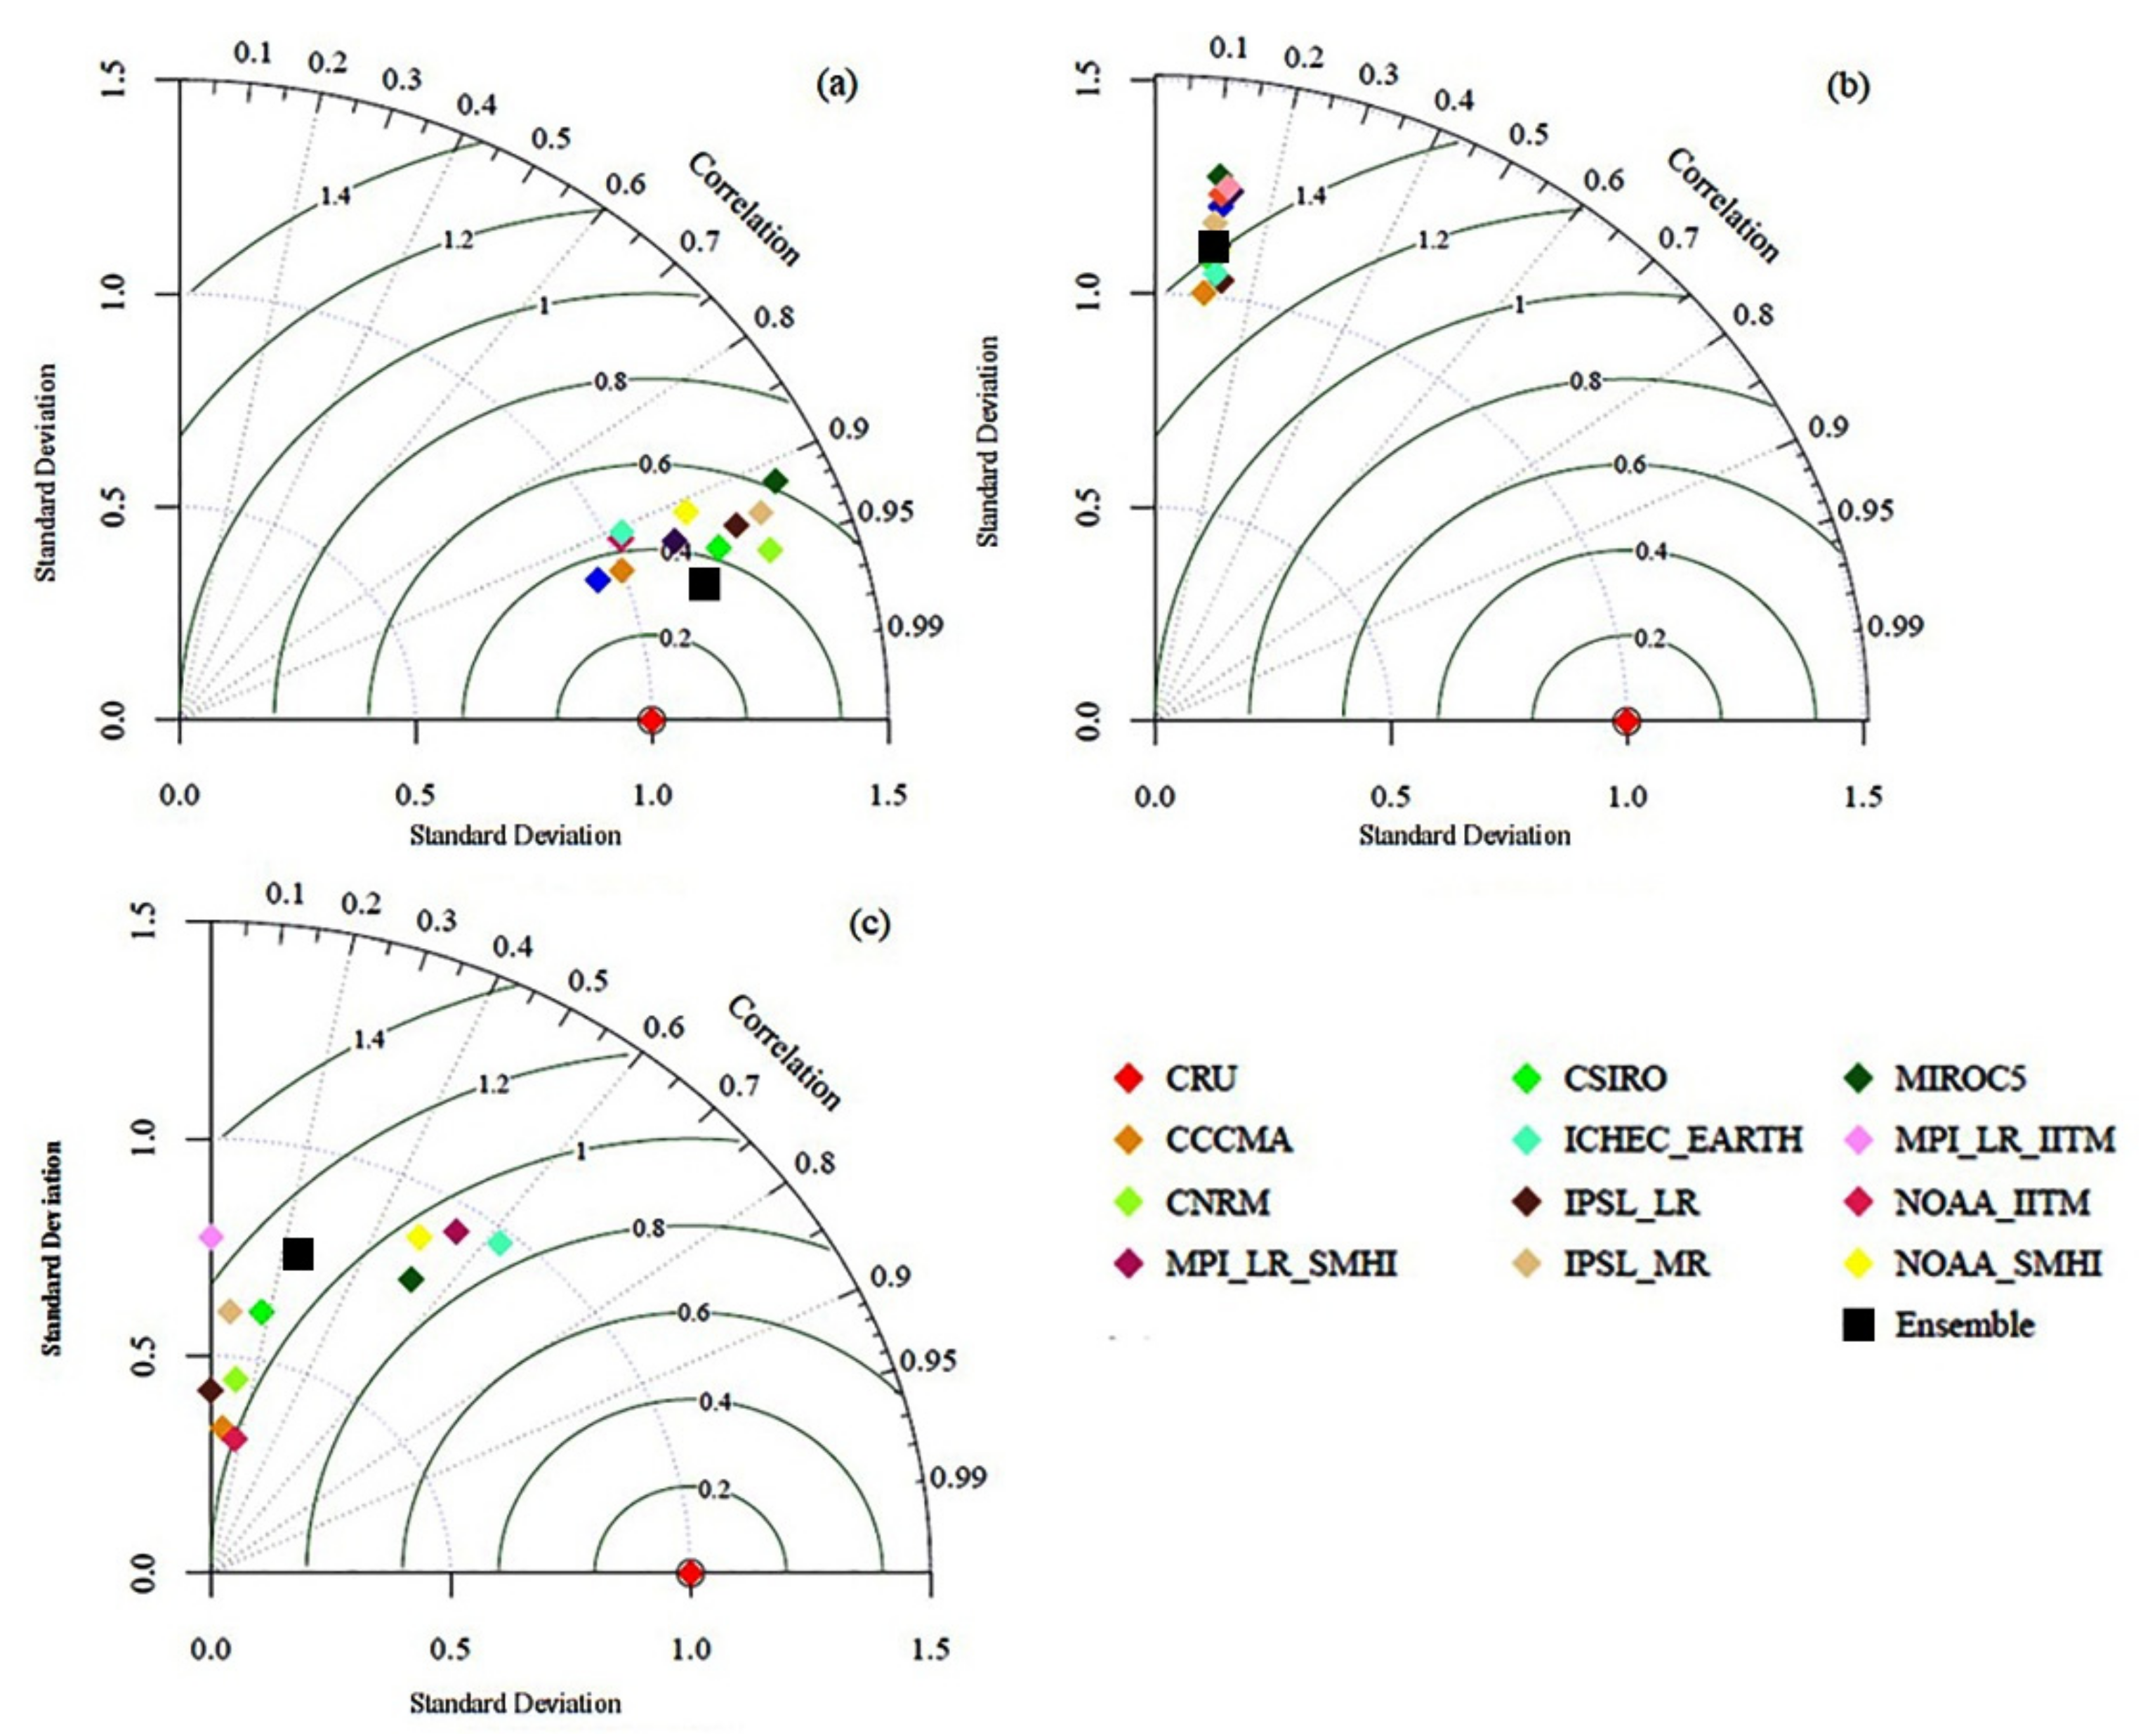
All CORDEX-SA experiments show an almost similar pattern concerning historical data of CRU in terms of correlation, standard deviation, and normalized root mean square difference for 30-year periods of precipitation and temperature (maximum and minimum) (Figure 4). In maximum temperature, IPSL_SMHI and MIROC5 show the highest correlation of 0.96 to CRU compared with other models, but their standard deviation value is higher compared with CRU and other CORDEX models, with correlation values between 0.87 to 0.97 with CRU. The ensemble of the experiment shows a correlation value of 0.97, and the standard deviation is ~0.3. In minimum temperature, all CORDEX models have a very close correlation with the ensemble model, the standard deviation is between 0.9 to 1.3, and the normalized RMSE difference for all models is ~1.4 with CRU observation. The low correlation of the minimum temperature compared with the maximum temperature may be due to the high cold bias for the annual minimum temperature for the models and ensemble (especially in winter, i.e., DJF) in the case of the Himalayan region [63]. Such a phenomenon is more prominent with the minimum temperature compared with the maximum temperature at higher altitudes. In precipitation, the statistically normalized precipitation shows that ICHE-EARTH (~0.84), MIROC5 (~0.85), and MPI_LR_SHMI (~0.86) have the highest correlation with CRU. MPI_LR_IITM and ensemble model has the highest standard deviation and low normalized RMSE difference.

3.2. CORDEX-SA and Future Projections

3.2.1. Annual Projections

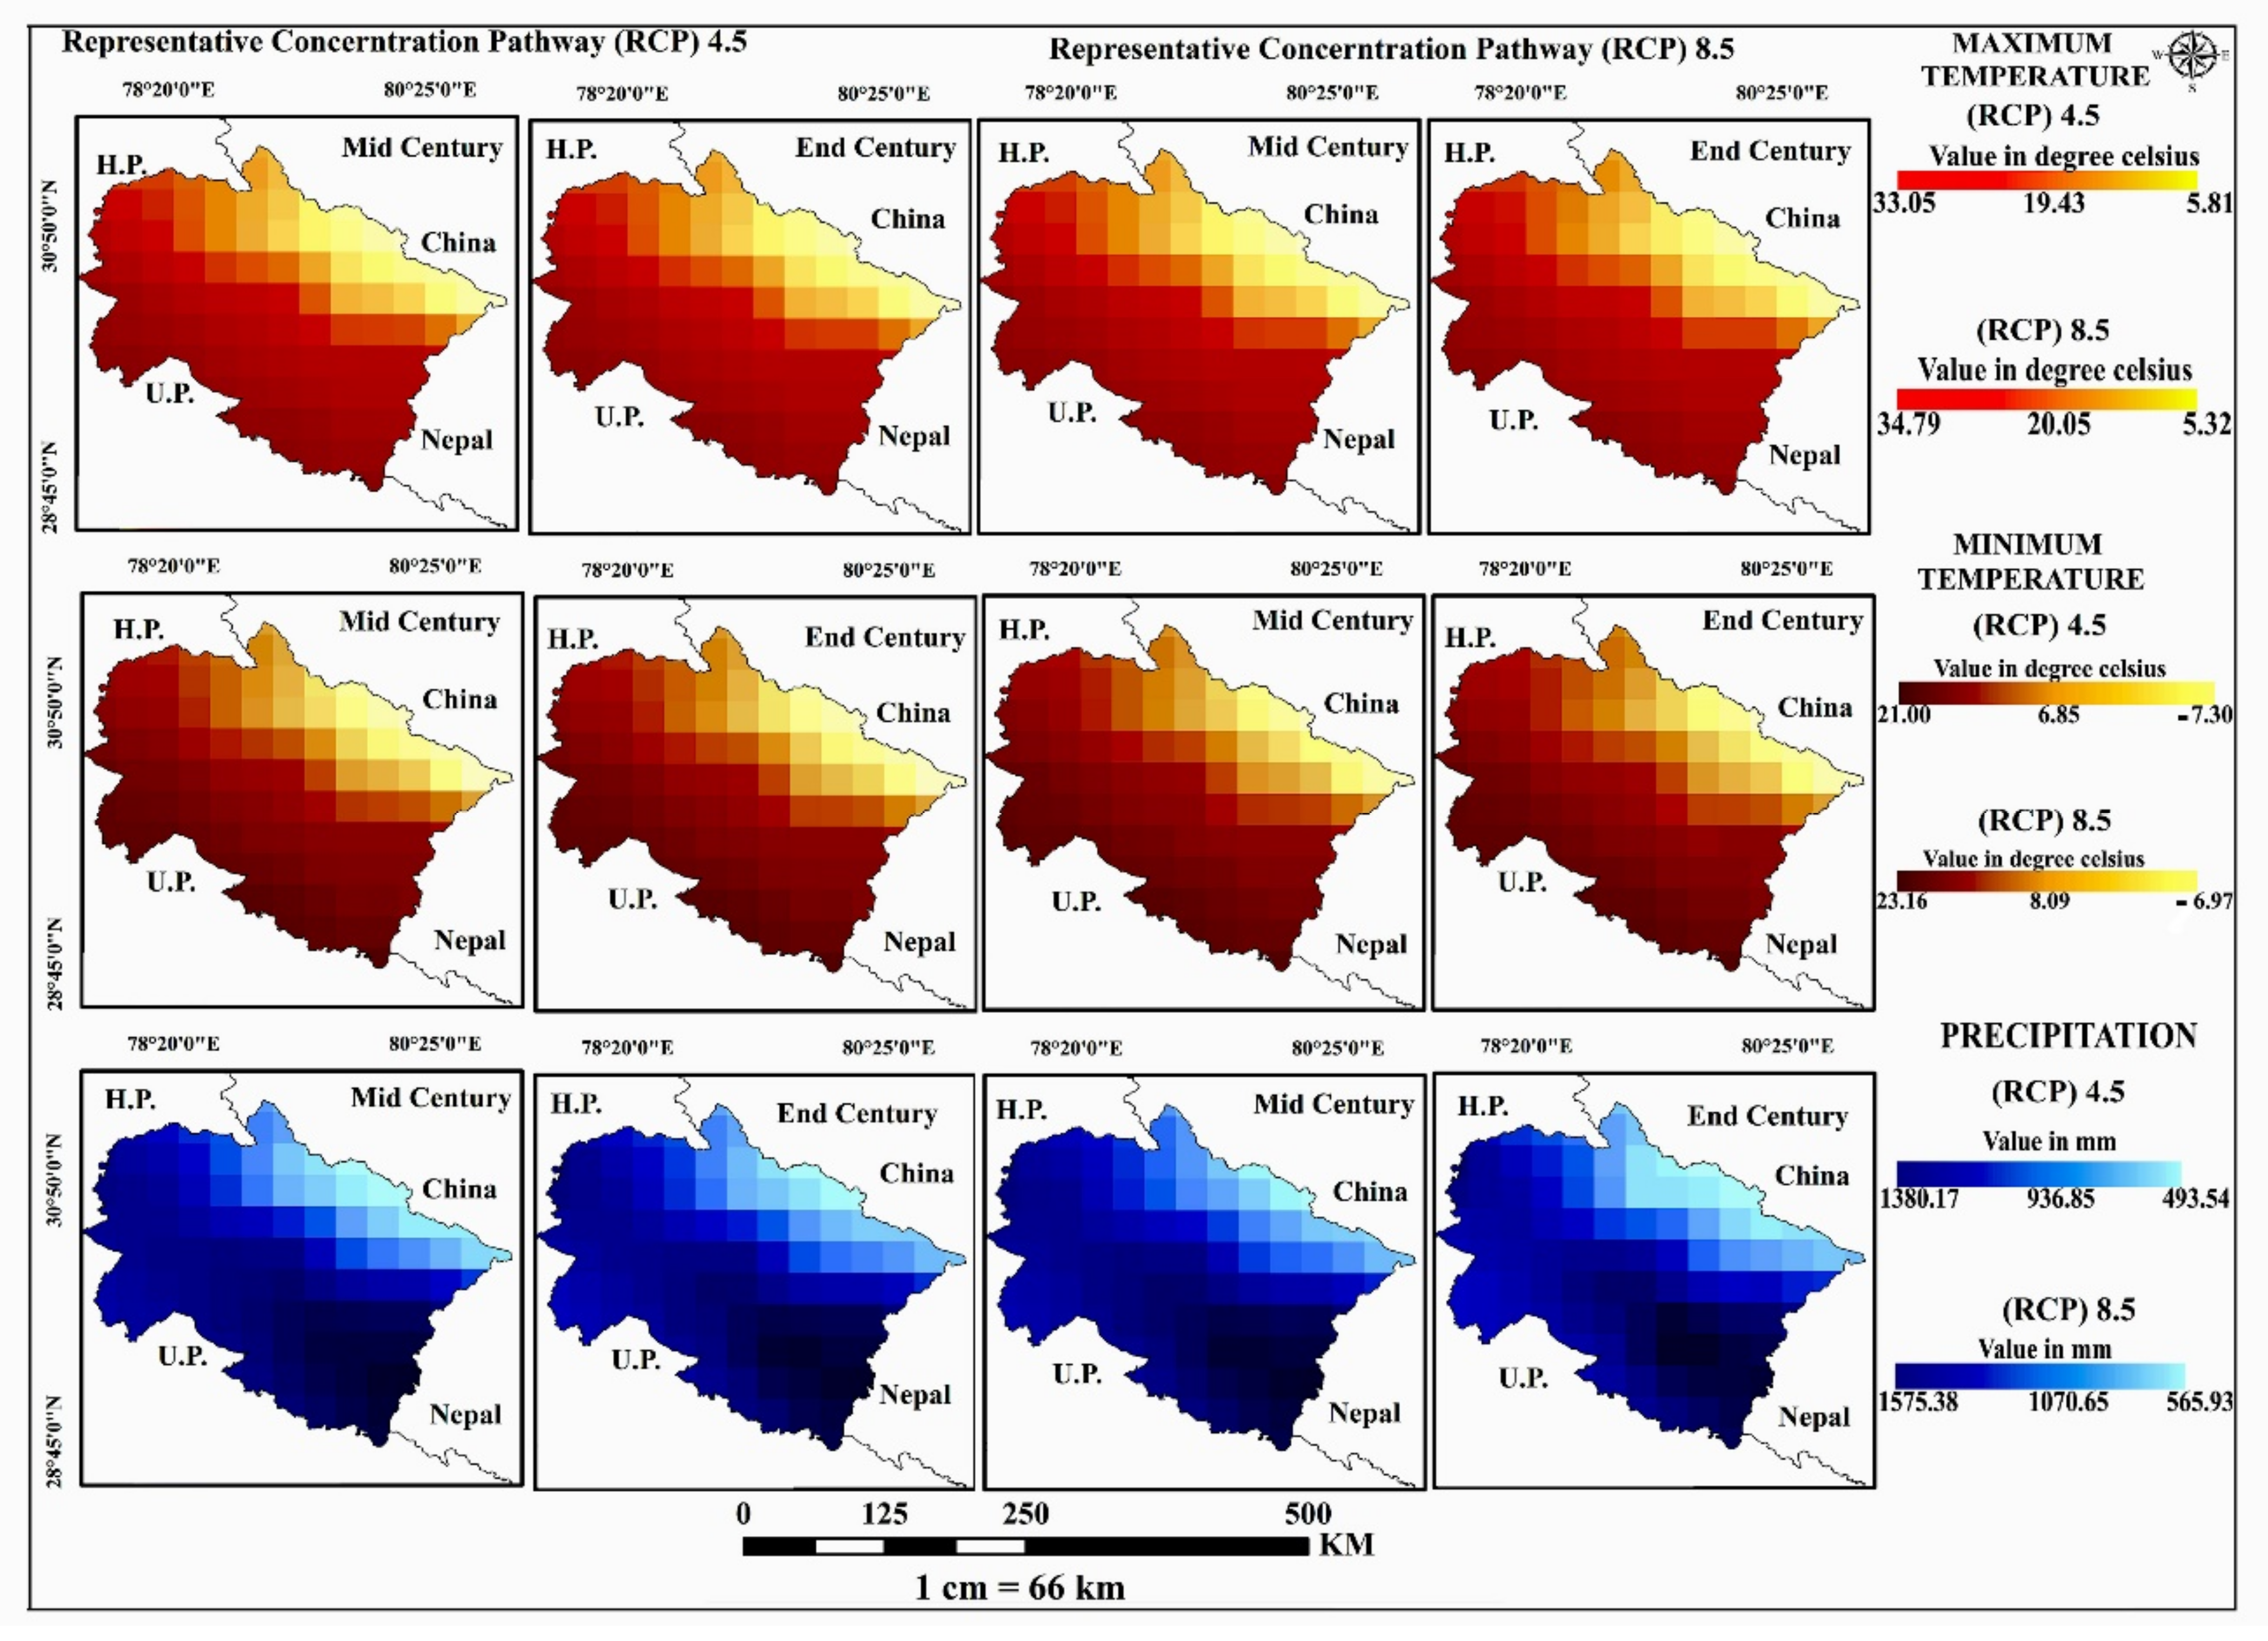
The CORDEX-SA models are reasonably effective in simulating the annual average precipitation and temperature over the Uttarakhand region. The model projections indicate that an increase in temperature and precipitation will occur throughout the whole region at the end of the 21st Century. Figure 5 shows projection through the spatial representation of annual precipitation and temperature (maximum & minimum) towards mid-century to the end of the century for both emission scenarios (RCP 4.5 and RCP 8.5). For the mid-century, the annual average maximum temperature is projected to increase by about 1.38 °C in RCP 4.5 and 1.45 °C in RCP 8.5, while for the end of the century, 2.30 °C in RCP 4.5 and 5.49 °C in RCP 8.5 increase is projected. The annual average minimum temperature has increased to 1.30 °C in RCP 4.5 and 1.58 °C for a mid-century, while for the end of the century, 2.47 °C in RCP 4.5 and 5.86 °C in RCP 8.5 increase is projected. Annual average precipitation for mid-century is projected to decrease by 5.92% in RCP 4.5 and increase by 2.38% in RCP 8.5, while for end-century, 5.97% increase in RCP 4.5 and 15.89% increase in RCP 8.5 is projected.

3.2.2. Seasonal Projections

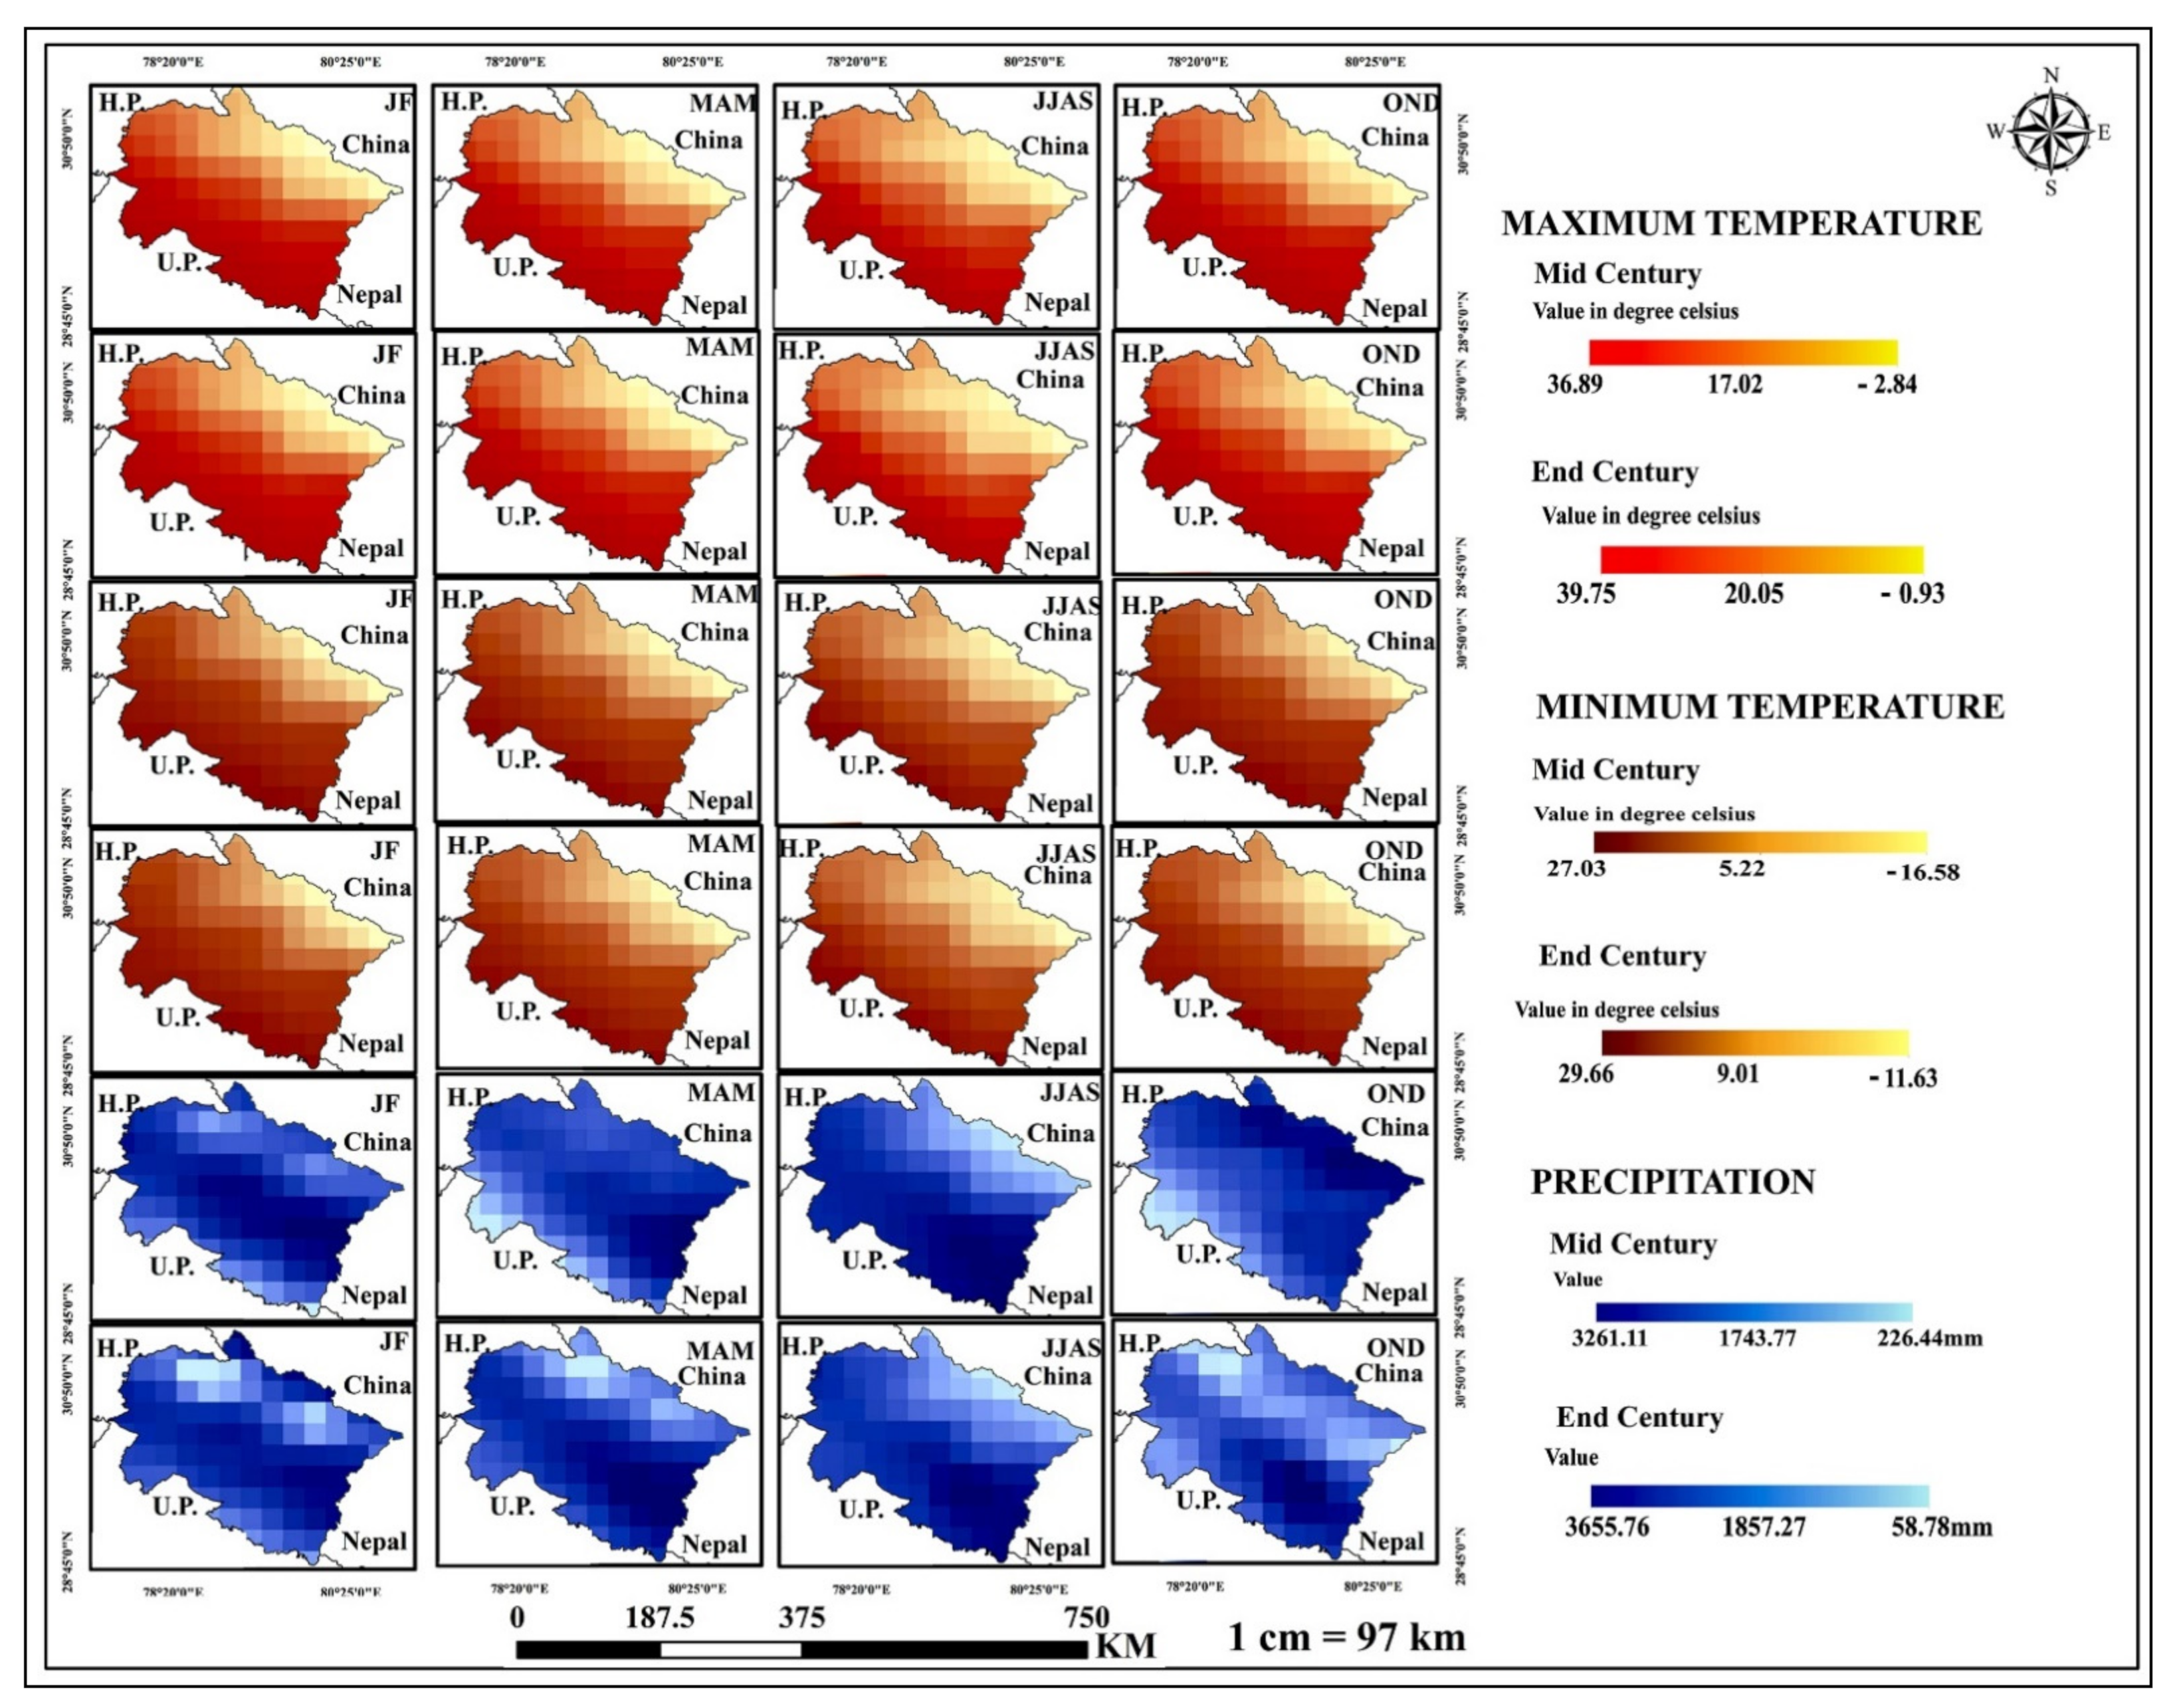
In RCP 4.5 and RCP 8.5 scenarios, the spatial representation of projected seasonal precipitation, maximum temperature, and minimum temperature of multimodel ensemble RCM for Uttarakhand are shown in Figure 6 and Figure 7, respectively. In this study, seasonal months of JF for the winter season, MAM for pre-monsoon, JJAS for monsoon, and OND for the post-monsoon season have been selected for future seasonal analysis. In Table 2, the precipitation in the monsoon and winter seasons increased from MC to EC in both emission scenarios. Pre-monsoon precipitation has also increased in MC, but precipitation in EC decreased. Post-monsoon rainfall will decrease from MC to EC in both RCP 4.5 and RCP 8.5. As per the evaluation, observation shows that maximum temperature (all seasons) will increase from MC to EC for both emission scenarios, while the maximum temperature in monsoon season will increase more compared with pre-monsoon. The combined results for the minimum temperature show that projected warming lies between 0.23 °C to 0.47 °C from MC to EC in RCP 4.5 and RCP 8.5. According to analysis, warming is going to increase more in seasonal temperatures for Uttarakhand at the end of the century from the current temperature.

3.3. Variability of Projected Annual Precipitation and Temperature

In general terms, we define climate as average weather, but in a more narrow, statistical terminology, the climate is referred to as the mean and variability of relevant quantities such as temperature and precipitation, over a period of thirty years where averaging of these variables is analyzed, as defined by the World Meteorological Organization. Climate variability is variation in climate parameters in the form of the mean state, i.e., standard deviation, statistics of extremes, etc., on all temporal and spatial scales beyond individual weather events. Variability may be due to natural internal processes within the climate system (internal) or to variations in natural (e.g., solar and volcanic) external forcing (external).

3.3.1. Precipitation Changes

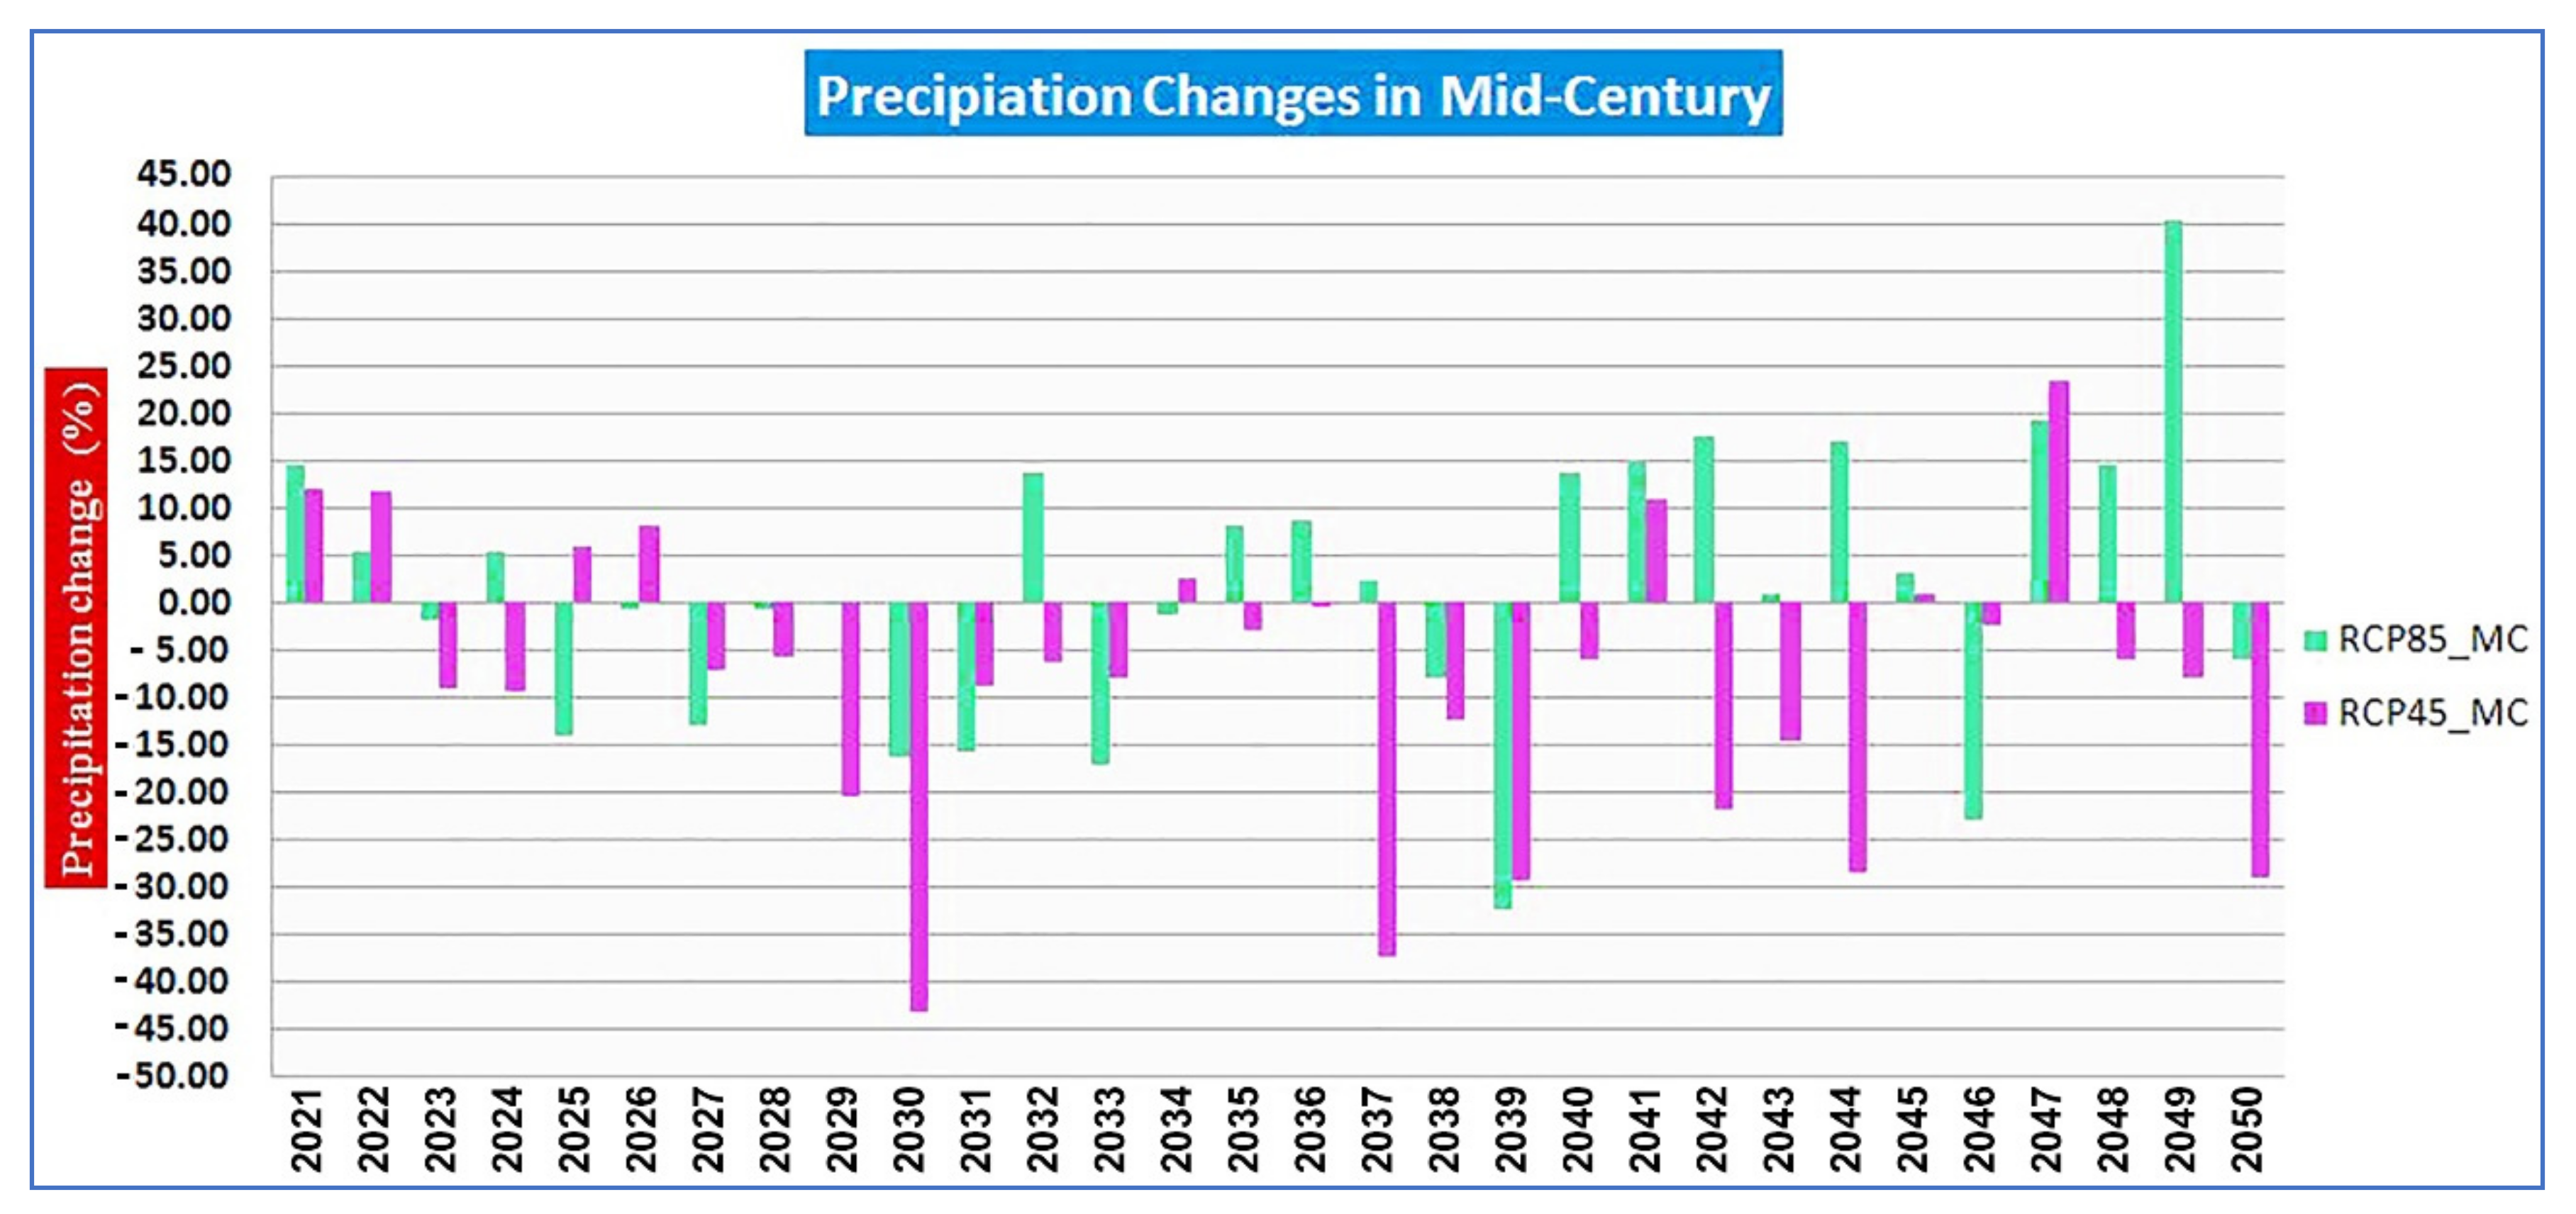
Projected percentage change in annual rainfall in ensemble CORDEX-SA model simulations from the historical period (1976–2005) to the MC (2021–2050) and the EC (2070–2099) are depicted in Figure 8 and Figure 9, respectively, and Table 3 shows the range of change.
Average annual rainfall for the RCP 4.5 scenario is projected to decrease marginally by about 5.92% towards mid-century and increase by about 5.97% towards the end of the century, while for IPCC AR5 RCP 8.5 scenario, it is projected to increase by about 2.83% towards mid-century and 15.89% towards the end of the century for the State. Thus, the percentage of the projected rainfall increase is very low for MC and EC in both climate scenarios.
The average annual rainfall of Uttarakhand State is 1432.2 mm, with a range varying from 327.8–3673 mm over the 63 years (1951–2013). Amongst all districts, Pithoragarh receives the maximum average annual rainfall, while Pauri Garhwal receives the least.

3.3.2. Temperature (Maximum & Minimum) Changes

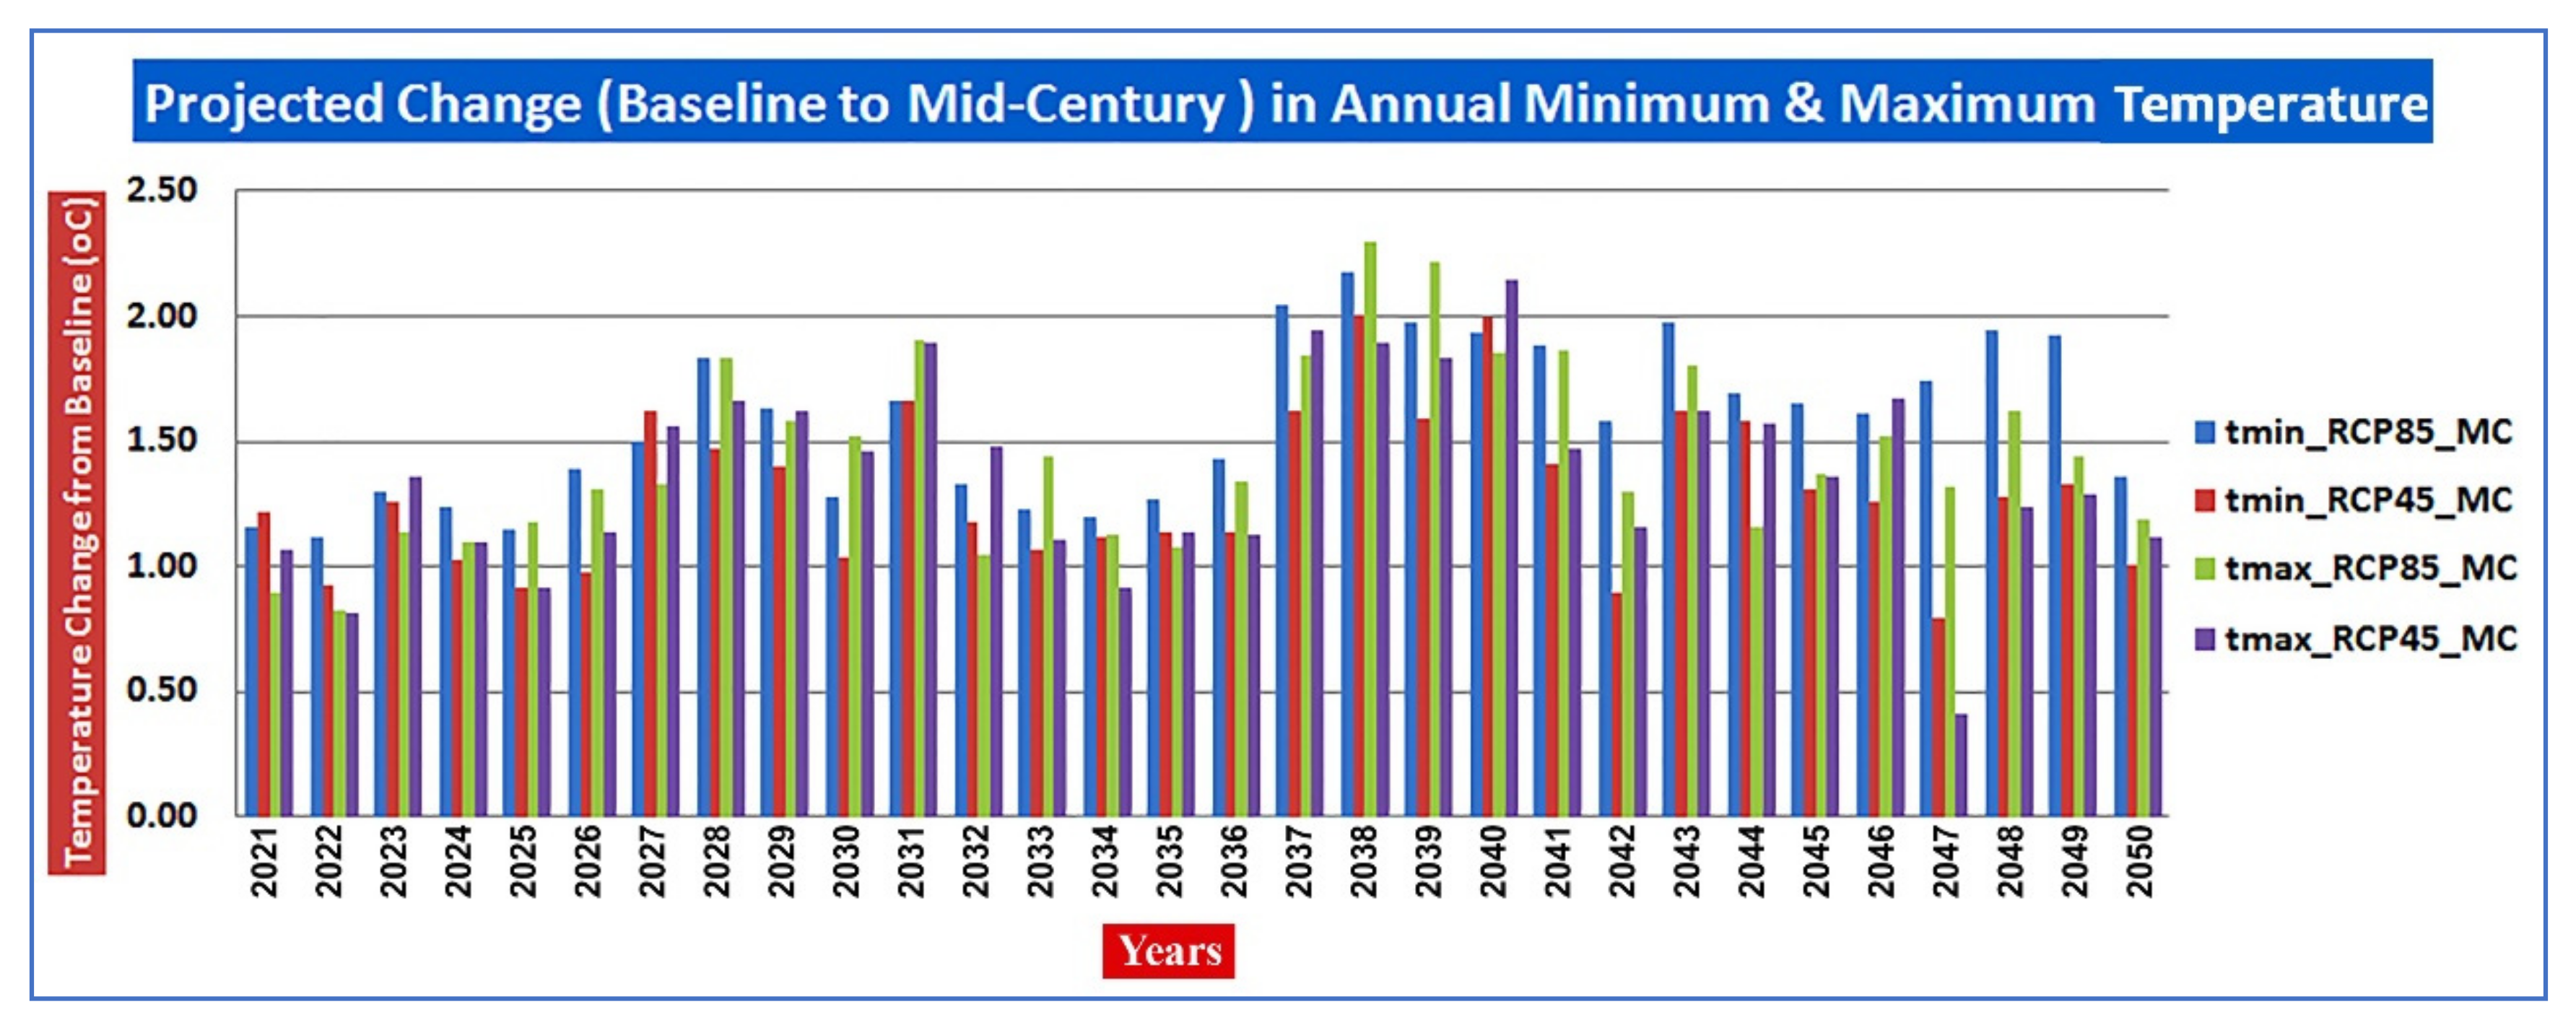
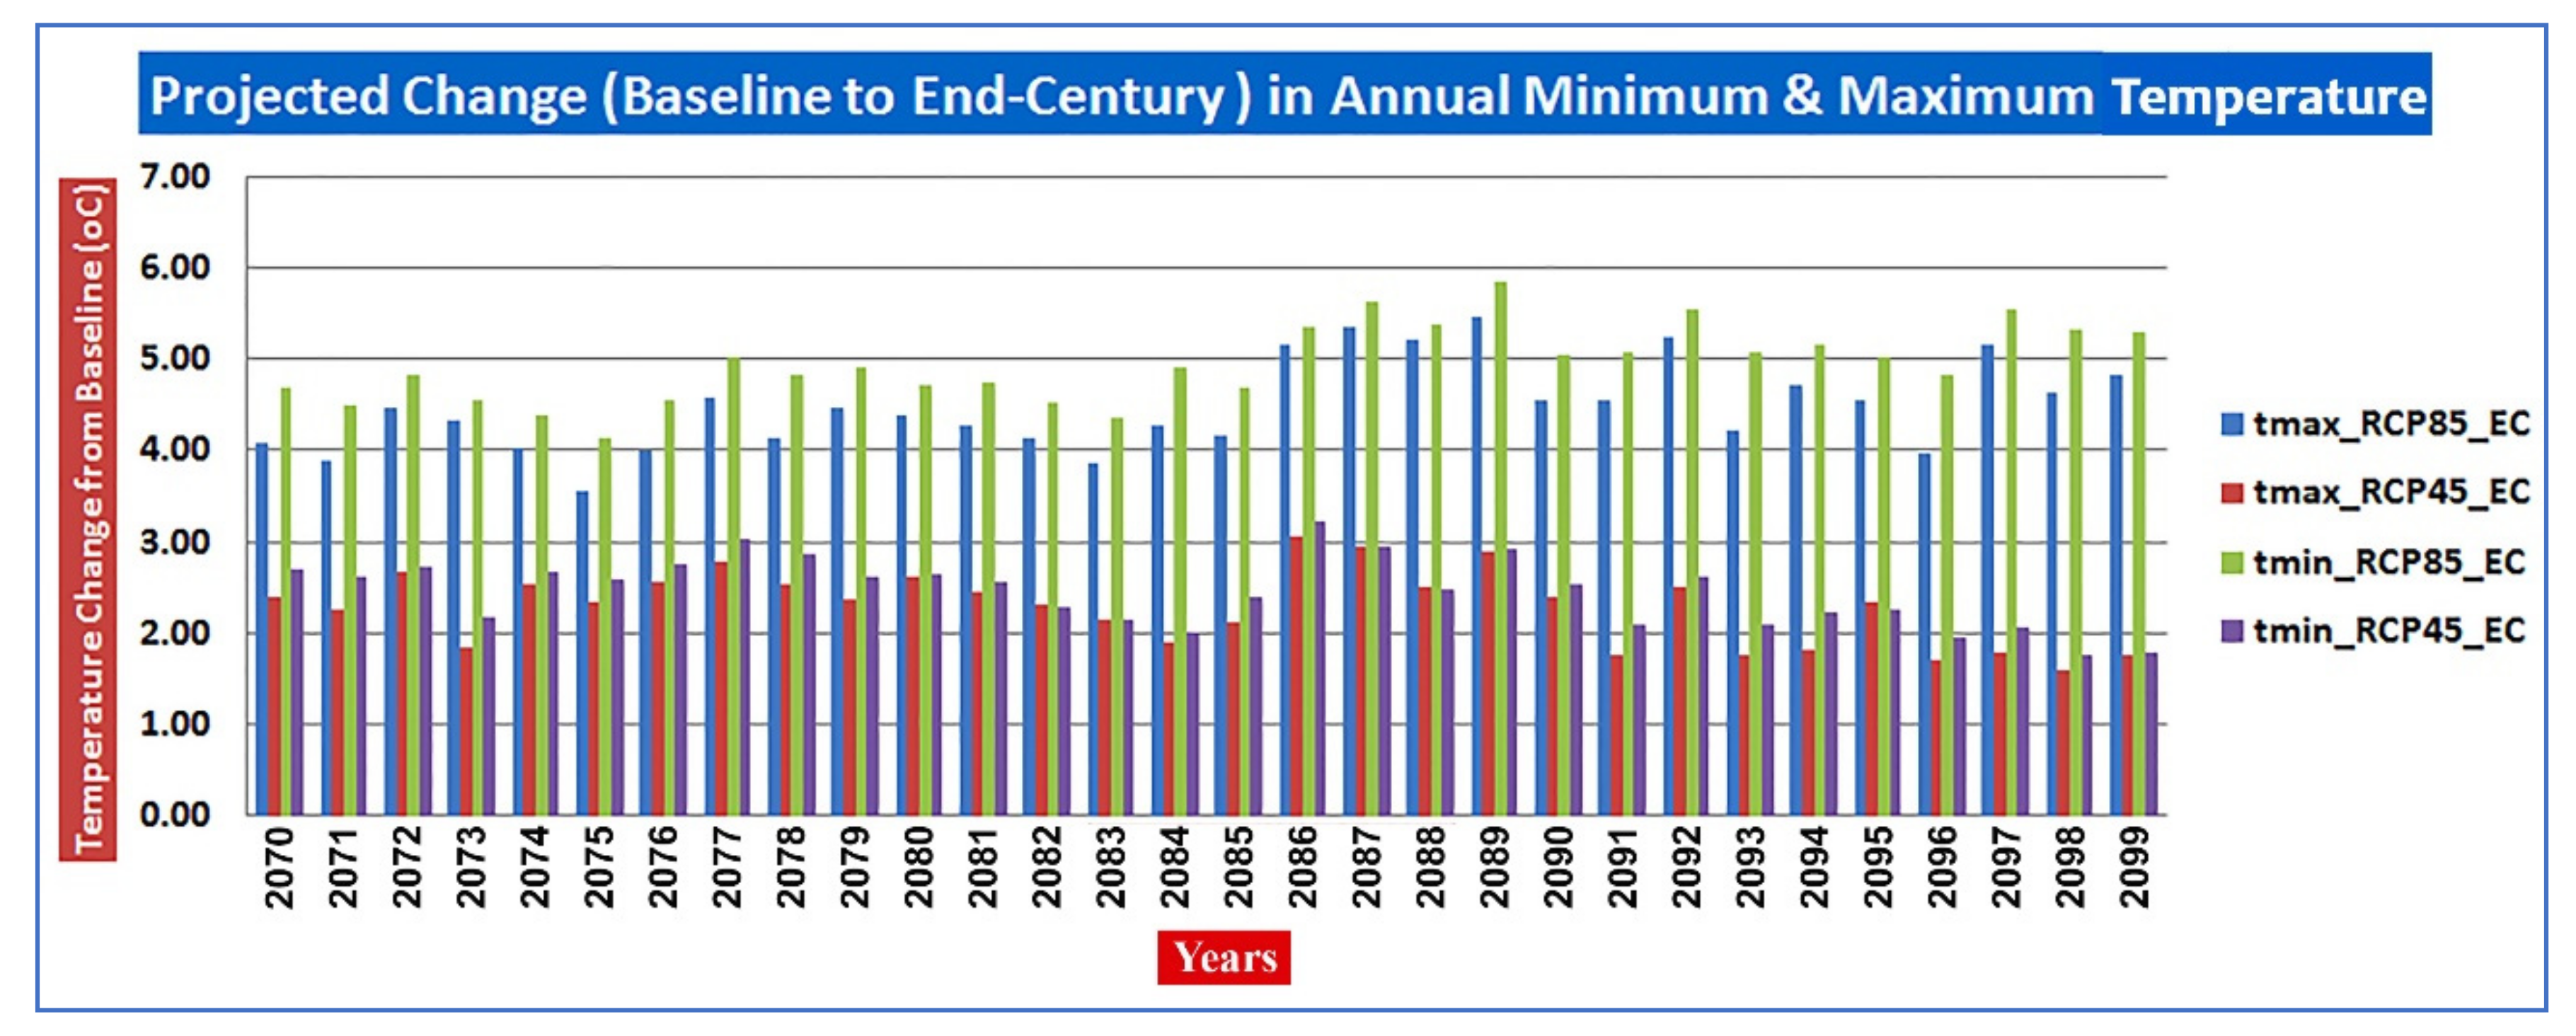
The projected change in the temperature for the same time frame and the CORDEX-SA runs are shown in Figure 10 and Figure 11, respectively, and Table 4 shows the range of change. Both figures show the temperature for moderate emission scenarios (RCP 4.5) and high-emission scenarios (RCP 8.5) from MC to EC. As time passes, the temperature is projected to rise by 0.13 °C to more than 5 °C. As per the analysis, the maximum warming is projected for the Uttarakhand region, and the minimum temperature will be increasing instead of the maximum temperature. For the near future (2021–2050), the warming is projected to be from 0.42 °C to 2.16 °C in RCP 4.5 and from 0.83 °C to 2.30 °C in RCP 8.5. For the far future (2070–2099), 1.60 °C to 3.25 °C temperature increase in RCP 4.5 and 3.57 °C to 5.86 °C temperature increase in RCP 8.5 scenario is projected, which would be quite threatening to the entire region.
There will be significant positive trends in temperature change for the majority of Uttarakhand in the RCP 4.5 and RCP 8.5 scenarios, both MC and EC. Thus, there is a warming up scenario for the State of Uttarakhand. However, towards the EC, for the IPCC AR5 RCP 4.5 scenario, these indices start stabilizing, showing no significant trends for Uttarakhand.

4. Discussion

The comparison shows a similar pattern and significant statistical results between CORDEX-SA and CRU data for Uttarakhand. It is known that CORDEX-SA models are unable to simulate the daily parameters such as precipitation [64], and therefore, for the Uttarakhand case, we used the monthly CORDEX-SA data. Many studies have revealed different facts on the performance of the CORDEX-SA dataset [65,66,67]; however, a study focused on Uttarakhand as a domain was needed to track the change in important parameters such as precipitation and maximum and minimum temperature. The CORDEX-SA in this study shows the increase in annual temperature and precipitation at the end of the 21st century. It is found in agreement with the earlier studies completed for the larger domain of the Himalayas [31,63,66].
Districtwise analysis of the obtained results shows that northward districts of Uttarakhand, namely Uttarkashi, Bageshwar, Chamoli, Rudraprayag, and Pithoragarh, show the highest projected maximum temperature and rainfall increase towards EC, while districts in the south and southwest namely, Nainital, Hardwar, etc., show the lowest projected maximum temperature and rainfall increase towards EC for both IPCC AR5 RCP 4.5 and RCP 8.5 scenarios. Such changes, especially in temperature, are well identified in the recent past to know the reason behind the shifting of apple orchards to a higher altitude in the Himalayas [13].
The projected increase in minimum temperature towards MC and the EC does not show significant variation across the districts of Uttarakhand for both IPCC AR5 RCP 4.5 and RCP 8.5 scenarios. However, the projected increase in minimum temperature toward EC varies from 4.6 °C in Bageshwar to 5.1 °C in Chamoli district for the IPCC AR5 RCP 8.5 scenario. Therefore, the lower line of the temperature, i.e., the minimum temperature, remains relatively stable, and the continuous increase in the upper limit of diurnal temperature represented by maximum temperature is of serious concern [68,69].
The relationship between the increase in temperature and the consequent extreme rainfall has been analyzed over different regions [70]. An increase in temperature along with rainfall will lead to soil erosion and land degradation, and most importantly, the retreat of the glaciers will be another issue [71]. All the districts except Champawat show the projected increase in annual rainfall towards EC. Southern districts of Uttarakhand, namely Udham Singh Nagar, Champawat, and Nainital, show the projected decrease in annual rainfall towards the MC and EC for the IPCC AR5 RCP 8.5 scenario. Almora, Dehradun, Pauri Garhwal, and Nainital show a negative trend in annual rainfall. The decrease in the rainfall in the lower Himalayas can be attributed to the increase in anthropogenic activities such as industrialization, intense agriculture, and deforestation, leading to land use and land cover change caused by the high demand for land resulting from the increase in the population [72,73,74,75,76].
The increase in the minimum temperature in RCP 8.5 at the end of the mid-century (especially in the decade 2041–2050) is found to be very high compared with the RCP 4.5. The difference between the increase in the maximum temperature of RCP 8.5 and RCP 4.5 is relatively less compared with the increase in the minimum temperature. Continuous increases in the minimum and maximum temperatures, along with the sharp increase in minimum temperature, will be a serious concern for mountainous regions such as Uttarakhand. The state has a lot of huge glaciers in the high altitudinal regions, and an increase in temperature in the near future may lead to water scarcity for the population due to a decrease in the glacial cover, which provides water for the perennial rivers. Interestingly the significant difference between RCP 8.5 and RCP 4.5 in the increase in temperature at the end of the century is an alarm to adopt the mitigation measures and reduce the anthropogenic intervention with nature. The increase of more than 4 °C (RCP 8.5) in EC looks like the most severe situation; however, the magnitude of increase in the minimum temperature (RCP 4.5) is projected to decrease when it visibly enters the second wave after the year 2086.
As far as the precipitation is concerned, it will increase (RCP 8.5) at the MC, and the majority of the cases with RCP 4.5 shows a relative decrease in the rate of increase in the annual precipitation. However, at the end of the century, in RCP 8.5 and RCP 4.5, precipitation will keep increasing. Therefore, a continuous increase in the precipitation along with the rising minimum and maximum temperature could be highly disastrous for the economy, biodiversity, and various social aspects of the Uttarakhand.
It is a common understanding that all the sectors of the economy are interconnected with each other and changing climate will impact them in the future. The most sensitive sectors of the economy to face the harsh impact of the rising temperature and precipitation in Uttarakhand are the agriculture and tourism sectors. Projections show that the increase in the minimum temperature along with the maximum temperature and the gradual decrease in the difference between the maximum and minimum temperature will lead to an increase in the extreme weather events with a rise in total precipitation, which will be responsible for the endangerment of the livelihood security of the rural population dependent of agriculture. The vulnerability of Uttarakhand to the disasters such as landslides, cloud bursts, and flash floods may take a considerable toll on the state’s economy, and it will also be directly responsible for the significant damage to human health.

5. Conclusions

The complex topography of the Uttarakhand region makes it difficult to analyze precipitation and temperature over the region. The study has examined the change in annual average precipitation and annual average temperature and incurred seasonal spatial projections for winter, pre-monsoon, monsoon, and post-monsoon seasons. It provides temperature and precipitation projections for Uttarakhand based on 10 individual RCMs, and CORDEX-SA for two RCP (RCP 4.5 & RCP 8.5) scenarios for the two short-term (2021–2050) and long-term (2070–2099) periods. CRU is used as observation or reference datasets for comparison because of its ability to measure precipitation and temperature patterns over the Uttarakhand region due to the inclusion of mountain slope and elevation. The ensemble mean shows that the climate model is closer to the observed or referenced data compared with any individual models. For this study, a Statistical analysis is conducted with the help of the Taylor diagram to identify the models’ correlation and distance of models with reference datasets over the region. It is observed that the annual average maximum and minimum temperatures may likely increase by more than 5 °C, whereas the projected change in precipitation lies between 23% to 40% concerning the historical period data towards the end of the 21st century for both RCP scenarios. Such a sharp increase may impact the biodiversity and livelihood of the people significantly by the end of the century. In the RCP 4.5 scenario, a decrease in the annual average precipitation of 5.92% in MC and an increase of 5.97% in EC is obtained. In contrast, RCP 8.5 precipitation is found to increase from 2.83% to 15.89% towards the MC and the EC. Such a trend and pattern of precipitation in relation to changing temperature may be detrimental to many sectors of the economy of Uttarakhand. The maximum temperature may likely increase from 0.42 °C to 3.07 °C from MC to EC in RCP 4.5 and 0.83 °C to 5.49 °C in RCP 8.5. Additionally, the minimum temperature may increase from 0.80 °C to 3.25 °C from MC to EC in RCP 4.5 and from 0.30 °C to 5.86 °C from MC to EC in RCP 8.5. The results of the study show the strong implication for agriculture, biodiversity, tourism, regional hydrology, etc., due to the change in the precipitation and temperature pattern in Uttarakhand. An increase in the knowledge of mountain trends and their controlling mechanisms through improved observations, adoption of satellite-based remote sensing for regional monitoring of different aspects, and model simulations can play an important role as a part of the mitigation strategy. The climate projection of this study can be used for impact assessment and adaptation planning for the region.

Author Contributions

Conceptualization, N.T. and M.S.; data curation, N.T., M.S. and V.M.; formal analysis, N.T. and A.S.; investigation, N.T.; methodology, N.T.; software, T.J., A.S., N. and M.S.; supervision, N.S., S.N. and A.S.; validation, N.T., A.S. and N.S.; visualization, T.J., M.S. and A.S.; writing—original draft, N.T. and T.J.; writing—review and editing, A.S., N.S., S.N. and N. All authors have read and agreed to the published version of the manuscript.

Funding

This research received no external funding.

Institutional Review Board Statement

Not applicable.

Data Availability Statement

Not applicable.

Acknowledgments

The above mentioned research is an outcome of a work carried out by the team of the Climate Research Unit, State Environment, Conservation and Climate Change Directorate (SECCCD), Uttarakhand, under the supervision of office of theDirector, State Environment, Conservation and Climate Change Directorate (SECCCD), Uttarakhand. The authors would like to thank Indian Institute of Science (IISc), Bangalore, India for their support. In addition, the authors also thank World Climate Research Program’s (WCRP) working group on CORDEX, Centre for Climate Change Research (CCCR), Indian Institute of Tropical Meteorology (IITM), Pune, India Meteorological Department (IMD), Japan for APHRODITE datasets, Climate Research Unit (CRU) for providing observed dataset from 1901–2017, Earth System Grid Federation Infrastructure (ESGF: http://esgf.llnl.gov/index.html (accessed on 9 December 2021)).

Conflicts of Interest

The authors declare no conflict of interest.

References

  1. Prentice, I.C.; Farquhar, G.D.; Fasham, M.J.R.; Goulden, M.L.; Heimann, M.; Jaramillo, V.J.; Kheshgi, H.S.; Le Quéré, C.; Scholes, R.J.; Wallace, D.W.R.; et al. The Carbon Cycle and Atmospheric CO2. In Climate Change 2000: The Science of Climate Change. Contributions of Working Group I to the Third Assessment Report of the Intergovernmental Panel on Climate Change; Houghton, J.T., Ding, Y., Griggs, D.J., Eds.; Cambridge University Press: Cambridge, UK, 2001; pp. 183–237. [Google Scholar]
  2. Sahu, N.; Sayama, T.; Saini, A.; Panda, A.; Takara, K. Understanding the Hydropower and Potential Climate Change Impact on the Himalayan River Regimes—A Study of Local Perceptions and Responses from Himachal Pradesh, India. Water 2020, 12, 2739. [Google Scholar] [CrossRef]
  3. Alam, G.; Peppelenbos, L. Cultivation of Medicinal Plants in Uttarakhand. Econ. Polit. Wkly. 2009, 44, 99–104. [Google Scholar]
  4. Rajeev, K.; Joshi, V.K.; Vinod, S.; Chandra, T.R.; Deep, K.G. Development of Herb Based Pharmaceutical Industry in Uttarakhand State. Int. J. Ayurveda Pharma Res. 2015, 3, 1–7. [Google Scholar]
  5. Saini, S.K.; Pandey, S.T. Organic Farming: Development and Strategies in Indian Perspective. Indian J. Agron. 2009, 54, 193–199. [Google Scholar]
  6. Mishra, A.; Appadurai, A.N.; Choudhury, D.; Regmi, B.R.; Kelkar, U.; Alam, M.; Chaudhary, P.; Mu, S.S.; Ahmed, A.U.; Lotia, H.; et al. Adaptation to Climate Change in the Hindu Kush Himalaya: Stronger Action Urgently Needed. In The Hindu Kush Himalaya Assessment; Springer International Publishing: Cham, Switzerland, 2019; pp. 457–490. [Google Scholar]
  7. Navarro-Racines, C.; Tarapues, J.; Thornton, P.; Jarvis, A.; Ramirez-Villegas, J. High-Resolution and Bias-Corrected CMIP5 Projections for Climate Change Impact Assessments. Sci. Data 2020, 7, 7. [Google Scholar] [CrossRef] [PubMed] [Green Version]
  8. Kharin, V.V.; Zwiers, F.W.; Zhang, X.; Hegerl, G.C. Changes in Temperature and Precipitation Extremes in the IPCC Ensemble of Global Coupled Model Simulations. J. Clim. 2007, 20, 1419–1444. [Google Scholar] [CrossRef] [Green Version]
  9. Tabari, H. Climate Change Impact on Flood and Extreme Precipitation Increases with Water Availability. Sci. Rep. 2020, 10, 13768. [Google Scholar] [CrossRef]
  10. Westra, S.; Fowler, H.J.; Evans, J.P.; Alexander, L.V.; Berg, P.; Johnson, F.; Kendon, E.J.; Lenderink, G.; Roberts, N.M. Future Changes to the Intensity and Frequency of Short-Duration Extreme Rainfall. Rev. Geophys. 2014, 52, 522–555. [Google Scholar] [CrossRef]
  11. Saini, A.; Sahu, N. Decoding Trend of Indian Summer Monsoon Rainfall Using Multimethod Approach: (Century Long Indian Monsoon Rainfall Trend). Stoch. Environ. Res. Risk Assess. 2021, 35, 2313–2333. [Google Scholar] [CrossRef]
  12. Ross, R.S.; Krishnamurti, T.N.; Pattnaik, S.; Pai, D.S. Decadal Surface Temperature Trends in India Based on a New High-Resolution Data Set. Sci. Rep. 2018, 8, 7452. [Google Scholar] [CrossRef] [Green Version]
  13. Sahu, N.; Saini, A.; Behera, S.K.; Sayama, T.; Sahu, L.; Nguyen, V.-T.-V.; Takara, K. Why Apple Orchards Are Shifting to the Higher Altitudes of the Himalayas? PLoS ONE 2020, 15, e0235041. [Google Scholar] [CrossRef] [PubMed]
  14. Saini, A.; Sahu, N.; Kumar, P.; Nayak, S.; Duan, W.; Avtar, R.; Behera, S. Advanced Rainfall Trend Analysis of 117 Years over West Coast Plain and Hill Agro-Climatic Region of India. Atmosphere 2020, 11, 1225. [Google Scholar] [CrossRef]
  15. Roxy, M.K.; Gnanaseelan, C.; Parekh, A.; Chowdary, J.S.; Singh, S.; Modi, A.; Kakatkar, R.; Mohapatra, S.; Dhara, C.; Shenoi, S.C.; et al. Indian Ocean Warming. In Assessment of Climate Change Over the Indian Region; Springer: Singapore, 2020; pp. 191–206. ISBN 9789811543272. [Google Scholar]
  16. Sahu, N.; Saini, A.; Behera, S.; Sayama, T.; Nayak, S.; Sahu, L.; Duan, W.; Avtar, R.; Yamada, M.; Singh, R.B.; et al. Impact of Indo-Pacific Climate Variability on Rice Productivity in Bihar, India. Sustainability 2020, 12, 7023. [Google Scholar] [CrossRef]
  17. Sahu, N.; Panda, A.; Nayak, S.; Saini, A.; Mishra, M.; Sayama, T.; Sahu, L.; Duan, W.; Avtar, R.; Behera, S. Impact of Indo-Pacific Climate Variability on High Streamflow Events in Mahanadi River Basin, India. Water 2020, 12, 1952. [Google Scholar] [CrossRef]
  18. Barnett, T.; Zwiers, F.; Hengerl, G.; Allen, M.; Crowly, T.; Gillett, N.; Hasselmann, K.; Jones, P.; Santer, B.; Schnur, R.; et al. Detecting and Attributing External Influences on the Climate System: A Review of Recent Advances. J. Clim. 2005, 18, 1291–1314. [Google Scholar] [CrossRef]
  19. Shrestha, U.B.; Gautam, S.; Bawa, K.S. Widespread Climate Change in the Himalayas and Associated Changes in Local Ecosystems. PLoS ONE 2012, 7, e36741. [Google Scholar] [CrossRef] [PubMed] [Green Version]
  20. Kumar, P.; Wiltshire, A.; Mathison, C.; Asharaf, S.; Ahrens, B.; Lucas-Picher, P.; Christensen, J.H.; Gobiet, A.; Saeed, F.; Hagemann, S.; et al. Downscaled Climate Change Projections with Uncertainty Assessment over India Using a High Resolution Multi-Model Approach. Sci. Total Environ. 2013, 468–469, S18–S30. [Google Scholar] [CrossRef] [PubMed]
  21. Chokkavarapu, N.; Mandla, V.R. Comparative Study of GCMs, RCMs, Downscaling and Hydrological Models: A Review toward Future Climate Change Impact Estimation. SN Appl. Sci. 2019, 1, 1698. [Google Scholar] [CrossRef] [Green Version]
  22. Midhuna, T.M.; Dimri, A.P. Future Projection of Winter Precipitation over Northwest India and Associated Regions Using CORDEX-SA Experiments. Theor. Appl. Climatol. 2020, 139, 1317–1331. [Google Scholar] [CrossRef]
  23. Nayak, S.; Mandal, M.; Maity, S. Performance Evaluation of RegCM4 in Simulating Temperature and Precipitation Climatology over India. Theor. Appl. Climatol. 2019, 137, 1059–1075. [Google Scholar] [CrossRef]
  24. Giorgi, F. Regional Climate Modeling: Status and Perspectives. J. Phys. IV 2006, 139, 101–118. [Google Scholar] [CrossRef]
  25. Laprise, R.; de Elía, R.; Caya, D.; Biner, S.; Lucas-Picher, P.; Diaconescu, E.; Leduc, M.; Alexandru, A.; Separovic, L. Challenging Some Tenets of Regional Climate Modelling. Meteorol. Atmos. Phys. 2008, 100, 3–22. [Google Scholar] [CrossRef]
  26. Antic, S.; Laprise, R.; Denis, B.; de Elía, R. Testing the Downscaling Ability of a One-Way Nested Regional Climate Model in Regions of Complex Topography. Clim. Dyn. 2006, 26, 305–325. [Google Scholar] [CrossRef] [Green Version]
  27. Kulkarni, A.; Patwardhan, S.; Kumar, K.K.; Ashok, K.; Krishnan, R. Projected Climate Change in the Hindu Kush-Himalayan Region by Using the High-Resolution Regional Climate Model PRECIS. Mt. Res. Dev. 2013, 33, 142–151. [Google Scholar] [CrossRef]
  28. Panday, P.K.; Thibeault, J.; Frey, K.E. Changing Temperature and Precipitation Extremes in the Hindu Kush-Himalayan Region: An Analysis of CMIP3 and CMIP5 Simulations and Projections. Int. J. Climatol. 2015, 35, 3058–3077. [Google Scholar] [CrossRef]
  29. Bhutiyani, M.R.; Kale, V.S.; Pawar, N.J. Long-Term Trends in Maximum, Minimum and Mean Annual Air Temperatures across the Northwestern Himalaya during the Twentieth Century. Clim. Chang. 2007, 85, 159–177. [Google Scholar] [CrossRef]
  30. Sanjay, J.; Krishnan, R.; Shrestha, A.B.; Rajbhandari, R.; Ren, G.Y. Downscaled Climate Change Projections for the Hindu Kush Himalayan Region Using CORDEX South Asia Regional Climate Models. Adv. Clim. Chang. Res. 2017, 8, 185–198. [Google Scholar] [CrossRef]
  31. Ghimire, S.; Choudhary, A.; Dimri, A.P. Assessment of the Performance of CORDEX-South Asia Experiments for Monsoonal Precipitation over the Himalayan Region during Present Climate: Part I. Clim. Dyn. 2018, 50, 2311–2334. [Google Scholar] [CrossRef]
  32. Choudhary, A.; Dimri, A.P. Assessment of CORDEX-South Asia Experiments for Monsoonal Precipitation over Himalayan Region for Future Climate. Clim. Dyn. 2018, 50, 3009–3030. [Google Scholar] [CrossRef]
  33. Gutowski, W.J., Jr.; Giorgi, F.; Timbal, B.; Frigon, A.; Jacob, D.; Kang, H.-S.; Raghavan, K.; Lee, B.; Lennard, C.; Nikulin, G.; et al. WCRP Coordinated Regional Downscaling EXperiment (CORDEX): A Diagnostic MIP for CMIP6. Geosci. Model Dev. 2016, 9, 4087–4095. [Google Scholar] [CrossRef] [Green Version]
  34. Nikulin, G.; Jones, C.; Giorgi, F.; Asrar, G.; Büchner, M.; Cerezo-Mota, R.; Christensen, O.B.; Déqué, M.; Fernandez, J.; Hänsler, A.; et al. Precipitation Climatology in an Ensemble of CORDEX-Africa Regional Climate Simulations. J. Clim. 2012, 25, 6057–6078. [Google Scholar] [CrossRef] [Green Version]
  35. Endris, H.S.; Omondi, P.; Jain, S.; Lennard, C.; Hewitson, B.; Chang’a, L.; Awange, J.L.; Dosio, A.; Ketiem, P.; Nikulin, G.; et al. Assessment of the Performance of CORDEX Regional Climate Models in Simulating East African Rainfall. J. Clim. 2013, 26, 8453–8475. [Google Scholar] [CrossRef]
  36. Krishnan, R.; Sanjay, J.; Gnanaseelan, C.; Mujumdar, M.; Kulkarni, A.; Chakraborty, S. Assessment of Climate Change Over the Indian Region: A Report of the Ministry of Earth Sciences (MOES), Government of India; Springer Nature: Singapore, 2020; ISBN 9789811543272. [Google Scholar]
  37. van Vuuren, D.P.; Edmonds, J.; Kainuma, M.; Riahi, K.; Thomson, A.; Hibbard, K.; Hurtt, G.C.; Kram, T.; Krey, V.; Lamarque, J.-F.; et al. The Representative Concentration Pathways: An Overview. Clim. Chang. 2011, 109, 5–31. [Google Scholar] [CrossRef]
  38. Thomson, E.C.; Smith, J.A.; Klenerman, P. The Natural History of Early Hepatitis C Virus Evolution; Lessons from a Global Outbreak in Human Immunodeficiency Virus-1-Infected Individuals. J. Gen. Virol. 2011, 92, 2227–2236. [Google Scholar] [CrossRef]
  39. van Vuuren, D.P.; Edmonds, J.A.; Kainuma, M.; Riahi, K.; Weyant, J. A Special Issue on the RCPs. Clim. Chang. 2011, 109, 1. [Google Scholar] [CrossRef] [Green Version]
  40. Riahi, K.; Rao, S.; Krey, V.; Cho, C.; Chirkov, V.; Fischer, G.; Kindermann, G.; Nakicenovic, N.; Rafaj, P. RCP 8.5—A Scenario of Comparatively High Greenhouse Gas Emissions. Clim. Chang. 2011, 109, 33–57. [Google Scholar] [CrossRef] [Green Version]
  41. Mausam, E. Winter Season (January-February) 2020. Mausam 2021, 72, 265–280. [Google Scholar] [CrossRef]
  42. Pai, D.; Rajeevan, M.; Sreejith, O.; Mukhopadhyay, B.; Satbha, N. Development of a New High Spatial Resolution (0.25° × 0.25°) Long Period (1901–2010) Daily Gridded Rainfall Data Set over India and Its Comparison with Existing Data Sets over the Region. Mausam 2014, 65, 1–18. [Google Scholar] [CrossRef]
  43. Mausam, E. Post Monsoon Season (October–December 2014). Mausam 2015, 66, 857–872. [Google Scholar] [CrossRef]
  44. Mausam, E. Post Monsoon Season (October to December 2005). Mausam 2006, 57, 701–718. [Google Scholar] [CrossRef]
  45. Tiwari, G.; Rameshan, A.; Kumar, P.; Javed, A.; Mishra, A.K. Understanding the Post-Monsoon Tropical Cyclone Variability and Trend over the Bay of Bengal during the Satellite Era. Q. J. R. Meteorol. Soc. 2021, 148, 1–14. [Google Scholar] [CrossRef]
  46. Shafiq, M.U.; Rasool, R.; Ahmed, P.; Dimri, A.P. Temperature and Precipitation Trends in Kashmir Valley, North Western Himalayas. Theor. Appl. Climatol. 2019, 135, 293–304. [Google Scholar] [CrossRef]
  47. Ritu. Ritu Living with and Responding to Risk in the Uttarakhand Himalayas: A Call for Prioritizing Lived Experiences in Research Policy Praxis. Int. J. Disaster Risk Reduct. 2020, 48, 101499. [Google Scholar] [CrossRef]
  48. Farooquee, N.A.; Maikhuri, R.K. Role of the State on Forests: Case of Uttarakhand. Econ. Polit. Wkly. 2007, 42, 3537–3540. [Google Scholar]
  49. Bargali, H.; Kumar, A.; Singh, P. Plant Studies in Uttarakhand, Western Himalaya—A Comprehensive Review. Trees For. People 2022, 8, 100203. [Google Scholar] [CrossRef]
  50. Kumar, A.; Kumar, R.; Sharma, M.; Kumar, U.; Prasad Gajula, M.N.V.; Singh, K.P. Uttarakhand Medicinal Plants Database (UMPDB): A Platform for Exploring Genomic, Chemical, and Traditional Knowledge. Data 2018, 3, 7. [Google Scholar] [CrossRef] [Green Version]
  51. Mishra, A. Changing Temperature and Rainfall Patterns of Uttarakhand. Int. J. Environ. Sci. Nat. Resour. 2017, 7, 90–95. [Google Scholar] [CrossRef]
  52. Riahi, K.; Grübler, A.; Nakicenovic, N. Scenarios of Long-Term Socio-Economic and Environmental Development under Climate Stabilization. Technol. Forecast. Soc. Chang. 2007, 74, 887–935. [Google Scholar] [CrossRef]
  53. Harris, I.; Jones, P.D.; Osborn, T.J.; Lister, D.H. Updated High-Resolution Grids of Monthly Climatic Observations—The CRU TS3.10 Dataset. Int. J. Climatol. 2014, 34, 623–642. [Google Scholar] [CrossRef] [Green Version]
  54. Remedio, A.R.; Teichmann, C.; Buntemeyer, L.; Sieck, K.; Weber, T.; Rechid, D.; Hoffmann, P.; Nam, C.; Kotova, L.; Jacob, D. Evaluation of New CORDEX Simulations Using an Updated Köppen–Trewartha Climate Classification. Atmosphere 2019, 10, 726. [Google Scholar] [CrossRef] [Green Version]
  55. Chaturvedi, R.K.; Joshi, J.; Jayaraman, M.; Bala, G.; Ravindranath, N.H. Multi-Model Climate Change Projections for India under Representative Concentration Pathways. Curr. Sci. 2012, 103, 791–802. [Google Scholar]
  56. Moss, R.H.; Edmonds, J.A.; Hibbard, K.A.; Manning, M.R.; Rose, S.K.; van Vuuren, D.P.; Carter, T.R.; Emori, S.; Kainuma, M.; Kram, T.; et al. The next Generation of Scenarios for Climate Change Research and Assessment. Nature 2010, 463, 747–756. [Google Scholar] [CrossRef] [PubMed]
  57. Ho, C.K.; Stephenson, D.B.; Collins, M.; Ferro, C.A.T.; Brown, S.J. Calibration Strategies: A Source of Additional Uncertainty in Climate Change Projections. Bull. Am. Meteorol. Soc. 2012, 93, 21–26. [Google Scholar] [CrossRef] [Green Version]
  58. Hawkins, E.; Osborne, T.M.; Ho, C.K.; Challinor, A.J. Calibration and Bias Correction of Climate Projections for Crop Modelling: An Idealised Case Study over Europe. Agric. For. Meteorol. 2013, 170, 19–31. [Google Scholar] [CrossRef]
  59. Taylor, K.E. Summarizing Multiple Aspects of Model Performance in a Single Diagram. J. Geophys. Res. Atmos. 2001, 106, 7183–7192. [Google Scholar] [CrossRef]
  60. Giorgi, F.; Gutowski, W.J. Regional Dynamical Downscaling and the CORDEX Initiative. Annu. Rev. Environ. Resour. 2015, 40, 467–490. [Google Scholar] [CrossRef]
  61. Katragkou, E.; García-Díez, M.; Vautard, R.; Sobolowski, S.; Zanis, P.; Alexandri, G.; Cardoso, R.M.; Colette, A.; Fernandez, J.; Gobiet, A.; et al. Regional Climate Hindcast Simulations within EURO-CORDEX: Evaluation of a WRF Multi-Physics Ensemble. Geosci. Model Dev. 2015, 8, 603–618. [Google Scholar] [CrossRef] [Green Version]
  62. Xu, Z.; Hou, Z.; Han, Y.; Guo, W. A Diagram for Evaluating Multiple Aspects of Model Performance in Simulating Vector Fields. Geosci. Model Dev. 2016, 9, 4365–4380. [Google Scholar] [CrossRef] [Green Version]
  63. Dimri, A.P.; Kumar, D.; Choudhary, A.; Maharana, P. Future Changes over the Himalayas: Maximum and Minimum Temperature. Glob. Planet. Chang. 2018, 162, 212–234. [Google Scholar] [CrossRef]
  64. Kundu, S.K.; Singh, C. A Comparative Study of Regional Climate Models and Global Coupled Models over Uttarakhand. Int. J. Mar. Environ. Sci. 2019, 13, 185–188. [Google Scholar]
  65. Banerjee, A.; Dimri, A.P.; Kumar, K. Temperature over the Himalayan Foothill State of Uttarakhand: Present and Future. J. Earth Syst. Sci. 2021, 130. [Google Scholar] [CrossRef]
  66. Kumar Kundu, S.; Singh, C. Rainfall Pattern Inferred from CORDEX-SA Domain Models for Future Warming Scenarios over Northwest Himalayan Region. VayuMandal 2019, 45, 2019. [Google Scholar]
  67. Dash, S.K.; Mishra, S.K.; Sahany, S.; Venugopal, V.; Ashok, K.; Gupta, A. Climate Modeling in India: Present Status and the Way Forward. Bull. Am. Meteorol. Soc. 2017, 98, ES183–ES188. [Google Scholar] [CrossRef]
  68. Shrestha, A.B.; Wake, C.P.; Mayewski, P.A.; Dibb, J.E. Maximum Temperature Trends in the Himalaya and Its Vicinity: An Analysis Based on Temperature Records from Nepal for the Period 1971–94. J. Clim. 1999, 12, 2775–2786. [Google Scholar] [CrossRef] [Green Version]
  69. Rao, V.B.; Franchito, S.H.; Gerólamo, R.O.P.; Giarolla, E.; Ramakrishna, S.S.V.S.; Rao, B.R.S.; Naidu, C.V. Himalayan Warming and Climate Change in India. Am. J. Clim. Chang. 2016, 05, 558–574. [Google Scholar] [CrossRef] [Green Version]
  70. Nayak, S.; Takemi, T. Dependence of Extreme Precipitable Water Events on Temperature. Atmósfera 2019, 32, 159–165. [Google Scholar] [CrossRef]
  71. Lee, E.; Carrivick, J.L.; Quincey, D.J.; Cook, S.J.; James, W.H.M.; Brown, L.E. Accelerated Mass Loss of Himalayan Glaciers since the Little Ice Age. Sci. Rep. 2021, 11, 24284. [Google Scholar] [CrossRef] [PubMed]
  72. Devi, N.; Singh, H. Socio-Environmental and Industrial Vulnerability Analysis of the Communities in the Shiwalik Region of Indian Himalayas Foothills. Trees For. People 2021, 6, 100155. [Google Scholar] [CrossRef]
  73. Nayak, S.; Maity, S.; Singh, K.S.; Nayak, H.P.; Dutta, S. Influence of the Changes in Land-Use and Land Cover on Temperature over Northern and North-Eastern India. Land 2021, 10, 52. [Google Scholar] [CrossRef]
  74. Banerjee, A.; Dimri, A.P.; Kumar, K. Rainfall over the Himalayan Foot-Hill Region: Present and Future. J. Earth Syst. Sci. 2020, 129, 11. [Google Scholar] [CrossRef]
  75. Rana, S.; Deoli, V.; Chavan, S.R. Detection of Abrupt Change in Trends of Rainfall and Rainy Day’s Pattern of Uttarakhand. Arab. J. Geosci. 2022, 15, 618. [Google Scholar] [CrossRef]
  76. Sahoo, S.K.; Ajilesh, P.P.; Gouda, K.C. Himesh S Impact of Land-Use Changes on the Genesis and Evolution of Extreme Rainfall Event: A Case Study over Uttarakhand, India. Theor. Appl. Climatol. 2020, 140, 915–926. [Google Scholar] [CrossRef]
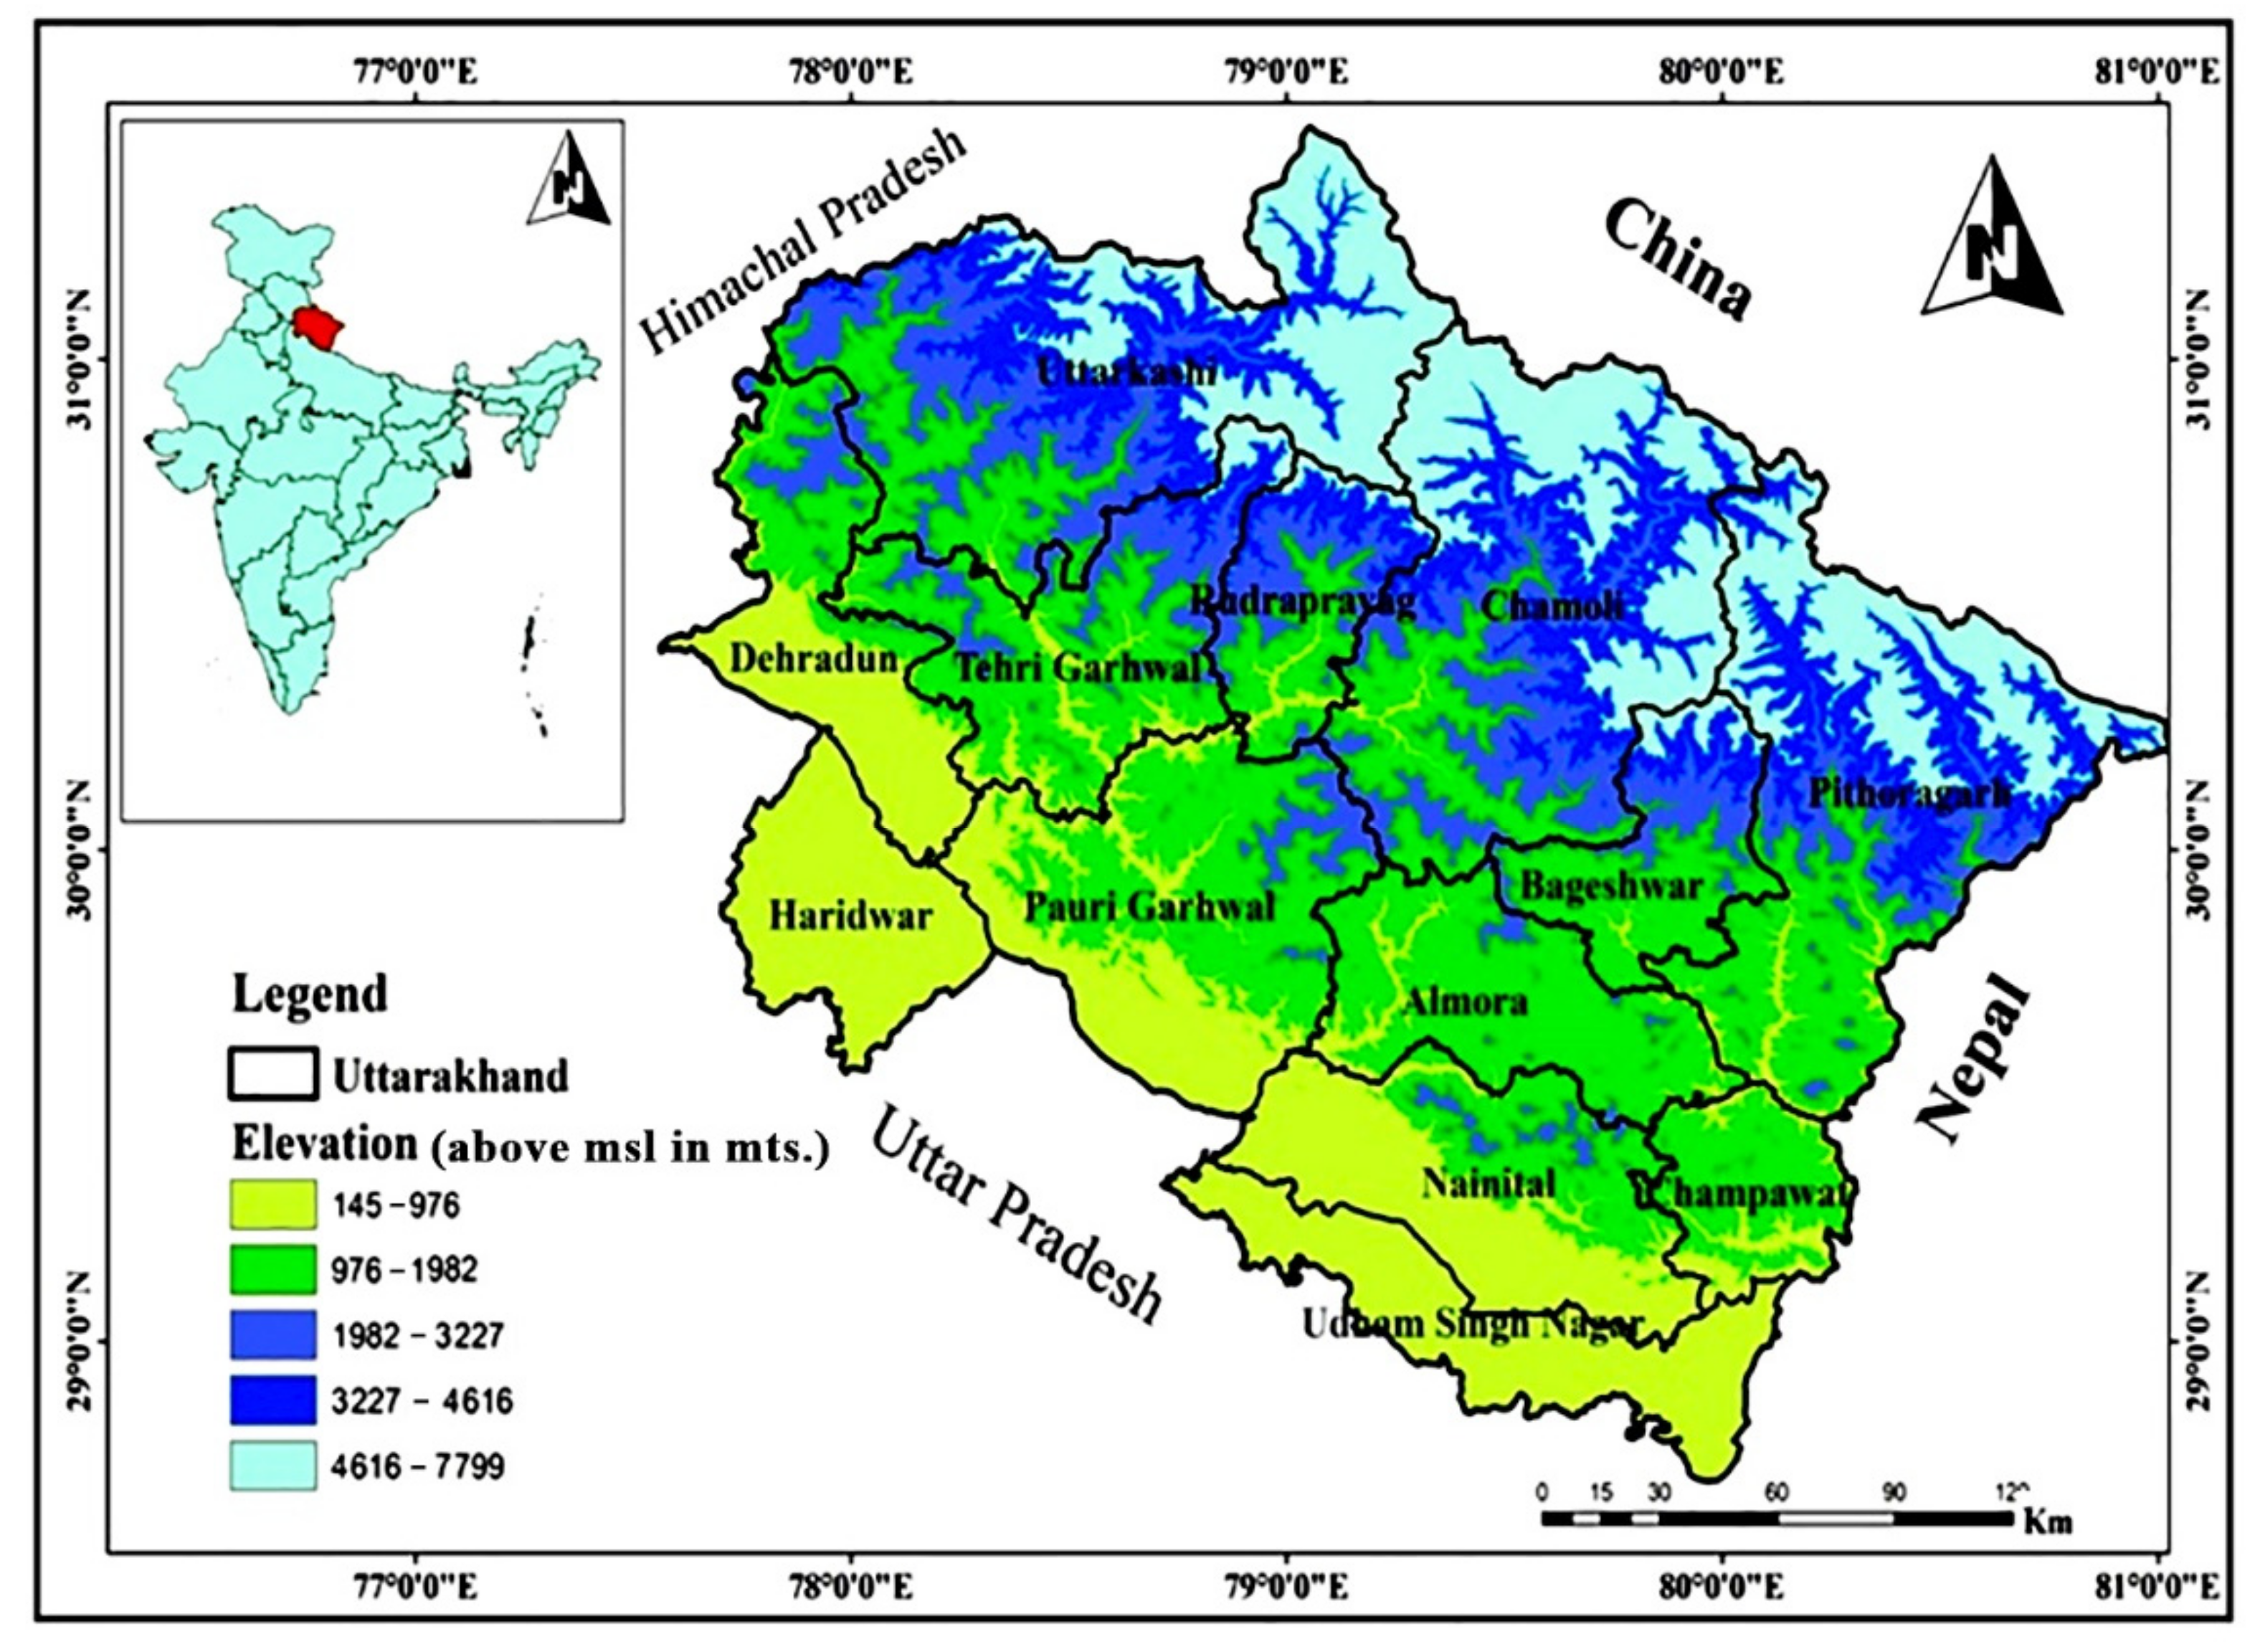
Figure 1. Location map of the Uttarakhand in India.
Atmosphere 13 00947 g001
Figure 2. Flow chart of methodology.
Atmosphere 13 00947 g002
Figure 3. CRU observed annual average maximum and minimum temperature (1976–2005) representation with trend analysis.
Atmosphere 13 00947 g003
Figure 4. Taylor diagram represents the statistical comparison of normalized (a) maximum temperature, (b) minimum temperature, and (c) precipitation (mm/m) from 1976 to 2005 of CORDEX-SA models, their ensemble, and CRU observation.
Atmosphere 13 00947 g004
Figure 5. Projected spatial representation of annual average precipitation (based on model ensemble) and temperature (maximum & minimum) from MC to EC for the multimodel ensemble of RCM (RCP 4.5 and RCP 8.5).
Atmosphere 13 00947 g005
Figure 6. Projected spatial representation of seasonal (JF, MAM, JJAS, and OND) precipitation and temperature (maximum & minimum) from MC to EC for the multimodel ensemble RCM (RCP 4.5).
Atmosphere 13 00947 g006
Figure 7. Projected spatial representation of seasonal (JF, MAM, JJAS, and OND) precipitation and temperature (maximum & minimum) from MC to EC for the multimodel ensemble of RCM (RCP 8.5).
Atmosphere 13 00947 g007
Figure 8. The projected precipitation change in percentage from MC to EC, concerning historical precipitation for the multimodel ensemble of RCM (RCP 4.5).
Atmosphere 13 00947 g008
Figure 9. The projected precipitation change in percentage from MC to EC, concerning historical precipitation for the multimodel ensemble of RCM (RCP 8.5).
Atmosphere 13 00947 g009
Figure 10. The variability of projected average annual maximum and minimum temperatures for the multimodel ensemble RCM (RCP 4.5 and RCP 8.5) in MC.
Atmosphere 13 00947 g010
Figure 11. The variability of projected average annual maximum and minimum temperatures for the multimodel ensemble RCM (RCP 4.5 and RCP 8.5) in EC.
Atmosphere 13 00947 g011
Table 1. List of CORDEX-SA RCMs used in this study with r1i1p1 ensemble.
Contributing CORDEX Modelling Centre or GroupAsia CORDEX RCM ModelPeriod
(Historical & Future)
Grid
Resolution (Lat × Lon)
Centre for Climate Change Research (CCCR), Indian Institute of Tropical Meteorology (IITM), Pune (3 Ensemble Members)CSIRO-QCCCE-CSIRO1951–20051.9° × 1.9°
2006–2099
IPSL-CM5A-LR1951–2005
2006–2099
3.7° × 1.9°
NOAA-GFDL-GFDL-ESM2M1951–2005
2006–2099
2.5° × 2.0°
Rossy Centre Swedish Meteorological & Hydrological Institute (SMHI), Sweden (6 Ensemble members)ICHEC1951–2005
2006–2100
2.5° × 1.9°
CNRM-CM51951–2005
2006–2100
1.4° × 1.4°
IPSL-CM5A-MR1951–2005
2006–2100
2.5° × 1.3°
NOAA-GFDL-GFDL-ESM2M1951–2005
2006–2100
2.5° × 2.0°
MPI-ESM-LR1951–2005
2006–2100
1.9° × 1.9°
MIROC-MIROC51951–2005
2006–2099
1.4° × 1.4°
Climate Source Centre (CSC), Germany (1 Ensemble member)MPI-ESM-LR1961–2005
2006–2100
1.9° × 1.9°
Table 2. Projected seasonal mean precipitation and temperature.
PeriodPrecipitation (mm)Minimum Temperature (°C)Maximum Temperature (°C)
RCP (4.5)RCP (8.5)RCP (4.5)RCP (8.5)RCP (4.5)RCP (8.5)
January–February (Winter Season)
Mid-Century (2021–2050)345.48364.12−3.06−2.8310.1510.81
End-Century
(2070–2099)
349.45556.37−1.8051.1810.6413.15
March–April–May (Pre-monsoon)
Mid-Century (2021–2050)381.09458.686.406.6820.5820.55
End-Century
(2070–2099)
891350.907.510.4723.7023.70
June–July–August–September (Monsoon)
Mid-Century
(2021–2050)
2030.112091.791414.2523.9524.10
End-Century
(2070–2099)
2196.052465.4712.5917.3124.7726.90
October–November–December (Post-monsoon)
Mid-Century
(2021–2050)
366.81346.032.072.415.4915.34
End-Century
(2070–2099)
609.91432.523.686.9816.4118.70
Table 3. The Range of percentage change in the projected precipitation concerning the historical period.
PeriodScenarioChange
Mid CenturyRCP 4.5−43.13% to +23.46%
RCP 8.5−32.30% to +40.18%
End of CenturyRCP 4.5−31.57% to +25.56%
RCP 8.5−26.23% to +31.64%
Table 4. The Range of change in the projected seasonal maximum and minimum temperatures concerning the historical period.
PeriodScenarioChange (in °C)
Temperature (Max.)Temperature (Min.)
Mid CenturyRCP 4.50.42 to 2.160.80 to 2.02
RCP 8.50.83 to 2.300.13 to 2.19
End of CenturyRCP 4.51.60 to 3.071.76 to 3.25
RCP 8.53.57 to 5.494.15 to 5.86
Publisher’s Note: MDPI stays neutral with regard to jurisdictional claims in published maps and institutional affiliations.