Article

Sensitivity of Land Surface Processes and Its Variation during Contrasting Seasons over India

1
School of Earth Ocean and Climate Sciences, Indian Institute of Technology Bhubaneswar, Bhubaneswar 752050, India
2
Department of Geography, University of California, Los Angeles, CA 90095, USA
3
Earth Science Center, Japan Meteorological Corporation Limited, Osaka 530-0011, Japan
4
Research Institute for Global Change, Japan Agency for Marine-Earth Science and Technology, Yokohama 236-0001, Japan
5
Center for Disaster Mitigation and Management (CDMM), Vellore Institute of Technology, Vellore 632014, India
6
Wolkus Technology Solutions Pvt. Ltd., #680, 1st Floor, 13th Cross. 27th Main, HSR Layout, Sector 1, Bengaluru 560102, India
*
Authors to whom correspondence should be addressed.
Atmosphere 2022, 13(9), 1382; https://doi.org/10.3390/atmos13091382
Submission received: 24 July 2022 / Revised: 21 August 2022 / Accepted: 25 August 2022 / Published: 28 August 2022
(This article belongs to the Special Issue New Approaches to Complex Climate Systems)

Abstract

:
The study investigates the influence of near-surface atmospheric parameters on land surface processes at the land–atmosphere interface through the offline simulation of the 2D Noah Land Surface Model-based High-Resolution Land Data Assimilation System (HRLDAS). The HRLDAS is used to conduct sensitive experiments by introducing perturbation in the atmospheric parameters, and the experiments were conducted for the period 2011–2013 in India. In each sensitive experiment, a single parameter is perturbed at a time, keeping the rest of the forcing parameters unchanged, and the procedure is followed for all the forcing parameters. The results revealed that the downward longwave radiation and T2 are highly sensitive to land surface processes, while wind speed is the least sensitive. The land surface process sensitivity varies with soil moisture content. The annual mean soil moisture at the surface layer is increased (decreased) by 8% when long wave radiation is decreased (increased) by 20%. Similarly, the annual mean soil temperature increased (decreased) by 2.2 °C when T2 increased (decreased) by 1%. The latent heat flux is highly sensitive to longwave radiation over the wetter soil, while its sensitivity to rainfall is higher over the drier soil. This is attributed to evapotranspiration’s sensitivity to the preferred soil moisture state. Further, the land surface sensitivity varies with contrasting seasons. The sensitivity of soil moisture and latent heat flux is high in OND and JJA seasons, respectively, and are least sensitive in the MAM season. In contrast, the sensible heat flux is highly sensitive to solar radiation in the MAM season and comparatively less sensitive in the JJA season. The study suggests that the antecedent soil moisture state plays a critical role in modulating land surface process sensitivity, and, therefore, a realistic soil moisture state is important for land surface feedback processes.

1. Introduction

The Earth’s surface interacts with the overlying atmosphere through the exchange of energy, moisture, and momentum [1]. Through these exchanges, the land surface modifies the atmospheric boundary layer and convection, thereby influencing the weather and climate system [2]. The atmosphere, in turn, provides feedback to the land surface and governs surface hydrological and ecological processes. For instance, precipitation modulates surface evapotranspiration, runoff and infiltrations, and vegetation, etc. In the NWP models, the land surface processes are parameterized in land surface models (LSMs). The LSMs play an important role in the atmospheric general circulation model (GCM) and regional and mesoscale models [3,4,5,6,7]. LSMs provide land surface feedback in terms of turbulent surface fluxes to the atmospheric components of the numerical weather prediction models, and better representation of these fluxes leads to improved weather and climate simulations [8,9,10,11,12,13]. Better representations of the land surface feedback process depend on the performance of LSMs as well as initial conditions [14,15]. In offline land-surface modeling systems, the quality of atmospheric forcing plays an important role in the simulation of land surface parameters. In [16], it was demonstrated that land surface simulations are sensitive to atmospheric factors, which are poorly predicted in the GCMs. There have been a number of studies that have suggested that land surface simulations are sensitive to atmospheric and geophysical parameters [11,12,17,18,19,20]. However, the responses of LSM simulations to each atmospheric-forcing parameter have not been explored systematically.
The performance of LSMs depends on inherited model physics and model parameters and on the atmospheric-forcing parameters supplied to drive the LSMs. The relative response of model parameters on LSM simulation has been studied [16,21,22]. It has been demonstrated that the Biosphere-Atmosphere Transfer Scheme (BATS) is sensitive to model parameters. In [22], it was suggested that BATS is most sensitive to the parameters that alter the availability of moisture and the availability of energy. A recent study [23] demonstrated that soil parameters can significantly improve soil moisture simulation through the tuning of soil field capacity and soil porosity in the Noah LSM.
The Indian subcontinent is characterized by its unique land surface state, owing to its topography, vegetation, soil texture, land use, surface albedo, and surface climatology. In addition to geophysical parameters, the near-surface atmospheric parameters modulate the underlying soil state through the alteration of biophysical and biogeochemical processes and, hence, influence the land surface processes to a great extent [15,24,25]. The sensitivity of atmospheric and geophysical parameters to land surface processes has been studied over the years [26,27]. A study concluded that TRMM rainfall and the NOAA STAR weekly varying green vegetation fraction improved land surface simulations over the south Asian monsoon region [20]. The soil moisture simulation is improved with use of the meteorological tower measured rainfall compared to TRMM rainfall in the Noah-1D [23]. The sensitivity of latent heat flux to variations in air temperature has been studied before, and it was concluded that the latent heat flux is sensitive to air temperature [17]. A prior study used two sets of atmospheric-forcing conditions (NCEP EDAS and in-situ observation) in the North American Land Data Assimilation System (NLDAS) experiment and showed that changes in the atmospheric-forcing source can influence land surface simulations [28]. Further, the sensitivity of air temperature, downward shortwave radiation, precipitation rate, and surface wind speed on prepared land surface analysis was studied [18]. They have demonstrated that the land surface analysis is more sensitive to air temperature and least sensitive to wind speed. A prior study demonstrated that the quality of near-surface atmospheric-forcing data in the land data assimilation system leads to better land surface estimations [14]. Collectively, near-surface atmospheric-forcing parameters have a notable influence on surface energy and water balance, and, therefore, accurate atmospheric-forcing parameters are important for land surface simulations. However, these forcing parameters are generally provided from the reanalysis products due to a lack of high-resolution observations [14,19]. These reanalysis products are usually derived from numerical weather prediction models and contain biases that can further propagate to the land surface simulation and, thereby, result in the improper partitioning of turbulent surface fluxes [29]. For instance, bias in precipitation and surface downwelling radiation parameters can potentially cause the inaccurate partitioning of surface latent and sensible heat fluxes, which further affects boundary layer development. A prior study demonstrated that the incorporation of a forcing bias correction scheme reduced errors in the simulation of soil moisture, runoff, and snow water equivalent and suggested that soil moisture initialization with corrected forcing parameters would result in better climate simulations [26]. A recent study demonstrated improved Indian summer monsoon rainfall simulations through satellite soil moisture initialization [30]. Further, quantifying errors in land surface simulations induced by the biases in atmospheric parameters are important for understanding the influence of atmospheric parameters on the surface process. Thus, the present work aims to study the relative importance of near-surface atmospheric parameters in simulating soil moisture, soil temperature, and turbulent surface fluxes. Moreover, the land surface sensitivity to such biases in the reanalysis under the varying surface and climatic conditions is also not clear and, hence, needs to be explored.
In the present study, the 2D Noah LSM-based High-Resolution Land Data Assimilation System (HRLDAS) is utilized to assess the sensitivity of land surface processes to near-surface atmospheric-forcing parameters. A number of sensitive experiments were carried out by perturbing the near-surface atmospheric parameters for the period 2011–2013, and the land surface simulations were analyzed to understand the relative importance of the atmospheric parameters modulating surface energy and water balance. Further analysis was carried out to understand the model’s sensitivity under various surface and climatic conditions. The methodology and data used in this study are discussed in Section 2. The sensitivity analysis is presented in Section 3, followed by the conclusion in Section 4.

2. Methodology and Data Used

2.1. Model Description

The High-Resolution Land Data Assimilation System version 3.4.1 (HRLDAS; [18]) is a state-of-the-art land data assimilation system developed at the National Center for Atmospheric Research (NCAR) to meet the demand for generating high-resolution land surface states, which are crucial for various land surface initialization/evaluation problems. The HRLDAS is based on the offline 2D Noah Land Surface Model [31,32], which integrates near-surface atmospheric parameters, static surface field viz. land use and soil type, and vegetation characteristics and estimates various land surface parameters such as soil temperature, soil moisture at surface and subsurface soil layers, and turbulent surface fluxes, along with other surface energy balance parameters. It has four soil layers at 0–10, 10–40, 40–100, and 100–200 cm, and vegetation root depth varies with land use type in the upper 1.5 m of soil. The HRLDAS uses the Penman potential evaporation approach [33], the multi-layer soil model [34], and the primitive canopy model [35]. Further, the complex canopy resistance [31], frozen ground physics [36], and glacial ice and the sea-ice module are also included in the physics of the model. The forced restore method is used to calculate the soil moisture and soil temperature at subsurface layers.

2.2. Methodology

The HRLDAS is used to study the sensitivity of land surface processes towards atmospheric-forcing parameters such as 2 m temperature (T2), 2 m specific humidity (q2), downward shortwave (SW) and longwave (LW) radiation at the surface, rainfall, and 10 m wind speed. First, a numerical experiment is conducted using HRLDAS by considering the near-surface atmospheric parameters from MERRA, TRMM, and ECMWF and the land use and vegetation from MODIS, as provided in Table 1. The initialization fields, viz., soil temperature, soil moisture, water equivalent of snow depth, and skin temperature, are derived from a National Center for Environment Prediction (NCEP) final analysis, and canopy water content from the Global Land Data Assimilation System (GLDAS) is used.
HRLDAS integration was conducted for a period of three years (2011–2013) over the Indian region (5°–39° N, 60°–100° E) at 20 km spatial resolution and 15 min integration time steps (hereafter referred to as control experiments). Further, sensitivity experiments were conducted by introducing perturbations in atmospheric-forcing parameters. In each sensitive experiment, a single parameter was allowed to increase or decrease by 20% (except T2, for which 1% perturbation was introduced) while keeping the remaining forcing the same as in the control experiment. A total of 12 sensitive experiments were conducted (see Table 2). The sensitive experiments with positive (negative) perturbations are referred to as positive (negative) sensitive experiments. The simulation of 2011–2012 was considered the model spin-up [20], and, therefore, the results for the year 2013 were used for further analysis. The model simulated soil moisture, soil temperature, latent heat flux, and sensible heat flux were analyzed further to assess the forcing sensitivity.
The study region is one of the important hotspots for soil moisture–precipitation coupling in the world [37]. The soil moisture content over the region varies notably both spatially and seasonally due to rainfall distribution and underlying surface properties and, thereby, likely influences the soil moisture–precipitation coupling. Further, the region exhibits an agrarian tropical warm and humid climate. The surface air temperature is generally warmer during the pre-monsoon (MAM) and southwest monsoon (JJAS) seasons, and cooler temperatures follow in the OND season. The precipitation over the region is largely contributed by the southwest monsoon (~80% of the annual total) in JJAS, followed by the northeast monsoon in OND, while the precipitation in the MAM season is the lowest. To understand the surface sensitivity under such varying climatic and surface conditions, we analyzed the forcing sensitivity in MAM, JJAS, and OND seasons.

3. Results and Discussion

The sensitivity of the land surface parameter is investigated by comparing the model-simulated parameters in the sensitive experiment with respect to the control experiment. Considering the HRLDAS spin-up period of two years, only simulations from 2013 are included in the analysis. The surface layer SM, ST, and turbulent surface flux sensitivity during annual and contrasting seasons such as March–May (MAM), June–August (JJA), and October–December (OND) are discussed.
Figure 1 illustrates the spatial distribution of volumetric soil moisture (m3/m3) during the annual 2013, MAM, JJA, and OND seasons over the Indian region, as obtained from the control experiment. Note that the HRLDAS-derived soil moisture has been validated over the study region in prior studies [14,20,23,38], and the performance of the HRLDAS system in simulating land surface parameters is satisfactory. The annual soil moisture shows that north and northwest (soil moisture ~0.1–0.2 m3/m3) India is drier, followed by peninsular India, while the central and eastern India regions exhibit comparatively higher annual soil moisture (0.2–0.3 m3/m3). The soil moisture varies notably during contrasting seasons, such as the MAM, JJA, and OND seasons. The soil moisture is dry in MAM, followed by wet in the JJA season over India, except for the peninsular and northwest regions following the southwest monsoon rainfall distribution. In the OND season, the peninsular region gains moisture due to the northeast monsoon rainfall. The soil moisture exhibits a transitional state during the OND season over India except for the northwest region.

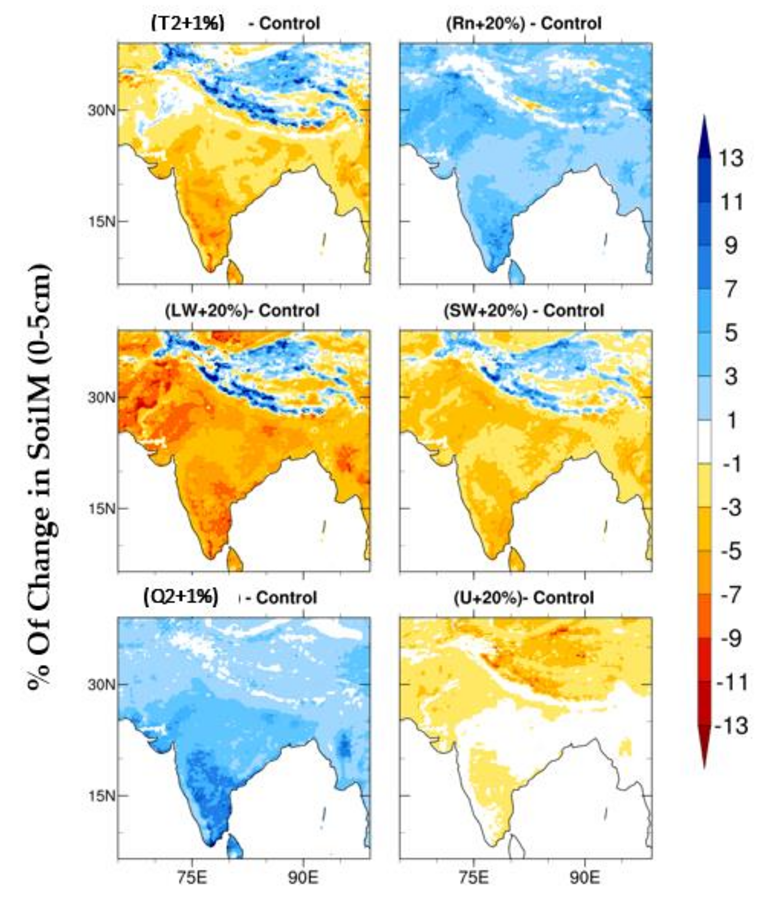
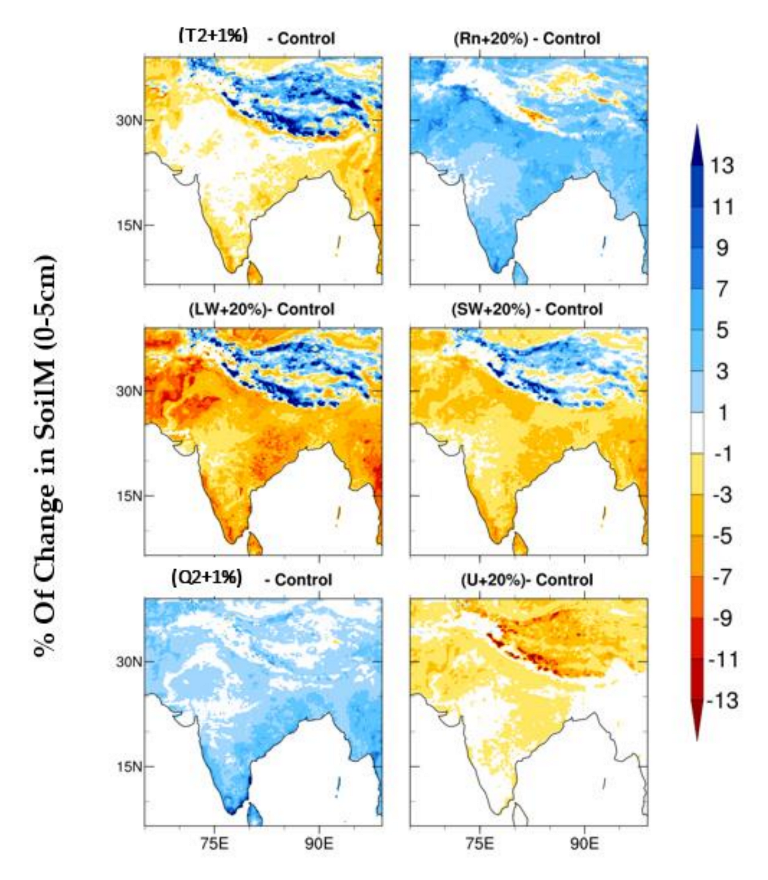
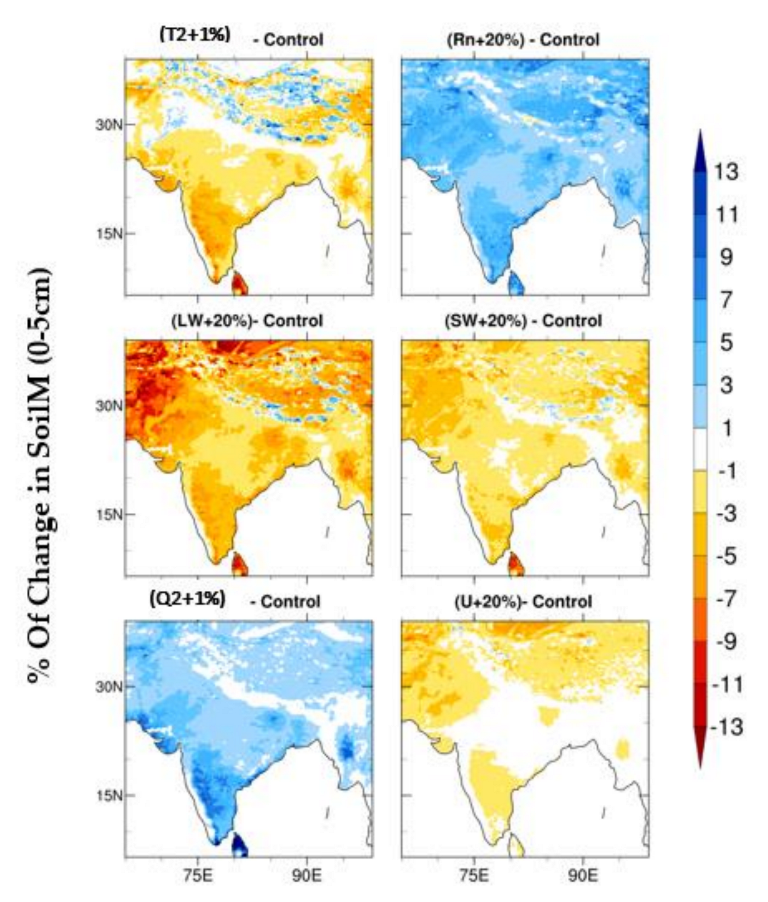
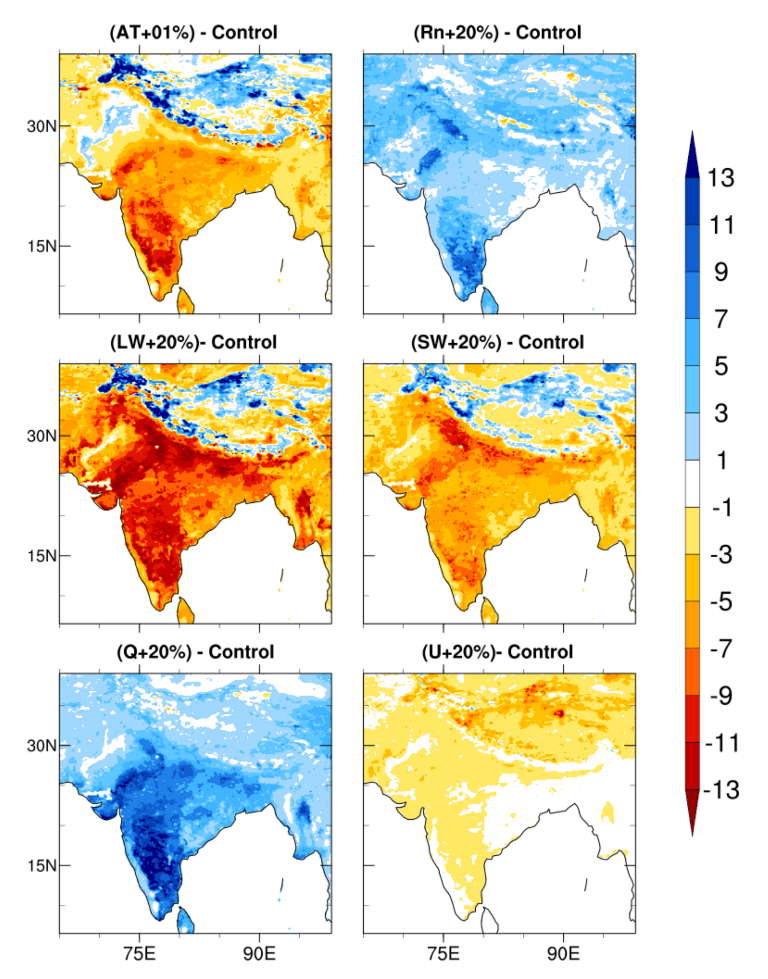
3.1. Sensitivity of Soil Moisture

The percentage of annual soil moisture change (%) at the surface layer in each positive sensitive experiment, such as T2 + 1%, Rn + 20%, LW + 20%, SW + 20%, Q2 + 20% and U + 20%, compared with the control experiment is shown in Figure 2. It is seen that the annual surface layer soil moisture change is highest in the LW + 20% experiment and least in the U + 20% experiment. The annual soil moisture change in the LW + 20% experiment is dominant (~10–13%) over the drier soil in heat low regions and peninsular India and least (~3%) over the wetter central India. Further, the soil moisture change is notably higher in the Q2 + 20% experiment (~9–11%), followed by the T2 + 1% and Rn + 20% experiments. The annual soil moisture change due to the Rn + 20% experiment is ~7% over the drier regions and least (1–3%) in the wetter regions. In general, annual soil moisture change is dominant over the drier soil regions and least over the wetter central India regions, as seen in all the positive sensitive experiments. Increases in longwave and shortwave radiation, 2 m temperature, and wind speed lead to increases in surface latent heat fluxes (discussed in Section 3.3) and, thereby, increase moisture transport from land surfaces to the overlying atmosphere, resulting in soil moisture decreases in the T2 + 1%, LW + 20%, SW + 20%, and U + 20% experiments.
A rise in rainfall and specific humidity contributes to a rise in soil moisture, and such a rise is dominant over drier regions. These results corroborate a prior study of the central United States [18]. Soil moisture sensitivity over high topography regions, such as over the Himalayas, is very complex. The region exhibits complex spatial variability of soil moisture due to local climate and underlying soil properties [39]. Soil moisture sensitivity has shown similar but opposite behavior in all negative sensitive experiments. For instance, a decrease in T2, LW, SW, and U results in an increase in soil moisture through a reduction in evapotranspiration, and a decrease in Rn and Q2 results in a decrease in soil moisture. However, the soil moisture differences due to the forcing perturbation are higher in negative sensitive experiments compared to positive experiments, consistent with a prior study [17]. Figure 3 represents the annual soil moisture change (%) due to each sensitive experiment averaged over the Indian land mass. It is seen that the average soil moisture change is highest (~8%) in the LW − 20% experiment, while the U ± 20% experiment contributes the least (~1%) soil moisture change. The Q2 ± 20%, Rn ± 20%, T2 ± 1%, and SW ± 20% experiments have similar influences on soil moisture change (3–4%). It is also noted that the soil moisture change is higher in negative sensitive experiments than positive experiments in all but the Q2 ± 20% experiment.
A prior study has suggested that the asymmetry in soil moisture sensitivity is due to the stress factor β g used in the evaporation formulation that controls surface evaporation [17]. Further, soil moisture sensitivity during contrasting seasons such as MAM, JJA, and OND are shown in Figure 4, Figure 5 and Figure 6, respectively. During MAM, the percentage of soil moisture change is higher (~9–11%) in the LW + 20% experiment over the northwest and eastern regions, followed by Rn + 20%, and least (less than 1%) in the T2 + 1% experiments (Figure 4).
The Rn + 20% experiment predicted ~5–9% soil moisture changes in many parts of India except for the western central India region, where the soil moisture change was ~1–3% (Figure 4). Soil moisture change showed similar (~5–7%) behavior during the JJA season in the LW + 20%, Rn + 20%, T2 + 1%, and Q2 + 20% experiments over peninsular India and was ~3% over the central India region (Figure 5). The U + 20% experiment showed the least (less than 1%) change in the JJA season. Note that the soil condition is wet (see Figure 1c) during the JJA period due to the southwest monsoon. A prior study suggested that evapotranspiration is not a strong function of soil moisture during the wet period [40,41,42] and exhibits an energy-limited evapotranspiration regime during the wet period. It also suggested that evapotranspiration exhibits a soil moisture-limited evapotranspiration regime when the soil moisture is below a critical value. Therefore, the transitional soil wetness condition becomes important for the soil moisture–evapotranspiration coupling. Here, soil moisture sensitivity is consistently modest over the central India region, while the drier regions are more sensitive. Interestingly, soil moisture sensitivity was highest in the OND season in all the sensitive experiments (Figure 6). The soil moisture change was highest (>13%) in the LW + 20% experiment over many parts of India, followed by the Q2 + 20% experiment (11–13%). Peninsular India and northwest India had higher sensitivity (9–11%) in the T2 + 1% experiment, followed by SW + 20% and Rn + 20% experiments. The higher sensitivity of soil moisture is likely due to the transitional soil wetness conditions in OND.

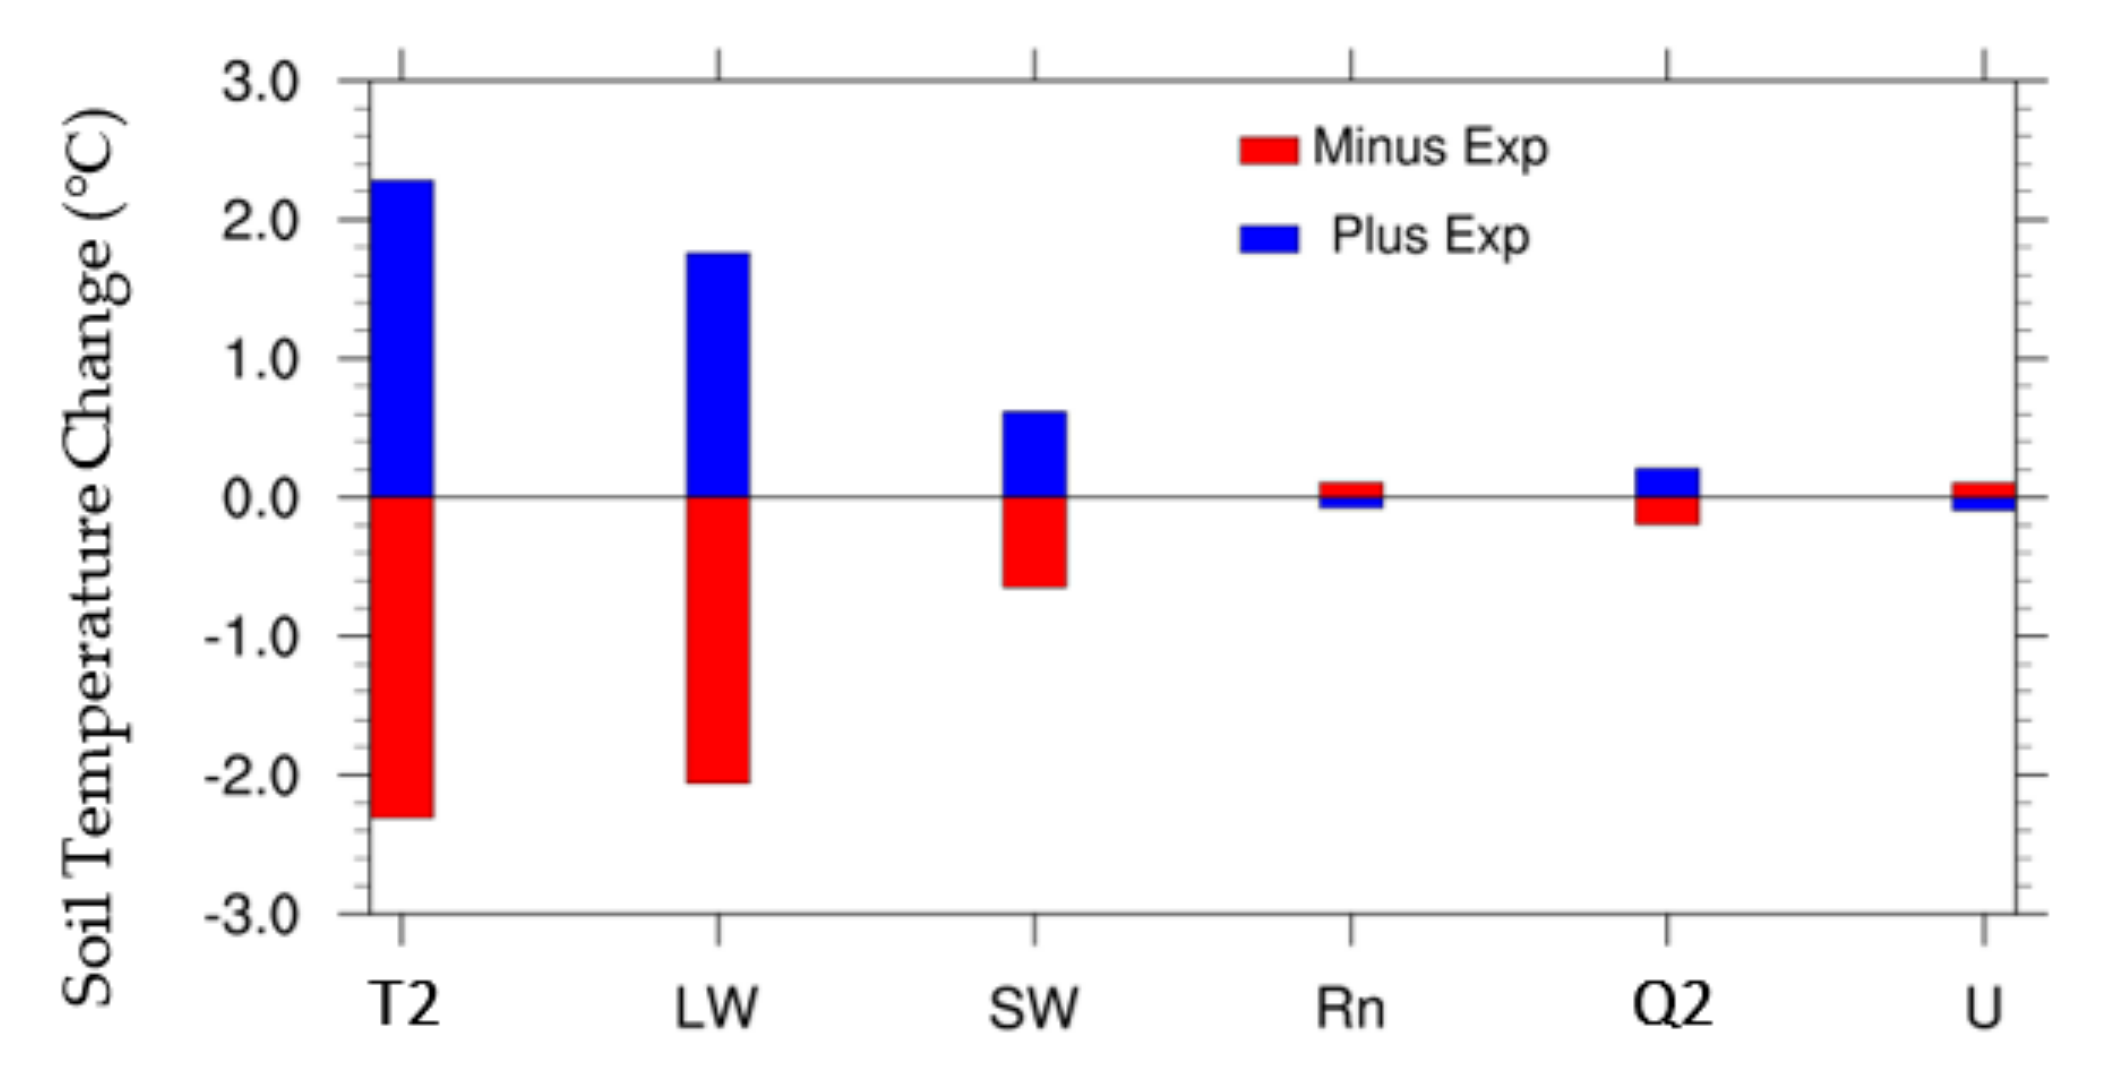
3.2. Sensitivity of Soil Temperature

The annual mean surface layer soil temperature difference (°C) between the sensitive experiments and the control experiment, averaged over the Indian land mass, is illustrated in Figure 7. It shows that the soil temperature is highly sensitive to 2 m temperature, followed by longwave radiation. The annual mean soil temperature rose by 2.2 °C in the T + 1% experiment. The soil temperature rose by 1.8 °C in the LW + 20% experiment and cooled by 2.0 °C in the LW − 20% experiment. The soil temperature sensitivity is followed in the SW ± 20% experiment, which contributes to ~ ± 0.6 °C change in soil temperature. The annual mean soil temperature change was at least ~0.2 °C in the Rn ± 20%, Q2 ± 20%, and U ± 20% experiments. The seasonal variation of soil temperature was not notable in all the sensitive experiments except the Q2 ± 20% experiment. In the Q2 ± 20% experiment, the soil temperature change was highest in the JJA season (~0.5 °C) and least (~0 °C) in the MAM season.

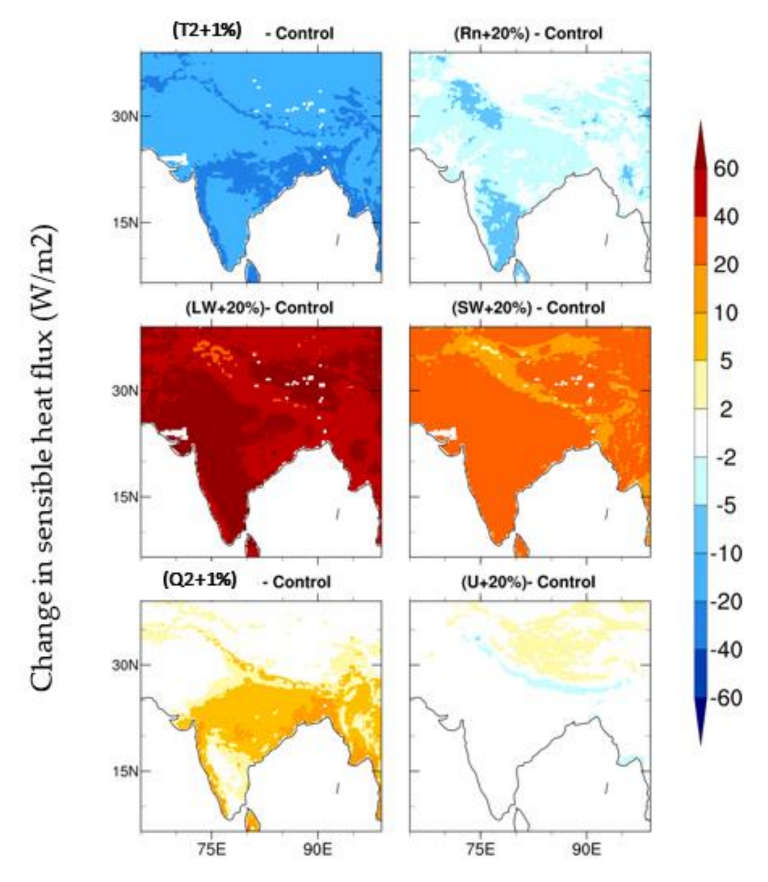
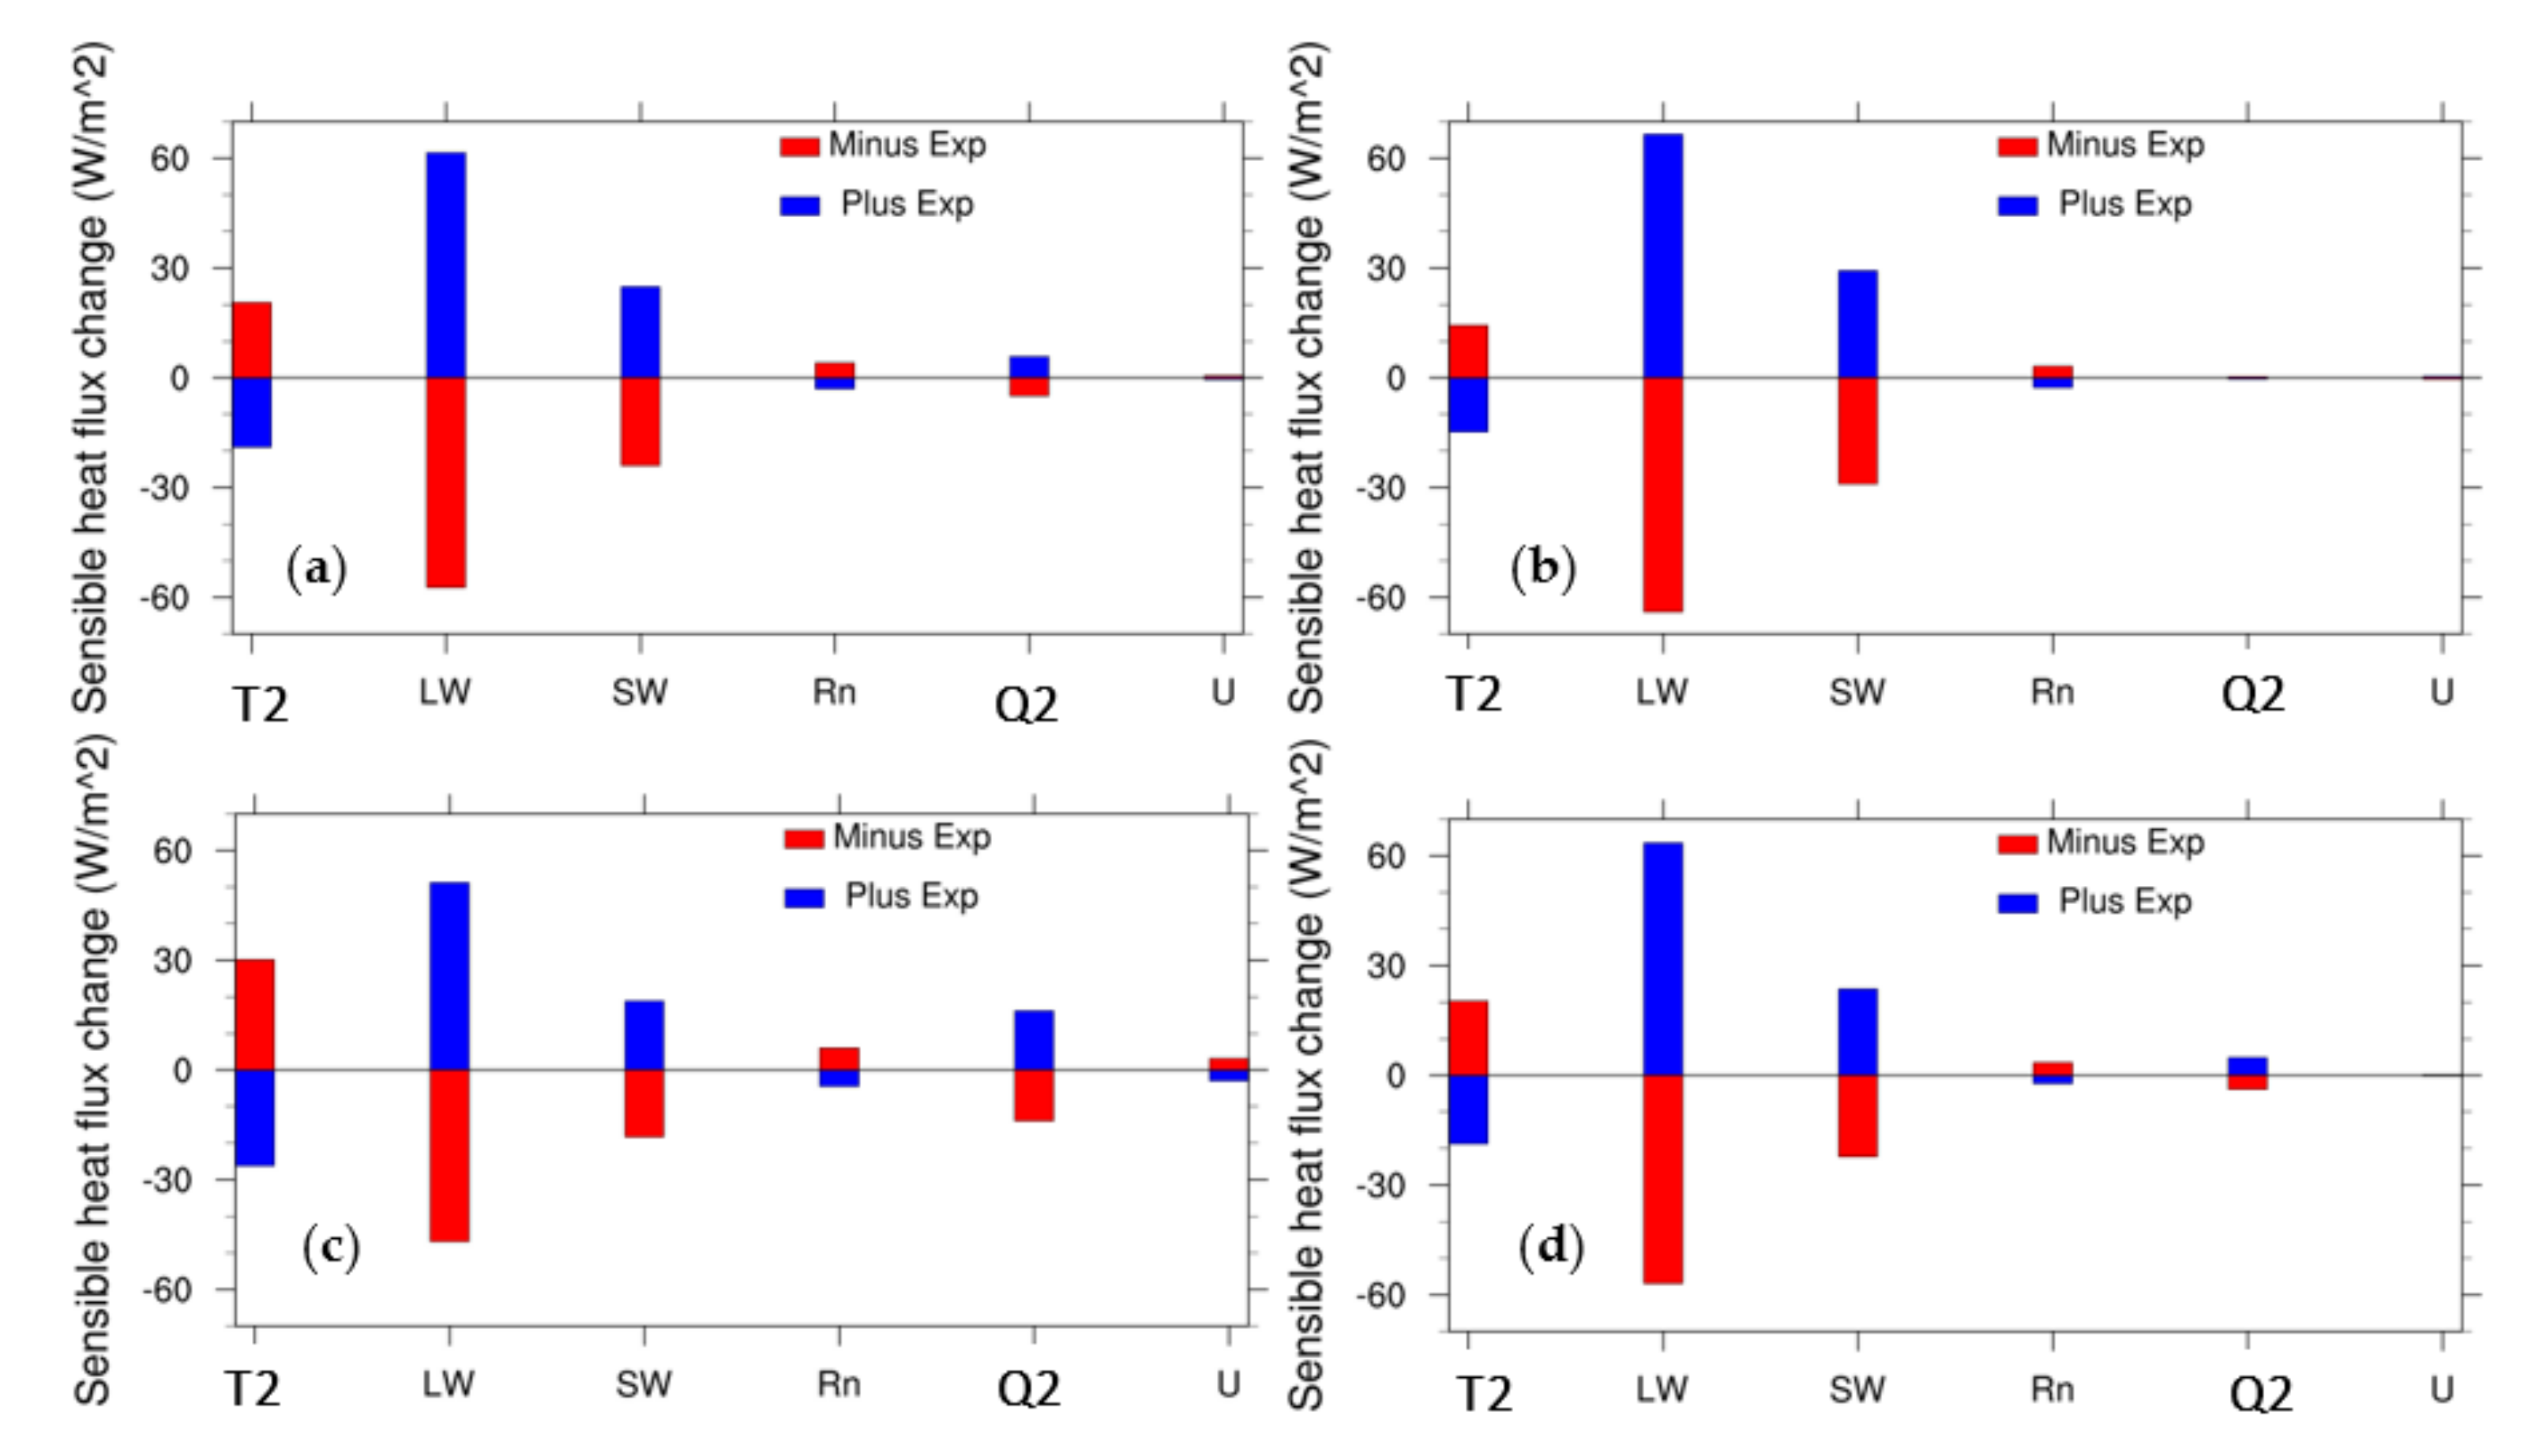
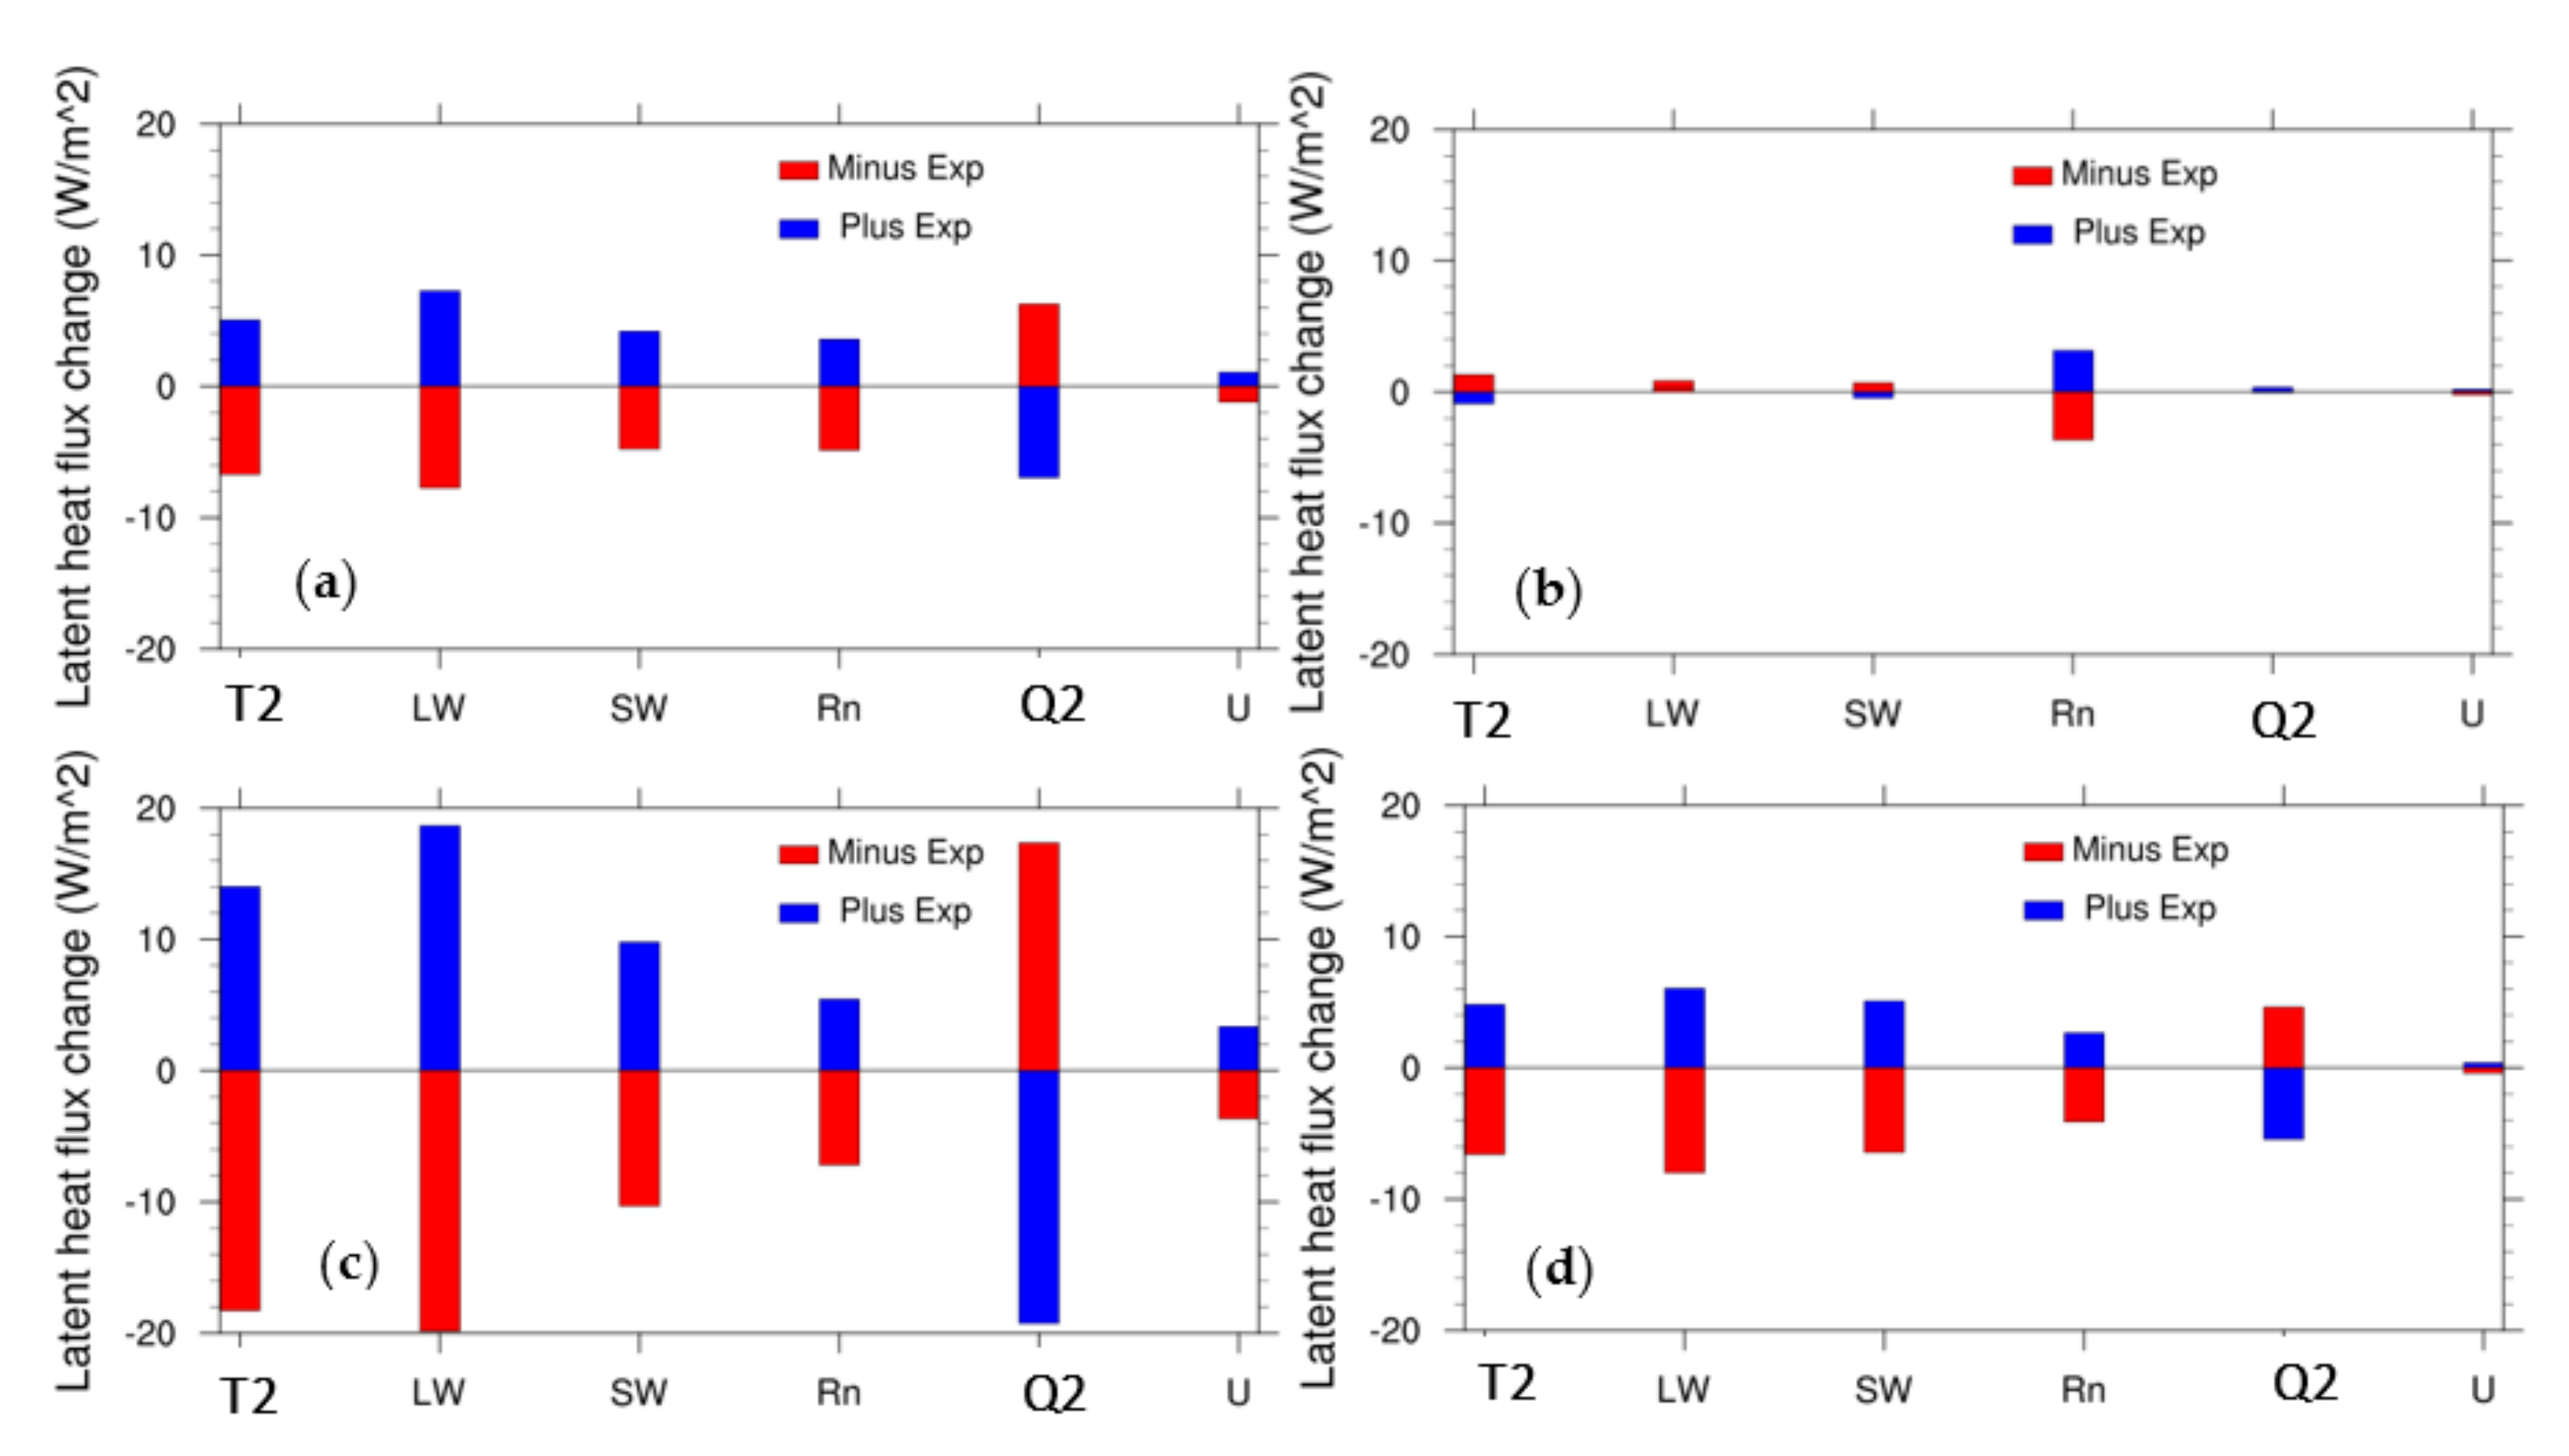
3.3. Sensitivity of Surface Fluxes

Figure 8 shows the annual mean sensible heat flux difference between the positive sensitive experiments and the control experiments. The results show that the sensible heat flux is highly sensitive to LW radiation, followed by SW radiation. The rise in SW and LW radiation and specific humidity results in a rise in the sensible heat flux. In contrast, a rise in T2 causes a reduction in the sensible heat flux. The result is attributed to the sensible heat flux (H) parameterization in Noah, as illustrated in Equation (1).
H = ρ U C H c p ( T s T a )
where Ts and Ta are the temperatures at the surface and at reference height. U is the wind speed at reference height, and ρ is the air density. C H is the drag coefficient for the sensible heat flux, and c p is the specific heat at constant pressure.
Following the Stefan–Boltzmann law, the rise in solar radiation results in a rise in Ts, and, therefore, (Ts − Ta) increases, which, in turn, results in an increase in the sensible heat flux. In contrast, the Ta rise in the T2 + 1% experiment caused a lower (Ts − Ta) magnitude, which resulted in a decrease in the sensible heat flux (Figure 8). The relation also holds well for negative sensitive experiments. Further, it is seen that the sensible heat flux sensitivity varies with soil wetness conditions. For instance, the sensible heat flux change was higher over the wetter central India region in the T2 + 1% and Q2 + 20% experiments compared to the drier peninsular and northwest India regions. In contrast, the sensible heat flux change in the LW + 20% and Rn + 20% experiments were dominant over the drier region (see Figure 8). The wind had the least influence on the sensible heat flux.
Figure 9 depicts the sensible heat flux change (W/m2) averaged over the Indian region during annual, MAM, JJA, and OND seasons in all the sensitive experiments. The annual sensible heat flux change was highest (~60 W/m2) in the LW ± 20% experiment, followed by the SW ± 20% experiment (change ~25 W/m2) and the T2 + 1% experiment (change ~20 W/m2). The Rn ± 20% and Q2 ± 20% experiments contributed ~3–5% change in the annual sensible heat flux, and U ± 20% had a negligible effect. The sensible heat flux sensitivity varies with the seasons, as seen in Figure 9b–d. For instance, the sensible heat flux change was less in JJA compared to MAM in the LW ± 20% and SW ± 20% experiments. In contrast, sensible heat flux change was higher in JJA compared to MAM in the T2 ± 20% and Q2 ± 20% experiments. The sensible heat flux change in the OND season has similar behaviors to the annual season in all sensitive experiments.
The annual mean latent heat flux change (W/m2) between each (positive) sensitive experiment and the control experiment is shown in Figure 10. It shows that the LW radiation and q2 have the highest influence on the latent heat flux over the wetter soil, followed by T2. However, the rainfall influence is higher over drier soil, such as in peninsular India. It is also seen that rises in LW, SW, T2, rainfall, and wind result in a rise in the latent heat flux, while a q2 rise results in a decrease in latent heat, and the reason for such contrast is attributed to the latent heat flux parameterization in the Noah LSM, as shown in Equation (2).
L = λ ρ U C E [ q * ( T s ) q a ]
where λ is the latent heat of vaporization, q *   and   q a are the specific humidity at the surface and at reference height, respectively. C E is the drag coefficient of the latent heat flux and ρ is the air density.
As stated earlier, the rise in longwave radiation in the LW + 20% experiment led to a rise in Ts. Following the Clausius–Clapeyron relationship, the rise in Ts causes a rise in q * , and, hence, the latent heat flux increases in the LW + 20% experiment. On the other hand, a rise in q a in the Q2 + 20% experiment resulted in a loss of net moisture transport at the surface, and, hence, the latent heat flux decreased.
The rainfall response to the latent heat flux is higher in the drier regions compared to wet regions. This is because evapotranspiration is a strong function of soil moisture over the drier regions and a weak function of soil moisture over the wet regions. As highlighted in prior studies [41,42], evapotranspiration is energy-limited over wet soil, and is soil moisture limited over comparatively dryer soil. Note that the rise in rainfall over the dryer soil enhances soil moisture, and, hence, latent heat flux increases. However, a rise in rainfall over wet soil causes the runoff of surplus water and does not enhance soil moisture (and, hence, the latent heat flux) notably. On the other hand, an increase in SW and LW radiation over wet surfaces notably enhances the latent heat flux since evapotranspiration exhibits an energy-limited regime. Therefore, latent heat flux sensitivity to rainfall is stronger over drier regions than wet regions, while its sensitivity to SW and LW radiation is strongest over wet surfaces. A prior study suggested that the variations of sensible and latent fluxes were more sensitive to soil moisture over arid and semi-arid soil moisture zones [43]. Moreover, the energy exchanges between the land surface and the atmosphere are characterized by regional heterogeneity due to soil texture, vegetation type, and vegetation fraction, thereby modulating surface physical and biogeochemical processes [44,45,46].
Figure 11 shows the latent heat flux change due to the sensitive experiments averaged over Indian regions in annual, MAM, JJA, and OND seasons. As discussed before, the annual latent heat flux change is higher (~7 W/m2) in the LW ± 20% and Q2 ± 20% experiments, followed by the T2 ± 1% (~5 W/m2) experiment, while the U ± 20% experiment has the least (~1 W/m2) influence. Interestingly, the Rn ± 20% experiment has the highest (~3 W/m2) influence on the latent heat flux change in MAM, followed by the T2 ± 1% experiment (~1 W/m2), while other parameters have the least influence on the latent heat flux change. In contrast, the latent heat flux change is highest (>19 W/m2) in the LW ± 20% and Q2 ± 20% experiments, followed by the T2 ± 20% experiment (~14–19 W/m2) during JJA, while the change is ~10, ~6, and ~4 W/m2 in the SW ± 20%, Rn ± 20% and U ± 20% experiments, respectively. The variation of latent heat flux sensitivity during contrasting seasons such as MAM and JJA is primarily attributed to the soil wetness condition. For instance, increasing solar radiation in drier MAM does not influence the latent heat flux as surface evapotranspiration is moisture-limited, so surplus energy is balanced through a rise in the sensible heat flux. However, an increase in rainfall in MAM enhances soil moisture and, hence, has a stronger influence on the latent heat flux. As discussed before, solar radiation has a strong influence on wetter soil in the JJA season. The latent heat flux change lies in the range of 3–6 W/m2 in all the sensitive experiments except in U ± 20% (<1 W/m2), suggesting modest sensitivity in the OND season.

4. Conclusions

In the present study, the relative importance of near-surface forcing parameters in simulating land surface processes was investigated. Numerical experiments were carried out using HRLADS, with inputs from reanalysis and observations for the period 2011–2013 over India, referred to as the control experiments. Further, land surface sensitivity experiments of forcing parameters such as T2 and q2, SW and LW radiation, rainfall, and 10 m wind speed were conducted. In each sensitive experiment, a single forcing parameter was perturbed through addition or subtraction, keeping the rest of the forcing parameters same as the control experiment; the procedure was followed for all six forcing parameters. Numerical experiments were conducted for the period 2011–2013, and the simulation of 2013 was analyzed by considering 2011–2012 as the spin-up.
The analysis revealed that the land surface processes are highly sensitive to LW and T2 and least sensitive to surface wind. The sensitivity varies spatially due to the underlying soil moisture content. The soil moisture is highly sensitive to LW radiation and least sensitive to wind speed, and the sensitivity is dominant over drier soil. The annual soil moisture change is ~8% in the LW − 20% experiment, followed by ~4% in both the T2 ± 1% and Q2 ± 20% experiments. Further, the soil moisture sensitivity varies notably with seasons. For instance, soil moisture sensitivity was higher to rainfall and LW radiation in MAM and least sensitive to T2 and wind speed. Soil moisture sensitivity was highest in OND compared to JJA and MAM. Soil temperature sensitivity was highest to T2, followed by LW radiation, and least sensitive to wind speed and rainfall. The soil temperature sensitivity did not vary notably during contrasting seasons for all experiments except for specific humidity. The cause of high soil moisture sensitivity in the OND season is unclear and remains the future scope of this study.
The latent heat flux is highly sensitive to longwave radiation and T2 over wetter soil, while its sensitivity is higher to rainfall over drier soil. In particular, latent heat flux sensitivity in the MAM season is highest to rainfall compared with other parameters. This is because evapotranspiration is a strong function of soil moisture in a soil moisture-limited evapotranspiration regime, i.e., in drier soil, and is a weak function of soil moisture in an energy-limited evapotranspiration regime, i.e., in wet soil. Hence, the influence of LW and SW radiation on the latent heat flux is dominant over wetter soil in the JJA season. Solar radiation has the least influence on the latent heat flux during MAM and has the highest influence on the sensible heat flux. It is the antecedent soil moisture content that controls surface energy partitioning that makes the sensible heat flux a larger contributor to surface energy balance, while the contribution of the latent heat flux is least in the MAM season. Similarly, the sensible heat flux sensitivity to solar radiation is least in JJA compared to the MAM and OND seasons.
It is the antecedent soil moisture content that plays a crucial role in modulating the land surface process, and the study has implications for understanding land surface processes as well as for land data assimilation system applications.

Author Contributions

Conceptualization, H.P.N.; methodology, H.P.N.; formal analysis, H.P.N. and S.N., investigation, H.P.N. and S.M.; data curation, S.D. and N.P.; writing—original draft preparation, H.P.N.; writing—review and editing, S.N., S.M., K.S.S., S.D. and N.P.; visualization H.P.N., S.N. and K.S.S. supervision, S.M. All authors have read and agreed to the published version of the manuscript.

Funding

This research received no external funding.

Institutional Review Board Statement

Not applicable.

Informed Consent Statement

Not applicable.

Data Availability Statement

The surface meteorological parameters from the Modern-Era Retrospective analysis for Research and Applications (MERRA) reanalysis are available at https://gmao.gsfc.nasa.gov/reanalysis/MERRA/; accessed on 21 August 2021. Rainfall from the Tropical Rainfall Measuring Mission is available at https://disc.gsfc.nasa.gov/datasets/TRMM_3B42_Daily_7/summary; accessed on 22 August 2021.

Conflicts of Interest

The authors declare no conflict of interest.

References

  1. Betts, A.K.; Ball, J.H.; Beljaars, A.C.M.; Miller, M.J.; Viterbo, P. The land surface–atmosphere interaction: A review based on observational and global modeling perspectives. J. Geophys. Res. 1996, 101, 7209–7225. [Google Scholar] [CrossRef]
  2. Koster, R.D.; Sud, Y.C.; Guo, Z.; Dirmeyer, P.A.; Bonan, G.; Oleson, K.W.; Chan, E.; Verseghy, D.; Cox, P.; Davies, H.; et al. GLACE: The Global Land–Atmosphere Coupling Experiment. Part I: Overview. J. Hydrometeorol. 2006, 7, 590–610. [Google Scholar] [CrossRef]
  3. Mintz, Y. The sensitivity of numerically simulated climates to land surface boundary conditions. In JSC Study Conf. on Land Surface Processes in Atmospheric Gen. Circulation Models; GCM: Greenbelt, MD, USA, 1982; pp. 1–50. [Google Scholar]
  4. Rowntree, P.R.; Bolton, J.R. Simulations of the atmospheric response to soil moisture anomalies over Europe. Q. J. R. Meteorol. Soc. 1983, 109, 501–526. [Google Scholar] [CrossRef]
  5. Mahfouf, J.F.; Richard, E.; Mascart, P. The influence of soil and vegetation on the development of mesoscale circulations. J. Clim. Appl. Meteorol. 1987, 26, 1483–1495. [Google Scholar] [CrossRef]
  6. Avissar, R.; Pielke, R.A. A parameterization of heterogeneous land surfaces for atmospheric numerical models and its impact on regional meteorology. Mon. Weather. Rev. 1989, 117, 2113–2136. [Google Scholar] [CrossRef]
  7. Chen, F.; Avissar, R. Impact of land-surface moisture variability on local shallow convective cumulus and precipitation in large-scale models. J. Appl. Meteorol. 1994, 33, 1382–1401. [Google Scholar] [CrossRef]
  8. Ament, F.; Simmer, C. Improved representation of land-surface heterogeneity in a non-hydrostatic numerical weather prediction model. Bound. Layer Meteorol. 2006, 121, 153–174. [Google Scholar] [CrossRef]
  9. Ozdogan, M.; Rodell, M.; Beaudoing, H.K.; Toll, D.L. Simulating the effects of irrigation over the United States in a land surface model based on satellite-derived agricultural data. J. Hydrometeorol. 2010, 11, 171–184. [Google Scholar] [CrossRef]
  10. Nayak, S.; Mandal, M.; Maity, S. Customization of regional climate model (RegCM4) over Indian region. Theor. Appl. Climatol. 2017, 127, 153–168. [Google Scholar] [CrossRef]
  11. Maity, S.; Satyanarayana, A.N.V.; Mandal, M.; Nayak, S. Performance evaluation of land surface models and cumulus convection schemes in the simulation of Indian summer monsoon using a regional climate model. Atmos. Res. 2017, 197, 21–41. [Google Scholar] [CrossRef]
  12. Nayak, S.; Mandal, M.; Maity, S. RegCM4 simulation with AVHRR land use data towards temperature and precipitation climatology over Indian region. Atmos. Res. 2018, 214, 163–173. [Google Scholar] [CrossRef]
  13. Mishra, P.; Kannan, S.R.; Radhakrishnan, C. The Effect of Anthropogenic Heat and Moisture on Local Weather at Industrial Heat Islands: A Numerical Experiment. Atmosphere 2022, 13, 357. [Google Scholar] [CrossRef]
  14. Nayak, H.P.; Osuri, K.K.; Sinha, P.; Nadimpalli, R.; Mohanty, U.C.; Chen, F.; Rajeevan, M.; Niyogi, D. High-resolution gridded soil moisture and soil temperature datasets for the Indian monsoon region. Nature Sci. Data 2018, 5, 180264. [Google Scholar] [CrossRef]
  15. Nayak, S.; Mandal, M.; Maity, S. Assessing the impact of Land-use and Land-cover changes on the climate over India using a Regional Climate Model (RegCM4). Clim. Res. 2021, 85, 1–20. [Google Scholar] [CrossRef]
  16. Henderson-Sellers, A. Assessing the sensitivity of a land surface scheme to parameters used in tropical deforestation experiments. Quart. J. Roy. Meteor. Soc. 1992, 118, 11. [Google Scholar] [CrossRef]
  17. Qu, W.A.; Henderson-Sellers, A.; Pitman, J.; Chen, T.H.; Abramopolous, F.; Beljaars, A.C.M.; Boone, A.; Chang, S.; Chen, F.; Dai, Y.; et al. Sensitivity of latent heat fluxes from PILPS land-surface schemes to perturbations of surface air temperature. J. Atmos. Sci. 1998, 55, 1909–1927. [Google Scholar] [CrossRef]
  18. Chen, F.; Manning, K.W.; LeMone, M.A.; Trier, S.B.; Alfieri, J.G.; Roberts, R.; Tewari, M.; Niyogi, D.; Horst, T.W.; Oncley, S.P.; et al. Description and evaluation of the characteristics of the NCAR high-resolution land data assimilation system. J. Appl. Meteorol. Climatol. 2007, 46, 649–713. [Google Scholar] [CrossRef]
  19. Lim, Y.-J.; Byun, K.-Y.; Lee, T.-Y.; Kwon, H.; Hong, J.; Kim, J. A land data assimilation system using the MODIS-derived land data and its application to numerical weather prediction in East Asia. Asia-Pac. J. Atmos. Sci. 2012, 481, 83–95. [Google Scholar] [CrossRef]
  20. Unnikrishnan, C.K.; Rajeevan, M.; Rao, S.V.B.; Kumar, M. Development of a high-resolution land surface dataset for the South Asian monsoon region. Curr. Sci. 2013, 1059, 1235–1246. [Google Scholar]
  21. Wilson, M.F.; Henderson-Sellers, A.; Dickinson, R.E.; Ken nedy, P.J. Sensitivity of the Biosphere-Atmosphere Transfer Scheme (BATS) to the inclusion of variable soil characteristics. J. Climate Appl. Meteor. 1987, 26, 3. [Google Scholar] [CrossRef]
  22. Pitman, A.; Yang, Z.-L.; Henderson-Sellers, A. Sub-grid scale precipitation in AGCMS: Re-assessing the land surface sensitivity using a single column model. Clim. Dyn. 1993, 9, 33–41. [Google Scholar] [CrossRef]
  23. Nayak, H.P.; Sinha, P.; Satyanarayana, A.N.V.; Bhattacharya, A.; Mohanty, U.C. Performance Evaluation of High-Resolution Land Data Assimilation System (HRLDAS) Over Indian Region. Pure Appl. Geophys. 2019, 176, 389–407. [Google Scholar] [CrossRef]
  24. Nayak, S.; Maity, S.; Singh, K.S.; Nayak, H.P.; Dutta, S. Influence of the Changes in Land-Use and Land Cover on Temperature over Northern and North-Eastern India. Land 2021, 10, 52. [Google Scholar] [CrossRef]
  25. Nayak, S.; Maity, S.; Sahu, N.; Saini, A.; Singh, K.S.; Nayak, H.P.; Dutta, S. Application of “Observation Minus Reanalysis” Method towards LULC Change Impact over Southern India. ISPRS Int. J. Geo. Inf. 2022, 11, 94. [Google Scholar] [CrossRef]
  26. Berg, A.A.; Famiglietti, J.S.; Walker, J.P.; Houser, P.R. Impact of bias correction to reanalysis products on simulations of North American soil moisture and hydrological fluxes. J. Geophys. Res. 2003, 108, 4490. [Google Scholar] [CrossRef]
  27. Stoyanova, J.; Georgiev, C.; Neytchev, P.; Kulishev, A. Spatial-Temporal Variability of Land Surface Dry Anomalies in Climatic Aspect: Biogeophysical Insight by Meteosat Observations and SVAT Modeling. Atmosphere 2019, 10, 636. [Google Scholar] [CrossRef]
  28. Vousdoukas, M.; Mentaschi, L.; Voukouvalas, E.; Verlaan, M.; Jevrejeva, S.; Jackson, L.; Feyen, L. Validation of the North American Land Data Assimilation System (NLDAS) retrospective forcing over the southern Great Plains. J. Geophys. Res. 2003, 108, 8843. [Google Scholar]
  29. Maurer, E.P.; O’Donnell, G.M.; Lettenmaier, D.P.; Roads, J.O. Evaluation of the land surface water budget in NCEP/NCAR and NCEP/DOE reanalyses using an off-line hydrologic model. J. Geophys. Res. 2001, 106, 17841–17862. [Google Scholar] [CrossRef]
  30. Maity, S.; Nayak, S.; Singh, K.S.; Nayak, H.P.; Dutta, S. Impact of Soil Moisture Initialization in the Simulation of Indian Summer Monsoon Using RegCM4. Atmosphere 2021, 12, 1148. [Google Scholar] [CrossRef]
  31. Chen, F.; Mitchell, K.; Schaake, J.; Xue, Y.; Pan, H.-L.; Koren, V.; Duan, Q.; Ek, M.; Betts, A. Modeling of land–surface evaporation by four schemes and comparison with FIFE observations. J. Geophys. Res. 1996, 101, 7251–7268. [Google Scholar] [CrossRef]
  32. Ek, M.B.; Mitchell, K.E.; Lin, Y.; Rogers, E.; Grunmann, P.; Koren, V.; Gayno, G.; Tarpley, J.D. Implementation of Noah land surface model advances in the National Centers for Environmental Prediction operational mesoscale Eta model. J. Geophys. Res. 2003, 108, 8851. [Google Scholar] [CrossRef]
  33. Mahrt, L.; Ek, M. The influence of atmospheric stability on potential evaporation. J. Appl. Meteorol. Climatol. 1984, 23, 222–234. [Google Scholar] [CrossRef]
  34. Mahrt, L.; Pan, H.L. A two-layer model of soil hydrology. Bound. Layer Meteorol. 1984, 29, 1–20. [Google Scholar] [CrossRef]
  35. Pan, H.L.; Mahrt, L. Interaction between soil hydrology and boundary-layer development. Bound. Layer Meteorol. 1987, 38, 185–202. [Google Scholar] [CrossRef]
  36. Koren, V.; Schaake, J.; Mitchell, K.; Duan, Q.Y.; Chen, F. A parameterization of snowpack and frozen ground intended for NCEP weather and climate models. J. Geophys. Res. 1999, 104, 19569–19585. [Google Scholar] [CrossRef]
  37. Koster, R.D.; Dirmeyer, P.A.; Guo, Z.; Bonan, G.; Chan, E.; Cox, P.; Gordon, C.T.; Kanae, S.; Kowalczyk, E.; Lawrence, D.; et al. Regions of strong coupling between soil moisture and precipitation. Science 2004, 305, 1138–1140. [Google Scholar] [CrossRef]
  38. Nayak, H.P.; Sinha, P.; Mohanty, U.C. Incorporation of surface observations in the LDAS and application to mesoscale simulation of pre-monsoon thunderstorms. Pure Appl. Geophys. 2021, 178, 565–582. [Google Scholar] [CrossRef]
  39. Vergopolan, N.; Sheffield, J.; Chaney, N.W.; Pan, M.; Beck, H.E.; Ferguson, C.R.; Torres-Rojas, L.; Eigenbrod, F.; Crow, W.; Wood, E.F. High-resolution soil moisture data reveal complex multi-scale spatial variability across the United States. Geophys. Res. Lett. 2022, 49, e2022GL098586. [Google Scholar] [CrossRef]
  40. Budyko, M.I. Climate and Life; Academic: Orlando, FL, USA, 1974. [Google Scholar]
  41. Seneviratne, S.I.; Koster, R.; Guo, Z.; Dirmeyer, P.; Kowalczyk, E.; Lawrence, D.; Liu, P.; Mocko, D.; Lu, C.-H.; Oleson, K.W.; et al. Soil moisture memory in AGCM simulations: Analysis of Global Land–Atmosphere Coupling Experiment (GLACE) data. J. Hydrometeor. 2006, 7, 1090–1112. [Google Scholar] [CrossRef]
  42. Seneviratne, S.I.; Corti, T.; Davin, E.L.; Hirschi, M.; Jaeger, E.B.; Lehner, I.; Orlowsky, B.; Teuling, A.J. Investigating soil moisture−climate interactions in a changing climate:a review. Earth Sci Rev. 2010, 99, 125−161. [Google Scholar] [CrossRef]
  43. Li, M.; Ma, Z. Sensible and Latent Heat Flux Variability and Response to Dry–Wet Soil Moisture Zones Across China. Bound. Layer Meteorol. 2015, 154, 157–170. [Google Scholar] [CrossRef]
  44. Webb, E.K.; Pearman, G.I.; Leuning, R. Correction of flux measurements for density effects due to heat and water-vapor transfer. Q J R Meteorol Soc. 1980, 106, 85–100. [Google Scholar] [CrossRef]
  45. Fuehrer, P.L.; Friehe, C.A. Flux corrections revisited. Bound. Layer Meteorol. 2002, 102, 415–457. [Google Scholar] [CrossRef]
  46. Kara, A.B.; Rochford, P.A.; Hurlburt, H.E. Air-sea flux estimates and the 1997-1998 ENSO event. Bound. Layer Meteorol. 2002, 103, 439–458. [Google Scholar] [CrossRef]
Figure 1. (a) Annual volumetric soil moisture (m3 m−3) content obtained from the control experiments during 2013; (bd) are the same as (a) but for MAM, JJA, and OND, respectively.
Atmosphere 13 01382 g001
Figure 2. Annual soil moisture change (%) in each positive sensitive experiment compared to the control experiment during the year 2013.
Atmosphere 13 01382 g002
Figure 3. Annual soil moisture change (%) averaged over Indian regions from all the sensitive experiments.
Atmosphere 13 01382 g003
Figure 4. Soil moisture change (%) during MAM in each positive sensitive experiment compared to the control experiment during the year 2013.
Atmosphere 13 01382 g004
Figure 5. Soil moisture change (%) during JJA in each positive sensitive experiment compared to the control experiment during the year 2013.
Atmosphere 13 01382 g005
Figure 6. Soil moisture change (%) during OND in each positive sensitive experiment compared to the control experiment during the year 2013.
Atmosphere 13 01382 g006
Figure 7. Annual soil temperature change (ºC) averaged over the Indian landmass from each sensitive experiment.
Atmosphere 13 01382 g007
Figure 8. Annual sensible heat flux change (W/m2) due to the positive sensitive experiments compared to the control experiment during the year 2013.
Atmosphere 13 01382 g008
Figure 9. Sensible heat flux change (W/m2) averaged over the Indian region from all the sensitive experiments. (a) Annual, (b) MAM, (c) JJA, and (d) OND.
Atmosphere 13 01382 g009
Figure 10. Annual latent heat flux change (W/m2) due to the positive sensitive experiments compared to the control experiment during the year 2013.
Atmosphere 13 01382 g010
Figure 11. Latent heat flux change (W/m2) averaged over the Indian region from all the sensitive experiments. (a) Annual, (b) MAM, (c) JJA, and (d) OND.
Atmosphere 13 01382 g011
Table 1. Data used.
Table 1. Data used.
DataSources
Land use20 category 30 s resolution MODIS land use
Green vegetation fractionMODIS fpar 0.00833º resolution green vegetation fraction
Atmospheric forcingMERRA hourly data at (1/2° × 2/3°) resolution (air temperature, specific humidity, pressure, U wind, V wind)
Precipitation TRMM hourly precipitation at 0.25° resolution
RadiationECMWF 3 hourly solar radiation at 0.25° resolution
Table 2. Numerical experiment conducted.
Numerical ExperimentPerturbed ParameterOther Forcing Parameters
Control experimentThe forcing parameters used are as provided in Table 1.
(No parameters are perturbed)
T2 + 1% 2 m temperature increased by 1%Other forcing parameters remained the same as in the control experiment.
T2 − 1%2 m temperature decreased by 1%
Rn + 20%Rainrate increased by 20%
Rn − 20%Rainrate decreased by 20%
SW + 20%SW radiation increased by 20%
SW − 20%SW radiation decreased by 20%
LW + 20%LW radiation increased by 20%
LW − 20%LW radiation decreased by 20%
U + 20%10 m wind speed increased by 20%
U − 20%10 m wind speed decreased by 20%
Q2 + 20%2 m specific humidity increased by 20%
Q2 − 20%2 m specific humidity decreased by 20%
Publisher’s Note: MDPI stays neutral with regard to jurisdictional claims in published maps and institutional affiliations.

