Article

Study on Strategies to Implement Adaptation Measures for Extreme High Temperatures into the Street Canyon

1
Department of Architecture, Graduate School of Engineering, Kobe University, Kobe 657-8501, Japan
2
Technical Management Division, Construction Bureau, Kobe 650-8570, Japan
*
Author to whom correspondence should be addressed.
Atmosphere 2022, 13(6), 946; https://doi.org/10.3390/atmos13060946
Submission received: 12 May 2022 / Revised: 2 June 2022 / Accepted: 7 June 2022 / Published: 10 June 2022
(This article belongs to the Special Issue Strategies for Mitigation and Adaptation to Urban Heat)

Abstract

:
The purpose of this study is to evaluate the potential for using the spaces integrating the roads and sidewalks in the street canyon as human-centered spaces, and to investigate more appropriate measures to improve the thermal environment for pedestrians and visitors in these spaces. Based on the spatial distribution of SET* throughout the day, as possible human-centered street space uses, north–south streets with restricted widths and south sidewalks on east–west streets are candidates. Spatiotemporal distributions of SET* were calculated when water was sprinkled on the road surface in the street canyon and when water surface, sunshade, and trees were introduced in the street canyon. Assuming people walk or stay on the water surface, the MRT decreases, causing SET* to be below 31.5 °C at any time, so if a continuous supply of water is guaranteed and people can approach the water surface, the water surface can be expected to have a significant impact anywhere at any time. On the east–west street, shading by sunshades and trees occurs along the lanes at any time, allowing pedestrians moving through the lanes to pass through the shaded areas on a periodic cycle. On north–south street, the time required for the countermeasures is limited to around noon, so the measure is effective even if the shade does not occur in the target lanes only around noon.

1. Introduction

Based on the experience of the extreme high temperature (heatwave) of the summer in recent years, Kobe city has been studying and implementing several adaptation measures for extreme high temperatures. The authors [1] evaluated the effects of watering on road, sunshade with mist spray, water surface, watering on pavement, and mist spray in a park on improving thermal environment using thermal environment index Standard New Effective Temperature (SET*) based on the demonstration experiments. As a demonstration of cool spots in outdoor spaces, the effect of fractal sunshades with fine mist spray was measured in the plaza in front of a famous department store and on the north–south street in front of a central train station in the summer of 2019. Two vehicles with water tanks sprinkled 32 tons of water on 25.8 ha of downtown streets every day except rainy days in the summer of 2020. By watering on the roadway when the surface temperature was above 40 °C, the maximum reduction in surface temperature, mean radiant temperature (MRT) and SET* were about 10 °C, 1.9 °C and 0.8 °C, respectively. When the incident solar radiation to the human body was shielded by the sunshade, the reduction in MRT and SET* were about 15 °C and 7 °C, respectively. The reduction of surface temperature by the water surface in a park was about 15 °C, which was larger than that by watering on the pavement. However, the reduction of MRT and SET* at the center of the sidewalk 3.75 m away from the water surface was about 0.2 °C and 0.1 °C, respectively. Air temperature decrease and relative humidity increase in the vicinity of the mist outlets were about 1 °C and 1%, respectively. When the human body got wet, MRT and SET* decreases were large, ranging from 2.9 to 19.4 °C, and 1.2 to 8.2 °C, respectively. The improvement of human thermal sensation varies depending on the distance from the countermeasure technologies to the human body.
The Japanese Ministry of the Environment developed the “Heat countermeasure guideline in the city” [2], which includes basic, specific adaptation measures, and technical sections. The Japanese Ministry of Land, Infrastructure, Transport and Tourism is promoting various initiatives for the reconstruction and utilization of street space [3]. It is recommended to reconstruct the street space from a car-centered space to a “human-centered” space. The integrated use of roads and sidewalks as places where people can gather, enjoy recreation, and engage in a variety of activities will be promoted in the future. The development of a countermeasure strategy for extreme high temperatures in the street canyon is urgently needed to promote this policy.
Various strategies have been developed to mitigate the negative effects of extreme temperatures, including solar shading, urban ventilation, and mist spray [4]. Several studies have been implemented in various countries focusing on effective countermeasures against heat waves [5,6,7,8,9,10]. The issues of thermal sensation evaluation have been organized and specific measures have been discussed [11,12,13,14]. Studies have also been conducted on numerical models to evaluate thermal sensation [15,16,17,18]. Using those models, the effectiveness of various techniques for heat mitigation has been evaluated [19,20,21,22,23,24,25]. According to a report from Karlsruhe city [26], it is recommended that appropriate adaptation measures be introduced in “hot spots” where temperatures are high. Several typical urban districts with the potential for adaptation measures to be promoted in the future are highlighted. Appropriate strategies should be applied according to the characteristics of each location. Urban climate maps are an effective tool for identifying where countermeasures are needed as well as for assessing which adaptation techniques should be applied in each location [27,28].
The authors [29] used detailed calculations with GIS building shape data to derive a thermal environment map in the street canyon and examined its effectiveness for implementing extreme temperature countermeasures. The influence of MRT rather than wind velocity dominates the SET* distribution on a typical summer day in the street canyon, and solar radiation shading is more effective in suppressing daytime SET* rise than land cover improvement. In the previous study, evaluation and improvement of the thermal environment was discussed for pedestrians on the sidewalk. In this study, we assume that the sidewalk and the roadway are used as a unified human-centered space and discuss the possibility of use and the necessity of improvement from the viewpoint of the thermal environment for pedestrians and visitors. The purpose of this study is to evaluate the potential for using the spaces integrating the roads and sidewalks in the street canyon as human-centered spaces, and to investigate more appropriate measures to improve the thermal environment for pedestrians and visitors in these spaces.

2. Calculation Methods and Results
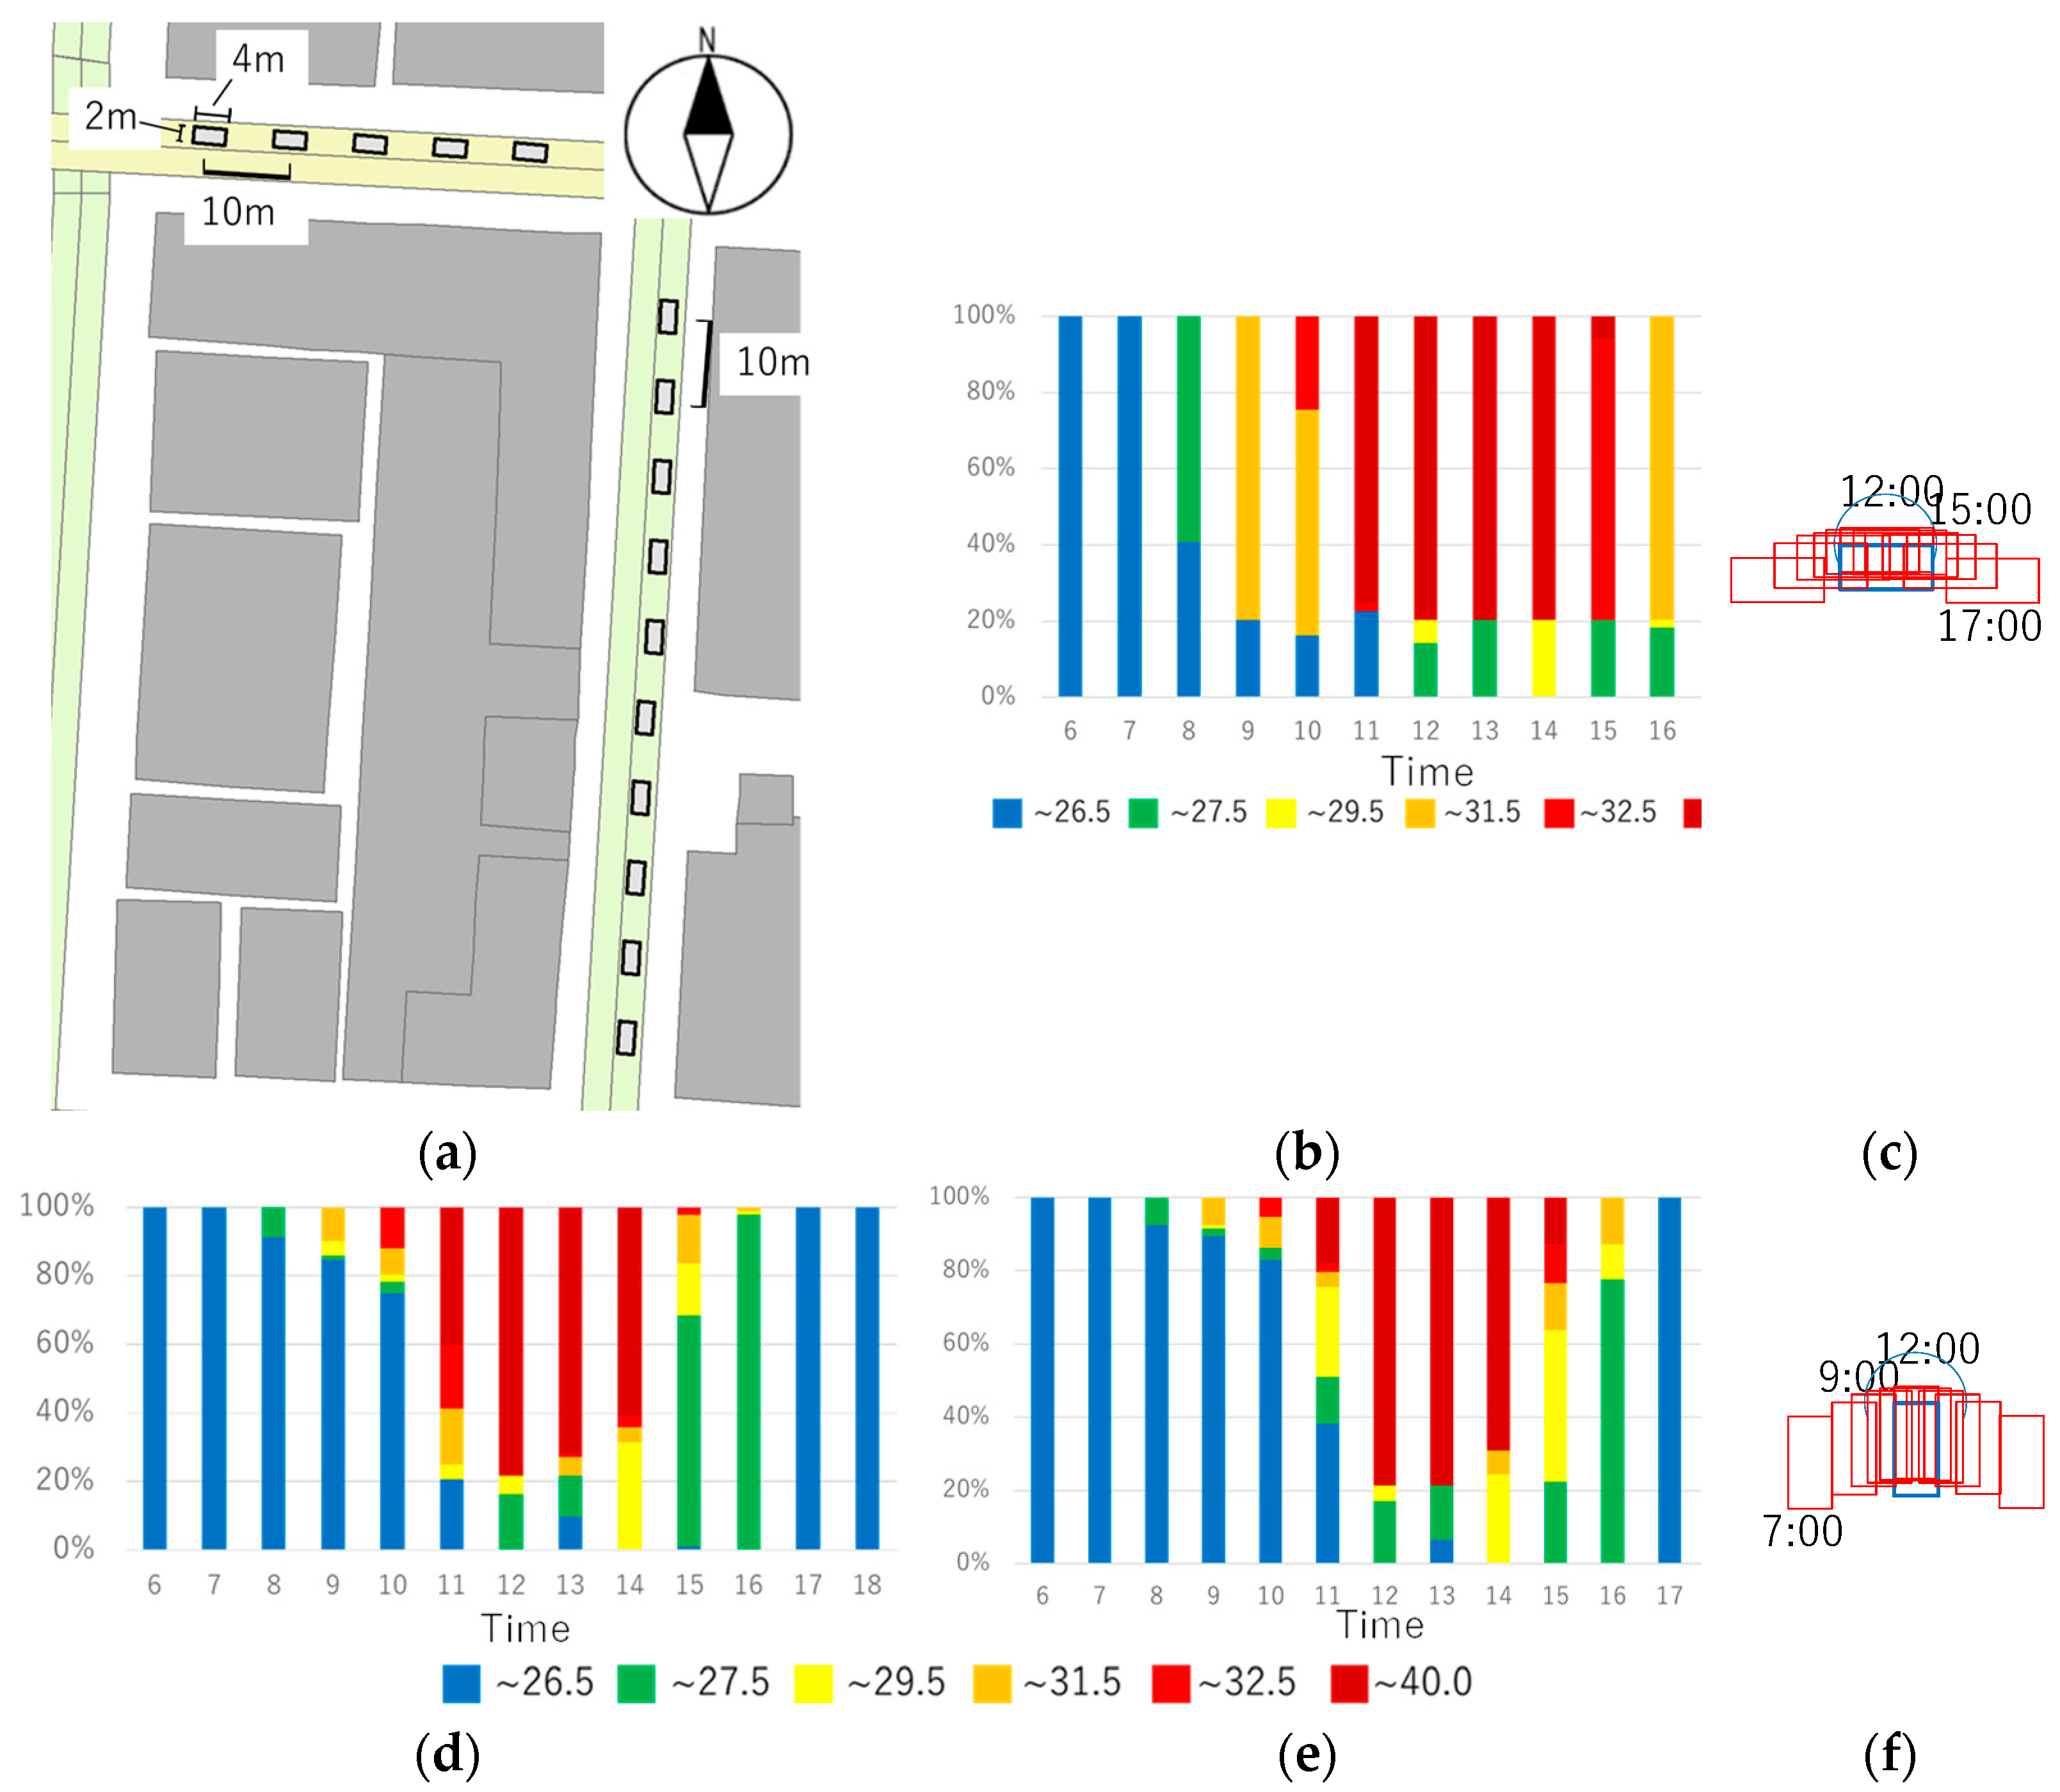
The calculation method is the same as in previous studies by the authors [29]. Surface temperatures on the ground and wall are calculated based on the following surface heat budget equation.
S + R = V + A + l E ,
S = ( 1 ρ ) J ,
R = R ε σ T s 4 ,
V = α c ( θ s θ a ) ,
A = λ θ z ,
l E = l β α w ( X s X a ) ,
R = σ T a 4 ( 0.526 + 0.208 P ) ,
α c = { 5.3 + 3.6 u     ( u 5.0 ) 6.47 u 0.78         ( u 5.0 ) ,
where S is solar radiation [W/m2], R is infrared radiation [W/m2], V is sensible heat flux [W/m2], A is conduction heat flux [W/m2], and lE is latent heat flux [W/m2]. ρ is solar reflectance [-]. J [W/m2] is incident solar radiation, which is calculated based on the spatial distribution of solar radiation using ArcGIS and building shape data, as per the method described by Takebayashi et al. [30]. R↓ [W/m2] is calculated by Brunt’s formula (Equation (7)) using air temperature and relative humidity. ε is emissivity [-]. σ is Stefan–Boltzmann constant (=5.67 × 10⁻⁸ [W/(m2K4)]). Ts and Ta are surface and air temperature [K]. P is water vapor pressure of air [kPa]. Ac is convection heat transfer coefficient [W/(m2K)] which is calculated by Jürges formula (Equation (8)) using wind velocity u [m/s]. θs and θa are surface and air temperature [°C]. λ is heat conductivity of surface material [W/(mK)]. Θ [°C] is temperature in surface material, which is calculated by solving an unsteady one-dimensional heat conduction equation, to take thermal mass into account. l is latent heat of water (=2500 [kJ/kg]). β is evaporative efficiency [-]. αw is convection moisture transfer coefficient [kg/(m2s(kg/kg’))], which is calculated by the Lewis relation formula using αc and specific heat of air. Xs and Xa are air absolute humidity and surface absolute humidity [kg/kg’]. Parameters for the surface heat budget equation and heat conduction equation are shown in Table 1. Surface temperature is calculated by substituting these parameters into the above equations, under conditions air temperature, air absolute humidity, underground temperature, and convection heat and moisture transfer coefficients of the function of wind velocity are set by the observation values as boundary conditions.

2.1. Objective Area

MRT is calculated by incident solar and infrared radiation to human body, which is calculated by surrounding surface temperature and view factors between the human body and surrounding surfaces. SET* is calculated by integrating the wind velocity and MRT distributions, by giving air temperature, relative humidity, a clothing amount, and a metabolic rate of the human body. Building shape and classification of the objective road is shown in Figure 1. The objective area is divided into 2 m mesh, and surface materials are set for each mesh. Asphalt, concrete block, and grass are set for the surfaces in the street canyons. The crown width and tree height of each street tree are set by a field survey and Google Earth.
Kobe city is located facing Osaka Bay. The climate is classified as warm and temperate. According to Köppen and Geiger, this climate is classified as Cfa. The average annual temperature is 16.7 °C. The average annual rainfall is 1216 mm.

2.2. Calculation Results

Time change of the ground surface temperature, MRT, and SET* are calculated on a typical summer sunny day, 5 August 2020. Air temperature and relative humidity are given the measurement data by Kobe local meteorological observatory located nearby the objective area. It is assumed that a solar absorption rate, a clothing amount, and a metabolic rate of the human body are 0.5, 0.6 clo, and 1.0 met, respectively, and transmittance of solar radiation of the tree is 0.06.
Distribution of SET* at 1.5 m high at 13:00 on 5 August 2020 is shown in Figure 2. Ground surface temperature is low in the shaded area by the surrounding buildings and trees. Since daily integral incident solar radiation is small in the shaded streets by street trees, surface temperature is low in both east–west and north–south roads. MRT is low in the median strip in some streets and the central park, where incident solar radiation and surrounding surface temperature are low. SET* is more affected by MRT than wind velocity. The calculation results were validated by the measurement results obtained on sunny summer days [29].

3. Results and Discussion

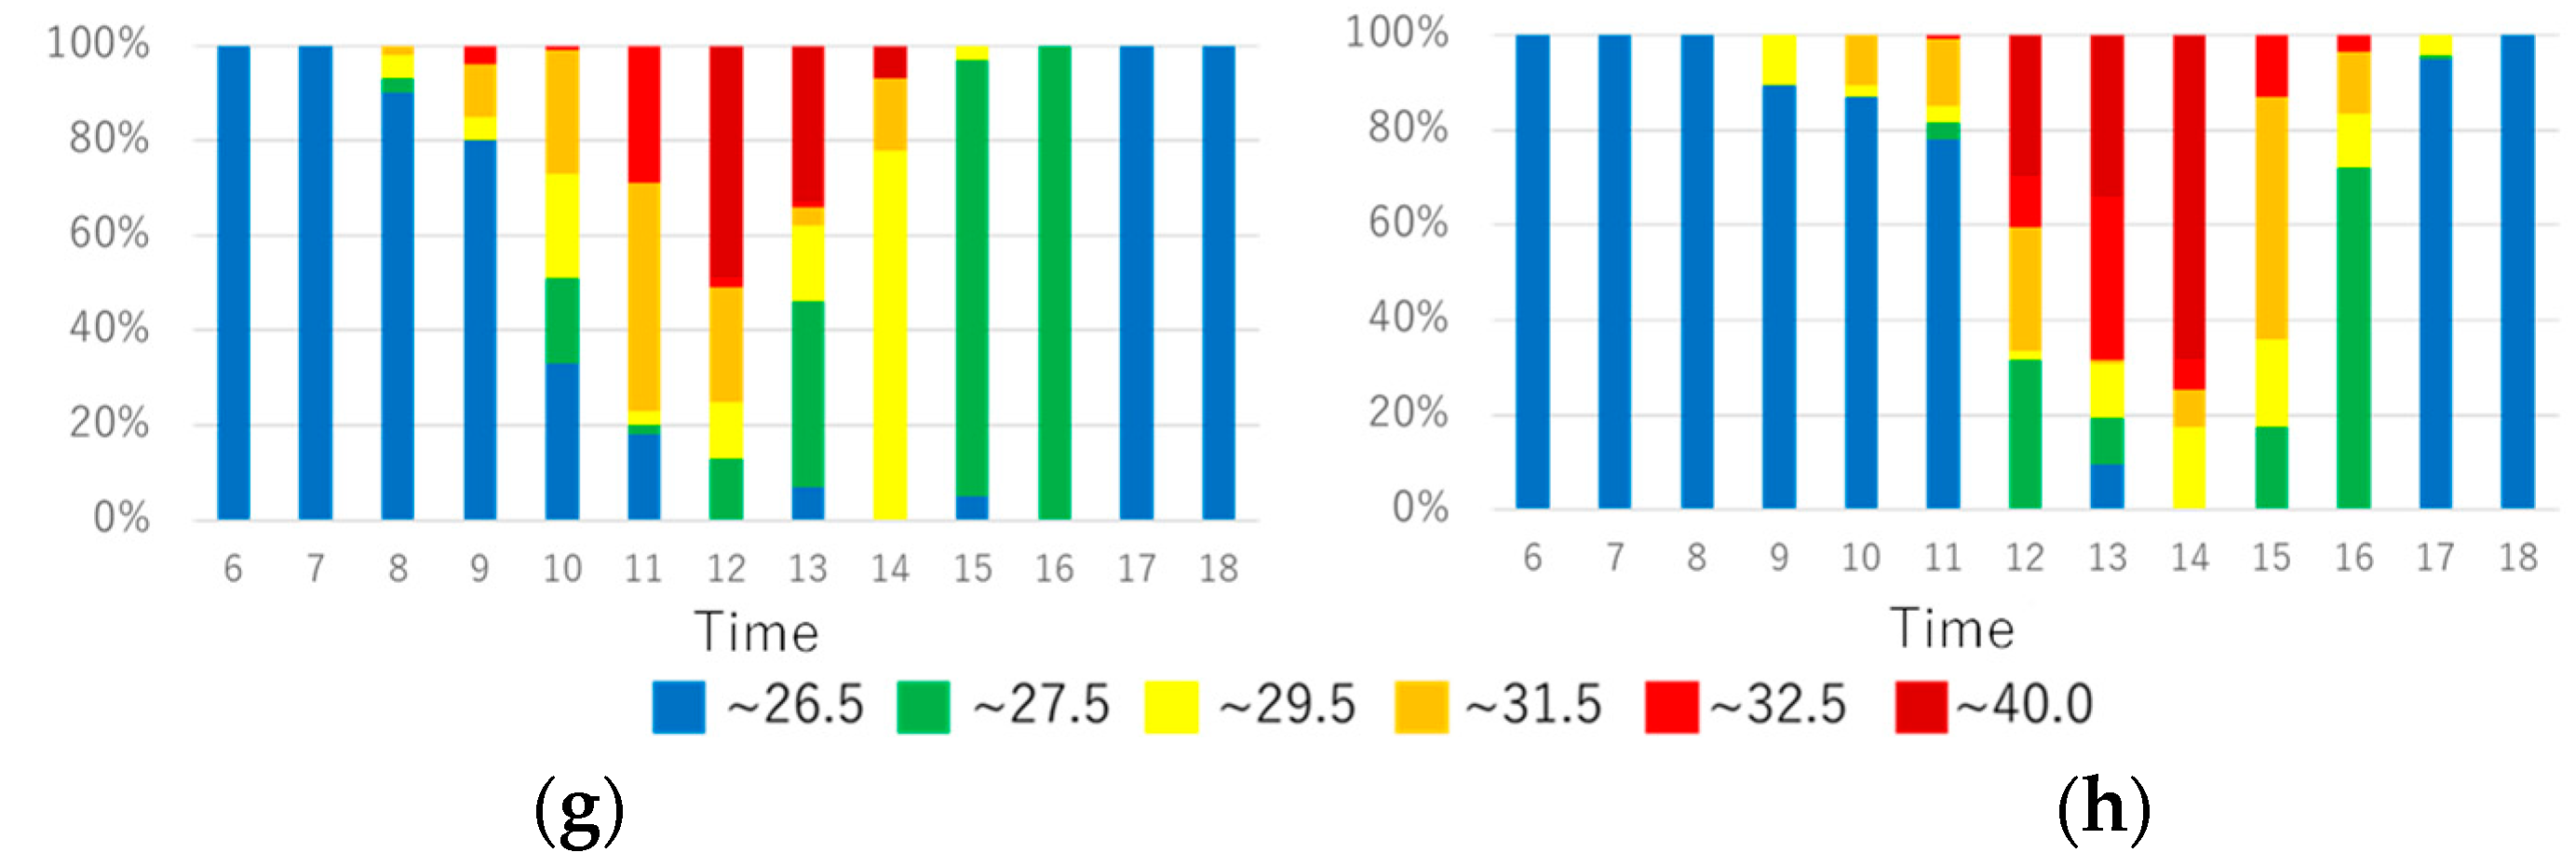
3.1. Spatiotemporal Distribution of SET* in Road Space

Diurnal variations of spatial distribution frequency of SET* at 1.5 m high on east–west road and north–south road on 5 August 2020 are shown in Figure 3 and Figure 4. Based on the relationship between SET* and thermal sensation by Ishii et al. [31], it is uncomfortable if SET* exceeds about 30 °C. It is uncomfortable from 9:00 to 16:00 on east–west roads, while it is limited from 11:00 to 14:00 on north–south roads. It is uncomfortable on all roadways and sidewalks from 11:00 to 14:00 on the north–south road, while there are locations where it is not uncomfortable even from 9:00 to 16:00 on the south side sidewalks on the east–west road. It is possible to find shaded areas on the south side sidewalk of the east–west road even from 9:00 to 16:00, due to the buildings on the south side of the road. However, on the north side sidewalk of the east–west road, it is a severe thermal environment similar to that on the roadway. The overall trend is the same for wide roads with many lanes, with only an increase in the number of lanes with severe thermal environments. The same trend is observed on boulevards, where the orientation slightly shifted from east to west, as on the east–west road. The same trend is observed at the intersection as on the east–west road where the buildings on the south side are low. As for the possibility of human-centered use of road space, a north–south road with a limited width is a candidate, and a sidewalk on the south side of an east–west road is also envisioned.

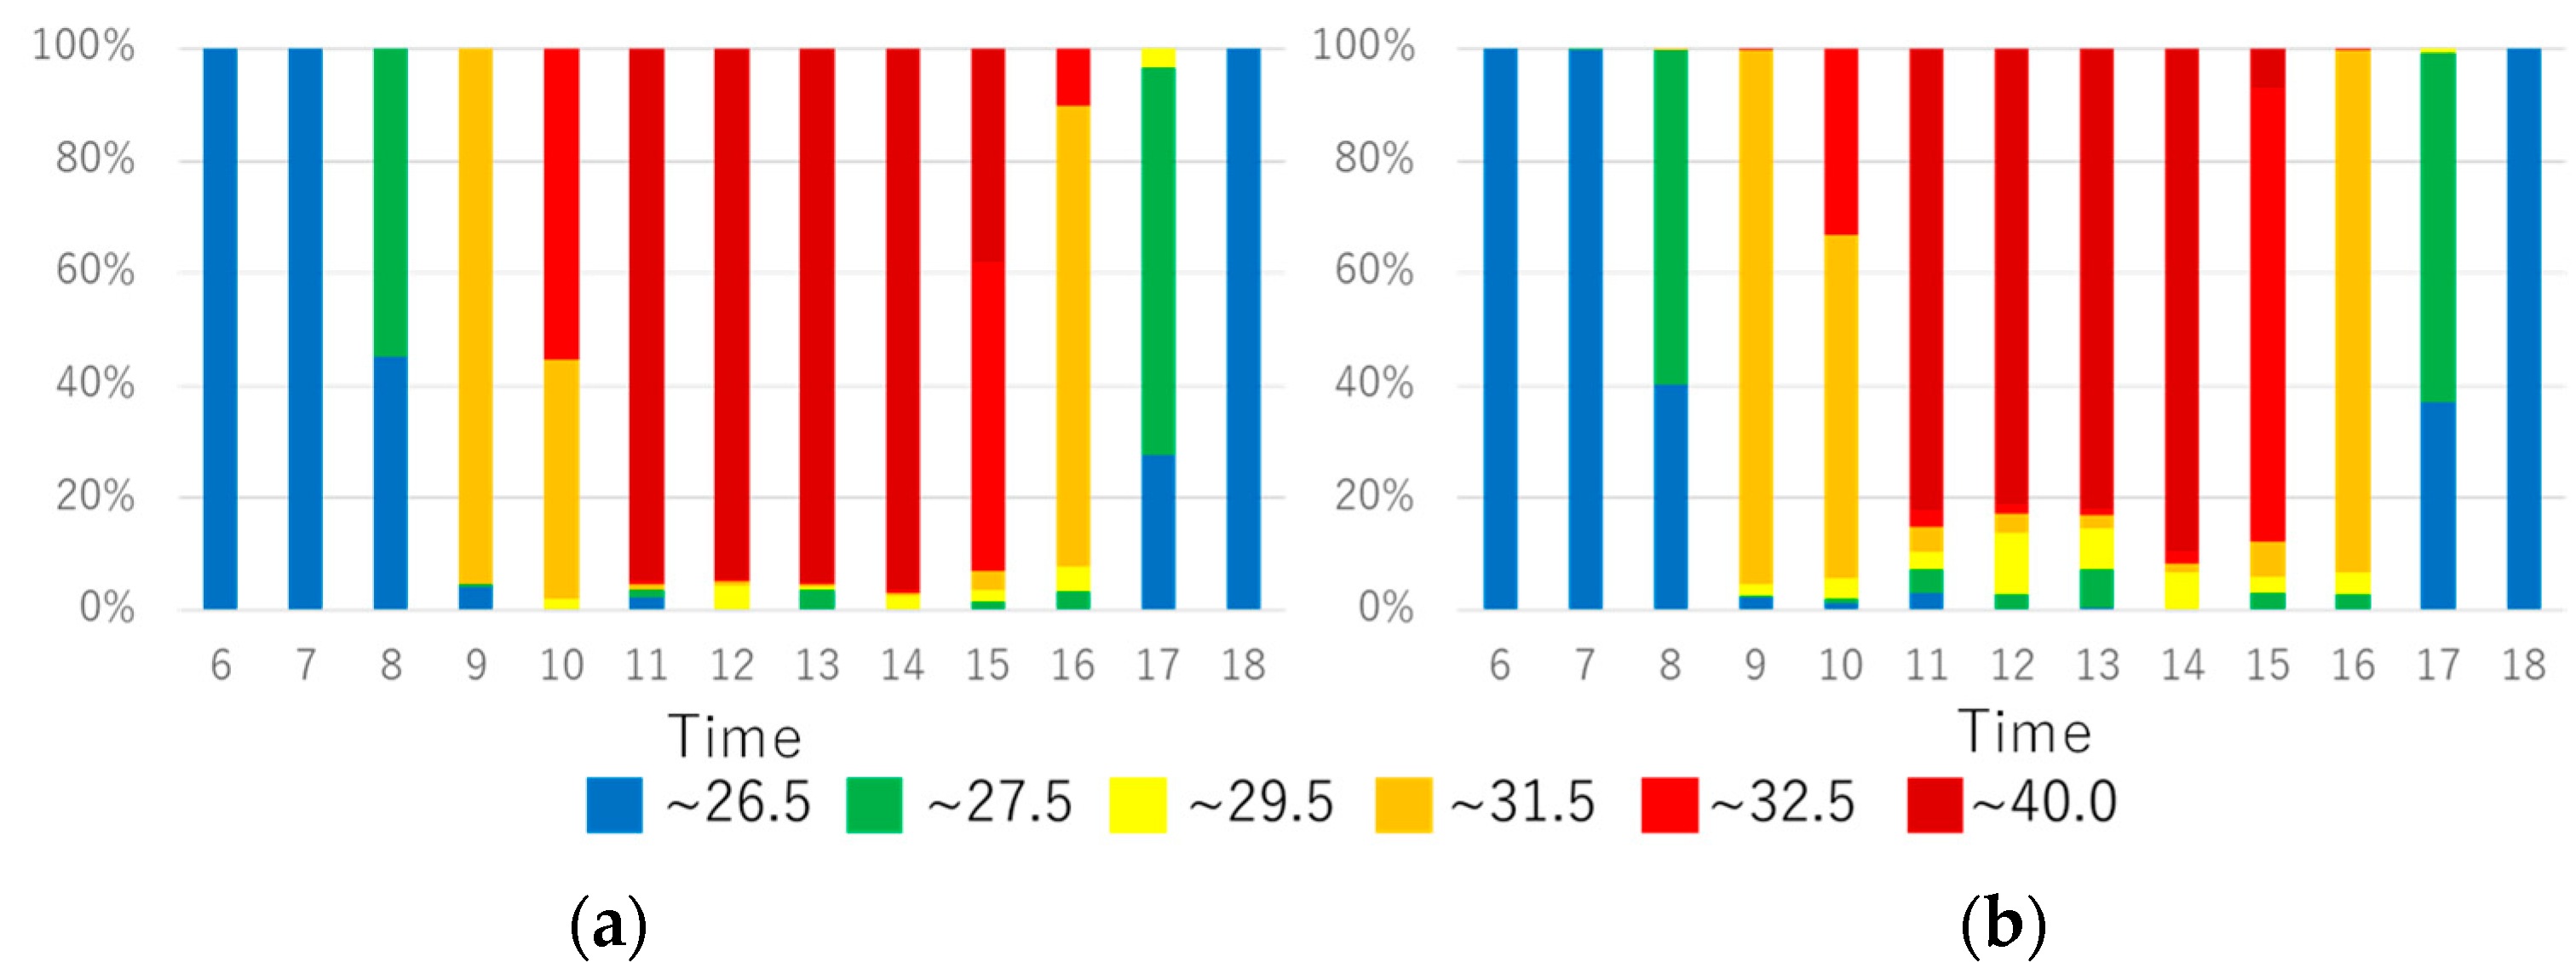
3.2. Effects of Water Sprinkling

When water was sprinkled on the roads, diurnal variations of spatial distribution frequency of SET* at 1.5 m high on east–west road and north–south road on 5 August 2020 were calculated and are shown in Figure 5. Based on the experimental results with sprinkler vehicles, the calculations are carried out with an evaporation efficiency set at 0.15. When the surface temperature is high before water sprinkling, a surface temperature reduction is confirmed greater than 10 °C, and SET* is reduced up to 2 °C. Although the SET* reduction around noon is large, the water sprinkling does not lead to comfortable conditions because the conditions before water sprinkling are quite uncomfortable. Sprinkling water in the evening may increase the number of comfortable spaces.

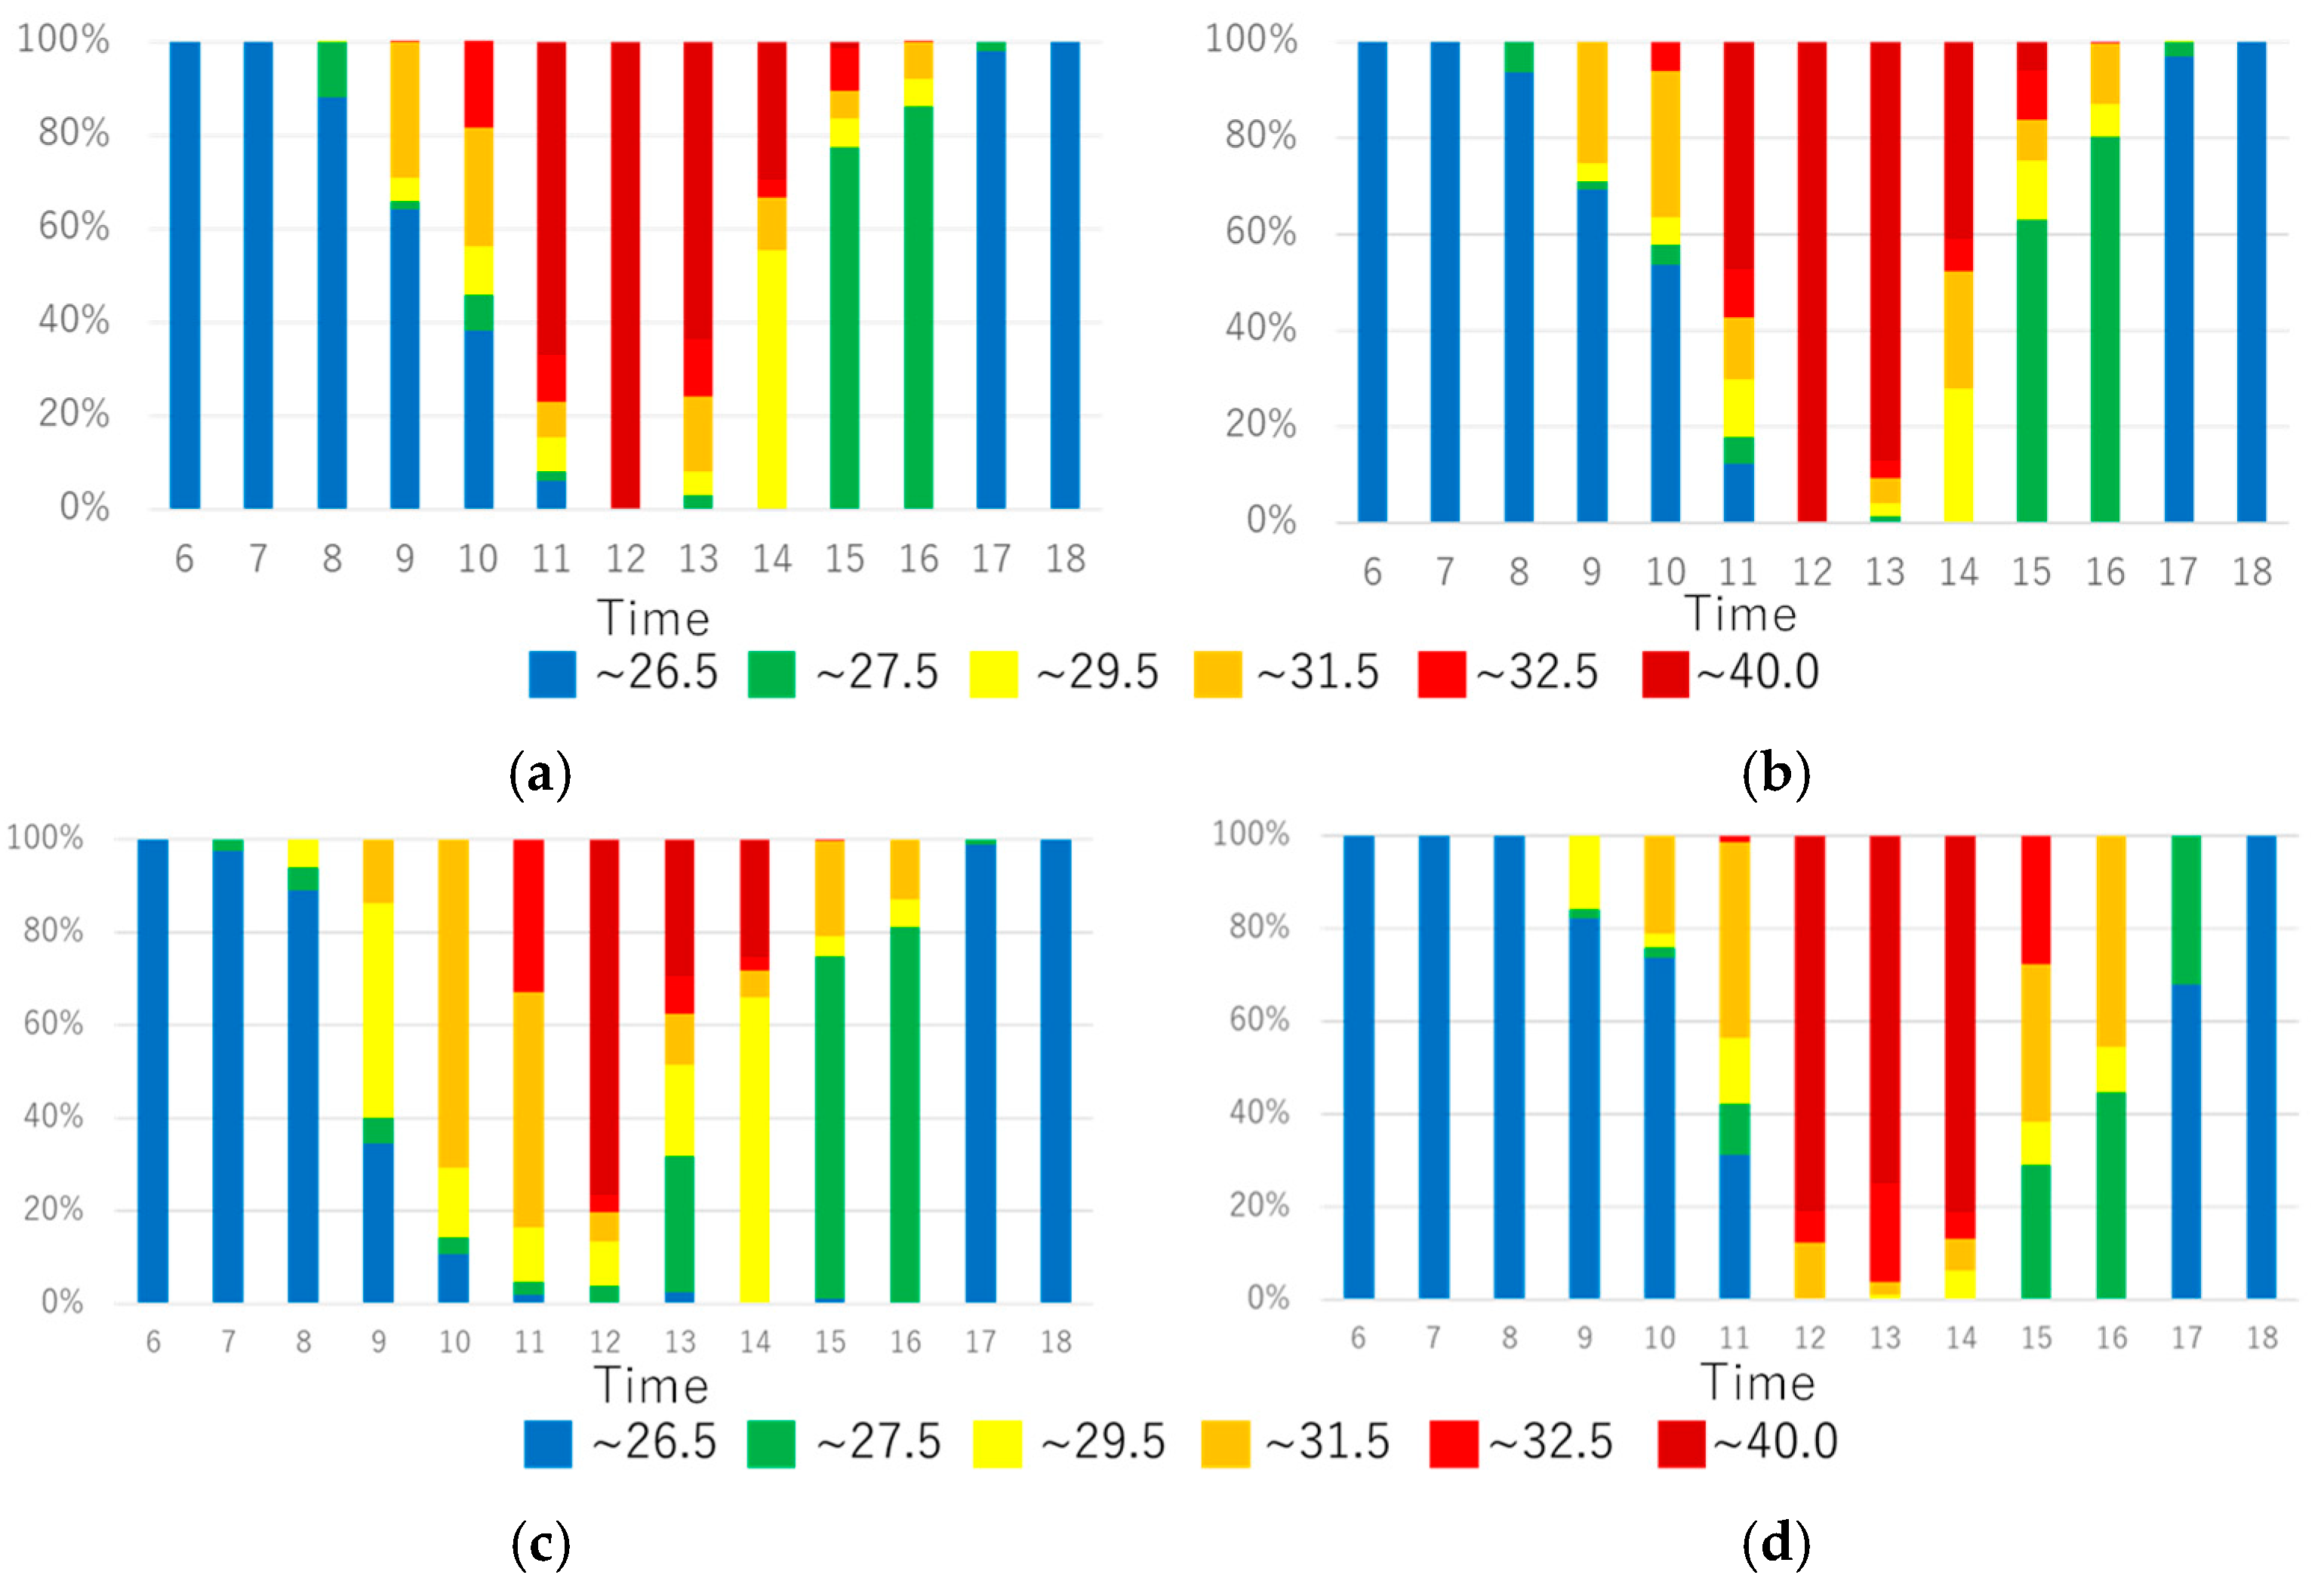
3.3. Effects of Water Surface

When the road surface is covered by a water layer, diurnal variations of spatial distribution frequency of SET* at 1.5 m high on the east–west road and north–south road on 5 August 2020 were calculated and are shown in Figure 6. Based on the experimental results with water surface in a park, it is assumed that the water is supplied at a constant temperature 32 °C. If people are assumed to walk or stay on the water surface, SET* is less than 31.5 °C at any time, due to lower MRT. If a continuous water supply can be guaranteed and people can approach the water surface, the water surface can be expected to have a significant effect at any time and place. Water sprinkling is the effect due to evaporative cooling, whereas water surface is the effect due to the supply of cooler water.

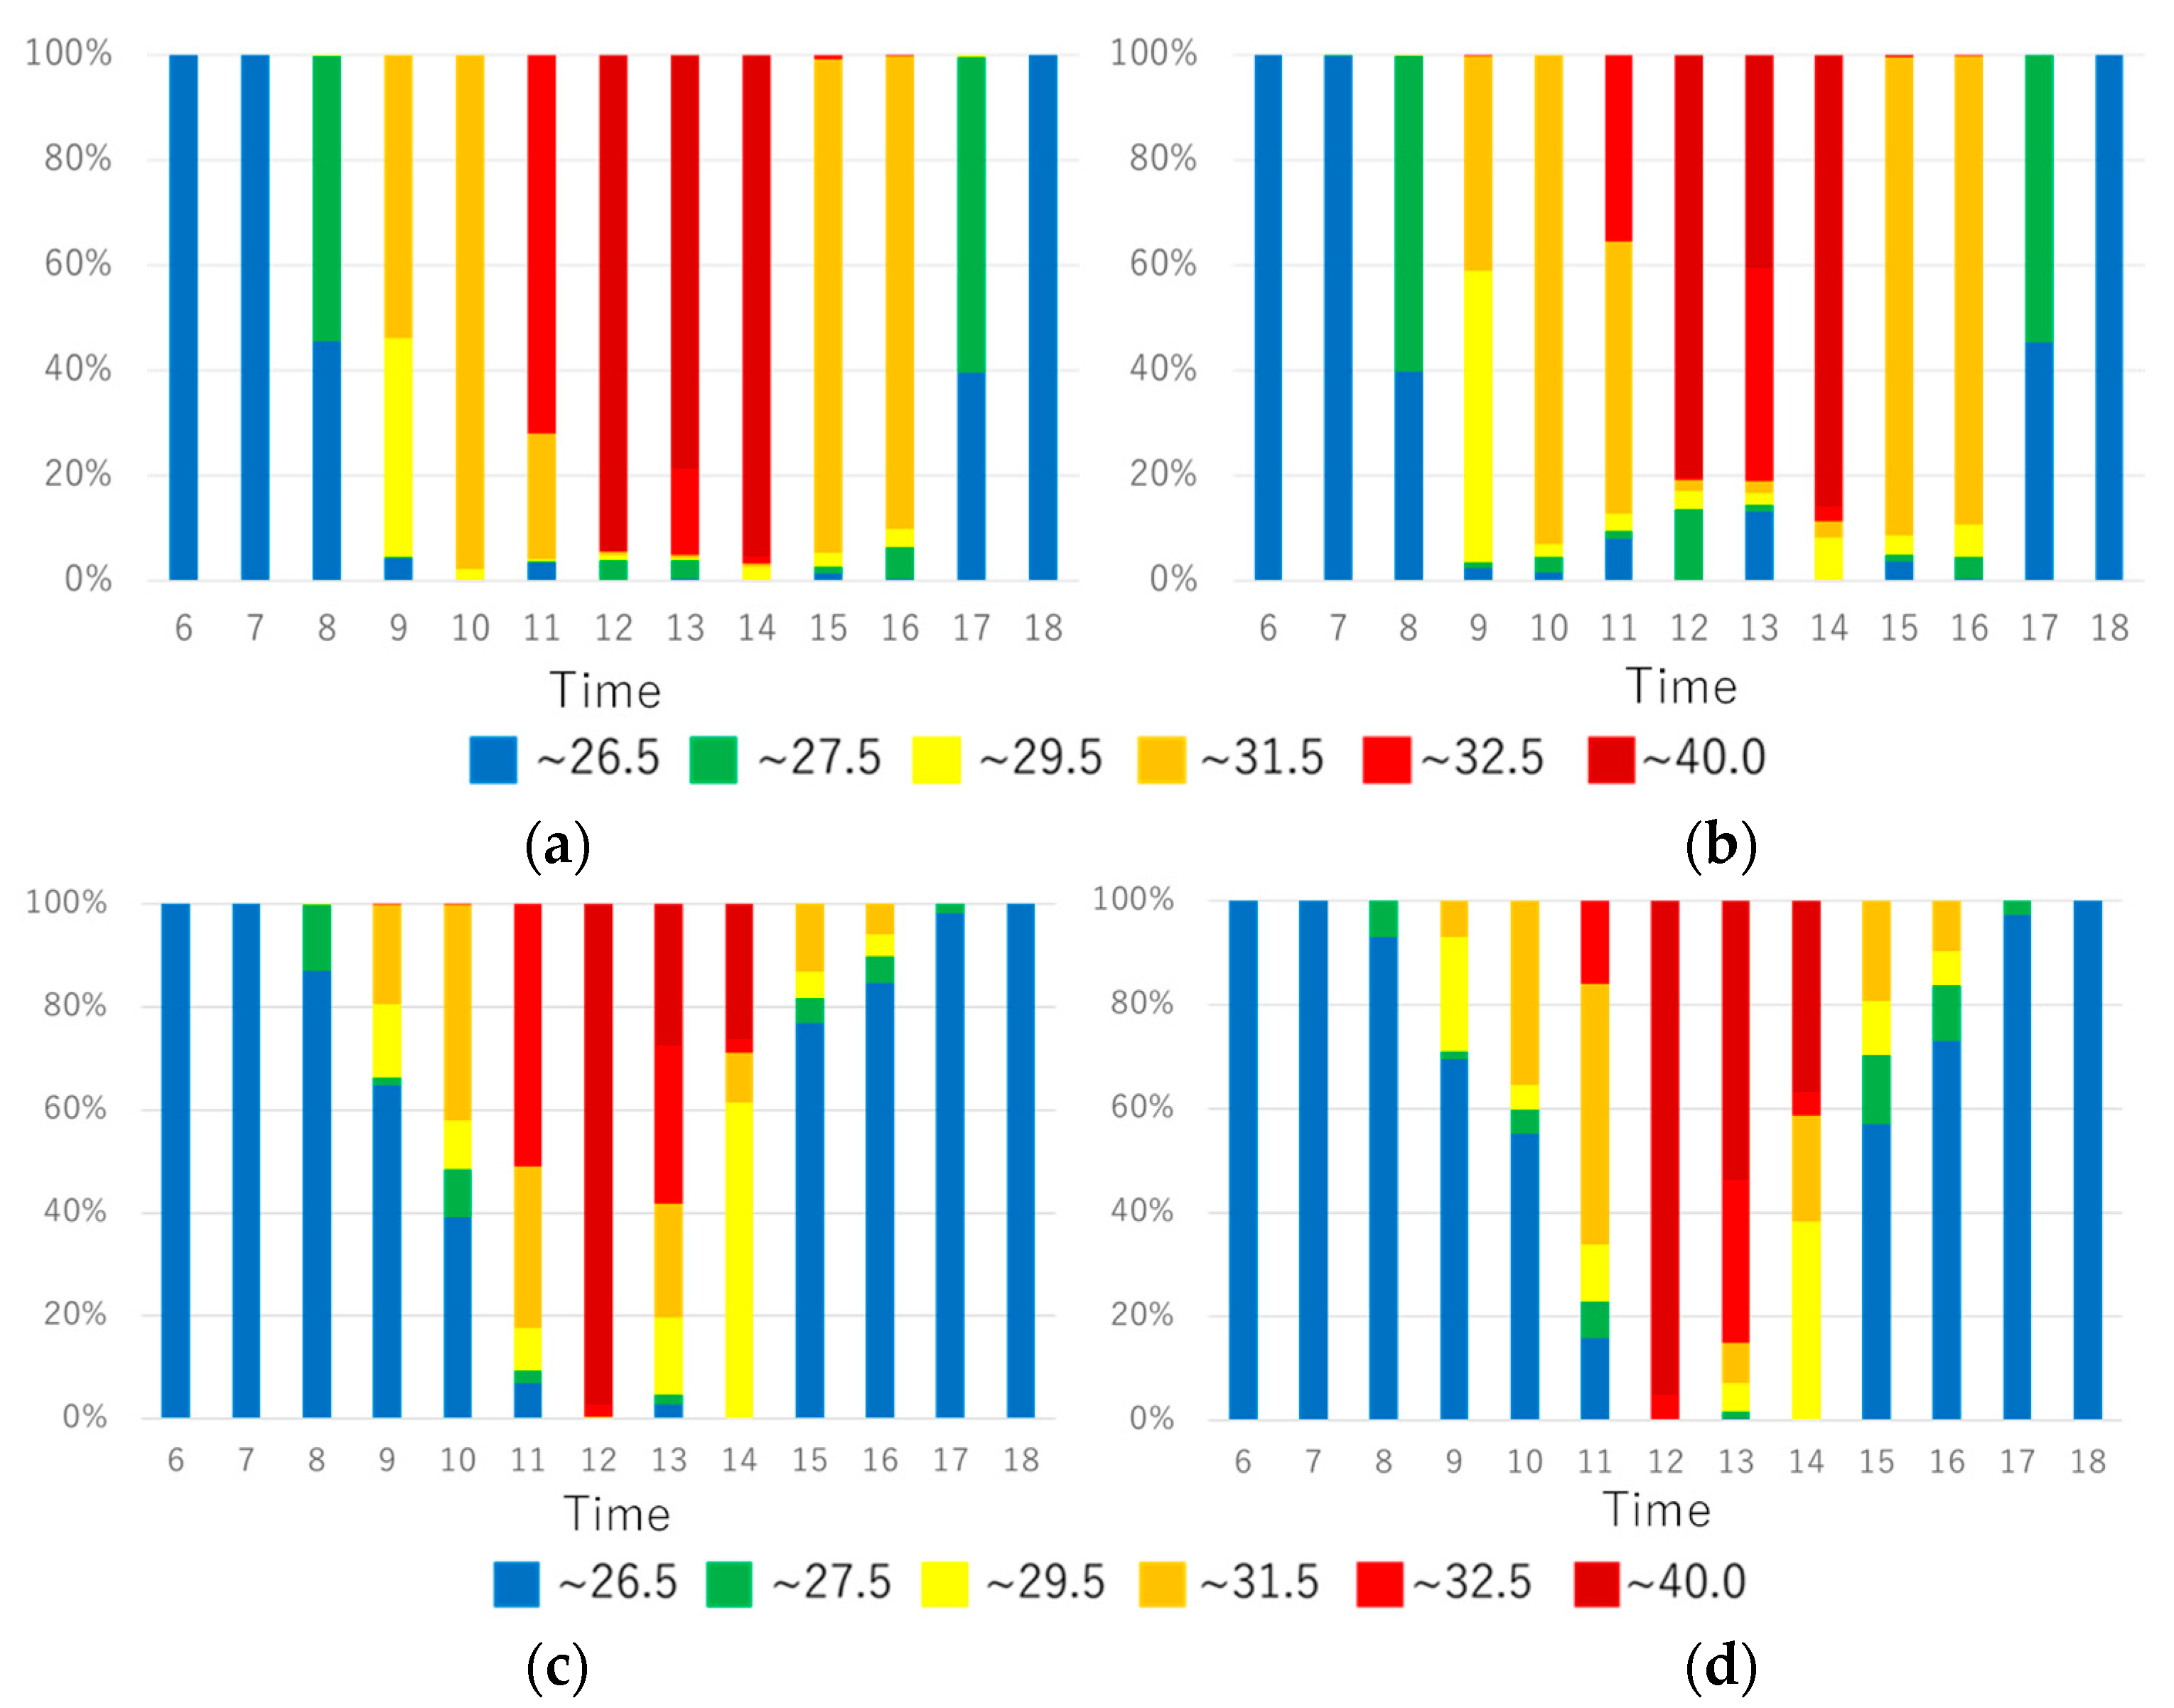
3.4. Effects of Sunshade

When sunshades were installed, diurnal variations of spatial distribution frequency of SET* at 1.5 m high on 5 August 2020 on the east–west road and north–south road were calculated and are shown in Figure 7. 2 m × 4 m sunshades are installed at 10 m intervals along a 3.5 m wide lane. The ratio of sunshade area to the lane area is 23%. SET* decreases by up to 6 °C around noon. On the east–west road, shade occurs along the lane at any time, so that pedestrians moving along the lane can periodically pass through the shade. On the north–south road, the time required for countermeasures is limited to around noon, so shade is effective even if it does not occur in the target lane only around noon. Shade also occurs on the sidewalks of the north–south road at the time required for countermeasures.

3.5. Effects of Street Tree

When street trees are installed, diurnal variation of spatial distribution frequency of SET* at 1.5 m high on 5 August 2020 on east–west road and north–south road were calculated and are shown in Figure 8. Cylindrical canopy with a radius of 2 m and a height of 7 m is set at 3 m to 10 m above the ground surface. When trees are installed at 15 m intervals, the ratio of canopy area to the lane area is 23%, same as for the sunshade. SET* decreases by up to 8.5 °C around noon. On east–west roads, tree shade also occurs along the lane at any time, so that pedestrians moving along the lane can periodically pass through the shade. On the north–south road, the time required for countermeasures is limited to around noon, so shade is effective even if it does not occur in the target lane only around noon.

3.6. Discussion

The potential for using the spaces integrating the roads and sidewalks in the street canyon as human-centered spaces, and the effectiveness of water sprinkling, water surface, sunshade and street tree as a heat mitigation technology were evaluated. Moreover, taking into consideration the results of our previous studies that evaluated the effectiveness of mist spray and other measures [1], we discussed the future countermeasures strategies for the extreme heat with the Kobe city government officers. Since the measures are intended for street spaces, green and cool roofs and green walls are not considered.
Based on the characteristics of the target space, each technology should be selected appropriately in consideration of the following points. The overviews of our discussions are presented below, however, they are not based on scientific evidence, but rather on social perceptions.
-
Regarding mist spray, is it acceptable for mist to wet the human body? It may be acceptable at parks where leisure is the main purpose, but may not be acceptable at bus stops where business is the main purpose.
-
Regarding water surface, is it acceptable to have a walking space on the water surface? It may depend on the condition of the pedestrian’s shoes and clothing.
-
Regarding watering pavement, is it acceptable that the pavement underfoot is wet? It may depend on the condition of the pedestrian’s shoes, etc.
-
Regarding watering road, is it possible to supply water up to the edge of the road? Coordination with roadway management and operations is necessary.
-
Regarding street trees, is it possible to maintain the trees, such as pruning? The understanding and cooperation of neighborhood residents is necessary.
-
Regarding sunshade, is it possible to match the shade area with the location of visitors? Appropriate solar radiation shading should be planned according to the use of the target space.
Kobe City used water from a well for this sprinkling experiment, and plans to use spring water from Mt. Rokko, which is located just north of the city center. In a city like Kobe City, which has water resources in the vicinity of mountains or the sea, there is a possibility of selecting water-based countermeasure technologies. It is important to note that we are not recommending water-based countermeasure technologies for any of the cities. The administrators of each city should select available technologies such as mist spray, water surface, watering pavement, watering road, street trees, sunshade, etc. In many cities around the world, it may not be suitable to use water from the viewpoint of water resources. This study contributes to presenting several possible countermeasure technologies.

4. Conclusions

In the case where street canyons are used as a human-centered space integrating sidewalks and roadways, we discussed the possibility of their use and the need for improvement from the perspective of the thermal environment for pedestrians and visitors. Diurnal variations in the frequency of spatial distribution of SET* at 1.5 m high on east–west and north–south roads on fine summer day are analyzed. Based on the spatial distribution of SET* throughout the day, as possible human-centered street space uses, north–south streets with restricted widths and south sidewalks on east–west streets are candidates. Spatiotemporal distributions of SET* were calculated when water was sprinkled on the road surface in the street canyon and when water surface, sunshade, and trees were introduced in the street canyon. When the surface temperature before watering was high, the reduction in surface temperature due to watering was observed to be more than 10 °C, and SET* was found to be reduced by up to 2 °C. However, assuming people walk or stay on the water surface, the MRT decreases causing SET* to be below 31.5 °C at any time, so if a continuous supply of water is guaranteed and people can approach the water surface, the water surface can be expected to have a significant impact anywhere at any time. Shading by sunshades and trees reduces SET* by up to 6 and 8.5 °C around noon. On the east–west street, shading occurs along the lanes at any time, allowing pedestrians moving through the lanes to pass through the shaded areas on a periodic cycle. On north–south street, the time required for the countermeasures is limited to around noon, so the measure is effective even if the shade does not occur in the target lanes only around noon.
We discussed the future countermeasures strategies for the extreme heat with the Kobe city government officers. We have presented an overview of the discussion, however, it is not based on scientific evidence, but only on social perceptions.

Author Contributions

Conceptualization, H.T. and U.T.; methodology, H.T.; software, H.D.; validation, H.D.; formal analysis, H.D.; investigation, H.T.; resources, H.D.; data curation, H.D.; writing—original draft preparation, H.T.; writing—review and editing, H.T.; visualization, H.D.; supervision, H.T.; project administration, H.T. and U.T.; funding acquisition, H.T. and U.T. All authors have read and agreed to the published version of the manuscript.

Funding

This research was funded by Kobe city as “Research project on measures against extreme temperatures in outdoor public spaces in Kobe City”.

Institutional Review Board Statement

Not applicable.

Informed Consent Statement

Not applicable.

Data Availability Statement

Not applicable.

Acknowledgments

The authors thank Toshiyuki Sano of Kobe city for his cooperation.

Conflicts of Interest

The authors declare no conflict of interest.

References

  1. Takebayashi, H.; Danno, H.; Tozawa, U. Study on appropriate heat mitigation technologies for urban block redevelopment based on demonstration experiments in Kobe city. Energy Build. 2021, 250, 111299. [Google Scholar] [CrossRef]
  2. Heat Countermeasure Guideline in the City. Available online: https://www.wbgt.env.go.jp/pdf/city_gline/city_guideline_full.pdf (accessed on 6 May 2022).
  3. Walkable Portal Site. Available online: https://www.mlit.go.jp/toshi/walkable/ (accessed on 6 May 2022).
  4. Takebayashi, H. A Simple Method to Evaluate Adaptation Measures for Urban Heat Island. Environments 2018, 5, 70. [Google Scholar] [CrossRef] [Green Version]
  5. Broadbent, A.M.; Coutts, A.M.; Tapper, N.J.; Demuzere, M. The cooling effect of irrigation on urban microclimate during heatwave conditions. Urban Clim. 2018, 23, 309–329. [Google Scholar] [CrossRef]
  6. Daniel, M.; Lemonsu, A.; Viguié, V. Role of watering practices in large-scale urban planning strategies to face the heat-wave risk in future climate. Urban Clim. 2018, 23, 287–308. [Google Scholar] [CrossRef]
  7. De Munck, C.; Lemonsu, A.; Masson, V.; Le Bras, J.; Bonhomme, M. Evaluating the impacts of greening scenarios on thermal comfort and energy and water consumptions for adapting Paris city to climate change. Urban Clim. 2018, 23, 260–286. [Google Scholar] [CrossRef] [Green Version]
  8. Baklanov, A.; Grimmond, C.S.B.; Carlson, D.; Terblanche, D.; Tang, X.; Bouchet, V.; Lee, B.; Langendijk, G.; Kolli, R.K.; Hovsepyan, A. From urban meteorology, climate and environment research to integrated city services. Urban Clim. 2018, 23, 330–341. [Google Scholar] [CrossRef]
  9. Gao, Z.; Bresson, R.; Qu, Y.; Milliez, M.; Munck, C.; Carissimo, B. High resolution unsteady RANS simulation of wind, thermal effects and pollution dispersion for studying urban renewal scenarios in a neighborhood of Toulouse. Urban Clim. 2018, 23, 114–130. [Google Scholar] [CrossRef]
  10. Ng, E.; Ren, C. China’s adaptation to climate & urban climatic changes: A critical review. Urban Clim. 2018, 23, 352–372. [Google Scholar]
  11. Givoni, B.; Noguchi, M.; Saaroni, H.; Potchter, O.; Yaacov, Y.; Feller, N.; Becker, S. Outdoor comfort research issues. Energy Build. 2003, 35, 77–86. [Google Scholar] [CrossRef]
  12. Andrade, H.; Alcoforado, M.J.; Oliveira, S. Perception of temperature and wind by users of public outdoor spaces: Relationships with weather parameters and personal characteristics. Int. J. Biometeorol. 2011, 55, 665–680. [Google Scholar] [CrossRef]
  13. Johansson, E.; Thorsson, S.; Emmanuel, R.; Krüger, E. Instruments and methods in outdoor thermal comfort studies—The need for standardization. Urban Clim. 2014, 10, 346–366. [Google Scholar] [CrossRef] [Green Version]
  14. Ketterer, C.; Matzarakis, A. Human-biometeorological assessment of the urban heat island in a city with complex topography—The case of Stuttgart, Germany. Urban Clim. 2014, 10, 573–584. [Google Scholar] [CrossRef]
  15. Stavrakakis, G.M.; Tzanakic, E.; Genetzaki, V.I.; Anagnostakis, G.; Galetakis, G.; Grigorakis, E. A computational methodology for effective bioclimatic-design applications in the urban environment. Sustain. Cities Soc. 2012, 4, 41–57. [Google Scholar] [CrossRef] [Green Version]
  16. Yang, X.; Zhao, L.; Bruse, M.; Meng, Q. Evaluation of a microclimate model for predicting the thermal behavior of different ground. Build. Environ. 2013, 60, 93–104. [Google Scholar] [CrossRef]
  17. Fabbri, K.; Di Nunzio, A.; Gaspari, J.; Antonini, E.; Boeri, A. Outdoor Comfort: The ENVI-BUG tool to evaluate PMV values Output Comfort point by point. Energy Procedia 2017, 111, 510–519. [Google Scholar] [CrossRef]
  18. Forouzandeh, A. Numerical modeling validation for the microclimate thermal condition of semi-closed courtyard spaces between buildings. Sustain. Cities Soc. 2018, 36, 327–345. [Google Scholar] [CrossRef]
  19. Shashua-Bar, L.; Pearlmutter, D.; Erell, E. The influence of trees and grass on outdoor thermal comfort in a hot-arid environment. Int. J. Climatol. 2011, 31, 1498–1506. [Google Scholar] [CrossRef]
  20. Taleghani, M.; Kleerekper, L.; Tenpierik, M.; van den Dobbelsteen, A. Outdoor thermal comfort within five different urban forms in the Netherlands. Build. Environ. 2015, 83, 65–78. [Google Scholar] [CrossRef]
  21. Jamei, E.; Rajagopalan, P.; Seyedmahmoudian, M.; Jamei, Y. Review on the impact of urban geometry and pedestrian level greening on outdoor thermal comfort. Renew. Sustain. Energy Rev. 2016, 54, 1002–1017. [Google Scholar] [CrossRef]
  22. Wang, Z.H.; Zhao, X.; Yang, J.; Song, J. Cooling and energy saving potentials of shade trees and urban lawns in a desert city. Appl. Energy 2016, 161, 437–444. [Google Scholar] [CrossRef]
  23. Hendel, M.; Gutierrez, P.; Colombert, M.; Diab, Y.; Royon, L. Measuring the effects of urban heat island mitigation techniques in the field: Application to the case of pavement-watering in Paris. Urban Clim. 2016, 16, 43–58. [Google Scholar] [CrossRef]
  24. Gaspari, J.; Fabbri, K. A study on the use of outdoor microclimate map to address design solutions for urban regeneration. Energy Procedia 2017, 111, 500–509. [Google Scholar] [CrossRef]
  25. Gaspari, J.; Fabbri, K.; Lucchi, M. The use of outdoor microclimate analysis to support decision making process: Case study of Bufalini square in Cesena. Sustain. Cities Soc. 2018, 42, 206–215. [Google Scholar] [CrossRef]
  26. Beermann, B.; Berchtold, M.; Baumüller, J.; Gross, G.; Kratz, M. Städtebaulicher Rahmenplan Klimaanpassung für die Stadt Karlsruhe (Teil II); LUBW Landesanstalt für Umwelt, Messungen und Naturschutz Baden-Württemberg: Karlsruhe, Germany, 2014. [Google Scholar]
  27. Baumueller, J.; Hoffmann, U.; Reuter, U. Climate Booklet for Urban Development; Ministry of Economy Baden-Wuerttemberg, Environmental Protection Development: Stuttgart, Germany, 1992.
  28. Ren, C.; Ng, E.; Katzschner, L. Urban climatic map studies: A review. Int. J. Climatol. 2011, 31, 2213–2233. [Google Scholar] [CrossRef]
  29. Takebayashi, H.; Okubo, M.; Danno, H. Thermal environment map in street canyon for implementing extreme high temperature measures. Atmosphere 2020, 11, 550. [Google Scholar] [CrossRef]
  30. Takebayashi, H.; Ishii, E.; Moriyama, M.; Sakaki, A.; Nakajima, S.; Ueda, H. Study to examine the potential for solar energy utilization based on the relationship between urban morphology and solar radiation gain on building rooftops and wall surfaces. Sol. Energy 2015, 119, 362–369. [Google Scholar] [CrossRef]
  31. Ishii, A.; Katayama, T.; Shiotsuki, Y.; Yoshimizu, H.; Abe, Y. Experimental study on comfort sensation of people in the outdoor environment. J. Archit. Plan. Environ. Eng. 1988, 386, 28–37. [Google Scholar]
Figure 1. Building shape and classification of the objective road.
Atmosphere 13 00946 g001
Figure 2. Distribution of SET* at 1.5 m high at 13:00 on 5 August 2020.
Atmosphere 13 00946 g002
Figure 3. Diurnal variation of spatial distribution frequency of SET* at 1.5 m high on east–west road on 5 August 2020. (a) North side roadway, (b) south side roadway, (c) north side sidewalk, (d) south side sidewalk.
Atmosphere 13 00946 g003aAtmosphere 13 00946 g003b
Figure 4. Diurnal variation of spatial distribution frequency of SET* at 1.5 m high on north–south road on 5 August 2020. (a) West side roadway, (b) east side roadway, (c) west side sidewalk, (d) east side sidewalk.
Atmosphere 13 00946 g004
Figure 5. Diurnal variation of spatial distribution frequency of SET* at 1.5 m high on east–west road and north–south road on 5 August 2020, when water is sprinkled on the roads. (a) north side roadway, (b) south side roadway, (c) west side roadway, (d) east side roadway.
Atmosphere 13 00946 g005
Figure 6. Diurnal variation of spatial distribution frequency of SET* at 1.5 m high on east–west road and north–south road on 5 August 2020, when the road surface is covered by a water layer. (a) north side roadway, (b) south side roadway, (c) west side roadway, (d) east side roadway.
Atmosphere 13 00946 g006aAtmosphere 13 00946 g006b
Figure 7. Diurnal variation of spatial distribution frequency of SET* at 1.5 m high on east–west road and north–south road on 5 August 2020, when sunshades are installed. (a) sunshade installation condition, (b) north side roadway, (c) diurnal shade change, (d) west side roadway, (e) east side roadway, (f) diurnal shade change, (g) west side sidewalk, (h) east side sidewalk.
Atmosphere 13 00946 g007aAtmosphere 13 00946 g007b
Figure 8. Diurnal variation of spatial distribution frequency of SET* at 1.5 m high on east–west road and north–south road on 5 August 2020, when street trees are installed. (a) street tree installation condition, (b) tree conditions, (c) diurnal shade change, (d) north side roadway, (e) east side roadway.
Atmosphere 13 00946 g008
Table 1. Parameters for surface heat budget equation and heat conduction equation.
Solar Reflectance [-]Evaporative Efficiency [-]Heat Conductivity [W/(mK)]Emissivity [-]Thermal Capacity [kJ/(m3·K)]
Concrete0.350.01.700.951934
Grass0.300.33.000.903000
Asphalt0.150.00.741.002056
Soil-0.00.62-1583
Publisher’s Note: MDPI stays neutral with regard to jurisdictional claims in published maps and institutional affiliations.

