Article

Aerosol Distributions and Transport over Southern Morocco from Ground-Based and Satellite Observations (2004–2020)

1
LACy, Laboratoire de l’Atmosphère et des Cyclones, UMR 8105 CNRS, Université de La Réunion, Météo-France, 97744 Saint-Denis, France
2
High Energy Physics and Astrophysics Laboratory, Oukaïmeden Observatory, Cadi Ayyad University, FSSM, Marrakesh B.P. 2390, Morocco
3
Faculté des Sciences, Université Mohamed V, Rabat B.P. 1014, Morocco
*
Author to whom correspondence should be addressed.
Atmosphere 2022, 13(6), 923; https://doi.org/10.3390/atmos13060923
Submission received: 19 April 2022 / Revised: 26 May 2022 / Accepted: 28 May 2022 / Published: 6 June 2022
(This article belongs to the Special Issue Atmospheric Aerosol Optical Properties)

Abstract

:
The present study investigates the optical properties of aerosols on daily and seasonal scales with the use of the aerosol optical depth (AOD) and Angström exponent (AE) data retrieved from AErosol RObotic NETwork (AERONET) and collected at four stations in Southern Morocco—Saada (31.63° N; 8.16° W), Ouarzazate (30.93° N; 6.91° W), Oukaïmeden (31.21° N; 7.86° W) and Ras-El-Aïn (31.67° N; 7.60° W). An evaluation of the aerosol volumetric size distribution (AVSD) is also obtained for Saada and Ouarzazate. An AOD inter-comparison is performed between AERONET data and satellite sensors (MODerate resolution Imaging Spectroradiometer—MODIS), as well as assimilation products (Modern-Era Retrospective analysis for Research and Applications, version 2 (MERRA-2) and Copernicus Atmosphere Monitoring Service (CAMS)), by the means of a linear regression. Regardless of site location and elevation, the results show the prevalence of the annual cycle of AOD, with a maximum in summer and a minimum in winter. In association with this seasonal variation, the variations in AE and AVSD showed an increase in coarse mode over Ouarzazate and Saada during summer (July to August), underlining that Southern Morocco is prone to the regular transport of desert dust on a seasonal basis. The inter-comparison reveals that the MERRA-2 dataset is slightly more appropriate for the study region, since it shows correlation coefficients (r) ranging from 0.758 to 0.844 and intercepts ranging from 0.021 to 0.070, depending on the study site. The statistical analysis of the back-trajectories simulated by the HYbrid Single Particle Lagrangian Integrated Trajectory (HYSPLIT) model were consistent with the observations and confirmed the dominance of desert dust aerosols during the summer over the study region. On the other hand, the winter season reveals a predominance of anthropogenic and oceanic aerosols originating from the north and the west of the study site.

1. Introduction

The Earth’s atmosphere is the gaseous envelope that protects against harmful solar ultraviolet radiation and warms the globe through the greenhouse effect. In addition to gaseous components, the atmosphere contains particles, with concentrations varying depending on location, altitude and season. With their influence on the overall climate, aerosols tend to cool the Earth and have significant environmental and health impacts [1,2]. Therefore, it becomes important to better understand their properties through the study of their chemical, microphysical and optical characteristics, as well as their seasonality and the dynamical processes involved in their transport.
Today, the study of aerosols can be conducted using many datasets, and the combination of surface measurements with satellite products can accurately reflect the global distribution of aerosols. Generally, ground-based observations provide a reliable and accurate representation of aerosol properties but also offer limited time series over a limited number of locations. On the other hand, satellite observations give a large temporal and spatial coverage, but their measurements are less reliable due to their limited resolutions and to their sometimes incorrect assumptions during the retrieval procedure. Indeed, measurement quality from satellite instruments may vary depending on the observed layer, location and surface roughness. They are also affected by particle type, size and location. As such, several research studies focused on the inter-comparison between aerosol observations over different sites distributed in different regions. Some focused on the Ganga Basin in India [3], others on Central China [4], on Latin America [5] or validated a specific satellite dataset over Turkey [6]. Among the several published papers that were dedicated to investigate aerosols in Africa (i.e., in West Africa [7], at Durban, South Africa [8], and covering a particular event in June 2011 over the west African Sahara [9,10]), some have directly concerned Morocco.
One of the most important aerosol observation field campaigns in Southern Morocco is the Saharan Mineral Dust Experiment (SAMUM). It took place during summer 2006 and led to the quantification of dust-related radiative effects and to the characterization of desert dust using spectral optical depth, volumetric distribution and mass concentration estimations [11,12,13,14]. Furthermore, Bounhir et al. [15] combined TOMS (Total Ozone Mapping Spectrometer) aerosol indices and AERONET (AErosol RObotic NETwork) AOD records in Southern Morocco to study aerosol distribution and AOD-correction from the altitude effect during the 2004–2006 time period. In the framework of the European Integrated Project on Aerosol–Cloud–Climate and Air Quality Interactions (EUCAARI) campaign, Bègue et al. [16] reported on the long-range transport of Saharan desert dust aerosol up to northwest Europe. Note also the study by Benchrif et al. [17] on aerosol transport pathways over Morocco using back-trajectory simulations from May 2011 to April 2012. They discovered sulfates mixed with urban, biomass burning and oceanic aerosols and used back-trajectories to determine the sources of these types of aerosols. Their simulations showed a majority of trajectories (39% of trajectories) originating from the Mediterranean Basin. These trajectories seem to be impacted by an emission of sulfate aerosols emitted by the intense maritime traffic. Another important cluster of trajectories (32% of trajectories) had its origin in the near Atlantic Ocean and was impacted by pollutants emitted from the coast. They also found that urban and biomass burning aerosols were of local origin. The most recent published work on Morocco was reported by Tahiri et al. [18,19]. They analyzed two AOD datasets measured at Saada (31.63° N; 8.16° W) and Ouarzazate (30.93° N; 6.91° W), two of the study sites of the present manuscript, over two successive years: 2012 and 2013. They used sun-photometer observations and showed that the aerosol load over the sites is affected by mineral dust during the summer.
Therefore, it is clear that most of the published studies on aerosols in Morocco, particularly in Southern Morocco, cover short time periods. The most recent of these studies was published in 2013, while the oldest was published in 2004. Thus, the objective of this study is to use all available aerosol data recorded at four stations in Southern Morocco from July 2004 to February 2020, in combination with satellite and assimilation datasets. In fact, one of the paper’s goals is to investigate the reliability of aerosol retrievals from three frequently used datasets, i.e., MODIS (MODerate resolution Imaging Spectroradiometer), MERRA-2 (Modern-Era Retrospective analysis for Research and Applications, Version 2) and CAMS (Copernicus Atmosphere Monitoring Service), in comparison with photometer measurements. In this study, we present aerosol distributions in Southern Morocco in terms of seasonal variability and typology, using optical properties (i.e., AOD, AE and AVSD) derived from measurements at locations with a sufficient number of observations.
The article is organized as follows. In Section 2, we describe the study sites, the datasets and the statistical approach used for the inter-comparison. In Section 3, we present the results obtained from ground-based observations, as well as comparisons with satellite observations (MODIS) and with assimilations from the MERRA-2 and CAMS platforms. A statistical analysis of air-mass back-trajectories performed by the HYSPLIT (HYbrid Single Particle Lagrangian Integrated Trajectory) model is proposed in Section 3.4 to attempt to identify and discuss the source regions of the observed seasonal aerosol variability.

2. Study Area, Materials and Methods

2.1. Site Description

Our study focuses on four AERONET stations in Morocco: Saada (31.63° N; 8.16° W), Ouarzazate (30.93° N; 6.91° W), Oukaïmeden (31.21° N; 7.86°W) and Ras-El-Aïn (31.67° N; 7.60° W). The Saada station was installed in 2004 and is still operational, while the Ouarzazate station operated from 2012 to 2015, Ras-El-Aïn from mid-2006 to mid-2007 and Oukaïmeden between February and September 2009. The latter hosts an astronomical observatory whose instruments require high atmospheric transparency [20]. Figure 1 shows the locations of the study sites. Ouarzazate is a small town located east of the Atlas Mountains and north of the Sahara Desert, with almost no industrial activity. It has a pre-Saharan climate characterized by low rainfall with hot and dry summers [19]. The Saada and Ras-El-Aïn stations are located ∼15 km from the city of Marrakech and ∼60 km west of the Atlas Mountains. Both sites are located at almost the same elevation as Marrakech (∼470 m ASL) and have the same subtropical semi-desert climate, with mild winter and very hot summer. Lastly, Oukaïmeden is the highest site, as it is located in the Atlas Mountains. The sun-photometer at this site was operated at the Oukaïmeden Astronomical Observatory, which is located at 2760 m ASL.
Because of their proximity to the Sahara desert and due to atmospheric circulation and associated transport processes, the aerosol loads at the four stations are modulated by the flow of desert dust. However, the four sites are prone to different meteorological conditions, and each station is expected to show a specific aerosol signature. The high-altitude sites (Ouarzazate and Oukaïmeden) are likely to be located above or near the atmospheric boundary layer’s upper limit. As such, both sites should show cleaner atmospheric columns with low aerosol concentrations. On the contrary, the low altitude sites (Saada and Ras-El-Aïn) are located northwest of the High Atlas Mountains in the neighborhood of Marrakech city and are expected to show higher aerosol contents. Indeed, Marrakech is one of the four most populated Moroccan cities, and its economic activity is based on the tourism industry.

2.2. Instruments and Back-Trajectory Model

2.2.1. AERONET Photometers

The AERONET sun-photometer is a ground-based passive remote sensing instrument that performs measurements of the direct solar spectral irradiance in several wavelengths (typically 440 nm, 675 nm, 870 nm and 1020 nm). By tracking the sun’s position in the sky, it can measure the presence of aerosols distributed within a column of air from the ground up to the top of the atmosphere [21]. Such measurements usually include the AOD, used to characterize the opacity of the atmosphere. From AOD measurements performed at different wavelengths, an estimation of the Angström exponent (AE, hereinafter referred as α ) can be obtained as:
α = ln τ λ 1 τ λ 2 ln λ 1 λ 2 ,
where τ λ 1 and τ λ 2 represent the spectral values of AOD obtained at wavelengths λ 1 and λ 2 , respectively. This quantity describes how the optical depth depends on the radiation wavelength, and it can be used as an indicator of particle or aerosol size [22]. Usual values for the AE vary in the range [0, 4], where values greater than 2 indicate small particles (radii 0.5 μ m) associated with biomass burning or industrial-type aerosols, while AE values smaller than 1 indicate large particles (radii 0.5 μ m) such as sea salt or dust [23]. In addition, based on the Dubovik and King inversion algorithm [24], photometric measurements are used to obtain the aerosol volumetric size distribution (AVSD), which can discriminate the dominant aerosol modes. In the present study, we used AERONET AOD 440 (i.e., AOD measurements at 440 nm), AE 440 870 (i.e., AE obtained from observations at 440 nm and 870 nm) and AVSD.
The AERONET sun-photometer measurements are widely used in different contexts and at different locations (Kumar et al., 2015; Cuevas et al., 2019; Raptis et al., 2020; [3,4,5,6,7,8,25,26]), and data can be downloaded from a dedicated web page (https://aeronet.gsfc.nasa.gov), accessed on 19 April 2022. However, due to the need for maintenance and the possible contamination by cloud cover, which skews the measurements, the aerosol time series can be sparse and/or very short in time. Therefore, it appears crucial to use satellite observations and assimilated data in synergy with the ground observation networks.
In the present paper, we used version 3, level 2.0 AERONET data (AOD, AE and AVSD), consisting of daily averages obtained at the four study stations. Level 2.0 AERONET data are quality-assured data with a near real-timed cloud-screening and pre-field and post-field calibrations. The near-real time AERONET AOD have an estimated 1 σ uncertainty of up to 0.02 [27], and the relative uncertainty associated with an AE measurement can be determined with the AOD value and uncertainty [28].

2.2.2. Aerosol Observations by MODIS

MODIS is a spectroradiometer onboard both NASA Aqua and Terra satellites, which have heliosynchronous orbits and have been operating since 2002 and 2000, respectively [29,30]. The MODIS spectrometer records data in 36 discrete spectral bands ranging from 0.4 μ m to 14.4 μ m, with a spatial resolution that varies between 250 m and 1 km depending on the channel being used. The instrument performs observations of several quantities, such as the distribution of cloud cover, the amount of water vapor in a column of atmosphere, the vertical distribution of temperature, and more importantly, the aerosol properties. The data used for the temporal comparison were extracted from the MOD08_D3_6_1 product and downloaded from the Giovanni platform (https://giovanni.gsfc.nasa.gov/giovanni/), accessed on 19 April 2022. These data correspond to level 3.0 MODIS AOD coverage, which distributes daily observations on a 1° × 1° grid. The uncertainty associated to AOD measurements over land are reported to be ± ( 0.05 + 15 % × AOD 550 ) [31]. The data used for the spatial comparison were extracted from the MOD08_M3_6_1 product, which consists of statistical results sorted on a 1° × 1° grid spanning a monthly time interval. For the purpose of this study, we have exclusively used AOD measurements from the Terra platform and exploited all the available daily AOD records over Morocco from 2004 to 2020.

2.2.3. MERRA-2 Aerosol Reanalysis

The MERRA-2 dataset is a collection of atmospheric reanalyses derived from worldwide satellite and ground-based observations. It is produced by the NASA Global Modelling and Assimilation Office (GMAO). Since 1979, MERRA-2 has assimilated meteorological parameters such as wind, temperature and humidity but also aerosol products [32]. Among aerosol products, AOD observations are obtained from different sources. The MERRA-2 model uses direct AOD measurements from ground-based AERONET stations (though only in the span 1999–2014) and can also deduce AOD data from the MODIS reflectance (2000–present for Terra and 2002–present for Aqua) [33]. In fact, MODIS provides most of the AOD data assimilated by the MERRA-2 algorithm. AOD 550 is assimilated thanks to an analysis splitting technique based on observations and on a forecast model. As such, MERRA-2 proposes a continually updated and corrected gridded dataset, incorporating observations as well as outputs of a numerical weather prediction model in order to minimize the differences with ground-based observations. The MERRA-2 AOD and AE used in this work were also downloaded from the Giovanni platform. The data used for the temporal comparison were retrieved from the M2T1NXAER_5_12_4 product and consist of hourly measurements distributed on a 0.5° × 0.625° grid. For the spatial comparison, we made use of the M2IMNXGAS_5_12_4 product corresponding to monthly mean data collection. We downloaded measurements from 2004 to 2020 in order to cover the same time interval as the MODIS time series.

2.2.4. CAMS Reanalysis

The CAMS reanalysis is an assimilation system combining model data with observations, including AOD measurements from several instruments such as MODIS-Terra, MODIS-Aqua and AATSR-Envisat into a complete and consistent dataset [34]. These reanalyses can be retrieved from the Climate Data Store on the Copernicus platform (https://cds.climate.copernicus.eu/#!/home), accessed on 19 April 2022. They cover the period from June 1995 to October 2020 with a gridded spatial resolution of 0.75° × 0.75° and a 3-hour temporal resolution. In the present study, we made use of AOD time series over Morocco assimilated for the 2004–2020 period.

2.3. Methodology

As explained in Section 1, several research papers have focused on determining the most reliable satellite or assimilation dataset for various locations, but none have performed this work for our study region. For the purpose of this study, we used MODIS data as well as assimilated data from MERRA-2 and CAMS systems. A linear regression analysis was performed between these datasets and ground-based observations from AERONET sun-photometers in the following form:
AOD SAT = a AOD AER + b ,
where AOD SAT and AOD AER represent the satellite or assimilation values and the AERONET measurements, respectively, while a and b refer to the slope and the intercept of the linear fit, respectively.
Different instruments do not necessarily measure AODs at the same wavelength. Thanks to the power law relationship, and provided that one has access to AE measurements, one can compute AODs for different channels using the following equation:
AOD SAT @ λ AER = AOD SAT @ λ SAT λ AER λ SAT α ,
where λ AER and λ SAT represent the satellite or assimilation and the AERONET observation wavelengths, respectively. Since satellite measurements and assimilation products do not provide AODs at 440 nm, Equation (3) was used to retrieve AOD values at 440 nm. The statistical parameters used for the purpose of this study are the slope (a) and the intercept (b), the Pearson correlation coefficient (r), the relative Root Mean Square Deviation ( RMSD rel ), the Mean Absolute Error (MAE) and the Relative Mean Bias (RMB), whose formulas are given hereafter:
r = i = 1 N ( AOD SAT i AOD SAT ¯ ) ( AOD AER i AOD AER ¯ ) i = 1 N ( AOD SAT i AOD SAT ¯ ) 2 i = 1 N ( AOD AER i AOD AER ¯ ) 2 ,
RMSD rel = 1 N i = 1 N ( AOD SAT i AOD AER i ) 2 AOD AER ¯ ,
MAE = 1 N i = 1 N | AOD SAT i AOD AER i | ,
RMB = AOD SAT ¯ AOD AER ¯ ,
where N represents the total number of samples (values of aerosol optical properties), and the overbar stands for the average over all N values.

2.4. The HYSPLIT Trajectories

In the context of aerosol typology, we are interested in finding the origin of the observed aerosol particles. Therefore, the HYSPLIT trajectory model was used in its backward mode analysis in order to investigate the origin of the air-masses at different altitudes over the study region [35,36]. In this study, we simulated the back-trajectories for the Saada site, which has the longest aerosol time series. For this purpose, we made use of the Global Data Assimilation System (GDAS) meteorological fields, which provide assimilations since December 2004. To investigate the role of atmospheric circulation both below and above the atmospheric boundary layer, we chose 6 different height levels: 500 m, 1 km, 1.5 km, 3 km, 4 km and 5 km. We have run one 120 h back-trajectory simulation per height level every 10 days over the 2005–2020 time period, in order to cover the summer season (July and August) and, by contrast, the winter season (December and January). These months were chosen due to seasonal differences in aerosol loading and population, which could help in determining their types and origins. In total, 7 simulations per height level and per year were required, accounting for a total number of 672 simulations over 16 years. For clarity, results were aggregated according to season and height-packet, where the low height-packet refers to the first three height levels in the atmospheric boundary layer (0.5, 1.0 and 1.5 km) and the high height-packet to the layers at 3, 4 and 5 km. Finally, the HYSPLIT simulation results were cluster analyzed for each height-packet and season to determine the main transport pathways and advection directions. The cluster methodology that was used is the one described by Taubman et al., 2006 [37]. It is worth noting that we did not consider aerosol mixing nor aerosol transformations along the trajectories.

3. Results

3.1. AERONET Observations

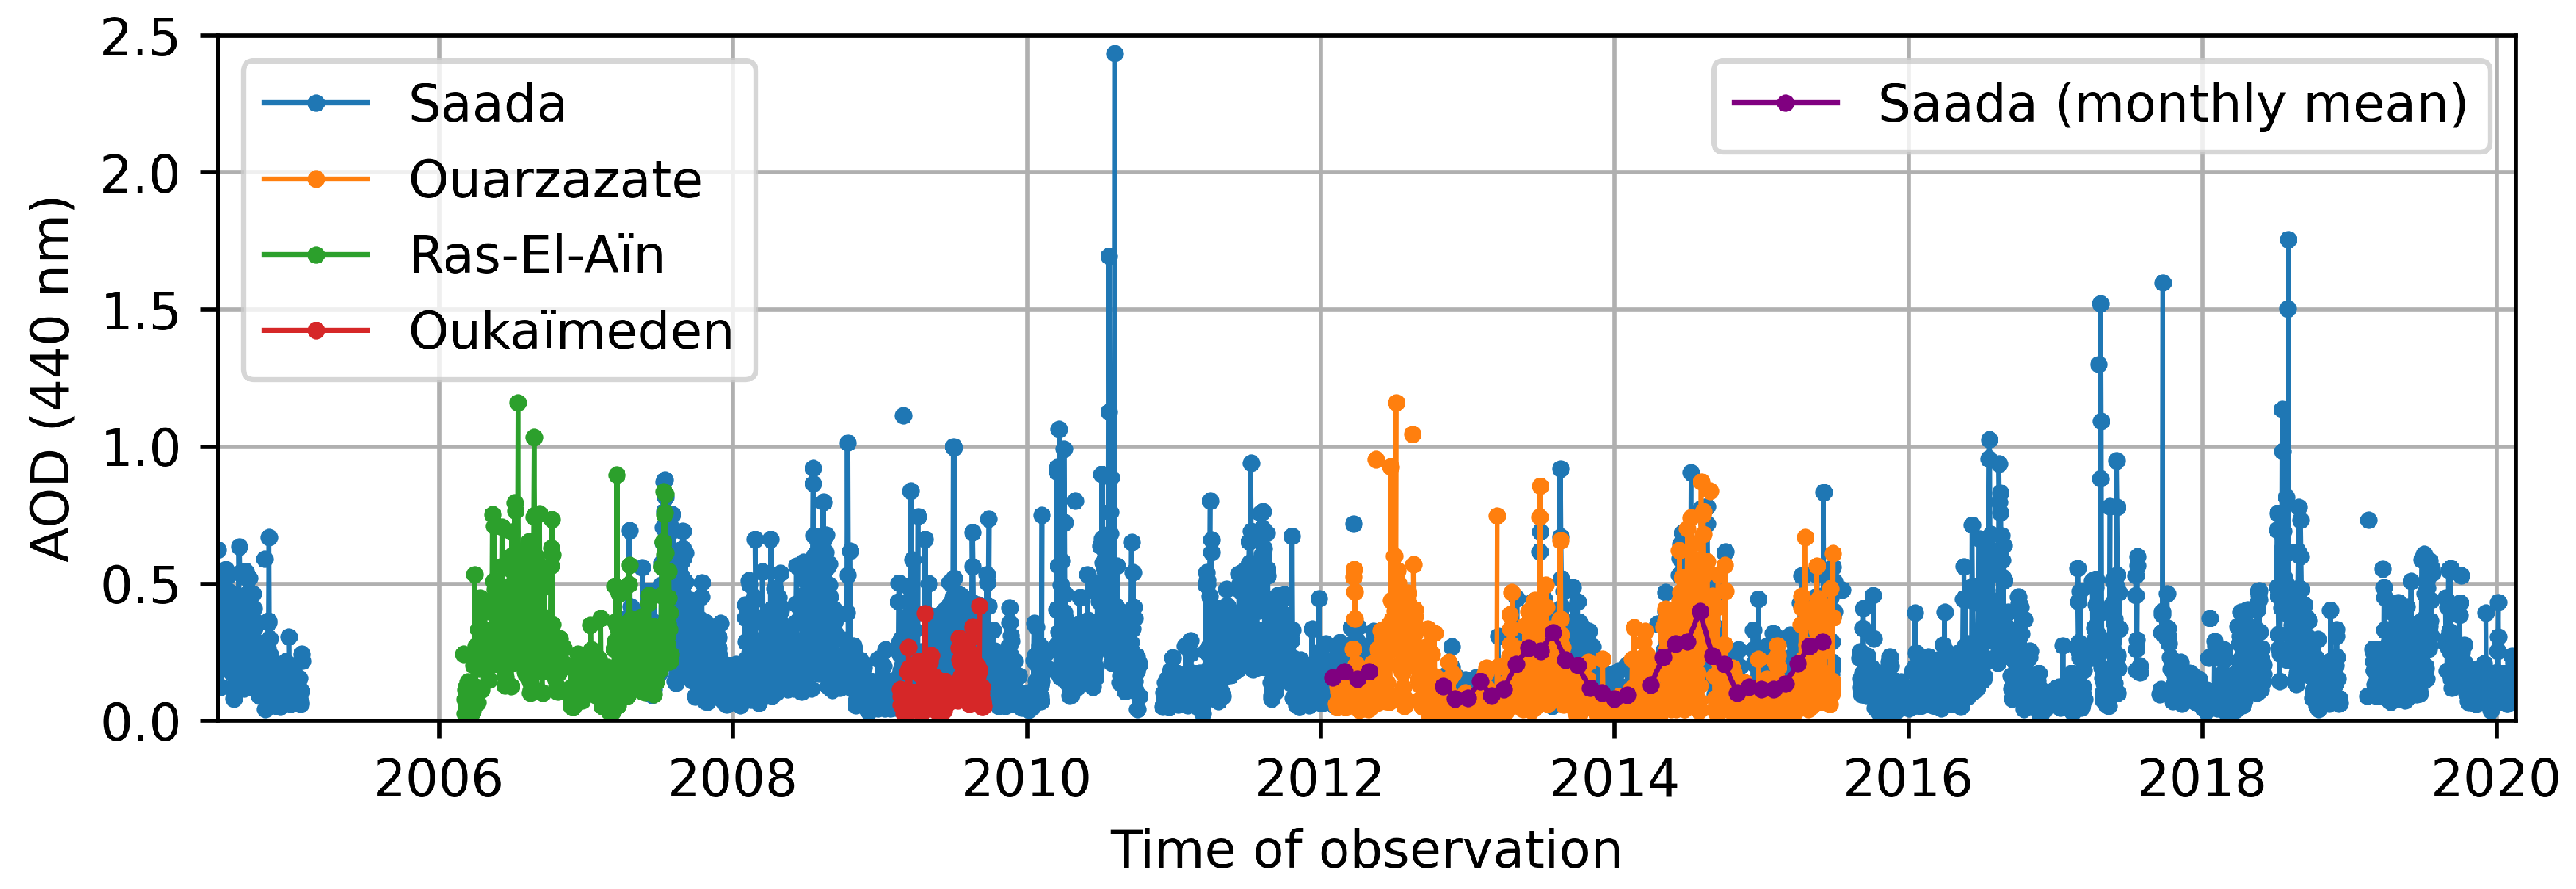
3.1.1. Daily Measurements

Figure 2 displays the AOD 440 observations from the AERONET time series for the study sites Saada, Ouarzazate, Ras-El-Aïn and Oukaïmeden. Even if the time series do not cover the same time periods or have the same lengths (which means that comparing data from two distinct locations cannot be statistically significant), this figure holds valuable information.
The Saada and Ouarzazate stations have been operational for the longest time. Their respective AOD records show annual variations, with maxima during summer (from June to August) and minima during winter (from December to February). This seasonal pattern corresponds to the presence of summer heat lows, monsoon flows, African Easterly Waves or afternoon deep convection, all of which produce winds that lift dust into the atmosphere in a process known as dust emission [10]. In fact, the main summertime atmospheric circulation in the region is the Saharan heat low [38]. In order to establish a significant comparison between stations, we have computed statistics related to the Saada station for the common time period with Ouarzazate (i.e., from 10 February 2012 to 28 June 2015). The average, minimum and maximum AOD values for the common time periods between the Saada and Ouarzazate stations are 0.19, 0.03 and 0.92 and 0.15, 0.12 and 1.16, respectively. The average AOD value is higher for Saada since it is a lower-altitude site, and the highest maximum AOD is recorded at Ouarzazate since it is located southeast of the High Atlas mountains and closer to the Sahara desert. Although the Oukaïmeden time series is short, it shows that this location records the smallest AOD values, with a minimum value of 0.021 and an average of 0.12. This is due to its altitude (2762 m ASL), the highest of the 4 stations [15]. The Ras-El-Aïn station has nearly two years of continuous measurements and exhibits the same seasonal variation as the Saada site. It is also worth noting that the AOD variations at Saada reveal high AOD values during summer, with maxima in the summers of 2010, 2017 and 2018, corresponding to AOD values of 2.43, 1.60 and 1.75, respectively. These numbers correspond to multiplying Saada’s average AOD value of 0.22 by 10.91, 7.16 and 7.86, respectively. These high AODs are generally caused by major dust events that sweep across Southern Morocco. The case of the 2018 dust event has recently been documented by Bencherif et al., 2022 [39].

3.1.2. Multi-Year Variations

To further investigate the seasonal variability, we calculated the multi-year variation at Saada and Ouarzazate. Figure 3 shows AOD 440 and AE 440 870 multi-year mean values for the Saada and Ouarzazate sites with red and blue colors, respectively. The vertical bars represent the associated monthly 1 σ standard deviations. The dashed lines in Figure 3a represent Saada’s multi-year AOD and AE variations computed between 10 February 2012 and 28 June 2015, the common time period between the Saada and Ouarzazate time series. In agreement with Figure 2, for both stations and considering the complete time series (solid lines), the maximum AOD appears during the summer from July to August ( 0.40 ± 0.09 for Saada and 0.33 ± 0.12 for Ouarzazate), while its minimum occurs during the winter from December to January ( 0.10 ± 0.02 for Saada and 0.04 ± 0.01 for Ouarzazate). The AOD values at the Saada site are always higher than those at Ouarzazate, regardless of the month, season or time period. The average AOD values for the Saada and Ouarzazate sites are 0.22 ± 0.06 and 0.14 ± 0.04 , respectively. The AOD values from Saada’s reduced multi-year analysis (blue dashed line) indicate a maximum of 0.36, a minimum of 0.09 and an average of 0.19. These values are all greater than the corresponding values obtained in Ouarzazate. The discrepancies could be due to the difference in height between the two sites, which implies that there are fewer aerosols in the atmospheric column of Ouarzazate than in Saada’s.
As for the AE 440 870 , the obtained multi-year values for the complete time series show the same seasonal variation for both sites and are anti-correlated with the AOD variations (with r = 0.968 for Saada and r = 0.914 for Ouarzazate), with a minimum in summer ( 0.40 ± 0.11 and 0.21 ± 0.11 for Saada and Ouarzazate, respectively) and a maximum in winter ( 1.01 ± 0.26 and 0.65 ± 0.21 for Saada and Ouarzazate, respectively). AEs over Ouarzazate are consistently lower than those over Saada throughout the year, regardless of the month. The average AE values for the Saada site are 0.73 ± 0.17 and 0.44 ± 0.11 for Ouarzazate. AE values from Saada’s reduced multi-year analysis (red dashed line) indicate a maximum of 1.00, a minimum of 0.42 and an average of 0.76. All AE values obtained at Saada for the reduced analysis are higher than those observed in Ouarzazate. This suggests a seasonal variation in the aerosol mode at both sites and that Ouarzazate is more likely to be exposed to the coarse mode, especially in summer. The AE decrease during summer indicates an increase in the average particle size of the observed aerosol population.
For more investigation on size distributions, the AVSD variations for Saada and Ouarzazate were averaged according to seasons, i.e., winter (DJF), spring (MAM), summer (JJA) and autumn (SON) over the 2004–2020 and 2012–2015 periods, respectively, and are depicted in Figure 4. Saada’s seasonal aerosol volumetric size distributions for the 2012–2015 period are also represented by the dashed lines in Figure 4a. All AVSD distributions show a similar bimodal shape, with radius modal values at 0.11 ± 0.02 μ m for the fine mode and at 2.59 ± 0.35 μ m for the coarse mode. For both sites, the coarse and fine modes show the highest concentration during summer and the lowest concentration during winter. These results are consistent with the seasonal variation depicted in Figure 3. It is worth noting that these results are also consistent with those reported by Tahiri et al., 2016 [19], who analyzed aerosol data for a one-year period: 2012 for Ouarzazate and 2013 for Saada. Given that the AVSD of dust particles is dominated by the coarse mode, Figure 4 suggests that the concentrations of aerosols over Saada and Ouarzazate are dominated by dust aerosols, most notably during summer. In addition, it can be observed that the maxima of the fine mode (crosses in Figure 4) at Saada ( 6.20 × 10 3 , 9.93 × 10 3 , 18.52 × 10 3 and 9.44 × 10 3 μ m 3 / μ m 2 for winter, spring, summer and autumn, respectively) is slightly higher than the one observed at Ouarzazate ( 2.42 × 10 3 , 4.99 × 10 3 , 11.38 × 10 3 and 3.34 × 10 3 μ m 3 / μ m 2 for winter, spring, summer and autumn, respectively). This is most likely due to Saada’s proximity to the city of Marrakech, making it more vulnerable to anthropogenic emissions. AVSD values from Saada’s reduced seasonal analysis (dashed lines) reveal that the coarse mode shows higher values for winter (0.019 μ m 3 / μ m 2 ), summer (0.137 μ m 3 / μ m 2 ) and autumn (0.054 μ m 3 / μ m 2 ) when compared to Ouarzazate. Indeed, Ouarzazate obtains 0.013, 0.116 and 0.028 μ m 3 / μ m 2 for the same respective seasons. Similarly to previous results, this likely implies that Ouarzazate has a cleaner atmospheric column due to its higher altitude. Furthermore, due to its proximity to a major city, the fine mode in Saada’s reduced seasonal analysis presents higher seasonal maxima than Ouarzazate with 6.51 × 10 3 , 9.39 × 10 3 , 13.26 × 10 3 , 7.16 × 10 3 μ m 3 / μ m 2 for winter, spring, summer and autumn, respectively.

3.2. Inter-Comparison

3.2.1. Temporal Comparison

As shown in Figure 2, the observations obtained at the study sites do not cover the entire study period on a regular basis. Only Saada and Ouarzazate offer the longest and most continuous aerosol datasets. In contrast, satellite and reanalyses provide regular and uninterrupted datasets. Therefore, we performed inter-comparisons between the AERONET sun-photometer ground-based records and three datasets: MODIS, MERRA-2 and CAMS. For each study site, we present the results of the linear regression as defined in Equation (2), as well as the associated statistical parameters defined by Equations (4)–(7). We also computed the associated p-values for each and every comparison. The maximum p-value that we obtained was of the order of 10 12 , meaning that both variables in each inter-comparison were correlated. Furthermore, the determination coefficients ( R 2 ) were calculated. With R 2 > 0.5 for all sites except Oukaïmeden ( R 2 = 0.422 with MODIS and R 2 = 0.315 with CAMS), the use of a linear regression for this type of inter-comparison is valid. Low determination coefficients for Oukaïmeden are most likely due to the limited number of points (N = 154) available for inter-comparison, as well as the station’s significant elevation (∼2760 m ASL). Figure 5 gives a visual comparison of the different datasets for each site, with AODs truncated in the range [0.0, 1.0]. The major results of the inter-comparison are discussed in the following, and the exhaustive results are available to the reader on Table A1 in the Appendix A.
The results from Figure 5 and Table A1 indicate that MERRA-2 always shows the highest correlation coefficient (ranging from r = 0.758 to r = 0.844 ) and the lowest intercepts (ranging from b = 0.021 to b = 0.070 ) for each site. The maximum correlation coefficient was obtained at Saada ( r = 0.844 ). From the linear fits obtained based on Equation (2), it can be seen that MODIS and CAMS obtain slopes that are closer to unity. In fact, MODIS shows slopes ranging from a = 0.631 to a = 1.016 , CAMS obtains slopes from a = 0.607 to a = 0.958 and the slopes of MERRA-2 vary between a = 0.577 and a = 0.950 . However, MODIS and CAMS also obtain the highest intercepts, since MODIS has intercepts ranging from b = 0.081 to b = 0.163 , and CAMS shows intercepts ranging from b = 0.031 to b = 0.120 . As explained in similar previous studies, an intercept different from zero corresponds to a bias in the inversion algorithm on low AOD values and may be associated with a sensor calibration or ground surface reflection error [3,40]. Regarding the slope, a value different from unity may indicate some inconsistencies between the microphysical and optical properties of the aerosols used in the inversion algorithm and those actually observed [3]. Concerning the high-altitude sites, MERRA-2 obtains the lowest RMSD rel and shows RMB values closer to unity. As an example, for Oukaïmeden, MODIS and CAMS obtain RMSD rel values of 170.515% and 139.868%, respectively, while MERRA-2 obtains a value of 76.166%. For the same site, the RMB value is the highest with MODIS (RMB = 2.472), the lowest with MERRA-2 (RMB = 1.656) and is intermediate with CAMS (RMB = 2.088). Furthermore, MERRA-2 shows the lowest MAE for all sites expect Ras-El-Aïn, where MODIS, MERRA-2 and CAMS obtain MAE values of 0.087, 0.101 and 0.094, respectively.
Therefore, from Figure 5 and Table A1, it appears that there is no clear indication of which dataset is best suited for the study region. The variety of the obtained results underlines limitations of the AOD retrieval algorithms, particularly because of the heterogeneity of the observed aerosol populations. Some studies have highlighted the poor performance of MODIS measurements under extreme aerosol conditions [4]. Others indicated that differences between satellite or assimilation results with AERONET observations may come from complex vertical distribution of aerosols or an inaccurate representation of the aerosol types in the retrieval algorithm [3,41]. Depending on the study region, the retrieval algorithm from MODIS may not accurately represent the actual aerosol population, leading to biased and incorrect results. This effect seems to have a greater effect during dust loading periods.
In light of the seasonal variability presented in the previous subsection (Figure 3 and Figure 4), the same statistical analysis was performed but on a seasonal basis (winter—DJF; spring—MAM; summer—JJA; and autumn—SON). Due to the length of the study period and the number of measurements available, this analysis was limited to the Saada and Ouarzazate sites. Figure 6 and Figure 7 display the seasonal comparisons between AERONET and the other datasets (MODIS, MERRA-2 and CAMS) for the Saada and Ouarzazate sites, respectively. The exhaustive results are given in Table A2 and Table A3 in the Appendix A.
As obtained from the global comparisons in Figure 5, Figure 6 confirms that AOD data from MERRA-2 exhibits the highest correlation coefficient (ranging from r = 0.693 to r = 0.815 ) and the smallest intercepts (ranging from b = 0.015 to b = 0.055 ) for each season. For the Saada site, each dataset underestimates the AOD values regardless of the season. It is worth noting that this underestimation is most pronounced for the MERRA-2 data, which has the lowest slopes (with values a = 0.460 for winter, a = 0.577 for spring, a = 0.561 for summer and a = 0.512 for autumn), while MODIS always obtains the highest intercepts (with values b = 0.060 for winter, b = 0.111 for spring, b = 0.087 for summer and b = 0.082 for autumn).
For comparison, the intercepts obtained by MERRA-2 vary between b = 0.015 and b = 0.055 . The best RMB is obtained by MODIS, with values varying between 0.865 and 1.161, while MERRA-2 shows a clear underestimation with RMB varying between 0.585 and 0.739. Concerning RMSD rel and MAE, there seems to be no clear distinction between the datasets for this station.
The differences become clearer in the case of Ouarzazate, a higher altitude site located on the southeastern flank of the Atlas Mountains and north of the Sahara desert. For all seasons, MERRA-2 obtains the best correlation coefficients (ranging from r = 0.623 to r = 0.812 ), intercepts (ranging from b = 0.021 to b = 0.085 ), RMSD rel (ranging from 44.515 % to 67.991 %) and MAE (ranging from 0.021 to 0.081). For this location, intercepts, RMSD rel and MAE have larger values for MODIS and CAMS. Indeed, MODIS shows intercepts ranging from 0.064 to 0.183, RMSD rel ranging from 64.550% to 207.028% and MAE ranging from 0.083 to 0.141, and CAMS obtains results that lie between those of the two other datasets. Finally, MERRA-2 obtains RMB values that are closest to unity except for the summer season when RMB = 0.857 for MERRA-2 and RMB = 1.071 for CAMS. MODIS and CAMS show slopes that are closer to unity, but they also tend to have much higher intercepts. It also becomes noticeable that the slope with the MERRA-2 data is always lower than unity, regardless of the season or station. Therefore, MERRA-2 tends to underestimate AERONET AODs, which is particularly noticeable for the winter ( a = 0.525 ) and summer ( a = 0.548 ) seasons. In contrast, MODIS is found to overestimate AOD measurements compared to ground-based observations during winter ( a = 1.290 ) and autumn ( a = 1.050 ), while it underestimates during spring ( a = 0.854 ) and summer ( a = 0.703 ).
As a consequence, in terms of reliability and consistency, the MERRA-2 data appear to fit better for the study region. Although CAMS sometimes outperforms MERRA-2 in terms of slope, RMSD rel or RMB, the latter shows a relatively constant performance across all seasons and altitudes, whereas the performance of MODIS is highly dependent on altitude and seasons.

3.2.2. Spatial Comparison

Another way to compare gridded datasets is to construct their corresponding averaged 2D maps and compute their differences in order to clearly show disparities. In that regard, we processed the monthly averaged AOD 550 values from MODIS and from MERRA-2 over the 2000–2020 period. For this purpose, AOD 550 values from MODIS and MERRA-2 were interpolated on the same grid and averaged for the winter (DJF) and summer (JJA) seasons. Figure 8 shows the summer (upper panels) and winter (lower panels) distributions of AODs obtained over Morocco by MODIS (left) and MERRA-2 (middle), and the difference between both datasets (Figure 8c,f). The summer maps clearly show the highest values in the AOD distribution, particularly in Southern Morocco, confirming that summer is the dust loading season. As expected, both MODIS and MERRA-2 indicate the lowest AOD values over the Atlas Mountains, but show discrepancies over the Sahara and along the Atlantic coast (Figure 8c), which underlines the limitation of AOD retrieval algorithms with regard to desert and marine particles. There is also a noticeable difference along the Atlas Mountains, which could be due to the complexity of the terrain and the effect of altitude [15,29]. Because the disparities are greatest where the AOD is high, this result may highlight the uncertainties that are associated with high AOD values. This was emphasized by Liu et al., 2018, who reported that MODIS underestimates AOD measurements compared to CALIPSO in Central China during the dust loading season [4]. In any case, the comparison of such gridded datasets would be more relevant with the use of finer spatial resolutions.
The relatively low AOD values during winter (Figure 8d,e) are likely to result from the rainy season in Morocco, which generally lasts from October to April. In fact, winter atmospheric conditions with low pressure and increased rainfall enhance atmospheric circulation and air washout, leading to a low aerosol load [42]. However, there were some differences between the AOD from MERRA-2 and MODIS, shown in Figure 8f. Furthermore, the AOD difference map for winter in Figure 8f is in agreement with the rainfall distribution maps from Ajhar et al., 2018, and Sebbar et al., 2011 [43,44].

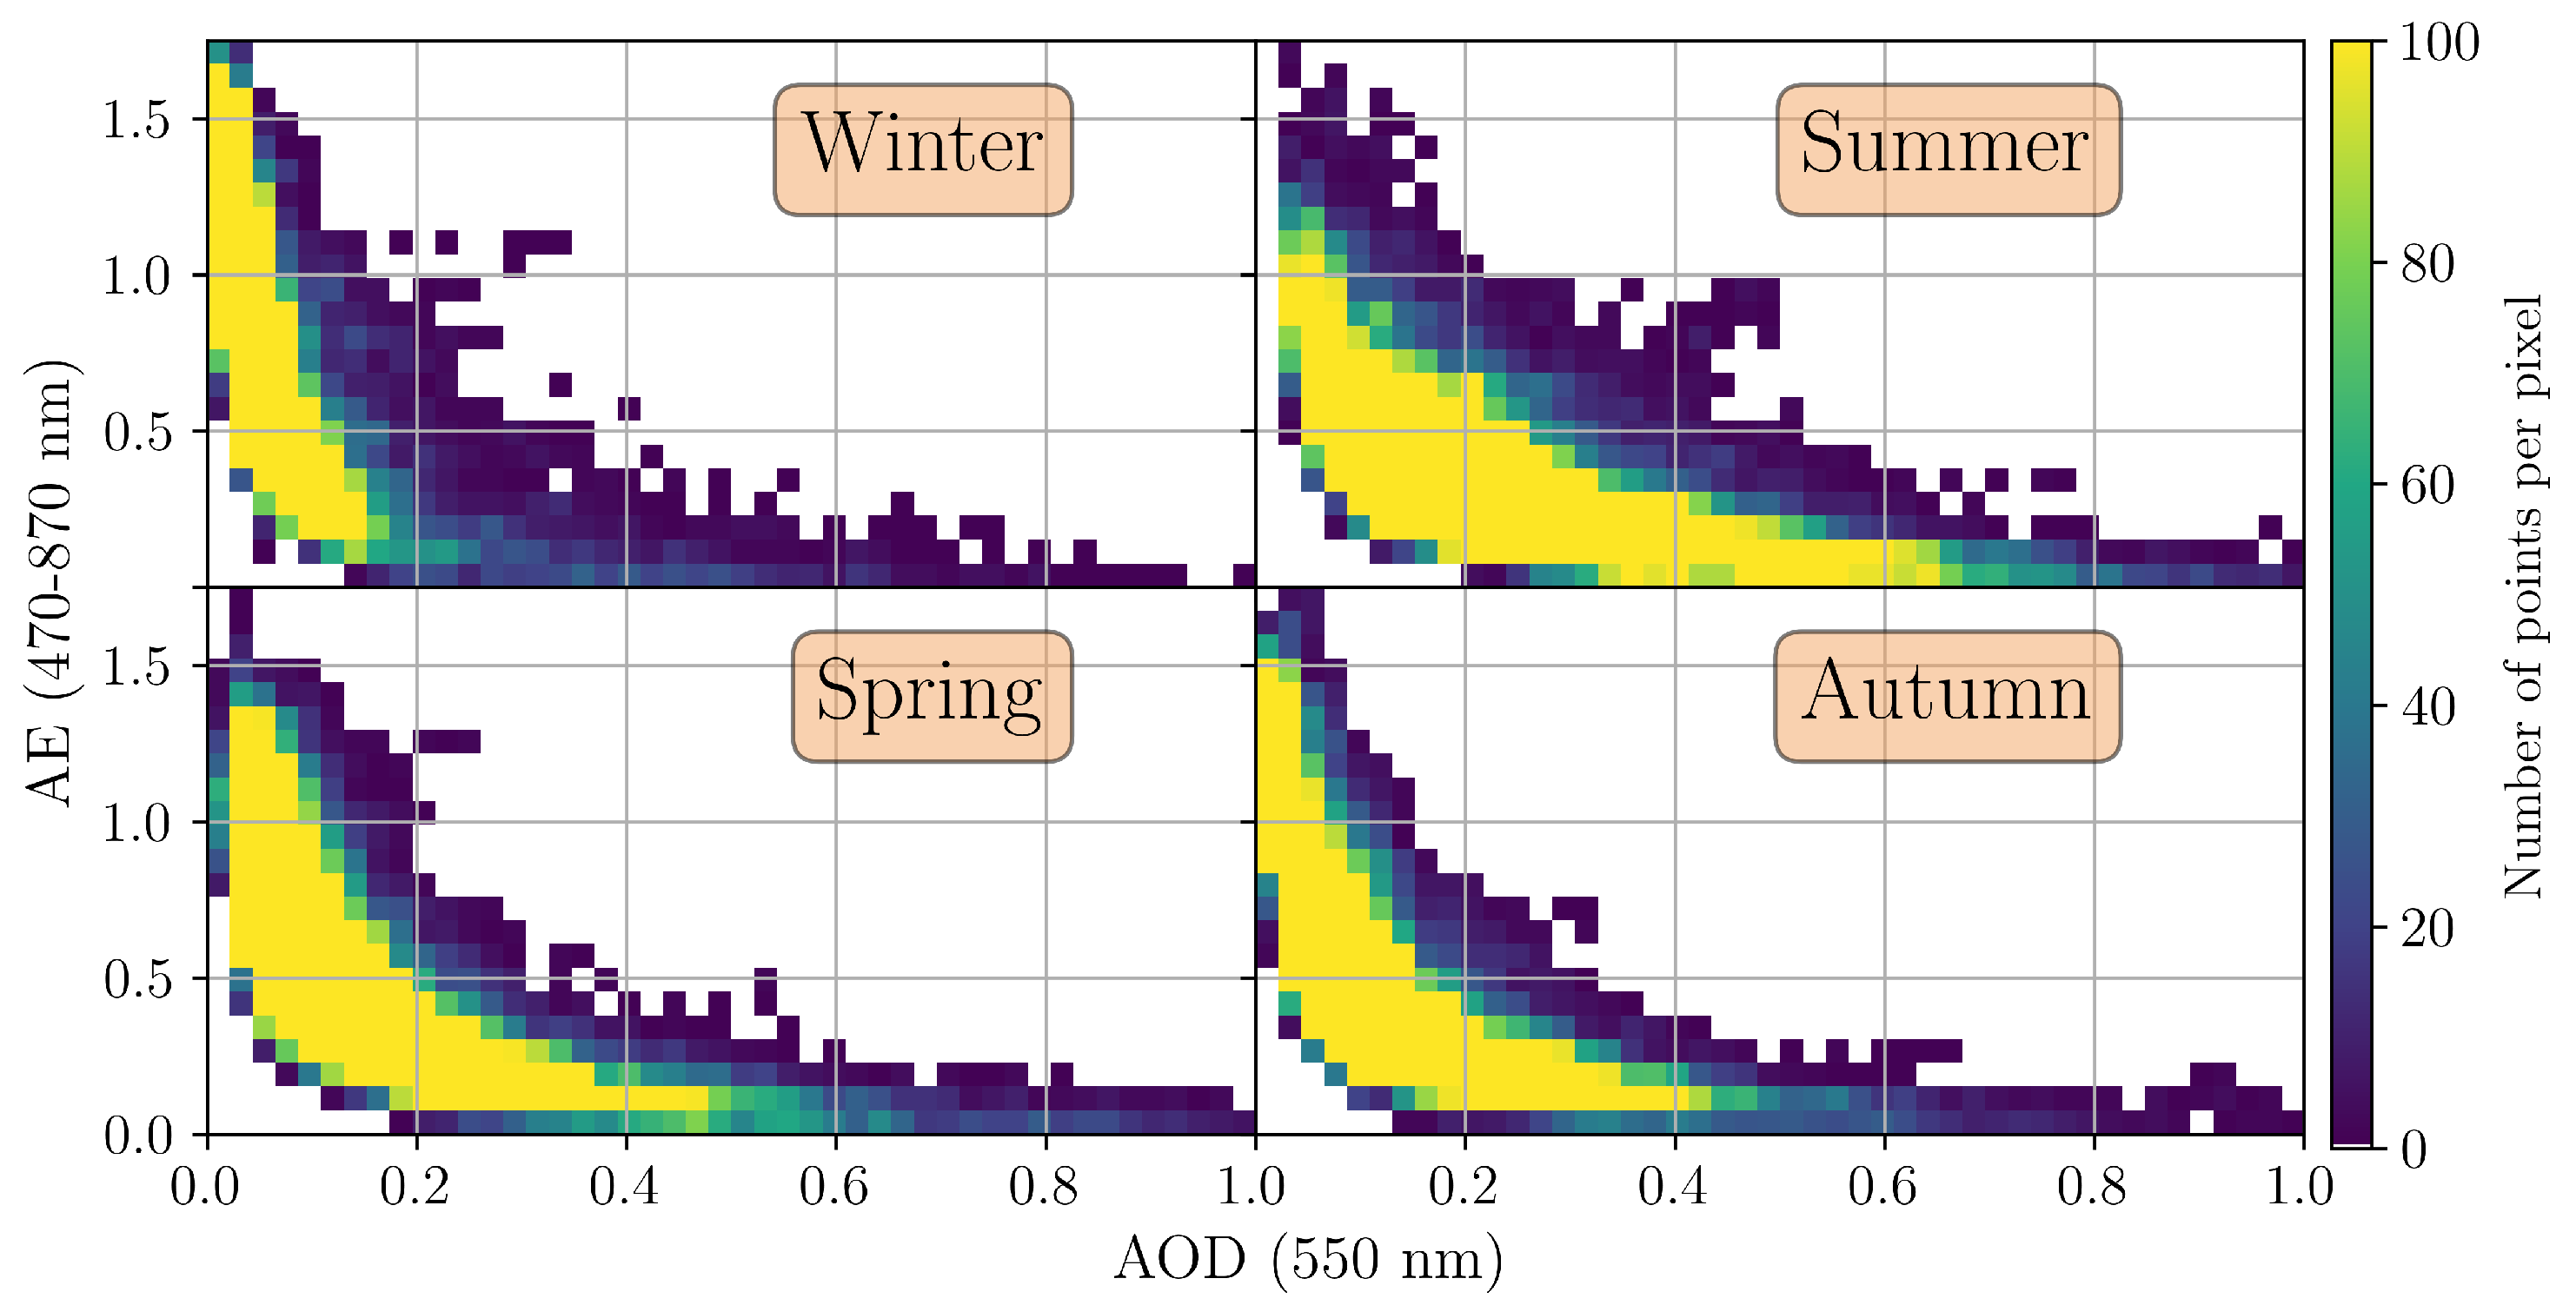
3.3. Classification of Aerosol Types

Given that MERRA-2 fits better for the study area in terms of aerosol content, it can be used to find optical properties and the dominant types of aerosol in the region. The discrimination of aerosol types can be achieved by relating AOD and AE, since both are linked and wavelength-dependent. AOD 550 and AE 470 870 obtained from MERRA-2 during the 2004–2020 period were used and grouped by season for the Saada site. The obtained seasonal distributions are shown in Figure 9 and allow to classify the aerosol types observed over the study site. This figure also displays the AOD 550 and AE 440 870 from sun-photometer observations (red dots). As explained by Kumar et al., 2015, the density number distribution between AOD and AE allows to classify certain types of aerosols depending on the location [8].
Similar AE-AOD density numbers are obtained from the two datasets, MERRA-2 and AERONET. Points close to the origin with AOD < 0.1 and AE < 1 indicate background conditions with clean marine aerosol type. It can be seen from Figure 9 that this type of particle is poorly represented over Saada during summer. It also clearly appears that winter density numbers are dominated by continental anthropogenic aerosols, which are characterized by AOD < 0.1 and AE > 1 . This type of aerosol is observed in the other seasons but with lower densities, especially during summer. In fact, during the summer season (Figure 9b), the number density highlights aerosols with AOD > 0.3 and AE < 0.7 . According to Kumar et al., 2015, and Pace et al., 2006, these particles could be associated with desert dust aerosols [8,45]. This type of aerosol is also found in spring and autumn distributions (Figure 9c,d), but with weaker density. Furthermore, ground-based observations from Figure 9 reveal for all seasons the presence of aerosols with AOD > 0.2 and AE > 1.0 from urban and industrial anthropogenic activities or from biomass burning.
The mean AOD and AE values obtained from MERRA-2 also show a seasonal behavior. The mean values for AOD 550 are 0.07, 0.15, 0.24 and 0.13 for winter, spring, summer and autumn, respectively, while the mean AE 470 870 values are 0.81, 0.63, 0.47 and 0.62 for the same respective seasons. This indicates that summer has the highest mean AOD and lowest mean AE, whereas winter has the highest mean AE and lowest mean AOD. As such, Figure 9 confirms the presence of a well-defined seasonal behavior for aerosol distributions. Similarly to what can be seen in Figure 8, the AOD associated with desert dust aerosols increases significantly during summer and decreases in autumn before reaching a minimum in winter. Very similar seasonal variability can be seen with Figure A1,Figure A2,Figure A3 in the Appendix B that display the same results for the other stations, highlighting the fact that all the stations are prone to the same summer dust flow.

3.4. HYSPLIT Simulations

In order to investigate the role of atmospheric circulation in aerosol variability in Southern Morocco, we used the HYSPLIT model to simulate air-mass back-trajectories for the Saada site. For the sake of clarity, the results are displayed by separating seasons and lower height levels (500 m, 1 km and 1.5 km) from upper height levels (3 km, 4 km and 5 km). Air-mass back-trajectories obtained for the lower and upper heights during summer season from 2005 to 2020 are superimposed in Figure 10 and Figure 11, respectively.
The particles over Saada during summer in Figure 10 show different origins, regardless of height variations. Some of them were transported over the Atlantic Ocean or the Celtic sea and others over the Mediterranean Sea or the Sahara desert. Overall, the origins of the particles appear to be diverse. Nevertheless, the cluster analysis reveals some prevailing trajectories. For the lower heights, it seems that the majority of air-masses have a local origin, with 39.58% of trajectories accounting for local recirculation around the study point.
The aerosols associated with these trajectories can be of industrial/urban origin or represent desert dust aerosols. In total, 25.00% of trajectories are found to have originated from the north, accounting for a southward latitudinal transport. Most of these particles originate from the south of Europe and can therefore be associated with fine-mode anthropogenic aerosols. Furthermore, 20.24% of the trajectories originated in the east and most likely correspond to desert dust aerosols, while a lower proportion of air-masses (15.18%) were advected from the west (i.e., over the Atlantic Ocean) and can be associated with oceanic aerosols.
The trajectories obtained for the upper heights in Figure 11 contrast with those obtained for the lower heights. The majority of air-masses originate from the Sahara in the east (51.49%) and from the Moroccan coast in the southeast (25.3%). A lower number of trajectories had their origin either in the near (14.29%) or far (8.93%) Atlantic Ocean. Hence, most of the trajectories can probably be attributed to dust and oceanic aerosols.
The results for winter’s low height packet in Figure 12 highlight different dynamics. The trajectories are much longer than those obtained during summer, underlining the presence of a transatlantic wind, which brings a vast majority of particles from the American continent and the Atlantic Ocean. Half of the trajectories originate in the north (14.88%) or the northwest (with 26.79% of advections from the far Atlantic Ocean and 8.33% from the American continent (not shown)), while the other half accounts for local recirculation around the study point.
Similar results can be drawn for the upper height packet. As shown in Figure 13, the majority of trajectories originate from the northwest, and few air movements occur over Africa. This shows a predominance of westerly winds, with 77.69% of trajectories originating from both the American continent and the Atlantic Ocean, which can result in a combination of anthropogenic and oceanic aerosols.
Therefore, the winter meteorological conditions seem to be responsible for a majority of longer trajectories reaching across the Atlantic Ocean, whereas summer conditions bring air-masses from a shorter distance, mainly from the Sahara desert in the east. It seems likely that Saada’s air column is more impacted by desert dust aerosols during the summer. The advections from Southern Europe and from the Atlantic Ocean may also bring urban and oceanic aerosols, accounting for the coexistence of different aerosol types. In contrast, winter seems to bring a majority of particles from the Atlantic Ocean or the American continent, inducing a lower amount of desert dust aerosols.
To support these findings, a study by Benchrif et al., 2018, reported Moroccan summer and winter to have distinct atmospheric circulation characteristics, with winter being influenced by winds from the Atlantic Ocean and the Mediterranean Sea, similarly to what is being observed in the present work [17]. However, their study focused on Tetouan in Northern Morocco. Allouhi et al., 2017, have considered mean wind speeds and directions at different coastal sites in Morocco and have showed that southern sites are mostly influenced by northerly winds (which is also shown by our results for the lower height packet), while northern sites are prone to westward and eastward air flows with higher speeds during winter [46].

4. Conclusions

The present paper focuses on the typology, seasonality and transport of aerosols in Southern Morocco, with the primary goal being to assess satellite or assimilation data over the study sites. The presentation of the daily and multi-year results obtained with four AERONET stations (Saada, Ouarzazate, Oukaïmeden and Ras-El-Aïn) showed the annual cycle of the AOD and AE as well as their anti-correlation. The prevalence of coarse mode aerosols in AVSD distributions also indicates the predominance of dust aerosols, most notably during summer.
Due to the paucity of AERONET observations, a comparative study between satellite (MODIS) and assimilation (MERRA-2 and CAMS) datasets was carried out. This comparative study demonstrated that all three datasets yield different results over the study region and that MERRA-2 agrees slightly better than the other datasets with ground-based AERONET observations. In fact, statistical results concerning the complete time series show that MERRA-2 consistently obtains the best correlation coefficients (ranging from r = 0.758 to r = 0.844 ) and intercepts (ranging from b = 0.021 to b = 0.070 ), depending on the study site. MERRA-2 reanalyses were then used to construct 2D maps showing the climatological variations in AOD distributions over Morocco and the surrounding areas. These 2D maps also showed that AOD associated with desert dust aerosols increases significantly during summer and decreases in autumn before reaching a minimum in winter. This seasonal variability highlights the fact that the study region is prone to summer dust flows during late spring and summer.
Finally, in order to investigate the seasonal variability in the transport process, the HYSPLIT model was used to simulate air-mass back-trajectories over Saada for the summer and winter months of the 2004–2020 period. The results showed a clear distinction between summer and winter meteorological conditions. Indeed, during summer months, air movements are heterogeneous, inducing the coexistence of different types of aerosols, such as oceanic, anthropogenic and desert aerosols. On the other hand, winter meteorological conditions bring a majority of particles from the northwest, inducing a much lower proportion of desert dust aerosols.

Author Contributions

Conceptualization, T.M. and H.B.; Funding acquisition, H.B.; Methodology, T.M. and H.B.; Project administration, H.B.; Software, T.M. and M.R.; Validation, T.M., H.B. and A.B.; Writing—original draft, T.M.; Writing—review and editing, H.B., A.B., N.B., K.L., Z.B., T.P., V.D. and M.R. All authors have read and agreed to the published version of the manuscript.

Funding

This research received no external funding.

Acknowledgments

Authors acknowledge AERONET PIs (Bernard Mougenot, Saïd Khabba, Olivier Hagolle, Emilio Cuevas-Agullo and Taoufik Zaidouni) for maintaining the sun-photometers at Saada, Ouarzazate, Oukaïmeden and Ras-El-Aïn (https://aeronet.gsfc.nasa.gov/), accessed on 19 April 2022; the National Aeronautical and Space Administration (NASA) for providing MODIS and MERRA-2 aerosol products; as well as the European Centre for Medium-Range Weather Forecasts (EWMWF) for providing CAMS aerosol products. The authors also thank the NOAA Air Resource Laboratory (ARL) for the provision of the HYSPLIT transport and dispersion model (https://www.ready.noaa.gov) (accessed on 19 April 2022) used in this publication. Finally, the authors express their gratitude to the reviewers for their informative comments, which helped to improve the quality of the article.

Conflicts of Interest

The authors declare no conflict of interest.

Abbreviations

The following abbreviations are used in this manuscript:
AODAerosol Optical Depth
AEAngström Exponent
AVSDAerosol Volumetric Size Distribution
RMSD rel Relative Root-Mean Squared Error
MAEMean Absolute Error
RMBRelative Mean Bias
AERONETAErosol RObotic NETwork
MODISMODerate resolution Imaging Spectroradiometer
MERRA-2Modern-Era Retrospective analysis for Research and Applications
CAMSCopernicus Atmosphere Monitoring Service
HYSPLITHYbrid Single Particle Lagrangian Integrated Trajectory
SAMUMSaharan Mineral Dust Experiment
EUCAARIEuropean Integrated Project on Aerosol–Cloud–Climate and Air Quality Interactions

Appendix A

This section of the appendix details the exhaustive results of the statistical analysis performed on the different study sites. Table A1 presents results for the whole AERONET time series of the four stations. Table A2 and Table A3 present seasonal results for the Saada and Ouarzazate sites, respectively.
Table A1. Statistical results of the comparison between MODIS, MERRA-2, CAMS and AERONET AODs.
DatasetMODISMERRA-2CAMS
Station (I)Saada
N308734953495
Slope0.6520.6020.607
Intercept0.0810.0210.057
r0.7780.8440.718
RMSD rel (%)50.05552.89057.280
MAE0.0790.0780.084
RMB1.0560.7370.906
Station (II)Ouarzazate
N99810611061
Slope0.8620.6510.729
Intercept0.1290.0400.070
r0.7110.8430.746
RMSD rel (%)113.69255.42174.248
MAE0.1230.0480.072
RMB1.7500.9671.236
Station (III)Oukaïmeden
N141154154
Slope1.0160.9500.958
Intercept0.1630.0700.120
r0.5680.7580.530
RMSD rel (%)170.51576.188139.868
MAE0.1660.0690.121
RMB2.4721.6562.088
Station (IV)Ras-El-Aïn
N385414414
Slope0.6310.5770.750
Intercept0.0850.0240.031
r0.7890.8150.765
RMSD rel (%)43.45952.56448.726
MAE0.0870.1010.094
RMB0.9140.6410.822
Table A2. AOD seasonal statistical parameters as derived from the comparison between MODIS, MERRA-2, CAMS and AERONET observations over Saada.
DatasetMODISMERRA-2CAMS
Season (I)Winter
N735837837
Slope0.5740.4600.647
Intercept0.0600.0150.024
r0.6840.6930.615
RMSD rel (%)55.98568.06668.986
MAE0.0470.0560.058
RMB1.0820.5850.850
Season (II)Spring
N714881881
Slope0.6440.5770.600
Intercept0.1110.0350.076
r0.6830.8130.673
RMSD rel (%)57.68049.99455.916
MAE0.0920.0720.083
RMB1.1610.7390.950
Season (III)Summer
N866899899
Slope0.6180.5610.561
Intercept0.0870.0550.082
r0.7940.8150.659
RMSD rel (%)38.58745.00450.295
MAE0.1000.1100.120
RMB0.8650.7180.794
Season (IV)Autumn
N772878878
Slope0.6850.5120.498
Intercept0.0820.0330.079
r0.6900.7520.623
RMSD rel (%)53.95654.88954.894
MAE0.0760.0730.072
RMB1.1100.6810.904
Table A3. AOD seasonal statistical parameters as derived from the comparison between MODIS, MERRA-2, CAMS and AERONET observations over Ouarzazate.
DatasetMODISMERRA-2CAMS
Season (I)Winter
N234244244
Slope1.2900.5250.875
Intercept0.0640.0210.026
r0.5800.6230.590
RMSD rel (%)207.02867.991104.099
MAE0.0830.0210.037
RMB2.3910.8811.320
Season (II)Spring
N283303303
Slope0.8540.6110.746
Intercept0.1490.0510.079
r0.5740.7660.734
RMSD rel (%)137.35755.71670.456
MAE0.1410.0480.073
RMB1.9350.9721.304
Season (III)Summer
N273282282
Slope0.7030.5480.540
Intercept0.1830.0850.146
r0.7110.7880.588
RMSD rel (%)64.55044.51559.588
MAE0.1360.0810.115
RMB1.3770.8571.071
Season (IV)Autumn
N208232232
Slope1.0500.7240.712
Intercept0.1170.0340.064
r0.5630.8120.718
RMSD rel (%)191.51354.36678.222
MAE0.1270.0340.055
RMB2.3481.0851.384

Appendix B

This section of the appendix documents the density number charts for the Ouarzazate, Oukaïmeden and Ras-El-Aïn stations.
Figure A1. Density number plot between MERRA-2 AOD and AE (2002–2020) per season over Ouarzazate.
Atmosphere 13 00923 g0a1
Figure A2. Density number plot between MERRA-2 AOD and AE (2002–2020) per season over Oukaïmeden.
Atmosphere 13 00923 g0a2
Figure A3. Density number plot between MERRA-2 AOD and AE (2002–2020) per season over Ras-El-Aïn.
Atmosphere 13 00923 g0a3

References

  1. de Oliveira Alves, N.; Vessoni, A.T.; Quinet, A.; Fortunato, R.S.; Kajitani, G.S.; Peixoto, M.S.; de Souza Hacon, S.; Artaxo, P.; Saldiva, P.; Menck, C.F.M.; et al. Biomass burning in the Amazon region causes DNA damage and cell death in human lung cells. Sci. Rep. 2017, 7, 10937. [Google Scholar] [CrossRef]
  2. Onishi, K.; Otani, S.; Yoshida, A.; Mu, H.; Kurozawa, Y. Adverse Health Effects of Asian Dust Particles and Heavy Metals in Japan. Asia Pac. J. Public Health 2015, 27, NP1719–NP1726. [Google Scholar] [CrossRef] [Green Version]
  3. Tripathi, S.N.; Dey, S.; Chandel, A.; Srivastava, S.; Singh, R.P.; Holben, B.N. Comparison of MODIS and AERONET derived aerosol optical depth over the Ganga Basin, India. Ann. Geophys. 2005, 23, 1093–1101. [Google Scholar] [CrossRef] [Green Version]
  4. Liu, B.; Ma, Y.; Gong, W.; Zhang, M.; Wang, W.; Shi, Y. Comparison of AOD from CALIPSO, MODIS, and Sun Photometer under Different Conditions over Central China. Sci. Rep. 2018, 8, 10066. [Google Scholar] [CrossRef] [Green Version]
  5. Bègue, N.; Shikwambana, L.; Bencherif, H.; Pallotta, J.; Sivakumar, V.; Wolfram, E.; Mbatha, N.; Orte, F.; Preez, D.J.D.; Ranaivombola, M.; et al. Statistical analysis of the long-range transport of the 2015 Calbuco volcanic plume from ground-based and space-borne observations. Ann. Geophys. 2020, 38, 395–420. [Google Scholar] [CrossRef] [Green Version]
  6. Aldabash, M.; Balcik, F.B.; Glantz, P. Validation of MODIS C6.1 and MERRA-2 AOD using AERONET observations: A comparative study over Turkey. Atmosphere 2020, 11, 905. [Google Scholar] [CrossRef]
  7. Ogunjobi, K.O.; Awoleye, P.O. Intercomparison and Validation of Satellite and Ground-Based Aerosol Optical Depth (AOD) Retrievals over Six AERONET Sites in West Africa. Aerosol Sci. Eng. 2019, 3, 32–47. [Google Scholar] [CrossRef]
  8. Kumar, K.R.; Yin, Y.; Sivakumar, V.; Kang, N.; Yu, X.; Diao, Y.; Adesina, A.J.; Reddy, R.R. Aerosol climatology and discrimination of aerosol types retrieved from MODIS, MISR and OMI over Durban (29.88° S, 31.02° E), South Africa. Atmos. Environ. 2015, 117, 9–18. [Google Scholar] [CrossRef]
  9. Banks, J.R.; Brindley, H.E.; Flamant, C.; Garay, M.J.; Hsu, N.C.; Kalashnikova, O.V.; Klüser, L.; Sayer, A.M. Intercomparison of satellite dust retrieval products over the west African Sahara during the Fennec campaign in June 2011. Remote Sens. Environ. 2013, 136, 99–116. [Google Scholar] [CrossRef]
  10. Chaboureau, J.P.; Flamant, C.; Dauhut, T.; Kocha, C.; Lafore, J.P.; Lavaysse, C.; Marnas, F.; Mokhtari, M.; Pelon, J.; Martínez, I.R.; et al. Fennec dust forecast intercomparison over the Sahara in June 2011. Atmos. Chem. Phys. 2016, 16, 6977–6995. [Google Scholar] [CrossRef] [Green Version]
  11. Heintzenberg, J. The SAMUM-1 experiment over Southern Morocco: Overview and introduction. Tellus B Chem. Phys. Meteorol. 2009, 61, 2–11. [Google Scholar] [CrossRef]
  12. Dinter, T.; Hoyningen-Huene, W.V.; Burrows, J.P.; Kokhanovsky, A.; Bierwirth, E.; Wendisch, M.; MüLLER, D.; Kahn, R.; Diouri, M. Retrieval of aerosol optical thickness for desert conditions using MERIS observations during the SAMUM campaign. Tellus B Chem. Phys. Meteorol. 2009, 61, 229–238. [Google Scholar] [CrossRef] [Green Version]
  13. Kandler, K.; SchüTZ, L.; Deutscher, C.; Ebert, M.; Hofmann, H.; JäCKEL, S.; Jaenicke, R.; Knippertz, P.; Lieke, K.; Massling, A.; et al. Size distribution, mass concentration, chemical and mineralogical composition and derived optical parameters of the boundary layer aerosol at Tinfou, Morocco, during SAMUM 2006. Tellus B Chem. Phys. Meteorol. 2009, 61, 32–50. [Google Scholar] [CrossRef] [Green Version]
  14. Toledano, C.; Wiegner, M.; Garhammer, M.; Seefeldner, M.; Gasteiger, J.; MüLLER, D.; Koepke, P. Spectral aerosol optical depth characterization of desert dust during SAMUM 2006. Tellus B Chem. Phys. Meteorol. 2009, 61, 216–228. [Google Scholar] [CrossRef]
  15. Bounhir, A.; Benkhaldoun, Z.; Mougenot, B.; Sarazin, M.; Siher, E.; Masmoudi, L. Aerosol columnar characterization in Morocco: ELT prospect. New Astron. 2008, 13, 41–52. [Google Scholar] [CrossRef] [Green Version]
  16. Bègue, N.; Tulet, P.; Chaboureau, J.P.; Roberts, G.; Gomes, L.; Mallet, M. Long-range transport of Saharan dust over northwestern Europe during EUCAARI 2008 campaign: Evolution of dust optical properties by scavenging. J. Geophys. Res. Atmos. 2012, 117, D17201. [Google Scholar] [CrossRef] [Green Version]
  17. Benchrif, A.; Guinot, B.; Bounakhla, M.; Cachier, H.; Damnati, B.; Baghdad, B. Aerosols in Northern Morocco: Input pathways and their chemical fingerprint. Atmos. Environ. 2018, 174, 140–147. [Google Scholar] [CrossRef]
  18. Tahiri, A.; Diouri, M. Radiative forcing of the desert aerosol at Ouarzazate (Morocco). E3S Web Conf. 2018, 37, 03004. [Google Scholar] [CrossRef]
  19. Tahiri, A.; Diouri, M.; Steli, H.; Marsli, I.; Meziane, R.; Ben-tayeb, A. Desert aerosol optical properties in Morocco. Environ. Sci. 2016, 4, 63–78. [Google Scholar] [CrossRef] [Green Version]
  20. Benkhaldoun, Z.; Abahamid, A.; Azhari, Y.E.; Lazrek, M. Optical seeing monitoring at the Oukaïmeden in the Moroccan high atlas mountains: First statistics. Astron. Astrophys. 2005, 441, 839–843. [Google Scholar] [CrossRef]
  21. Holben, B.N.; Eck, T.F.; Slutsker, I.; Tanré, D.; Buis, J.P.; Setzer, A.; Vermote, E.; Reagan, J.A.; Kaufman, Y.J.; Nakajima, T.; et al. AERONET—A Federated Instrument Network and Data Archive for Aerosol Characterization. Remote Sens. Environ. 1998, 66, 1–16. [Google Scholar] [CrossRef]
  22. Ångström, A. On the Atmospheric Transmission of Sun Radiation and on Dust in the Air. Geogr. Ann. 1929, 11, 156–166. [Google Scholar]
  23. Schuster, G.L.; Dubovik, O.; Holben, B.N. Angstrom exponent and bimodal aerosol size distributions. J. Geophys. Res. Atmos. 2006, 111, D07207. [Google Scholar] [CrossRef] [Green Version]
  24. Dubovik, O.; King, M.D. A flexible inversion algorithm for retrieval of aerosol optical properties from Sun and sky radiance measurements. J. Geophys. Res. Atmos. 2000, 105, 20673–20696. [Google Scholar] [CrossRef] [Green Version]
  25. Cuevas, E.; Romero-Campos, P.M.; Kouremeti, N.; Kazadzis, S.; Räisänen, P.; García, R.D.; Barreto, A.; Guirado-Fuentes, C.; Ramos, R.; Toledano, C.; et al. Aerosol optical depth comparison between GAW-PFR and AERONET-Cimel radiometers from long-term (2005–2015) 1 min synchronous measurements. Atmos. Meas. Tech. 2019, 12, 4309–4337. [Google Scholar] [CrossRef]
  26. Raptis, I.P.; Kazadzis, S.; Amiridis, V.; Gkikas, A.; Gerasopoulos, E.; Mihalopoulos, N. A Decade of Aerosol Optical Properties Measurements over Athens, Greece. Atmosphere 2020, 11, 154. [Google Scholar] [CrossRef] [Green Version]
  27. Giles, D.M.; Sinyuk, A.; Sorokin, M.G.; Schafer, J.S.; Smirnov, A.; Slutsker, I.; Eck, T.F.; Holben, B.N.; Lewis, J.R.; Campbell, J.R.; et al. Advancements in the Aerosol Robotic Network (AERONET) Version 3 database—Automated near-real-time quality control algorithm with improved cloud screening for Sun photometer aerosol optical depth (AOD) measurements. Atmos. Meas. Tech. 2019, 12, 169–209. [Google Scholar] [CrossRef] [Green Version]
  28. Mazzola, M.; Lanconelli, C.; Lupi, A.; Busetto, M.; Vitale, V.; Tomasi, C. Columnar aerosol optical properties in the Po Valley, Italy, from MFRSR data. J. Geophys. Res. Atmos. 2010, 115, D17206. [Google Scholar] [CrossRef] [Green Version]
  29. Bright, J.M.; Gueymard, C.A. Climate-specific and global validation of MODIS Aqua and Terra aerosol optical depth at 452 AERONET stations. Sol. Energy 2019, 183, 594–605. [Google Scholar] [CrossRef]
  30. Justice, C.O.; Townshend, J.R.G.; Vermote, E.F.; Masuoka, E.; Wolfe, R.E.; Saleous, N.; Roy, D.P.; Morisette, J.T. An overview of MODIS Land data processing and product status. Remote Sens. Environ. 2002, 83, 3–15. [Google Scholar] [CrossRef]
  31. Levy, R.C.; Mattoo, S.; Munchak, L.A.; Remer, L.A.; Sayer, A.M.; Patadia, F.; Hsu, N.C. The Collection 6 MODIS aerosol products over land and ocean. Atmos. Meas. Tech. 2013, 6, 2989–3034. [Google Scholar] [CrossRef] [Green Version]
  32. Randles, C.A.; da Silva, A.M.; Buchard, V.; Colarco, P.R.; Darmenov, A.; Govindaraju, R.; Smirnov, A.; Holben, B.; Ferrare, R.; Hair, J.; et al. The MERRA-2 aerosol reanalysis, 1980 onward. Part I: System description and data assimilation evaluation. J. Clim. 2017, 30, 6823–6850. [Google Scholar] [CrossRef]
  33. Gelaro, R.; McCarty, W.; Suárez, M.J.; Todling, R.; Molod, A.; Takacs, L.; Randles, C.A.; Darmenov, A.; Bosilovich, M.G.; Reichle, R.; et al. The modern-era retrospective analysis for research and applications, version 2 (MERRA-2). J. Clim. 2017, 30, 520–523. [Google Scholar] [CrossRef]
  34. Inness, A.; Ades, M.; Agustí-Panareda, A.; Barré, J.; Benedictow, A.; Blechschmidt, A.M.; Dominguez, J.J.; Engelen, R.; Eskes, H.; Flemming, J.; et al. The CAMS reanalysis of atmospheric composition. Atmos. Chem. Phys. 2019, 19, 3515–3556. [Google Scholar] [CrossRef] [Green Version]
  35. Draxler, R.; Hess, G. Description of the HYSPLIT4 Modelling System. NOAA Tech. Mem. ERL ARL-224 1997. Available online: https://www.arl.noaa.gov/documents/reports/arl-224.pdf (accessed on 25 August 2021).
  36. Draxler, R.; Hess, G. An overview of the HYSPLIT4 modeling system for trajectories, dispersion, and deposition. Aust. Meteorol. Mag. 1998, 47, 295–308. [Google Scholar]
  37. Taubman, B.F.; Hains, J.C.; Thompson, A.M.; Marufu, L.T.; Doddridge, B.G.; Stehr, J.W.; Piety, C.A.; Dickerson, R.R. Aircraft vertical profiles of trace gas and aerosol pollution over the mid-Atlantic United States: Statistics and meteorological cluster analysis. J. Geophys. Res. (Atmos.) 2006, 111, D10S07. [Google Scholar] [CrossRef] [Green Version]
  38. Francis, D.; Fonseca, R.; Nelli, N.; Cuesta, J.; Weston, M.; Evan, A.; Temimi, M. The Atmospheric Drivers of the Major Saharan Dust Storm in June 2020. Geophys. Res. Lett. 2020, 47, e90102. [Google Scholar] [CrossRef]
  39. Bencherif, H.; Bounhir, A.; Bègue, N.; Millet, T.; Benkhaldoun, Z.; Lamy, K.; Portafaix, T.; Gadouali, F. Aerosol Distributions and Sahara Dust Transport in Southern Morocco, from Ground-Based and Satellite Observations. Remote Sens. 2022, 14, 2454. [Google Scholar] [CrossRef]
  40. Zhao, T.X.P.; Stowe, L.L.; Smirnov, A.; Crosby, D.; Sapper, J.; McClain, C.R. Development of a Global Validation Package for Satellite Oceanic Aerosol Optical Thickness Retrieval Based on AERONET Observations and Its Application to NOAA/NESDIS Operational Aerosol Retrievals. J. Atmos. Sci. 2002, 59, 294–312. [Google Scholar] [CrossRef] [Green Version]
  41. Li, J.; Carlson, B.E.; Lacis, A.A. Assessing MODIS Aerosol Products Using AERONET Ground Measurements. 2010. Available online: https://modis.gsfc.nasa.gov/sci_team/meetings/201001/presentations/posters/atmos/li.pdf (accessed on 25 August 2021).
  42. Mokhtari, M.; Tulet, P.; Fischer, C.; Bouteloup, Y.; Bouyssel, F.; Brachemi, O. Three-dimensional dust aerosol distribution and extinction climatology over northern Africa simulated with the ALADIN numerical prediction model from 2006 to 2010. Atmos. Chem. Phys. 2015, 15, 9063–9082. [Google Scholar] [CrossRef] [Green Version]
  43. Ajhar, L.; Khachine, D.; Bakouri, A.; Kharrim, K.; Belghyti, D. Evolution de la pluviométrie de 1960 à 2015 au Maroc. Int. J. Res. Sci. Manag. 2018, 5, 47–56. [Google Scholar] [CrossRef]
  44. Sebbar, A.; Wadi, B.; Fougrach, H.; Hsaine, M. Etude de la variabilité du régime pluviométrique au Maroc septentrional (1935–2004). Sécheresse 2011, 22, 139–148. [Google Scholar] [CrossRef]
  45. Pace, G.; di Sarra, A.; Meloni, D.; Piacentino, S.; Chamard, P. Aerosol optical properties at Lampedusa (Central Mediterranean). 1. Influence of transport and identification of different aerosol types. Atmos. Chem. Phys. 2006, 6, 697–713. [Google Scholar] [CrossRef] [Green Version]
  46. Allouhi, A.; Zamzoum, O.; Islam, M.R.; Saidur, R.; Kousksou, T.; Jamil, A.; Derouich, A. Evaluation of wind energy potential in Morocco’s coastal regions. Renew. Sustain. Energy Rev. 2017, 72, 311–324. [Google Scholar] [CrossRef]
Figure 1. Geographical locations and above sea level (ASL) altitudes of the AERONET stations in southern Morocco.
Atmosphere 13 00923 g001
Figure 2. Daily AOD 440 values over Saada (in blue, from 1 July 2004 to 18 February 2020), Ouarzazate (in orange, from 10 February 2012 to 28 June 2015), Ras-El-Aïn (in green, from 4 March 2006 to 31 July 2007) and Oukaïmeden (in red, from 21 February 2009 to 16 September 2009). Monthly AOD 440 values over Saada from 10 February 2012 to 28 June 2015 are represented in purple.
Atmosphere 13 00923 g002
Figure 3. Multi-year mean AOD 440 (in blue) and AE 440 870 (in red) for Saada and Ouarzazate. The vertical bars represent the 1 σ standard deviation. The dashed lines represent Saada’s multi-year mean AOD 440 (in blue) and AE 440 870 (in red) from 10 February 2012 to 28 June 2015.
Atmosphere 13 00923 g003
Figure 4. Seasonal volumetric size distributions of aerosols for (a) Saada (2004–2020) and (b) Ouarzazate (2012–2015) averaged over winter (DJF), spring (MAM), summer (JJA) and autumn (SON). The dashed lines represent Saada’s seasonal aerosol volumetric size distribution from 10 February 2012 to 28 June 2015.
Atmosphere 13 00923 g004
Figure 5. Comparisons of AOD 440 between AERONET and MODIS (blue dots), MERRA-2 (orange dots) or CAMS (green dots) for (a) Saada, (b) Ouarzazate, (c) Oukaïmeden and (d) Ras-El-Aïn. The 1:1 line is represented by the dashed line.
Atmosphere 13 00923 g005
Figure 6. Comparisons of AOD 440 between AERONET and MODIS (blue dots), MERRA-2 (orange dots) or CAMS (green dots) over Saada for (a) winter, (b) spring, (c) summer and (d) autumn. The 1:1 line is represented by the dashed line.
Atmosphere 13 00923 g006
Figure 7. Comparisons of AOD 440 between AERONET and MODIS (blue dots), MERRA-2 (orange dots) or CAMS (green dots) over Ouarzazate for (a) winter, (b) spring, (c) summer and (d) autumn. The 1:1 line is represented by the dashed line.
Atmosphere 13 00923 g007
Figure 8. AOD 550 maps averaged for summer (JJA) and winter (DJF) from MODIS observations (a,d) and MERRA-2 reanalyses (b,e) over the 2000–2020 period. The rightmost column (c,f) indicates the difference, AOD MODIS - AOD MERRA 2 , for each season. The study sites are indicated by the red dots, and the color scales are displayed at the bottom of the plots.
Atmosphere 13 00923 g008
Figure 9. Density number plot between MERRA-2 AOD 550 and AE 470 870 per season over Saada: (a) Winter, (b) Summer, (c) Spring and (d) Autumn, over which are superimposed AERONET AOD 550 and AE 440 870 scatter plots (red dots) for the 2004–2020 period.
Atmosphere 13 00923 g009
Figure 10. HYSPLIT climatological modelling showing the trajectories of aerosols located over Saada during summer from 2005 to 2020 for lower heights (0.5, 1 and 1.5 km). The Saada location is marked with a black star. The black lines correspond to the trajectories obtained via cluster analysis and the percentages represent the ratio of trajectories used for the computation.
Atmosphere 13 00923 g010
Figure 11. HYSPLIT climatological modelling showing the trajectories of aerosols located over Saada during summer from 2005 to 2020 for upper heights (3, 4 and 5 km). The Saada location is marked with a black star. The black lines correspond to the trajectories obtained via cluster analysis and the percentages represent the ratio of trajectories used for the computation.
Atmosphere 13 00923 g011
Figure 12. HYSPLIT climatological modelling showing the trajectories of aerosols located over Saada during winter from 2005 to 2020 for low height levels.
Atmosphere 13 00923 g012
Figure 13. HYSPLIT climatological modelling showing the trajectories of aerosols located over Saada during winter from 2005 to 2020 for upper height levels.
Atmosphere 13 00923 g013
Publisher’s Note: MDPI stays neutral with regard to jurisdictional claims in published maps and institutional affiliations.

