Article

Numerical Simulation of Aspergillus Niger Spore Deposition in Nasal Cavities of a Population in Northwest China

1
Department of Otolaryngology Head and Neck Surgery, The Second Affiliated Hospital of Xi’an Jiaotong University, Xi’an 710000, China
2
School of Engineering, RMIT University, Bundoora, Melbourne, VIC 3001, Australia
3
School of Energy and Mechanical Engineering, Nanjing Normal University, Nanjing 210046, China
4
School of Energy and Environment, Southeast University, Nanjing 210096, China
5
Department of Oncology, The Second Affiliated Hospital of Xi’an Jiaotong University, Xi’an 710000, China
*
Authors to whom correspondence should be addressed.
Atmosphere 2022, 13(6), 911; https://doi.org/10.3390/atmos13060911
Submission received: 12 April 2022 / Revised: 30 May 2022 / Accepted: 31 May 2022 / Published: 4 June 2022

Abstract

:
Background: As common pathogens in the human respiratory tract, fungal-spore-related health risks have been challenging to evaluate properly. This paper presents numerical simulations of particle deposition of Aspergillus niger spores in human nasal cavities. Methods: 30 healthy adults (including 60 nasal chambers) who lived in northwest China were recruited to conduct a nasal cavity numerical simulation using computational fluid dynamics–discrete phase model (CFD-DPM). The deposition rate in each anatomic area and its influencing variables, such as body position and respiratory flow rate, were analyzed. Results: (1) Under a resting condition, only about 5.57% ± 1.51% Aspergillus niger spores were deposited in the nasal cavity, while most of them escaped from the nasopharynx, and 0.31% ± 0.20% spores entered the maxillary sinus; (2) under an exercising condition, spores deposited in the nasal cavity were about 2.09 times as many as that in the resting state; (3) in a lying position, the A. niger spores deposited evenly on the lateral wall of the nasal cavity and the sinus when compared with a standing position. However, the deposition rate in each anatomic area did not change significantly.

1. Introduction

Exposure to fungi can cause a variety of allergic respiratory diseases, such as chronic rhinosinusitis (CRS), allergic rhinitis (AR), asthma, allergic bronchopulmonary aspergillosis (ABPA), and allergic pneumonia [1,2,3,4], which can seriously threaten human health. Fungi spread and reproduce by producing spores. The respiratory tract is continuously exposed to fungal spores in our environments, and studies have shown a high proportion of fungi in nasal mucus and bronchial sputum cultures, even in healthy subjects [5,6]. Aspergillus is the main indoor fungus in humid environments [7,8,9], the most common fungus causing fungal sinusitis and fungal allergic rhinitis [10,11], and the most common type of fungus secreted from sinonasal aspirate in CRS patients [12]. The incidence of fungal rhinosinusitis occurs most commonly in the maxillary sinus, followed by the sphenoid sinus, ethmoid sinus, and frontal sinus.
Air-particle flow and particle-deposition analysis in the nasal airway can provide an important insight from the biomechanical aspect to better interpret the interplay between anatomy, physiology, and pathology of the nasal cavity. However, due to the complex anatomical structure of the nasal cavity, it remains very challenging to accurately quantify the local airflow and associated particle-exposure characteristics by using conventional measurement approaches [13], including laser particle counter, acoustic rhinometry [14], or various in vitro methods [15], due to the noninvasive nature and restricted resolution capacity. In recent years, with the development of computer technology, computational fluid dynamics (CFD) has emerged as one of the most effective means to study particle deposition in human airways. Our previous research [16] revealed that a wide range of mite allergens, including dust mite bodies, mite eggs, and fecal pellets, can enter the maxillary sinus via the accessory ostium, especially when people are in lying positions. The deposition of Artemisia pollen [17] in the nasal cavity is highly concentrated; the pollens concentrate mostly in the nasal septum, followed by the vestibule, middle turbinate area, and nasopharynx, and the inhalation velocity and the dry–wet degree of pollen are the main determinants of the deposition site. Other scholars used numerical simulations to study the deposition of fiber, wood dust, welding aerosol, anthrax, and other inhaled particles in nasal-cavity models [18,19,20,21,22].
Aspergillus niger is a common type of Aspergillus sp., and leads to a variety of diseases [23]. A. niger spores are characterized by a small diameter, wide distribution, and mycotoxin attachment [24]. However, after conducting an extensive literature review, we found no studies that focused on nasal exposure to Aspergillus niger spores. In addition, due to the heavy workload and high level of complexity involved in modeling and data analysis, previous numerical studies were largely restricted to a single nasal subject with faint statistical significance. To increase the clinical significance of this research, 30 subjects (60 nasal chambers) were obtained from healthy adults living in northwest China. For the first time, the deposition characteristics of A. niger spores in the nasal cavity and maxillary sinus were established based on our detailed anatomical (nasal mucosa area, nasal cavity volume, and the area–volume ratio) and physiological (regional flow in various regions of the nasal airway) analysis. Promisingly, this can provide scientific references for the precise prevention of and accurate drug use in fungal-related respiratory diseases.

2. Materials and Methods

2.1. Research Objects

A total of 30 healthy adult volunteers from northwest China were recruited, including 15 males and 15 females, aged (23.5 ± 3.4) years old (mean ± standard deviation). All participants were in a physically healthy condition without experiencing any respiratory diseases in the last 3 months prior to this research, including nasal obstruction, runny nose, or a history of nasal drug use. A nasal endoscopic examination was performed to exclude nasal diseases such as acute and chronic rhinitis, rhinosinusitis, obvious deviation or perforation of the nasal septum, hypertrophy of turbinate, and nasal malformation. This study was approved by the institutional review board and the medical ethics committee of the Second Affiliated Hospital of Xi’an Jiaotong University (Shaanxi Province, China) (batch number: 2015020). All participants signed a written informed consent after a full discussion with the authors regarding the relevant health-related facts and the risks involved.

2.2. Medical Imaging

After resting quietly for 10 min at room temperature, the secretions in the nasal cavity were cleaned, and the volunteers were placed in a supine position with the head fixed with the head brace to maintain the middle position. Siemens Dual Source photon CT scanning was performed, ranging from the upper edge of the frontal sinus to the upper level of the glottis, and the subjects were required to maintain an end-inspiratory hold state while scanning. The slice thickness was 0.625 mm with a resolution of 512 × 512 pixels, and the computed tomography (CT) scans, including coronal, axial, and sagittal images, were stored in Digital Imaging and Communications in Medicine (DICOM) format.

2.3. Three-Dimensional (3D) Reconstruction and CFD Simulation

The image data were imported into Mimics 19.0 software in DICOM format for threshold selection, 3D reconstruction, and measurement of area and volume. The reconstructed nasal airway models were saved in STL format. For each model, smoothing and regional division were performed in the Geomagic Wrap software (Figure 1), and the nasal cavity was divided into the maxillary sinus, nasal vestibule, nasal septum, inferior turbinate area (inferior turbinate and its lateral wall), middle turbinate area (middle turbinate and its lateral wall), superior nasal turbinate area (superior turbinate and its lateral wall), olfactory area, and nasopharynx [25] according to the anatomic region. Finally, the nasal model was imported into ICEM-CFD 2021 R1 and Fluent-Meshing 2021 R1 software to generate the mesh grid; a polyhedral mesh with five prism layers was created. After the mesh independence test, the calculation accuracy was satisfied when the number of polyhedral grids was 3.2–3.5 million.
The normal breathing volume of people in a resting condition is between 600 mL and 800 mL during each inspiratory phase or expiratory phase [26]. In this study, three seconds was set as one breathing cycle, and the inspiratory and exhalatory phases each lasted 1.5 s. After calculation, it was found that normal subjects could maintain the steady-state inspiratory condition when the inspiratory flow rate was 15 L/min. The airflow rate was set as 30 L/min under the low-load exercising condition. The anterior nostril was set as the pressure inlet, and the horizontal section below the nasopharynx was set as the airflow velocity outlet. The external temperature was set at 24 °C, and the wall temperature was set at 37 °C. The boundary of the nasal cavity was set as the fixed wall, and the nasal walls were set as the no-slip boundary. The air density was 1.225 kg/m3, and the dynamic viscosity coefficient was −1.7894 × 10⁵ kg/ms.
The governing equations were all incompressible viscous fluid Navier–Stokes equations, and a second-order upwind algorithm was used to calculate the nasal airflow during steady-state inhalation. When the inspiratory flow rate was 15 L/min, a laminar flow model was selected, and when the inspiratory flow rate was 30 L/min, the Realizable k-εSST turbulence model was adopted [27,28,29]. The computational fluid dynamics–discrete phase model (CFD-DPM) was applied in Fluent 2021 R1 software. Particles were released passively and uniformly from the front anterior nostril plane, and the aerodynamic equivalent diameter (AED) [30] of A. niger spores was set to 3.25 μm with a spherical shape; the average density was set to 1300 kg/m3. Detailed shape factors of the A. niger spores are listed in Table 1. However, in the real world, the A. niger spores may cling to each other, causing varied diameters, shape factors, and aerodynamic equivalent diameters, but this research only focused on the individual spore. Moreover, in the air humans inhale every day, the volume fraction of the spores is so sparse (lower than 10% of the total volume, which is called the dilute particle flow), so the effect of the presence of the particle on the airflow and the collision between the particles could be ignored [31].

2.4. Statistical Methods

All the data were showed as mean ± standard deviation (SD). A paired T-test was used for identifying differences between groups with different flow rates and different body positions. p < 0.05 was taken as a statistically significant value. Statistical analysis was performed using SPSS Statistics software version 19.0.

3. Results

3.1. Model Validation

The numerical method and meshing protocol applied in this study has been previously validated against experimental measurements. The deposition fraction results for particle diameters in the range of 1–100 nm were compared with existing published experimental data to confirm the reliability of the numerical simulation [33]. The CFD results for the pressure drop in the nasal geometry model was compared against rhinomanometry (Equipment Model NR6, GM Instruments, Irvine, Scotland) measurements for different flow rates, and the simulation results showed good agreement with the experimental data [16].

3.2. Geometric Characteristics of Nasal Cavity Model

The average unilateral nasal cavity mucosal area of healthy adults in northwest China was (89.7 ± 8.9) cm2, the volume was (11.2 ± 1.9) cm3, the area–volume ratio was (8.2 ± 1.5)−1, and the nasopharyngeal volume was (8.5 ± 3.0) cm3.

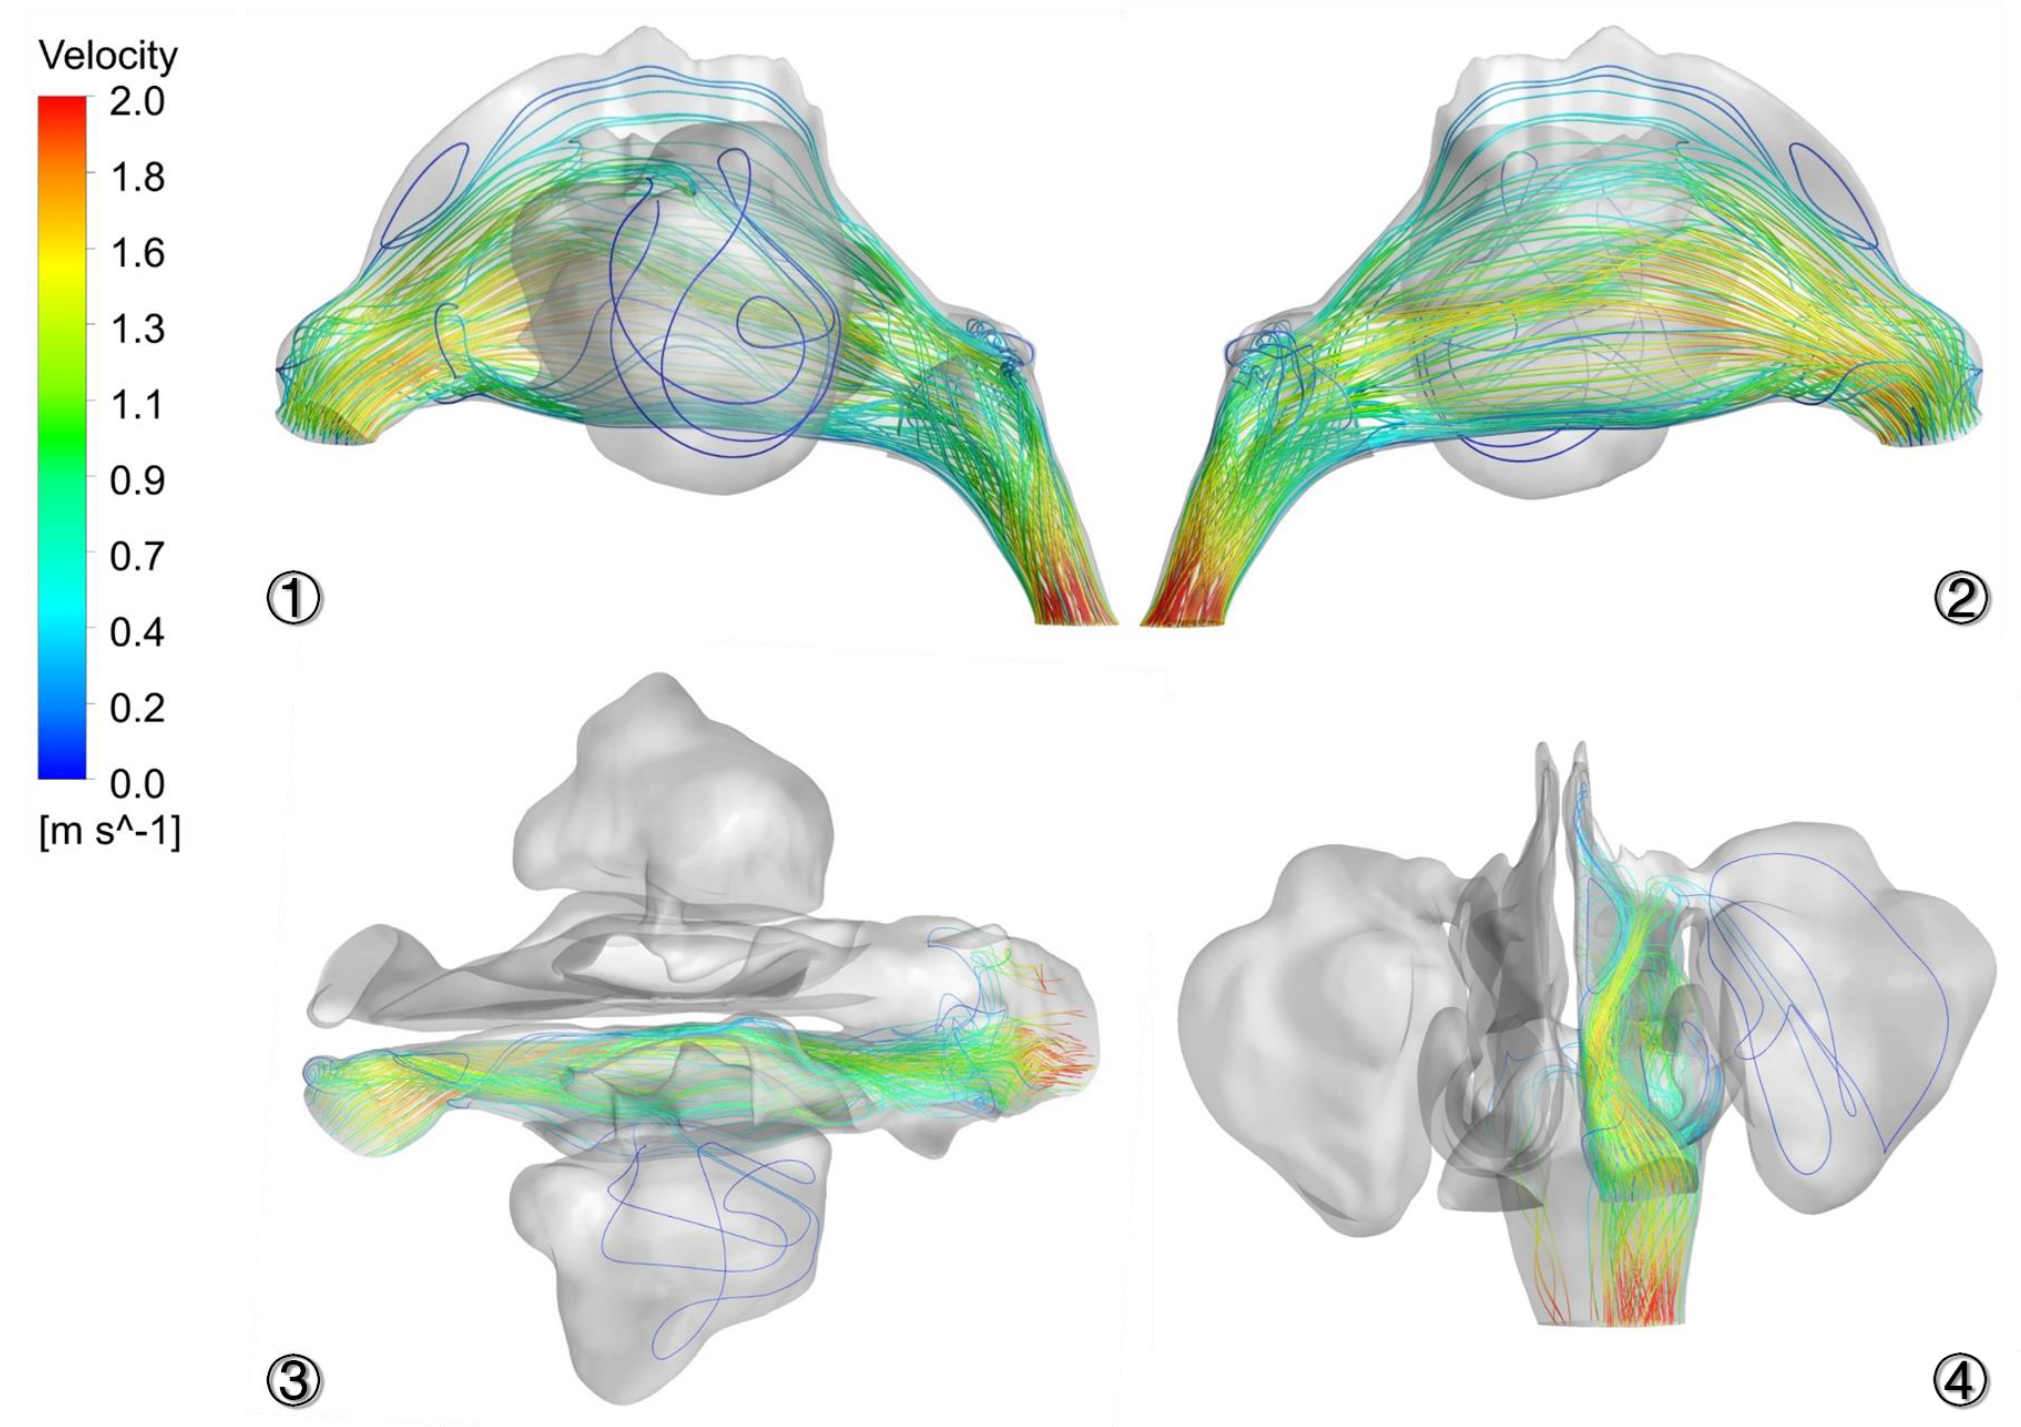
3.3. Airflow Characteristics in Nasal Cavity

The streamlines were released from the anterior nostril planes, which provided an intuitive visualization of the flow patterns. The distribution of nasal streamline when the inspiratory flow rate was 15 L/min is shown in Figure 2. The left side shows the left view, and the right side shows the right view. After the airflow entered the nasal vestibule, the majority of the airflow streamlines moved roughly 45°obliquely upward between the anterior nostril and the anterior part of the middle turbinate. When the streamlines reached the turbinate area behind the anterior part of middle turbinate, the airflow almost turned to the horizontal direction. After passing through the left and right nasal cavities, the airflow converged at posterior nares and turned obliquely downward, and then made a roughly 45° turn and moved vertically downward when it touched the nasopharyngeal posterior wall. The airflow in nasal cavity was dominated by laminar flow and supplemented by turbulent flow [34,35]. Two obvious whirlpools were formed in the anterosuperior nasal cavity and the anterior part of the inferior turbinate, which was caused by the sudden increase in the nasal cross-section area behind the nasal valve, resulting in local flow separation and counterflow. Only sparse streamlines could enter the maxillary sinus at a very low flow velocity. Most of the streamlines entered the sinus from the posterior part of the maxillary sinus accessory ostium at a relatively fast speed, and outflowed from the sinus at a much lower speed from the anterior part of the maxillary sinus accessory ostium.
To better display the complex airflow characteristics inside the nasal cavity, we took 15 representative planes perpendicular to the mainstream airflow for further study. They were separately located in the vestibular and nasal valve area (inlet to C3), the headend of the inferior turbinate (C4, C5), the anterior part of middle turbinate and the middle of the inferior turbinate area (C6, C7), nasopharynx (C10 to outlet), the ostium of the maxillary sinus (C12), and inside the maxillary sinus (C13, C14, C15). Features such as the direction of secondary flows and eddy current could be visualized by displaying the two-dimensional streamlines in the axial plane. Axial flow and secondary flow model diagrams for each plane are shown in Figure 3. Results from the inlet to C3 show that both axial flow and secondary flow underwent significant changes after entering the anterior nostril. Combined with Figure 1, the mainstream airflow was distributed eccentrically (red) as the direction of the nasal airway from the front nostril to the nasal valve area was gradually closer to the septum and also as the left and right diameter was gradually narrowed; meanwhile, the position of the mainstream gradually moved from the inferior inner side of the inlet section to the top outside of the C2 section. In addition, in the anterior nostril to nasal vestibular section, multiple airflow vortices were observed in the C2 to C3 plane due to the sudden increase in the airway cross-section area, suggesting airflow separation and recirculation. The airway planes from C4 to C8 were the turbinate area, in which the airflow was characterized by high-velocity regions centralized in the nasal common meatus and middle nasal meatus, rather than the olfactory area or nasal bottom. The cross-section area from C7 to C8 increased again, so the average flow rate began to slow down. The airway planes from C9 to the outlet were located at the confluence of the left and right nasal common meatus and nasopharynx, respectively; the airflow velocity in this area was significantly lower than that in the nasal cavity, and the velocity decreased by more than half. However, the airflow disturbance here was quite severe due to the confluence of airflow on both sides of the nasal cavity and the drastic change in the airway. Planes C12 to C15 were located at the entrance of maxillary sinus and inside the maxillary sinus, and were perpendicular to the main streamline of the maxillary sinus. Plan C12 shows that the high-velocity regions locate at the upward side of maxillary sinus ostium, which is also the inflow position of the main airflow. Apparent high-velocity regions were found from plane C13 to plane C15, manifesting a high-velocity region near the rear of the maxillary sinus, and showing the area where the airflow entered the maxillary sinus. The airflow entered from the rear of the maxillary sinus and gradually decreased in velocity along the sinus. Finally, the streamlines flowed along the antetheca of the sinus and flowed out at the front of accessory ostium at a much lower velocity, and then merged with the main airflow in the middle nasal meatus.

3.4. Spore-Deposition Distribution and Particle Trajectories in Nasal Cavity

Particle deposition is actually a process in which inhaled particles are “captured” by the respiratory mucosa, rather than entering deeper airways. The deposition rate of each site can be calculated using the following formula: deposition rate = the number of local deposited spores/total number of spores inhaled. The rate of spores escaping from the nasopharynx and entering the lower airway such as the trachea, bronchus, and lung tissue is called the escape rate, which can be calculated using the following equation: escape rate = quantities of spores escaped from nasopharynx/total inhaled spores. The local deposition of A. niger spore particles in the 15 L/min inspiratory state is shown in Figure 4①,②. To better distinguish the overlapping areas in the complex 3D image of the nasal cavity, spore particles deposited at different anatomical sites are shown in different colors.
The deposition of A. niger spores in each nasal site under the 15 L/min inspiratory condition in the standing position is shown in Figure 4①,②. Only 5.5702% ± 1.5100% of the A. niger spores were deposited in the nasal cavity, while the vast majority of them escaped from the nasopharynx (93.67% ± 1.56%). The most common deposition sites were successively the nasal vestibule (3.31% ± 1.05%), inferior turbinate area (0.908% ± 0.43%), nasopharynx (0.76% ± 0.43%), middle turbinate area (0.62% ± 0.39%), nasal septum (0.37% ± 0.17%), and maxillary sinus (0.31% ± 0.20%). The spore-deposition pattern in the nasal meatus and sinuses was characterized by geographical distribution; that is, the spores were mainly deposited at the bottom of each nasal meatus, the highest amount of spores was deposited in the inferior turbinate area, the least amount of spores was deposited in the superior turbinate area, and the amount of spores deposited in the lower side of maxillary sinus and nasopharynx was significantly higher than that in the upper side. In addition, the deposition rates in the superior turbinate area, olfactory area, and lateral wall of nasal atrium were all less than 0.1% (0.13‰ ± 0.35‰, 0.15‰ ± 0.22‰, 0.22‰ ± 0.38‰).
The particle trajectories of A. niger spores moving with airflow are shown in Figure 4③,④; the color represents the velocity of the particles at this position. As compared with the airflow diagram in Figure 2, when the airflow swerved sharply, few particle trajectories deviated from the main streamline, resulting in the deposition and collision of particles. Among all the inhaled spores, a small number of spores collided, and most of the spores could follow the airflow, proceeding through the common nasal meatus and entering beneath the nasopharynx; meanwhile, the particle trajectories in the superior turbinate region and olfactory region seemed rare, resulting in extremely sparse spores deposition in these areas.

3.5. Effects of Variables

3.5.1. Different Airflow

We further simulated an increased flow rate of 30 L/min that represented an exercising condition in order to better understand the behavior of the A. niger spores; the deposition diagram and particle trajectories are shown in Figure 5. With an increase in inspiratory velocity, the secondary flow, turbulent diffusion, and particle momentum in the nasal cavity were correspondingly increased. Similar to the resting condition, most of the spores escaped from the nasopharynx or were deposited in the nasal vestibule under the 30 L/min inspiratory conditions. However, the increase in airflow velocity led to an increased particle inertia, and the particle trajectories are relatively flat and straight, resulting in more spores being deposited in the nasal cavity due to particle collisions, while the proportion of spores that escaped from nasopharyngeal was reduced compared to the resting condition. In the exercising condition, the total spore deposition rate in the nasal cavity was 11.62% ± 3.67%, which was about 2.09 times as many as that in the resting state.
The deposition rates of the A. niger spores in each anatomical area in mucosa are shown in Figure 6 under the 30 L/min inspiratory condition while exercising. Compared with the 15 L/min inspiratory condition, the particle-deposition rates in the middle turbinate area and nasal vestibule (0.46‰ ± 0.60‰ vs. 3.73‰ ± 1.69‰, t = 10.236, p = 0.000) decreased sharply. The particle-deposition rate in each of the following areas of the lateral wall of the nasal cavity increased slightly: superior turbinate area (0.50‰ ± 0.70‰ vs. 0.13‰ ± 0.35‰, t = −3.771, p = 0.002), lateral wall of nasal atrium (0.25‰ ± 0.11‰ vs. 0.22‰ ± 0.38‰, t = −9.402, p = 0.000), maxillary sinus (0.41% ± 0.24% vs. 0.31% ± 0.20%,t = −2.580, p = 0.021), middle turbinate area (0.80% ± 0.45% vs. 0.62% ± 0.39%, t = −4.428, p = 0.000), nasal vestibule (3.97% ± 1.11% vs. 3.31% ± 1.05%, t = +4.749, p = 0.000), nasopharynx (0.90% ± 0.49% vs. 0.76% ± 0.43%, t = −3.005, p = 0.009), and inferior middle turbinate (1.21% ± 0.36% vs. 0.90% ± 0.43%, t = −4.927, p = 0.000). The escape rate decreased from 93.67% ± 1.56% to 92.28% ± 1.35% (t = 7.529, p = 0.000).

3.5.2. Different Body Positions

The deposition diagrams and particle trajectories of the A. niger spores under the 15 L/min inspiratory condition in a lying position are shown in Figure 7; the gravity direction was changed from the Z-axis to the X-axis direction (gravity direction of the left nasal chambers was +X, gravity direction of the right nasal chambers was −X). Compared with the deposition diagram shown in Figure 4, in a lying position, the spores were almost evenly distributed on the lateral wall of the nasal cavity and the lateral side of maxillary sinus, rather than mainly distributed in the lower side of the nasal cavities and maxillary sinus in a standing position. Compared with the particle trajectories shown in Figure 4, the spore tracks were deviated from the septum and close to the lateral wall of nasal cavity, resulting in a significant reduction in particle collisions on the septum and an increase in particle collisions on the lateral side of nasal cavity, which was closer to the ground.
As shown in Figure 8, compared with the standing position, there appeared to be no significant difference in deposition rates in each area of the nasal cavity in the lying position. While particle deposition on the nasal septum (0.0463% ± 0.0602% vs. 0.3727% ± 0.1687%, t = 10.236, p = 0.000) decreased, the particle-deposition rate in each of the following areas of the lateral wall of the nasal cavity increased slightly: superior turbinate area (0.0496% ± 0.0698% vs. 0.0127% ± 0.0353%, t = −3.771, p = 0.002), lateral wall of nasal atrium (0.2525% ± 0.1108% vs. 0.0220% ± 0.0382%, t = −9.402, p = 0.000), maxillary sinus (0.4121% ± 0.2399% vs. 0.3087% ± 0.2002%, t = −2.580, p = 0.021), middle turbinate area (0.7958% ± 0.4459% vs. 0.6222% ± 0.3920%, t = −4.428, p = 0.000), nasal vestibule (3.9682% ± 1.1099% vs. 3.3094% ± 1.0538%, t = −4.749, p = 0.000), nasopharynx (0.8968% ± 0.4901% vs. 0.7648% ± 0.4289%, t = −3.005, p = 0.009), and inferior middle turbinate (1.2095% ± 0.3607% vs. 0.9008% ± 0.4288%, t = −4.927, p = 0.000). The escape rate decreased from 93.6650% ± 1.5645% to 92.2803% ± 1.3534% (t = 7.529, p = 0.000).

4. Discussion

The nasal cavity can not only ventilate, smell, heat, and humidify, but it also has filtration and immune functions, intercepting the vast majority of inhaled harmful particles and avoiding damage to the susceptible pulmonary airways, including the trachea, bronchus, and lung tissue. However, the nasal mucosa is also the primary pathogenic place of inhaled toxicants and particles, triggering oxidative stress and inflammation [36,37] or leading to a variety of pathological changes.
CFD-DPM is an objective method that can objectively calculate and simulate the movement trajectories and deposition rates of the “invisible and untouchable” particles in the nasal cavity, enabling us to give qualitative and quantitative descriptions of the relationship between the nasal cavity’s anatomical structure and airflow, as well as particles, thus revealing the correlation between deposition hotspots and clinical symptoms of AR, asthma, and CRS, as well as providing references for etiology diagnosis and the treatment of respiratory diseases.
Allergic fungal rhinosinusitis (AFRS) is a type of CRS, which is a hypersensitive reaction to a fungal presence in the sinuses. Fungal hyphae can be found on sinonasal aspirate smears in the sinuses of AFRS patients under microscopes [38]. Inthavong K et al. found that both spherical and nonspherical pollens could be deposited in the nasal sinuses by simulating pollen deposition in the nasal cavity at 5 L/min and 15 L/min inspiratory flow rates; with an increase in the inspiratory flow rate, the deposition rate of pollen in the nasal sinuses and nasal cavity increased, and the deposition position in the nasal cavity moved forward [39]. Using CFD simulation of 60 nasal chambers of healthy subjects, our study also found that although the deposition rate of A. niger spores in the nasal cavity was relatively small, a varied number of spores could be found in the maxillary sinuses of all models (0.30–0.45%), providing potential nasal aerodynamic evidence for the occurrence of AFRS in the maxillary sinuses.
Inhaled Aspergillus can cause pulmonary aspergillosis, which has three main categories: allergic bronchopulmonary aspergillosis (ABPA), chronic pulmonary aspergillosis (CPA), and invasive pulmonary aspergillosis (IPA) [40]. ABPA is an allergic pulmonary disease caused by Aspergillus antigens, and AFRS can be considered the upper airway counterpart of ABPA. Experiments showed that AFRS was confirmed in 80% of patients with ABPA; cultures of sinonasal aspirate revealed a fungal presence in 97% of patients with ABPA+AFRS, and Aspergillus sp. was the most common fungus isolated from sinonasal aspirate in 80% of patients with AFRS [38]. In a study by Chishimba et al., the relative abundance of Aspergillus increased about 15-fold in patients with severe asthma compared to those with mild asthma. Previous studies have shown that during nasal breathing, the majority of particles with AED > 15 μm are deposited in the upper respiratory tract. Particles with AEDs > 2.5 μm are primarily deposited in the trachea and bronchi, whereas those with lower AEDs penetrate into the gas-exchange region of the lungs [41]. Various studies have shown that Aspergillus can invade the upper and lower parts of the respiratory tract. This study found that A. niger spores were very likely to follow the airflow and reach the nasopharynx or escape from the nasopharynx due to their small diameter and low inertia. Roughly 93.6650% of the spores escaped from the nasopharynx and entered the trachea, bronchus, and lung under a resting condition, providing potential aerodynamic evidence for pulmonary aspergillosis such as ABPA.
Multiple clinical studies have shown that smearing pollen blockers on nasal vestibular mucosa can reduce the clinical symptoms of AR patients [42,43], which is consistent with our previous study that found that Artemisia pollen could largely deposit in the nasal vestibular and nasal septal swell body [17]. Our previous experiment [16] also showed that most of the dust mite bodies and eggs with large diameters were deposited in the nasal vestibule, anterior of middle turbinate, and nasal septal swell body. The studies above all showed that particles with large particle sizes were mostly deposited in the nasal vestibule and the anterior third of the nasal cavity, so applying allergen blocker here has greater clinical significance. However, small allergens such as fungal spores rarely deposit in the nasal vestibule, so the application of barrier agents in the nasal vestibule may not be effective; consequently, a more uniformly distributed barrier, such as nasal spray, may be needed to reach the deeper side of the nasal cavity.
Humans spend a third of their lives lying in bed, and Aspergillus sp. is one of the most common indoor fungi in humid environments, which calls for studying the effects of lying in different body positions. This study compared spore deposition in a lying position and a standing position. The spore deposition in the nasal meatus and sinuses was characterized by geographical distribution; that is, the spores were mainly deposited at the bottom of the nasal meatus, the highest amount of spores was deposited in the inferior turbinate area, the least amount of spores was deposited in the superior turbinate area, and the amount of spores in the lower side of maxillary sinus and nasopharynx was significantly higher than that in the upper side. However, when lying down, the spores were almost evenly distributed on the lateral wall of the nasal cavity and the maxillary sinus, and the spore-deposition rate on the earthward side increased. This suggested that compared with a standing position, in a lying position, fungal spores can uniformly distribute in nasal cavity, deposit more in maxillary sinus, and enter deeper inside the sinus, which underscores the importance of removing allergen particles from the bedroom, especially the bed.
This study focused on exploring the deposition rule for A. niger spores in the nasal cavities of people in northwest China. The species and particle diameter of the fungal spores were fixed, so in addition to the inspiratory flow rate, the effect of the varied anatomical structure of the nasal cavity among different individuals on the deposition site should be considered. We found that local deposition of A. niger spores in the nasal cavity was significantly different among the people in the same region, which was consistent with the experimental results of Cheng et al. [44]. Dong et al. [45] found that the difference in nasal vestibular morphology was one of the important factors leading to different distributions of particle deposition, while other variables that influence particle deposition, such as morphological differences among the nasal meatus and septum, still need to be further explored.
However, this study has some limitations, such as simplifying the anatomical structure of the vibrissa, paranasal sinus, and face; and only considering the steady inspiratory state and ignoring influencing factors such as the human development state, nasal cycle, and nasal disease while analyzing the particle deposition. Furthermore, in the real world, as the main method of fungal spreading, the A. niger spores always showed as separate spores, but they may cling to each other causing, varied diameters, shape factors, and aerodynamic equivalent diameters. This article only focused on the individual spore, and further studies may take the clinging spores or other parts of fungal species, such as the mycelium, into consideration. In addition, all fungal spores were released passively and uniformly from the front anterior nostril plane, and we did not take its concentra-tions into consideration. Therefore, future studies should improve the accuracy when setting the boundary condition and enroll broader groups, such as children, the elderly, and patients with nasal diseases. Comparative studies will help to clarify the intergroup differences and individual variability, therefore providing guidance in the design of more effective drug-delivery devices and fungal-spore barrier methods. In addition, the cross-validation between numerical simulations and in vitro and in vivo experiments should be strengthened in the future so that the results of this study can be better applied to clinical practice.

5. Conclusions

Our numerical study found that although the deposition rate of A. niger spores in the nasal cavity was relatively small, they could easily enter the maxillary sinus, which provided potential aerodynamic evidence for the occurrence of fungal rhinosinusitis in maxillary sinuses.
The direction of gravity, in addition to individual anatomical differences and inhalation flow rates, could also significantly influence the particle-deposition pattern along the respiratory tract. In a lying position, when the direction of gravity was toward the lateral wall of the nasal cavity, the A. niger spores were deposited evenly on the lateral wall of the nasal cavity and the sinus.
The establishment of a fungal spore deposition CFD database for the nasal cavity can provide an effective reference for the protection and treatment of diseases related to fungal-spore allergens.

Author Contributions

Y.W.: Conceptualization, Methodology, Validation, Formal analysis, Writing—original draft, Auditing, Funding acquisition; J.D.: Conceptualization, Methodology, Writing—review and editing; X.C.: Conceptualization, Methodology, Writing—review and editing; M.L.: Software, Validation, Investigation, Methodology; R.M.: Project administration, Validation, Data curation; Z.H.: Data curation, Visualization, Supervision; M.G.: Supervision, Visualization, Methodology; B.W.: Project administration, Supervision, Validation; Z.T.: Conceptualization, Methodology, Writing—review and editing; H.R.: Conceptualization, Methodology, Writing—review and editing; C.L.: Visualization, Methodology; G.Z.: Conceptualization, Methodology, Validation, Formal analysis, Writing—review and editing, Funding acquisition; Y.Z.: Conceptualization, Methodology, Validation, Formal analysis, Writing—review and editing, Funding acquisition. All authors have read and agreed to the published version of the manuscript.

Funding

This research was funded by National Natural Scientific Foundation of China (grant number 82000960); the Universities Co-Funded Project of Key Research and Development Project of Shaanxi Province (grant number 2020GXLH-Y-017); the Science and Technology Planning Project of Yulin City (grant number CXY-2020-047); and the Australian Research Council (grant number DE210101549).

Institutional Review Board Statement

The study was conducted in accordance with the Declaration of Helsinki and approved by the Ethics Committee of the Second Affiliated Hospital of Xi′an Jiaotong University (protocol code 2020-819, date 7 January 2020).

Informed Consent Statement

Informed consent was obtained from all subjects involved in the study. Written informed consent was obtained from the patient(s) to publish this paper.

Conflicts of Interest

The authors declare no conflict of interest.

References

  1. Bush, R.K.; Portnoy, J.M.; Saxon, A.; Terr, A.I.; Wood, R.A. The medical effects of mold exposure. J. Allergy Clin. Immunol. 2006, 117, 326–333. [Google Scholar] [CrossRef]
  2. Dykewicz, M.S.; Rodrigues, J.M.; Slavin, R.G. Allergic fungal rhinosinusitis. J. Allergy Clin. Immunol. 2018, 142, 341–351. [Google Scholar] [CrossRef] [Green Version]
  3. Sharpe, R.A.; Bearman, N.; Thornton, C.R.; Husk, K.; Osborne, N.J. Indoor fungal diversity and asthma: A meta-analysis and systematic review of risk factors. J. Allergy Clin. Immunol. 2015, 135, 110–122. [Google Scholar] [CrossRef] [PubMed]
  4. Sevindik, M.; Akgül, H.; Tosunoglu, A. Temporal variations in fungal spores in Mardin city atmosphere, upper Mesopotamia, SE-Turkey. Grana 2022, 61, 67–80. [Google Scholar] [CrossRef]
  5. Ponikau, J.U.; Sherris, D.A.; Kern, E.B.; Homburger, H.A.; Frigas, E.; Gaffey, T.A.; Roberts, G.D. The diagnosis and incidence of allergic fungal sinusitis. Mayo Clin. Proc. 1999, 74, 877–884. [Google Scholar] [CrossRef]
  6. Buzina, W.; Braun, H.; Freudenschuss, K.; Lackner, A.; Habermann, W.; Stammberger, H. Fungal biodiversity—As found in nasal mucus. Med. Mycol. 2003, 41, 149–161. [Google Scholar] [CrossRef] [PubMed] [Green Version]
  7. Sharpe, R.; Thornton, C.R.; Osborne, N.J. Modifiable factors governing indoor fungal diversity and risk of asthma. Clin. Exp. Allergy 2014, 44, 631–641. [Google Scholar] [CrossRef] [PubMed]
  8. Sevindik, M. The Effects of Fungus Spores on Asthma. J. Bacteriol. Mycol. Open Access 2017, 5, 00163. [Google Scholar]
  9. Martinez-Bracero, M.; Markey, E.; Clancy, J.H.; McGillicuddy, E.J.; Sewell, G.; O’Connor, D.J. Airborne Fungal Spore Review, New Advances and Automatisation. Atmosphere 2022, 13, 308. [Google Scholar] [CrossRef]
  10. de Shazo, R.D.; Chapin, K.; Swain, R.E. Fungal sinusitis. N. Engl. J. Med. 1997, 337, 254–259. [Google Scholar] [CrossRef]
  11. Simon-Nobbe, B.; Denk, U.; Pöll, V.; Rid, R.; Breitenbach, M. The spectrum of fungal allergy. Int. Arch. Allergy Immunol. 2008, 145, 58–86. [Google Scholar] [CrossRef] [Green Version]
  12. Zhao, Y.C.; Bassiouni, A.; Tanjararak, K.; Vreugde, S.; Wormald, P.J.; Psaltis, A.J. Role of fungi in chronic rhinosinusitis through ITS sequencing. Laryngoscope 2018, 128, 16–22. [Google Scholar] [CrossRef] [PubMed]
  13. Wang, S.M.; Inthavong, K.; Wen, J.; Tu, J.Y.; Xue, C.L. Comparison of micron- and nanoparticle deposition patterns in a realistic human nasal cavity. Respir. Physiol. Neurobiol. 2009, 166, 142–151. [Google Scholar] [CrossRef]
  14. Rozsasi, A.; Leiacker, R.; Rettinger, G.; Lindemann, J.; Keck, T. Impact of resection of the turbinates and the lateral nasal wall on particle deposition. Laryngoscope 2004, 114, 646–651. [Google Scholar] [CrossRef]
  15. Le Guellec, S.; Ehrmann, S.; Vecellio, L. In vitro-in vivo correlation of intranasal drug deposition. Adv. Drug Deliv. Rev. 2021, 170, 340–352. [Google Scholar] [CrossRef] [PubMed]
  16. Zhang, Y.; Shang, Y.; Inthavong, K.; Tong, Z.; Sun, B.; Zhu, K.; Yu, A.; Zheng, G. Computational investigation of dust mite allergens in a realistic human nasal cavity. Inhal. Toxicol. 2019, 31, 224–235. [Google Scholar] [CrossRef]
  17. Ya, Z.; Luyao, Z.; Fen, H.; Jingbin, Z.; Miao, L.; Bin, S.; Kang, Z.; Guoxi, Z.; Zhenbo, T. Computational investigation of Artemisia pollen deposition in realistic nasal cavities of residents in northwest China. Chin. J. Otorhinolaryngol. Head Neck Surg. 2019, 54, 741–747. [Google Scholar]
  18. Tian, Z.F.; Inthavong, K.; Tu, J.Y. Deposition of inhaled wood dust in the nasal cavity. Inhal. Toxicol. 2007, 19, 1155–1165. [Google Scholar] [CrossRef]
  19. Inthavong, K.; Wen, J.; Tian, Z.; Tu, J. Numerical study of fibre deposition in a human nasal cavity. J. Aerosol Sci. 2008, 39, 253–265. [Google Scholar] [CrossRef]
  20. Kabilan, S.; Suffield, S.R.; Recknagle, K.P.; Jacob, R.E.; Einstein, D.R.; Kuprat, A.P.; Carson, J.P.; Colby, S.M.; Saunders, J.H.; Hines, S.A.; et al. Computational fluid dynamics modeling of Bacillus anthracis spore deposition in rabbit and human respiratory airways. J. Aerosol Sci. 2016, 99, 64–77. [Google Scholar] [CrossRef]
  21. Tian, L.; Inthavong, K.; Lidén, G.; Shang, Y.; Tu, J. Transport and Deposition of Welding Fume Agglomerates in a Realistic Human Nasal Airway. Ann. Occup. Hyg. 2016, 60, 731–747. [Google Scholar] [CrossRef]
  22. Inthavong, K. From indoor exposure to inhaled particle deposition: A multiphase journey of inhaled particles. Experi-Ment. Comput. Multiph. Flow 2020, 2, 59–78. [Google Scholar] [CrossRef] [Green Version]
  23. Kiakojuri, K.; Armaki, M.T.; Rajabnia, R.; Pournajaf, A.; Karami, M.; Khademian, A.; Omran, S.M. Outer Ear Infections in Iran: A Review. Open Access Maced. J. Med. Sci. 2019, 7, 1233–1240. [Google Scholar] [CrossRef] [Green Version]
  24. Krijgsheld, P.; Bleichrodt, R.; van Veluw, G.J.; Wang, F.; Müller, W.H.; Dijksterhuis, J.; Wösten, H.A. Development in Aspergillus. Stud. Mycol. 2013, 74, 1–29. [Google Scholar] [CrossRef]
  25. Shang, Y.D.; Inthavong, K.; Tu, J.Y. Detailed micro-particle deposition patterns in the human nasal cavity influenced by the breathing zone. Comput. Fluids 2015, 114, 141–150. [Google Scholar] [CrossRef]
  26. Sun, X.; Yu, C.; Liu, Y.; Yu, S.; Zhang, J.; Su, Y. 3D Finite Element Model Reconsturction and Numerical Simulation of Airflow in Human Upper Air-way. Space Med. Med. Eng. 2006, 19, 129–133. [Google Scholar] [CrossRef]
  27. Hahn, I.; Scherer, P.W.; Mozell, M.M. Velocity profiles measured for airflow through a large-scale model of the human nasal cavity. J. Appl. Physiol. 1993, 75, 2273–2287. [Google Scholar] [CrossRef] [PubMed]
  28. Kelly, J.T.; Prasad, A.K.; Wexler, A.S. Detailed flow patterns in the nasal cavity. J. Appl. Physiol. 2000, 89, 323–337. [Google Scholar] [CrossRef] [Green Version]
  29. Keyhani, K.; Scherer, P.W.; Mozell, M.M. A numerical model of nasal odorant transport for the analysis of human olfaction. J. Theor. Biol. 1997, 186, 279–301. [Google Scholar] [CrossRef]
  30. van Veluw, G.J.; Teertstra, W.R.; de Bekker, C.; Vinck, A.; van Beek, N.; Muller, W.H.; Arentshorst, M.; van der Mei, H.C.; Ram, A.F.; Dijksterhuis, J.; et al. Heterogeneity in liquid shaken cultures of Aspergillus niger inoculated with melanised conidia or conidia of pigmentation mutants. Stud. Mycol. 2013, 74, 47–57. [Google Scholar] [CrossRef] [Green Version]
  31. Feng, Y.; Kleinstreuer, C. Micron-particle transport, interactions and deposition in triple lung-airway bifurcations using a novel modeling approach. J. Aerosol Sci. 2014, 71, 1–15. [Google Scholar] [CrossRef]
  32. Silva, D.M.; Batista, L.R.; Rezende, E.F.; Fungaro, M.H.; Sartori, D.; Alves, E. Identification of fungi of the genus Aspergillus section nigri using polyphasic taxonomy. Braz. J. Microbiol. 2011, 42, 761–773. [Google Scholar] [CrossRef] [PubMed] [Green Version]
  33. Dong, J.; Shang, Y.; Inthavong, K.; Tu, J.; Chen, R.; Bai, R.; Wang, D.; Chen, C. From the Cover: Comparative Numerical Modeling of Inhaled Nanoparticle Deposition in Human and Rat Nasal Cavities. Toxicol. Sci. 2016, 152, 284–296. [Google Scholar] [CrossRef] [PubMed] [Green Version]
  34. Doorly, D.J.; Taylor, D.J.; Schroter, R.C. Mechanics of airflow in the human nasal airways. Respir. Physiol. Neurobiol. 2008, 163, 100–110. [Google Scholar] [CrossRef] [PubMed]
  35. Li, C.; Jiang, J.; Dong, H.; Zhao, K. Computational modeling and validation of human nasal airflow under various breathing conditions. J. Biomech. 2017, 64, 59–68. [Google Scholar] [CrossRef] [PubMed]
  36. Guo, Z.; Hong, Z.; Dong, W.; Deng, C.; Zhao, R.; Xu, J.; Zhuang, G.; Zhang, R. PM(2.5)-Induced Oxidative Stress and Mitochondrial Damage in the Nasal Mucosa of Rats. Int. J. Environ. Res. Public Health 2017, 14, 134. [Google Scholar] [CrossRef] [PubMed] [Green Version]
  37. Jalava, P.I.; Wang, Q.; Kuuspalo, K.; Ruusunen, J.; Hao, L.; Fang, D.; Väisänen, O.; Ruuskanen, A.; Sippula, O.; Happo, M.S.; et al. Day and night variation in chemical composition and toxicological responses of size segregated urban air PM samples in a high air pollution situation. Atmos. Environ. 2015, 120, 427–437. [Google Scholar] [CrossRef]
  38. Barac, A.; Ong, D.S.Y.; Jovancevic, L.; Peric, A.; Surda, P.; Tomic Spiric, V.; Rubino, S. Fungi-Induced Upper and Lower Respiratory Tract Allergic Diseases: One Entity. Front. Microbiol. 2018, 9, 583. [Google Scholar] [CrossRef]
  39. Inthavong, K.; Shang, Y.; Del Gaudio, J.M.; Wise, S.K.; Edwards, T.S.; Bradshaw, K.; Wong, E.; Smith, M.; Singh, N. Inhalation and deposition of spherical and pollen particles after middle turbinate resection in a human nasal cavity. Respir. Physiol. Neurobiol. 2021, 294, 103769. [Google Scholar] [CrossRef]
  40. Kanj, A.; Abdallah, N.; Soubani, A.O. The spectrum of pulmonary aspergillosis. Respir. Med. 2018, 141, 121–131. [Google Scholar] [CrossRef]
  41. Eccles, R. Anatomy and physiology of the nose and control of nasal airflow. Middlet. Allergy Princ. Pract. 2003, 6, 775–787. [Google Scholar]
  42. Inthavong, K.; Tu, J.; Ahmadi, G. Computational Modelling of Gas-Particle Flows with Different Particle Morphology in the Human Nasal Cavity. J. Comput. Multiph. Flows 2009, 1, 57–82. [Google Scholar] [CrossRef] [Green Version]
  43. Shi, H.; Kleinstreuer, C.; Zhang, Z. Modeling of inertial particle transport and deposition in human nasal cavities with wall roughness. J. Aerosol Sci. 2007, 38, 398–419. [Google Scholar] [CrossRef]
  44. Cheng, Y.S.; Holmes, T.D.; Gao, J.; Guilmette, R.A.; Li, S.; Surakitbanharn, Y.; Rowlings, C. Characterization of nasal spray pumps and deposition pattern in a replica of the human nasal airway. J. Aerosol Med. 2001, 14, 267–280. [Google Scholar] [CrossRef]
  45. Dong, J.; Ma, J.; Shang, Y.; Inthavong, K.; Qiu, D.; Tu, J.; Frank-Ito, D. Detailed nanoparticle exposure analysis among human nasal cavities with distinct vestibule phenotypes. J. Aerosol Sci. 2018, 121, 54–65. [Google Scholar] [CrossRef]
Figure 1. The 3D model and regional division of the nasal cavity: the lateral wall of the nasal cavity in the left view; the lateral wall of the nasal cavity in the right view; the septum in the right view; the front view; the back view; the top view (orange: nasal vestibule; yellow: maxillary sinus; lilac: lateral wall of nasal atrium; red: olfactory area; blue: superior turbinate area; green: middle turbinate region; pink: inferior turbinate area; dark purple: nasopharynx; gray: nasal septum).
Atmosphere 13 00911 g001
Figure 2. Airflow streamline track in the nasal cavity under the 15 L/min inspiratory condition in the standing position: left view; right view; top view; front view.
Atmosphere 13 00911 g002
Figure 3. Axial flow and secondary flow model diagrams for each characteristic cross-section under the 15 L/min inspiratory condition in the standing position.
Atmosphere 13 00911 g003
Figure 4. Under a 15 L/min inspiratory condition in the standing position, and show the deposition diagram and deposition rate of A. niger spores on the nasal cavity surface ( left view, right view); and show the particle trajectories of A. niger spores moving with airflow ( left view, right view) (orange: nasal vestibular; red: nasal septum; black: maxillary sinus; pink: nasopharynx; green: olfactory area; yellow: middle turbinate area; blue: inferior turbinate area).
Atmosphere 13 00911 g004aAtmosphere 13 00911 g004b
Figure 5. Under a 30 L/min inspiratory condition, and show the deposition diagram of A. niger spores on nasal cavity surface ( left view, right view); and show the particle trajectories of A. niger spores moving with airflow ( left view, right view).
Atmosphere 13 00911 g005
Figure 6. Deposition rates of A. niger spores at each anatomical area in nasal cavity under 15 L/min and 30 L/min inspiratory conditions.
Atmosphere 13 00911 g006
Figure 7. Under 15 L/min inspiratory condition in lying position, and show the deposition diagrams of A. niger spores on the nasal cavity mucosa ( left view, right view); and show the particle trajectories of A. niger spores moving with airflow ( left view, right view).
Atmosphere 13 00911 g007
Figure 8. Deposition rate of A. niger spores at each anatomical site of nasal cavity under the 15 L/min inspiratory condition in standing and lying positions.
Atmosphere 13 00911 g008
Table 1. Shape image of Aspergillus niger spores.
ShapeTypical Size
Range
DensityReal Image [30,32]Estimated Shape Factor ϕ
SphereDiameter 3.25 μm1300 kg/m3 Atmosphere 13 00911 i0011.0
Publisher’s Note: MDPI stays neutral with regard to jurisdictional claims in published maps and institutional affiliations.

