Abstract
Air pollution caused by coal burning not only increases the cost of environmental pollution but also harms human health. It is urgent for China to change the practice of coal-fired central heating. Therefore, the effectiveness and sustainability of the Coal to Gas and Electricity policy have become the focus of all sectors of society. In this paper, eight cities in the Beijing–Tianjin–Hebei region were taken as the experimental groups and the other eleven cities as the control groups. Based on the PSM-DID model and the time-varying DID model, a quasi-natural experimental analysis was conducted to evaluate the effect of the policy of coal to gas and electricity to improve air quality in the Beijing–Tianjin–Hebei region from 2015 to 2020 and to test the sustainability of the policy. Three research conclusions are shown below: First, during the implementation of the policy, especially in 2019, the AQI index decreased significantly. Although there was a rebound thereafter, it was still lower than before. This shows that the Coal to Gas and Electricity policy has indeed improved the air quality in Beijing, Tianjin, and Hebei during its implementation. Second, the policy had a great impact on SO2 and PM10 but was relatively weak on PM2.5 and CO. Therefore, there is an urgent need to formulate scientific and accurate policies to control different air pollutants. Third, the time-varying DID model was used to identify the dynamic sustainability effect of the Coal to Gas and Electricity policy. The results showed that the policy had a strong impact in the initial stage, but its effect was greatly reduced at the end of the implementation or near the end, when it was far less obvious than in the initial stage of the policy. Therefore, in formulating relevant measures to reduce air pollution, it is necessary to fully consider the sustainability of the policy.
1. Introduction
As the largest developing country in the world, China is facing great pressure from the international community to reduce emissions [1]. Coal, as a high-carbon energy source, has been burned in China for thousands of years. The burning of coal for heating has led to a significant increase in the TSP (Total Suspended Particle) level in northern China [2], and it is also the main cause of frequent respiratory diseases and skin diseases for urban residents in recent years [3]. Consequently, to improve air quality and show a pragmatic image to the international community, China has formally put forward the “dual-carbon” strategic goal of a “carbon peak in 2030 and carbon neutrality in 2060” [4,5,6,7]. Moving from coal to gas and electricity is the main way to reduce coal use and improve air quality in winter [8]. In this way, the effectiveness of the Coal to Gas and Electricity policy, promoted by the state through financial subsidies, especially to Beijing, Tianjin, and Hebei as important cities in northern China, has become the focus of society.
The prevention and control of air pollution have become China’s top priority [9], and its governance policies and effects have triggered academic discussions. Research shows burning coal accelerates air deterioration [10,11]. In particular, the emission of air pollutants caused by coal-fired heating in winter is more harmful to air quality and human health than industrial sources with the same emissions [12,13]. Against the background of carbon peak and carbon neutralization, it is urgent to change the practice of coal-fired central heating. Therefore, the state promotes the Coal to Gas and Electricity policy through financial subsidies. At present, academic research on this issue is rare [14]. Li et al. studied the changes in air quality, energy efficiency, and residents’ energy consumption before and after the implementation of the Coal to Gas and Electricity policy, based on the panel data of 41 cities in China from 2003 to 2015 [15]. Shi et al. studied the green coordinated development effect of the policy of coal to gas and electricity in Beijing, Tianjin, and Hebei [16]. Liu et al. analyzed the typical problems in the construction of the coal to gas project in Beijing and put forward relevant policy suggestions [17]. Yu et al. evaluated the green net benefit of the coal to gas project in Beijing, Tianjin, and Hebei, and considered that the coal to gas policy could improve green comprehensive efficiency by 0.3%–0.4% [18]. However, some scholars believe that the policies of coal to gas and electricity and “clean coal substitution” increase residents’ heating costs [19]. Scholars mainly discuss air pollution control, green development, and the cost subsidies of the Coal to Gas and Electricity policy and rarely use more micro and refined data to analyze the air pollution control effect of the policy. Further research shows that the frequency of severe pollution weather in northern China coincides with the concentration of coal-fired heating in winter [20,21]. China’s unique coal-fired heating measures in the north in winter have led to more prominent air pollution problems in northern China than in the south [22]. The air pollution problem of the Beijing–Tianjin–Hebei urban agglomeration in the northern region is particularly serious [23]. Early research found that although Beijing, Tianjin, Hebei, and the surrounding areas account for only 7.2% of the national land area, they consume 33% of the national coal, and the pollutant emission intensity per unit area is about four times the national average [24]. However, the research conclusions on the relationship between the air control effect and pollutant emissions in Beijing, Tianjin, and Hebei are not completely consistent. Some scholars found that environmental regulations can significantly reduce PM2.5 and SO2 concentrations [25]. Based on ecological environmental monitoring and meteorological observation data, Zhu Yuan-yuan et al. analyzed the characteristics of ozone concentrations in the major cities in the Beijing–Tianjin–Hebei region from 2016 to 2020 and found that ozone concentrations in the region increased by 11.6%, showed an overall trend of fluctuation during 2016 to 2019, and then decreased in 2020 [26]. In addition, few studies can clearly point out the clear relationship between the air quality index and specific pollutants in Beijing, Tianjin, and Hebei. Therefore, it is of great significance to use weekly micro panel data to test the effectiveness of the Coal to Gas and Electricity policy in the Beijing–Tianjin–Hebei region and to explore the specific impact of the policy on specific pollutants.
From the urban perspective, a regional joint prevention and control strategy must be adopted for air pollution control to avoid the “leakage effect” and “free-riding behavior” of air pollution control [27]. However, because of the limitations of research data and research methods, it is difficult to determine the dynamic and sustainable effects of air pollution control policies in urban agglomerations [28]. In addition, only a few articles use the policy evaluation method in econometrics [29], and the conclusions are inconsistent. Duwencui et al., using the Single DID method, found that the coordinated control of haze in Beijing, Tianjin, and Hebei had not improved the air quality in this area [30]. Wayi et al. found that the joint action of “2 + 26” cities in Beijing, Tianjin, Hebei and surrounding areas under the guidance of the action plan for comprehensive treatment of air pollution in autumn and winter helped improve the air quality in the region [31]. The Coal to Gas and Electricity policy in Beijing, Tianjin, Hebei, and surrounding areas has an obvious process from pilot to promotion, and the time and intensity of joint prevention and control in different cities are not completely consistent [29]. Therefore, the estimation results using a single DID model are likely to include errors, resulting in unsolvable endogeneity problems [32]. Using the DID method, the most important premise is that the processing group and control group must meet the common trend assumption, that is, if there were no Coal to Gas and Electricity policy, there would be no systematic difference in the change in the trend of air quality between Beijing, Tianjin and Hebei and other regions over time. But in reality, this assumption of the DID method may not be satisfied. However, the PSM-DID method proposed and developed by Heckman et al. could effectively solve this problem and make the DID method meet the common trend hypothesis [33,34]. In addition, the time-varying DID model can capture the dynamic changes of the policy to measure the effect of the joint prevention and control policy of coal to gas and electricity in Beijing, Tianjin, and Hebei more accurately. Therefore, it is not only necessary to expand the sample number of the Beijing Tianjin Hebei urban agglomeration to improve the integrity of the impact of the Coal to Gas and Electricity policy on air quality, but it is also necessary to adopt the PSM-DID model and the time-varying DID model to evaluate the effectiveness and dynamics of policy implementation.
The purpose of this study is to test the impact of the Coal to Gas and Electricity policy on air quality in Beijing, Tianjin, and Hebei and find possible measures for improvement. Therefore, based on the weekly air quality and meteorological data of nineteen cities in Beijing, Tianjin, Hebei, and surrounding areas from 2015 to 2020, we used the PSM-DID method to evaluate the effectiveness and dynamics of the Coal to Gas and Electricity policy on air quality improvement. This article provides some important insights: First, this study adopts the method of propensity score matching (PSM) for the first time, and “wind speed” and “temperature” were finally obtained as characteristic variables from 6042 original atmospheric data of nine experimental groups and eleven control groups, which overcomes the endogenous problem between explanatory variables. Second, taking the implementation of coal to gas and electricity as a quasi-experiment, differences-in-differences (DID) was used to identify the impact of the policy on air quality and PM2.5, PM10, SO2, and CO. The results show that the Coal to Gas and Electricity policy has indeed improved the air quality in Beijing, Tianjin, and Hebei during the implementation period. The policy had a great impact on SO2 and PM10, while the effects on PM2.5 and CO were relatively weak. Third, the time-varying DID model was used to identify the dynamic sustainability effect of the Coal to Gas and Electricity policy. It proves that the policy has a strong impact in the initial stage. However, at the end of the implementation or near the end, the effect is greatly reduced, and it is far less obvious than at the beginning of the policy. These results held true after several robustness tests. The above conclusions based on the evaluation of the Coal to Gas and Electricity policy in Beijing, Tianjin, and Hebei may provide relevant references and lessons for air governance in other countries.
2. Data and Methodology
2.1. Data and Variables
The air quality index (AQI) and the concentration of individual pollutants are the air quality indicators that are most widely consulted by the public and highly valued by the national ecological and environmental department. Among them, the AQI is a dimensionless comprehensive index, which is obtained by standardizing the concentration index of each single pollutant, allowing it to be a comprehensive reflection of the daily air quality of the city. The value range is 0–500, and according to the size of the AQI, we divide urban air quality into six levels. The larger the value, the more serious the air pollution [35,36,37]. In addition, the assessment method of the action plan for air pollution prevention and control clearly points out that the annual average concentration decline ratios of PM2.5 and PM10 are used as the assessment index [38]. As one of the important indicators to measure whether SO2 and CO are polluted in the atmosphere. Therefore, this paper selects the daily data of the AQI, PM2.5, PM10, SO2, and CO in Beijing, Tianjin, Hebei and surrounding areas from 2015 to 2020. According to the weighted average calculation, the weekly data were obtained for regression analysis. Relevant data comes from China’s air quality online monitoring and analysis platform (https://www.AQIstudy.cn, accessed on 15 February 2022).
Research shows that weather conditions can have a significant impact on air quality [39,40]. Therefore, to ensure the accuracy of the study, the control variables selected in this paper include daily average temperature, daily average humidity, and wind level. The weekly data is calculated according to the weighted average of daily average data. Relevant data comes from China’s air quality online monitoring and analysis platform (https://www.AQIstudy.cn, accessed on 15 February 2022).
2.2. Methodology
The Propensity Score Matching (PSM) and Difference-in-Difference model (DID) method are used to evaluate the effect of policy implementation. The PSM is particularly suitable for studies using non-random data. Computing the average processing effect of the treatment group samples through the common support hypothesis test and balance hypothesis test can obtain basic unbiased estimates, thus obtaining a natural experiment under the condition of using non-random data. The influence of selective bias and confounding factors in the performance evaluation process can be excluded as far as possible by the PSM method, ensuring that the final estimated performance results are an unbiased “net effect”. The PSM can solve the problem of sample selection bias, but cannot avoid the endogenous problem caused by variable omission; The DID can solve the endogenous problem through double difference, but cannot solve the problem of sample selection deviation well. Based on this, this paper combines PSM and DID for robustness estimation. At present, there are few articles using the policy evaluation method in econometrics [29]; moreover, even if a single DID model is used, the estimation results are likely to be biased, resulting in endogenous problems that cannot be reasonably solved [32]. Using the DID method, the most important premise is that the processing group and control group must meet the common trend assumption; that is, if there is no Coal to Gas and Electricity policy, there is no systematic difference in the changing trend of air quality between the Beijing–Tianjin–Hebei region and other regions over time. But in reality, this assumption of the DID method may not be satisfied. However, the PSM-DID method that has been proposed and developed can effectively solve this problem [33,34]. In addition, the time-varying DID model can capture the dynamic changes of the policy to measure the effect of the joint prevention and control policy of coal to gas and electricity in Beijing, Tianjin, and Hebei more accurately. Therefore, this study first takes group as the grouping variable, speed and temp among the control variables as the characteristic variables, and AQI as the output variable for PSM matching, which solves the problems of deviation and endogeneity between variables. Second, to avoid the problem of multicollinearity, we selected eight cities in the Tianjin Hebei region as the experimental group by using the atmospheric data from 2015 to 2020, and chose another eleven cities with similar geographical locations, similar air pollution, or similar population and economic levels as the control group, using the DID model to identify the effectiveness of the Coal to Gas and Electricity policy in the Beijing–Tianjin–Hebei region. Finally, the time-varying DID model is used to evaluate the effectiveness and dynamics of policy implementation.
2.2.1. Model Construction
This paper first uses the DID model to evaluate the effect of the Coal to Gas and Electricity policy on air pollution control in the Beijing–Tianjin–Hebei region and surrounding areas. The model is as follows:
where represents the air quality index and single pollutant concentration of city C on date T, and indicates whether city C is in the experimental group or the control group. If it is the experimental group, the value is 1; otherwise, the value is 0. The dummy variable indicates whether the policy is executed. Policy implementation is 0 before implementation and 1 after implementation. The variable indicates the change of the air quality of the experimental group after the policy implementation, and the coefficient can be used to measure the effect of the air pollution prevention and control policy. The control variable indicates other factors affecting air quality, including weather conditions (daily average temperature-temp, average daily humidity-humidity, and wind level-speed). The random perturbation term is represented by .
Although there were reports of “the Coal to Gas and Electricity policy” from 2003 to 2016, the frequency was relatively low. On 5 December 2017, the National Development and Reform Commission and other departments jointly issued the Plan for Clean Heating in Winter in Northern China (2017–2021), proposing for the first time to build a complete clean heating industry system in northern China within 3 to 5 years. According to the evolution time of the policy of coal to gas and electricity and considering the applicability of the model, we defined the period before the implementation of the policy as January 2015–31 December 2017 and the period after the implementation of the policy as January 2018–31 December 2020. The policy involved in this study is mainly concerned with heating. The value is 0 before the policy is implemented and 1 after the policy is implemented. We used weekly data, so the specific implementation date was 1 in the second week of 2018, and 0 in the previous week.
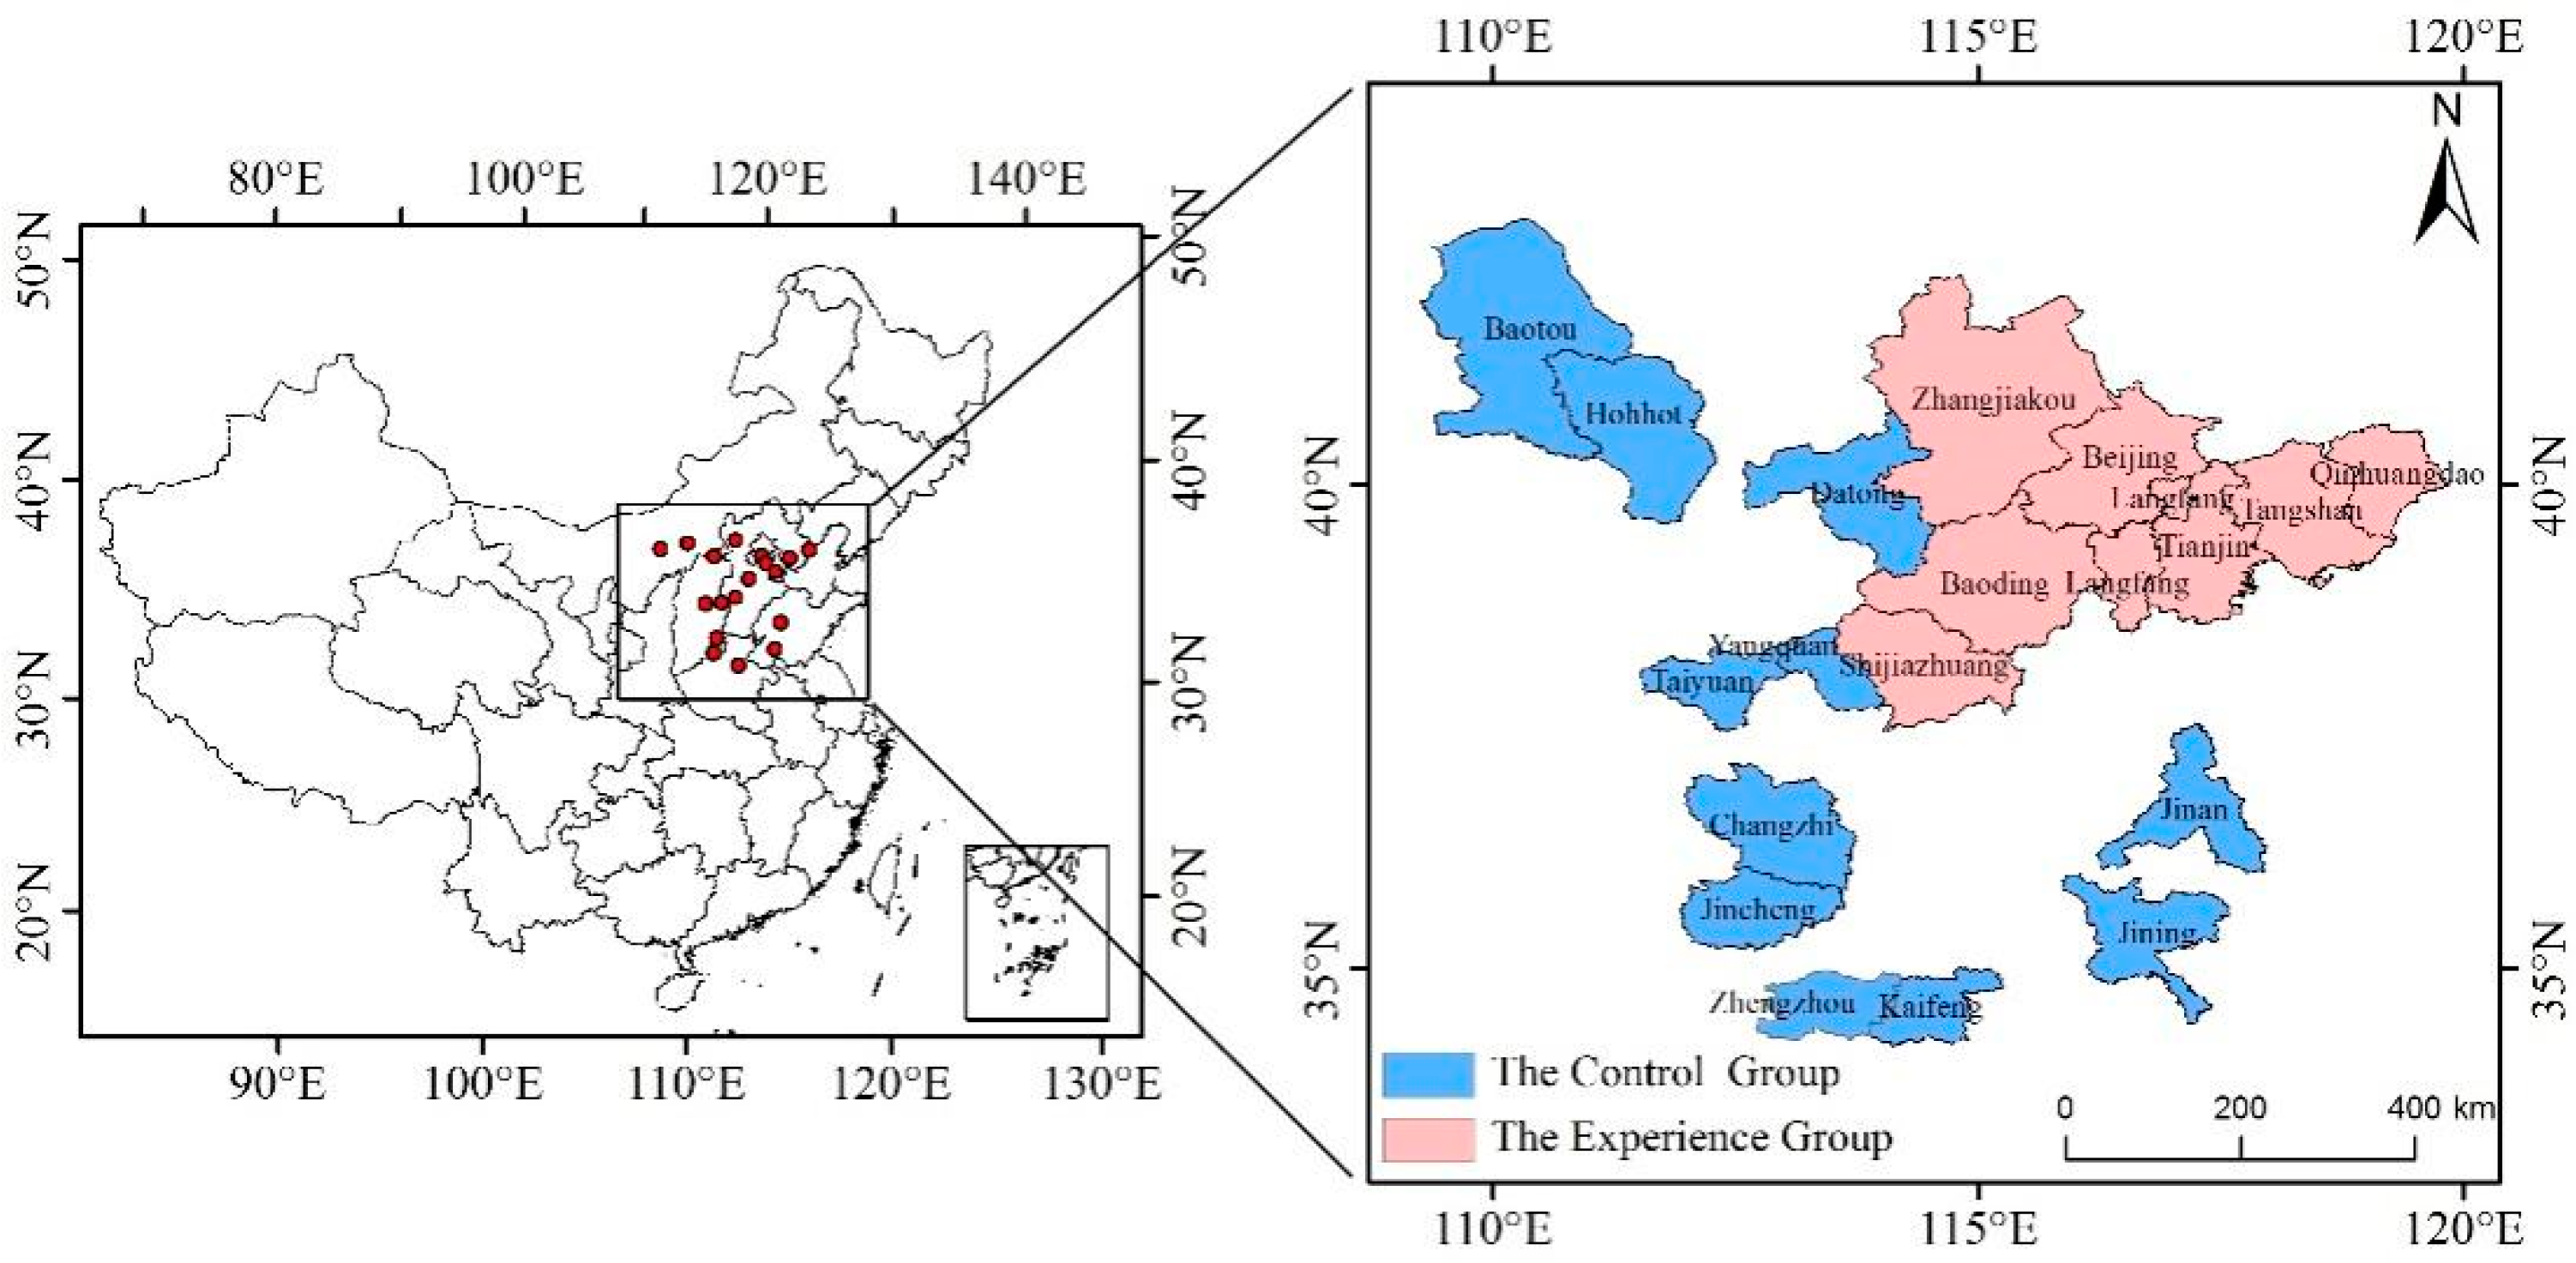
Based on similar geographical location, air pollution, level of economic development, and permanent population, the following choices were made. The experimental group included eight cities in the Beijing–Tianjin–Hebei area: Beijing, Tianjin, Shijiazhuang, Tangshan, Langfang, Baoding, Qinhuangdao, and Zhangjiakou. The control group contained eleven cities: Taiyuan, Yangquan, Changzhi, Jinan, Jining, Hohhot, Baotou, Zhengzhou, Jincheng, Datong, Kaifeng. When the time interaction between a certain city in the experimental group and the policy implementation was equal to 1, it meant that the city was incorporated into the Coal to Gas and Electricity policy at that time point. Before that time point, the interaction term was 0. The geographical location map is shown below (Figure 1).
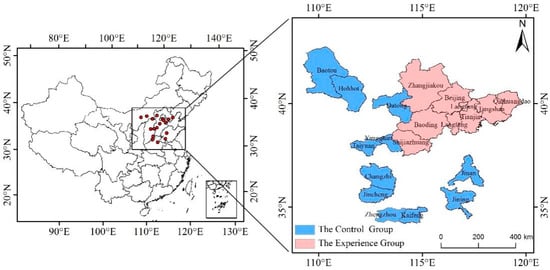
Figure 1.
The geographical location map.
2.2.2. Descriptive Statistics
The sample size shown in the following table is the sample size after PSM treatment, and the original sample size is 6042, and the sample size after PSM treatment is 4063, which will be mentioned in the subsequent PSM analysis. From the value range of variables, the value range of each variable is within a reasonable range, and the outlier is not obvious. See Table 1.

Table 1.
Description of variables and data.
3. Result
3.1. Basic Result Analysis
We take the AQI as an example to make the trend change map of environmental indicators (Figure 2). In the long term, the control group has a slight downward trend, but the trend is relatively limited. The experimental group was affected by the policy, so the change range is large, especially in the second year affected by the policy; in 2019, the AQI had a significant decline, reflecting the impact effect of the policy. Despite the subsequent rebound, it was still lower than the 2018 level and also significantly lower than the control sample level of that year.
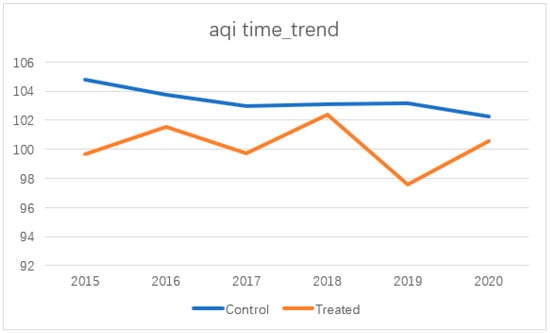
Figure 2.
The AQI time-trend.
If the time range is set from 2017–2019, one year before and after the policy occurred, the results of Table 2 are as follows. There was a significant downward trend before the policy, in which the average value of the experimental group was −1.659 and the average value of the control group was 0.820. The range of decline in the experimental group was significantly greater than that of the control group, reaching twice that of the control group, reflecting the impact of the policy implementation.
Table 2.
The change values of different cities before and after the policies.
For the specific impact of policy implementation on the four dependent variables, we used an independent sample t-test method. The t-test tests whether the variable is significant over all periods. The first was for the whole sample, including the experimental and control groups. From the results of the t-test (Table 3), the p-value of the four indicators was less than 0.05, and the sample with a group value of 1 after implementation was less than the sample before implementation, which shows that the policy implementation reduced the index value and had significant differences. Secondly, a further t-test was performed for the samples from the experimental group (Table 4). For the experimental group samples, the conclusion did not differ from the overall sample, and the samples after the implementation decreased significantly compared with the samples before the implementation. Moreover, it was more obvious in the first two indicators, with PM2.5 decreasing by 11.37 and 14.9 in the experimental group. In the PM10 index, the overall sample decreased by 36.44, and the experimental group sample decreased by 41.57. Therefore, the impact of the policy is obvious and significant.
Table 3.
T-test results for the whole sample.
Table 4.
T test results of the experimental group.
3.2. PSM Model Results
The role of PSM is to reduce endogeneity problems and reduce the bias between samples. Here we take group as the grouping variable, speed and temp among the control variables as the characteristic variables, and AQI as the output variable for PSM processing (Table 5).
Table 5.
Changes in the sample size before and after PSM.
One might ask, why is the humidity variable not included? The first reason is that the two grouped samples were so close in humidity that the bias itself could be considered small. The second reason was that, after our attempt to add the variable of humidity, we found that the bias between samples did not shrink but increased, so joining became meaningless. From the PSM results (Table 6), we used variables speed and temp as conditions for sample matching, and after the last matching samples, the bias was reduced by 31.8% and 90.5%, respectively, which was successful and effective from the purpose perspective.
Table 6.
PSM model result.
3.3. DID Model Baseline Analysis
The analysis of the DID model was mainly carried out by observing the influence of DID variables. To avoid multicollinearity problems, the grouping variable group and the policy implementation variable post were not used here. We used four models constructed with different dependent variables, and the fit effect of the model was at the normal level, except for Model 2, in which the R2 was around 0.2 to 0.3. In terms of variable action, the control variables we selected had obvious effects on the dependent variables, in which the variable temp and the variable speed had stable negative effects—that is, the higher temperature, the faster the speed, and the better the air quality. However, the action mechanism of the variable humidity was relatively complex, with significant positive effects on PM2.5 and CO, but with negative effects on PM10 and SO2. However, our core variable DID had significant negative effects in all four models; that is, the implementation of the policy improved the ambient air quality. Considering that the range of values of different indicators varies, it is normal that the coefficient size varies greatly, and it is more meaningful for us to compare the significance of the variables. From the significance level, the policy affected SO2 and PM10 greatly, while the effects on PM2.5 and CO were relatively weak. The results are shown in Table 7.
Table 7.
DID model result.
4. Robust Test
4.1. Parallel Trend Test
The hypothesis of parallel trends is that there was no significant difference between the control and experimental groups before the policy occurred. After the policy implementation, there were significant differences between the experimental group and the control group. We here constructed the dummy variables using the dates of the first three events and tested them. Because the previous period is too close to the policy, the results of the previous three and two periods prevailed, namely the before_3 and before_2 variables in our results. From the results (Table 8), the before_3 variable had a nonsignificant negative effect in all four models, while the direction of before_2 was positive and negative, but overall, the effect was not significant, so the four dependent variables passed the parallel trend test. From the trend of change (Figure 3), there was indeed a downward trend from before_1 to after 2, which also proves the effectiveness of the policy.
Table 8.
Parallel trend test results.
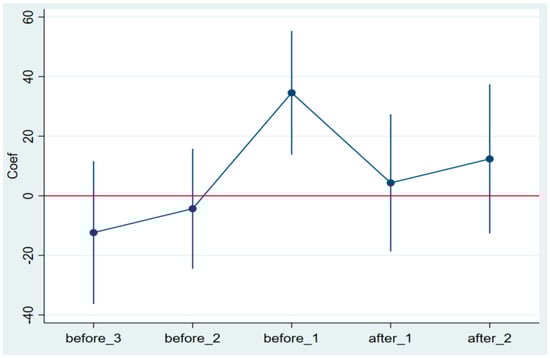
Figure 3.
Coefficient trend change.
4.2. Placebo Test
The idea for the placebo test in this study was to advance the policy implementation date by one year, until 1 January 2017, and to re-run the DID model (These four models are the did models constructed with the four indicators of PM2.5, PM10, CO and SO2 as the dependent variables.). Based on the results, the effect of DID was no longer significant in the PM2.5 and CO models. However, PM10 still has a significant negative effect in SO2, which is not much different from the original model (Table 9). This indicates that the two measures of PM2.5 and CO passed the placebo test, while PM10 and SO2 failed the placebo test, but does not mean that the policy has no effect on the latter two. In previous analyses, namely in parallel trend tests and DID models, we concluded that policy does have a significant impact on environmental indicators. Combined with the analysis results of the trend chart part, we can believe that the ambient air index itself has a downward trend, which is not caused by a separate policy, but the result of a series of relevant policies and institutional provisions. The policy of this study has a relatively more obvious effect on PM2.5 and CO, while accelerating and promoting the effect on PM10 and SO2, that is, accelerating the existing downward trend.
Table 9.
Placebo test results.
4.3. Dynamic Effect of the Coal to Gas and Electricity Policy
For the test of dynamic effect, the main design ideas refer to Zhu et al. [29]. The biggest difference is the different data dimensions. This study by Zhu et al. used daily data as the analysis data, while our study used weekly data as the main data. Autumn and winter were also used by Zhu et al. [29]. as the policy implementation cycle, specifically from the fortieth week to the tenth week of the second year. That model is different from the DID model of our subject. The Zhu et al. subject model belongs to the time-invariant DID model, while our model belongs to the time-varying DID model, that is, DID in which the individual’s policy implementation status will change within a year. In terms of test methods, the DID variable and dummy variable forms were also used. As shown in Table 10, the week1, and week2 variables represent the first two weeks, and the week3 and week4 variables represent the last two weeks.
Table 10.
Dynamic test result.
From the results (Table 10), the DID variable still had a significant negative effect on PM10 and SO2, while the effect of the other two indicators was not significant. As for the dynamic effect we are concerned about, the dummy variables in the first two weeks all had a significant negative effect, proving that the policy had a strong impact in the initial stage. The effect in the last two weeks was very weak, and only in SO2 was there still a significant negative effect. This shows that at the end of the implementation of the policy, or near the end of the stage, its effect was greatly reduced, and it was far less obvious than in the initial stage of the policy.
5. Conclusions
To reach the carbon peak and carbon neutrality targets, reducing carbon emissions and reducing particulate matter concentration are important ways to improve atmospheric quality. China has introduced a policy of coal to gas and electricity to combat frequent smog and severe air pollution caused by coal-fired heating. Based on the panel data of nineteen cities in The Beijing–Tianjin–Hebei region and surrounding areas from 2016 to 2020, the PSM-DID model and the time-varying DID model were used to test the effectiveness and dynamic sustainability of the policy of coal to gas and electricity on air pollution. The empirical analysis results show that (1) the propensity score matching method (PSM) can be used to match the influencing factors of air quality in nineteen cities in Beijing–Tianjin–Hebei and surrounding areas and to overcome the endogenous problem among variables. It provides new evidence to study the relationship between the policy of changing coal to gas and electricity and the influencing factors of air pollution, and it enriches the research methods of the existing literature on the influence of coal to gas and electricity. (2) On the whole, the fitting effect of DID model is at a normal level; that is, the air pollution levels in the Beijing–Tianjin–Hebei urban agglomeration that participated in the Coal to Gas and Electricity policy did decrease, indicating that the coal to gas power policy has indeed achieved the expected effect. One possible reason is that the government plays a leading role in air pollution; the coal to gas policy involves the coordinated development of the Beijing–Tianjin–Hebei city, indicating that the choice of pilot cities is obviously representative. (3) Regarding the significance level, the policy had a relatively large impact on SO2 and PM10, while the effects on PM2.5 and CO were relatively weak. This result shows the urgent need for more accurate improvement plans for various pollutants. The weak reduction capacity of PM2.5 may be due to the fact that PM2.5 had shown a downward trend before the implementation of the Coal to Gas and Electricity policy in the Beijing–Tianjin–Hebei region; other air joint prevention and control policies had shown a more powerful governance effect. The weak impact on carbon emissions suggests that other precise solutions for carbon emissions are needed to achieve dual-carbon targets. (4) The dynamic sustainability results of the policy of changing coal to gas and electricity show that the virtual variables in the first two weeks have a significant negative effect, proving that the policy has a strong impact in the initial stage. The effect of the last two weeks was very modest, with a significant negative effect only in SO2. This shows that the effect of the policy at the end stage or near the end stage of the implementation is greatly reduced and is far less obvious than at the early stage of the policy. It shows that the one-size-fits all policy does not have a good sustainable effect, which may be due to the smaller subsidy intensity in the later stage, the increased cost for residents using gas and electricity, or the inherent living habits resulting in the smaller policy intensity.
In the end, given the current situation in Beijing, Tianjin, and Hebei, we propose the following recommendations to improve air quality: First, during the implementation of the policy, the air quality in Beijing, Tianjin, and Hebei was improved, and specific action arrangements have been planned for the future. However, there are different difficulties and effects between regions, Hebei is regarded as a key area to undertake the transfer industries of Beijing, which can hardly bear the impact of the coal ban on its economy, so as to Tianjin, while the air pollution in Hebei and Tianjin will also infect Beijing. So, establishing a regional joint prevention-and-control mechanism for air pollution; building one picture of the responsibility of replacing coal with gas and electricity in Beijing, Tianjin, and Hebei; promoting the upgrading of regional industrial structure; and balancing the regional central budget are the most crucial missions that should be completed in the following days. Second, although the Coal to Gas and Electricity policy has reduced the AQI index, it only had a large impact on SO2 and PM10, and was relatively weak on PM2.5 and CO. Therefore, to increase investment in R&D, strategies for reducing individual pollutants are urgently needed. The policy of coal to gas and electricity has had little impact on carbon emissions. To achieve the dual-carbon target, we need to cooperate to achieve a precise emission reduction strategy. Last but not least, we find air quality continues to deteriorate after the end of the policy, which means that a policy that imposes uniformity in all cases is not sustainable. In reality, the implementation of policy is often difficult to accomplish in one stroke. Not only does the policy need to prevent the emergence of a gas shortage under the law of objective economics and slowly promote the policy according to the local economic situation and residents’ income and habits, but it also must enhance service guarantees, strive for more subsidies and more alternative energy like biomass fuel, wind energy, and solar energy for the local people. So, we will continue to pay attention to that in our research.
Author Contributions
Conceptualization, J.Z. and L.G.; methodology, J.Z.; software, J.Z. and L.G.; validation, Z.D.; formal analysis, J.Z. and Z.D.; investigation, J.Z.; resources, Z.D.; data curation, Z.D.; writing—original draft preparation, J.Z.; writing—review and editing, J.Z., W.W. and L.G.; visualization, W.W.; supervision, J.Z. and Y.T.; project administration, W.W.; funding acquisition, W.W. All authors have read and agreed to the published version of the manuscript.
Funding
This research is funded by the Annual Project of Philosophy and Social Sciences of Henan Province (Grant No.2021CJJ135); Science and Technology Innovation Project of Beijing Forestry University (Grant No.2021SPS01); The Social Science Foundation Cultivation Program of Yanshan University (Grant No.118/0370044).
Institutional Review Board Statement
Not applicable.
Informed Consent Statement
Not applicable.
Data Availability Statement
All data used during the study are available from the corresponding author by request.
Conflicts of Interest
The authors declare no conflict of interest.
References
- Zhang, Y.J.; Liu, Z.; Zhang, H.; Tan, T.D. The impact of economic growth, industrial structure and urbanization on carbon emission intensity in China. Nat. Hazards 2014, 73, 579–595. [Google Scholar] [CrossRef]
- Almond, D.; Chen, Y.; Greenstone, M.; Hongbin, L. Winter heating or clean air? Unintended impacts of China’s Huai river policy. Am. Econ. Rev. 2009, 99, 184–190. [Google Scholar] [CrossRef] [Green Version]
- Wang, Y.; Guo, Z.; Han, J. The relationship between urban heat island and air pollutants and them with influencing factors in the Yangtze river delta, China. Ecol. Indic. 2021, 129, 107976. [Google Scholar] [CrossRef]
- Yu, S.W.; Wei, Y.M.; Wang, K. Provincial allocation of carbon emission reduction targets in China: An approach based on improved fuzzy cluster and Shapley value decomposition. Energy Policy 2014, 66, 630–644. [Google Scholar] [CrossRef]
- Yu, S.W.; Wei, Y.M.; Fan, J.L.; Zhang, X.; Wang, K. Exploring the regional characteristics of inter-provincial co2 emissions in Shina: An improved fuzzy clustering analysis based on particle swarm optimization—ScienceDirect. Appl. Energy 2012, 92, 552–562. [Google Scholar] [CrossRef]
- Wang, Q.; Zhao, M.; Li, R.; Su, M. Decomposition and decoupling analysis of carbon emissions from economic growth: A comparative study of China and the United States. J. Clean. Prod. 2018, 197, 178e184. [Google Scholar] [CrossRef]
- The Website of the Central People’s Government of the PRC. Available online: http://www.gov.cn/zhengce/2021-10/24/content_5644.htm (accessed on 12 February 2021).
- The Website of the Central People’s Government of the PRC. Available online: http://www.gov.cn/zhengce/2018-01/24/content_5260167.htm (accessed on 12 February 2021).
- Wang, M.; Wang, Y.; Feng, X.; Zhao, M.; Du, X.; Wang, Y.; Wu, L. The effects of intensive supervision mechanism on air quality improvement in China. J. Air Waste Manag. Assoc. 2021, 71, 1102–1113. [Google Scholar] [CrossRef]
- Streets, D.G.; Gupta, S.; Waldhoff, S.T.; Wang, M.Q.; Bo, Y. Black carbon emissions in China. Atmos. Environ. 2001, 35, 4281–4296. [Google Scholar] [CrossRef]
- Sun, Y.; Jiang, Q.; Wang, Z.; Fu, P.; Li, J.; Yang, T.; Yin, Y. Investigation of the sources and evolution processes of severe haze pollution in Beijing in January 2013. J. Geophys. Res. Atmos. 2014, 119, 4380–4398. [Google Scholar] [CrossRef]
- Chen, Y.; Ebenstein, A.; Greenstone, M.; Li, H. Evidence on the impact of sustained exposure to air pollution on life expectancy from China’s Huai River policy. Proc. Natl. Acad. Sci. USA 2013, 110, 12936–12941. [Google Scholar] [CrossRef]
- Zhao, W.H.; Xu, Q.; Li, L.J.; Jiang, L.; Zhang, D.W.; Chen, T. Estimation of Air Pollutant Emissions from Coal Burning in the Semi-Rural Areas of Beijing Plain. Res. Environ. Sci. 2015, 28, 869–876. [Google Scholar]
- Xiong, Y.; Liao, W.J.; Wang, L. A Study on Air Pollution Governance Effect of the “Coal-to-Gas/Electricity” Policy. Collect. Essays Financ. Econ. 2021, 270, 103–112. [Google Scholar]
- Li, S.L.; Chen, M.M. A Study on the impact of “coal to gas” and “coal to electricity” policies on green development. Res. Financ. Econ. Issues 2019, 428, 49–56. [Google Scholar]
- Shi, D.; Li, S.L. The Effect of Green Cooperative Development in Beijing-Tianjin-Hebei Region—A Quasi-Natural Experiment Based on the Policy of “Coal-to-Gas/Electricity”. Res. Econ. Manag. 2018, 39, 64–77. [Google Scholar]
- Liu, H. “Coal to gas” project is feasible and prudent—Based on the investigation and analysis of “coal to gas” project in Beijing. Macroeconomics 2015, 4, 9–13. [Google Scholar]
- Yue, H.F.; Shi, C. Green Net Benefit Evaluation and Policy Optimization Measures of “Coal to Gas” Project. J. Hebei Univ. Econ. Bus. 2019, 40, 86–91. [Google Scholar]
- Xie, L.Y.; Chang, Y.X.; Lan, Y. The Effectiveness and Cost-Benefit Analysis of Clean Heating Program in Beijing. Chin. J. Environ. Manag. 2019, 11, 87–93. [Google Scholar]
- Zhang, J.F.; Smith, K.R. Household air pollution from coal and biomass fuels in China: Measurements, health impacts, and interventions. Environ. Health Perspect. 2007, 115, 848–855. [Google Scholar] [CrossRef]
- Chen, Y.; Shen, H.; Smith, K.R.; Guan, D.; Chen, Y.; Shen, G.; Tao, S. Estimating household air pollution exposures and health impacts from space heating in rural China. Environ. Int. 2018, 119, 117–124. [Google Scholar] [CrossRef] [Green Version]
- Pi, D.Q.; Chen, H.S.; Wei, W.; Wang, W.D.; Xiao, L.H.; Zhang, W.D.; Wu, J.D.; Li, J.J.; Yan, P.Z. The causes and sources of a heavy-polluted event in Beijing-Tianjin-Hebei region. China Environ. Sci. 2019, 39, 1899–1908. [Google Scholar]
- Song, Y.; Li, Z.; Yang, T.; Xia, Q. Does the expansion of the joint prevention and control area improve the air quality?—Evidence from China’s Jing-Jin-Ji region and surrounding areas. Sci. Total Environ. 2019, 706, 136034. [Google Scholar] [CrossRef] [PubMed]
- Amann, M.; Bertok, I.; Borken-Kleefeld, J.; Cofala, J.; Heyes, C.; Höglund-Isaksson, L.; Winiwarter, W. Cost-effective control of air quality and greenhouse gases in Europe: Modeling and policy applications. Environ. Model. Softw. 2011, 26, 1489–1501. [Google Scholar] [CrossRef]
- Pan, T.; Xue, Y.F.; Zhong, L.H.; Zhou, Z.; Yan, J. The Methodology for Air Pollutants Emission Inventory from Residential Coal Combustion and Its Application. Environ. Prot. 2016, 6, 20–24. [Google Scholar]
- Zhu, Y.Y.; Liu, B.; Gui, H.L.; Wang, W. Characteristics of Ozone Pollution, Meteorological Impact, and Evaluation of Forecasting Result Based on a Neural Network Model in Beijing-Tianjin-Hebei Region. Environ. Sci. 2022, 4, 1–15. [Google Scholar]
- Lin, F.Q.; Wu, Z.R. Governance of Ecological Environment in Beijing, Tianjin and Hebei: From “fragmentation” to the Holistic. J. Hebei Univ. Econ. Bus. 2017, 38, 96–103. [Google Scholar]
- Wang, X.-C.; Klemes, J.J.; Dong, X.; Fan, W.; Xu, Z.; Wang, Y. Air pollution terrain nexus: A review considering energy generation and consumption. Renew. Sustain. Energy Rev. 2019, 105, 71–85. [Google Scholar] [CrossRef]
- Zhu, Z.Z.; Liao, H. Evaluation on the Effects of Joint Prevention and Control of Air Pollution in Beijing-Tianjin-Hebei Region and Its Surrounding Areas— An Empirical Study Based on Multi-period Difference-in-Difference Model. J. China Univ. Geosci. Soc. Sci. Ed. 2022, 2, 142–156. [Google Scholar]
- Du, W.C.; Xia, Y.M. Did the Measures of Haze Cooperative Governance in Beijing-Tianjin-Hebei Region Work: An Analysis Based on the DID Model. Contemp. Econ. Manag. 2018, 40, 53–59. [Google Scholar]
- Wang, Q.; Zheng, S.L. Impact of joint prevention and control action on atmospheric pollutant concentration in ‘2 + 26′ cities. China Population. Resour. Environ. 2019, 29, 51–62. [Google Scholar]
- Wang, S.; Huang, Q.; Liu, Q.; Sun, D. Can clean heating in winter in northern China reduce air pollution?—empirical analysis based on the psm-did method. Energies 2022, 15, 1839. [Google Scholar] [CrossRef]
- Heckman, J.J.; Ichimura, H.; Todd, P.E. Matching as an Econometric Evaluation Estimator: Evidence from Evaluating a Job Training Program. Rev. Econ. Stud. 1997, 64, 605–654. [Google Scholar] [CrossRef]
- Heckman, J.J.; Ichimura, H.; Todd, P.E. Matching as an Econometric Evaluation Estimator. Rev. Econ. Stud. 1998, 65, 261–294. [Google Scholar] [CrossRef]
- Tong, Z.; Chen, Y.; Malkawi, A.; Liu, Z.; Freeman, R.B. Energy saving potential of natural ventilation in China: The impact of ambient air pollution. Appl. Energy 2016, 179, 660–668. [Google Scholar] [CrossRef] [Green Version]
- Kyrkilis, G.; Chaloulakou, A.; Kassomenos, P.A. Development of an aggregate Air Quality Index for an urban Mediterranean agglomeration: Relation to potential health effects. Environ. Int. 2007, 33, 670–676. [Google Scholar] [CrossRef] [PubMed]
- Lian, X.; Huang, J.; Huang, R.-J.; Liu, C.; Wang, L.; Zhang, T. Impact of city lockdown on the air quality of COVID-19-hit of Wuhan city. Sci. Total Environ. 2020, 742, 140556. [Google Scholar] [CrossRef]
- The Website of the Central People’s Government of the PRC. Available online: https://www.gov.cn/zhengce/content/2014-05/27/content_8830.htm (accessed on 12 February 2021).
- Cao, J.; Wang, X.; Zhong, X.H. Did Driving Restrictions Improve Air Quality in Beijing? China Econ. Q. 2014, 13, 1091–1126. [Google Scholar]
- Shi, Q.L.; Guo, F.; Chen, S.Y. “Political Blue Sky” in Fog and Haze Governance—Evidence from the Local Annual “Two Sessions” in China. China Ind. Econ. 2016, 5, 40–56. [Google Scholar]


Publisher’s Note: MDPI stays neutral with regard to jurisdictional claims in published maps and institutional affiliations. |
© 2022 by the authors. Licensee MDPI, Basel, Switzerland. This article is an open access article distributed under the terms and conditions of the Creative Commons Attribution (CC BY) license (https://creativecommons.org/licenses/by/4.0/).