
Reproducibility of the 10-nm Solid Particle Number Methodology for Light-Duty Vehicles Exhaust Measurements

 ,
,  , , and
Abstract
:1. Introduction
2. Materials and Methods
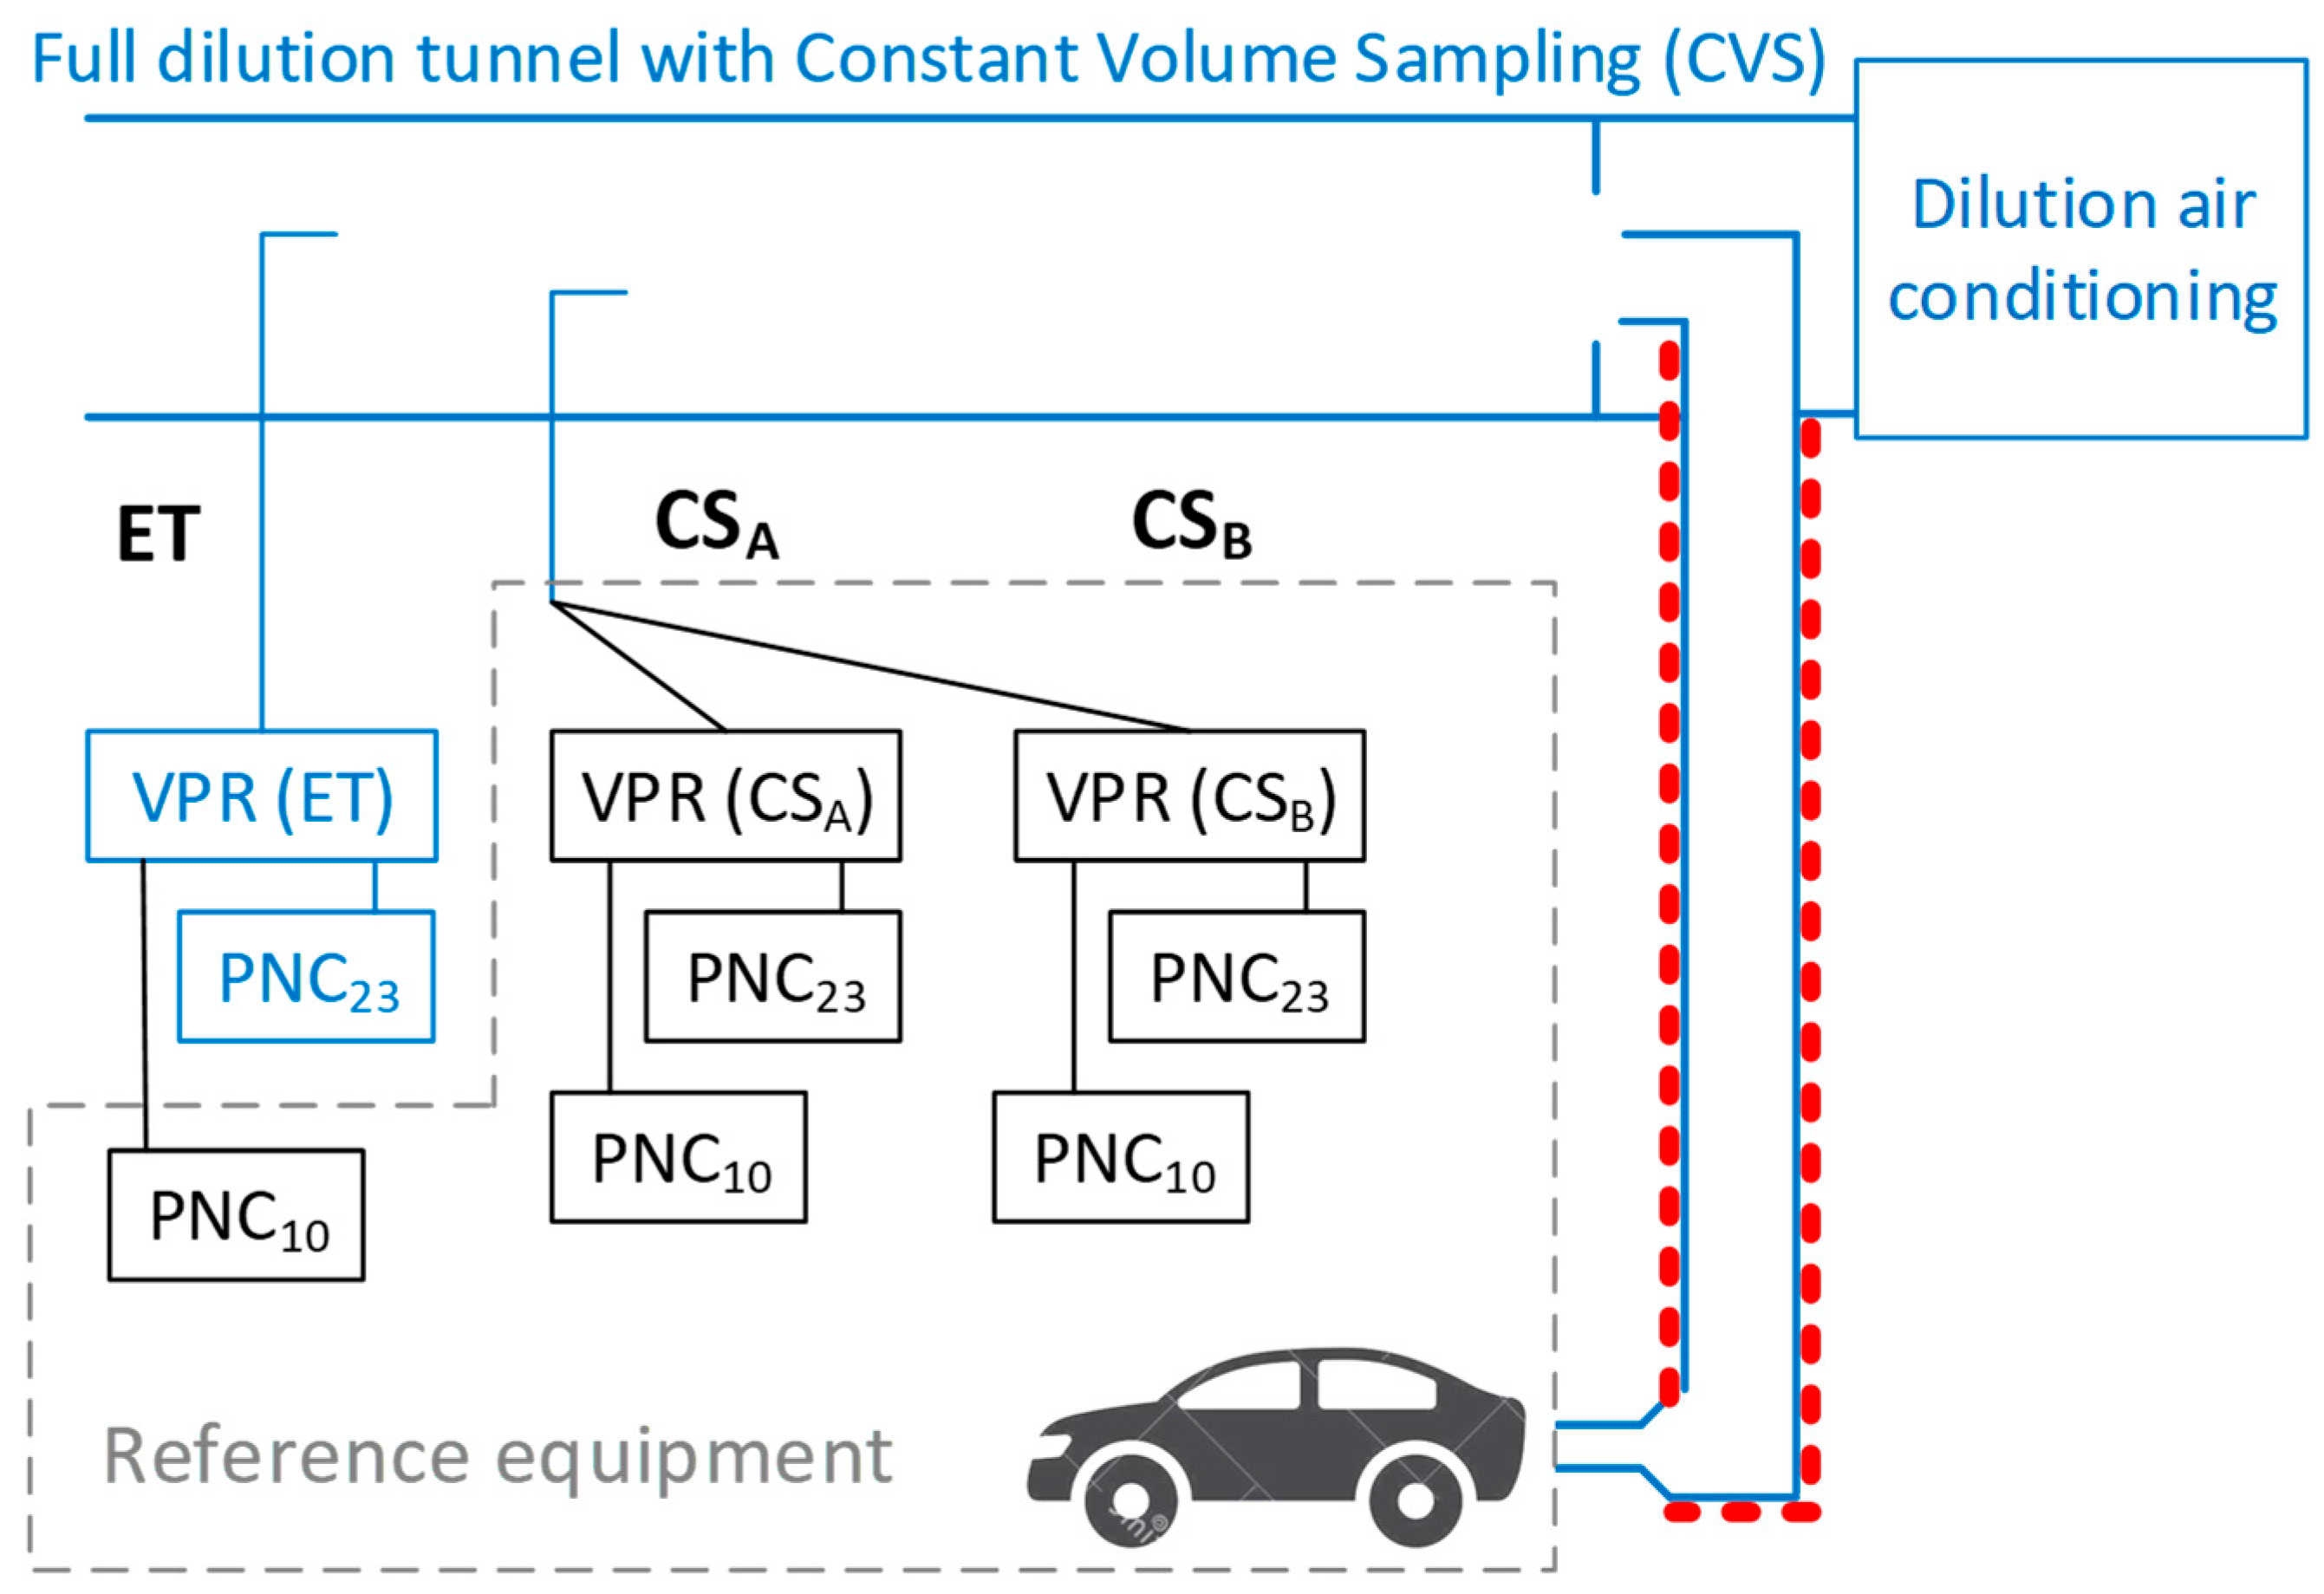
2.1. Overview
2.2. Vehicle
2.3. Fuel
2.4. Measurement Setup
2.5. Test Cycles
2.6. Calculations
3. Results
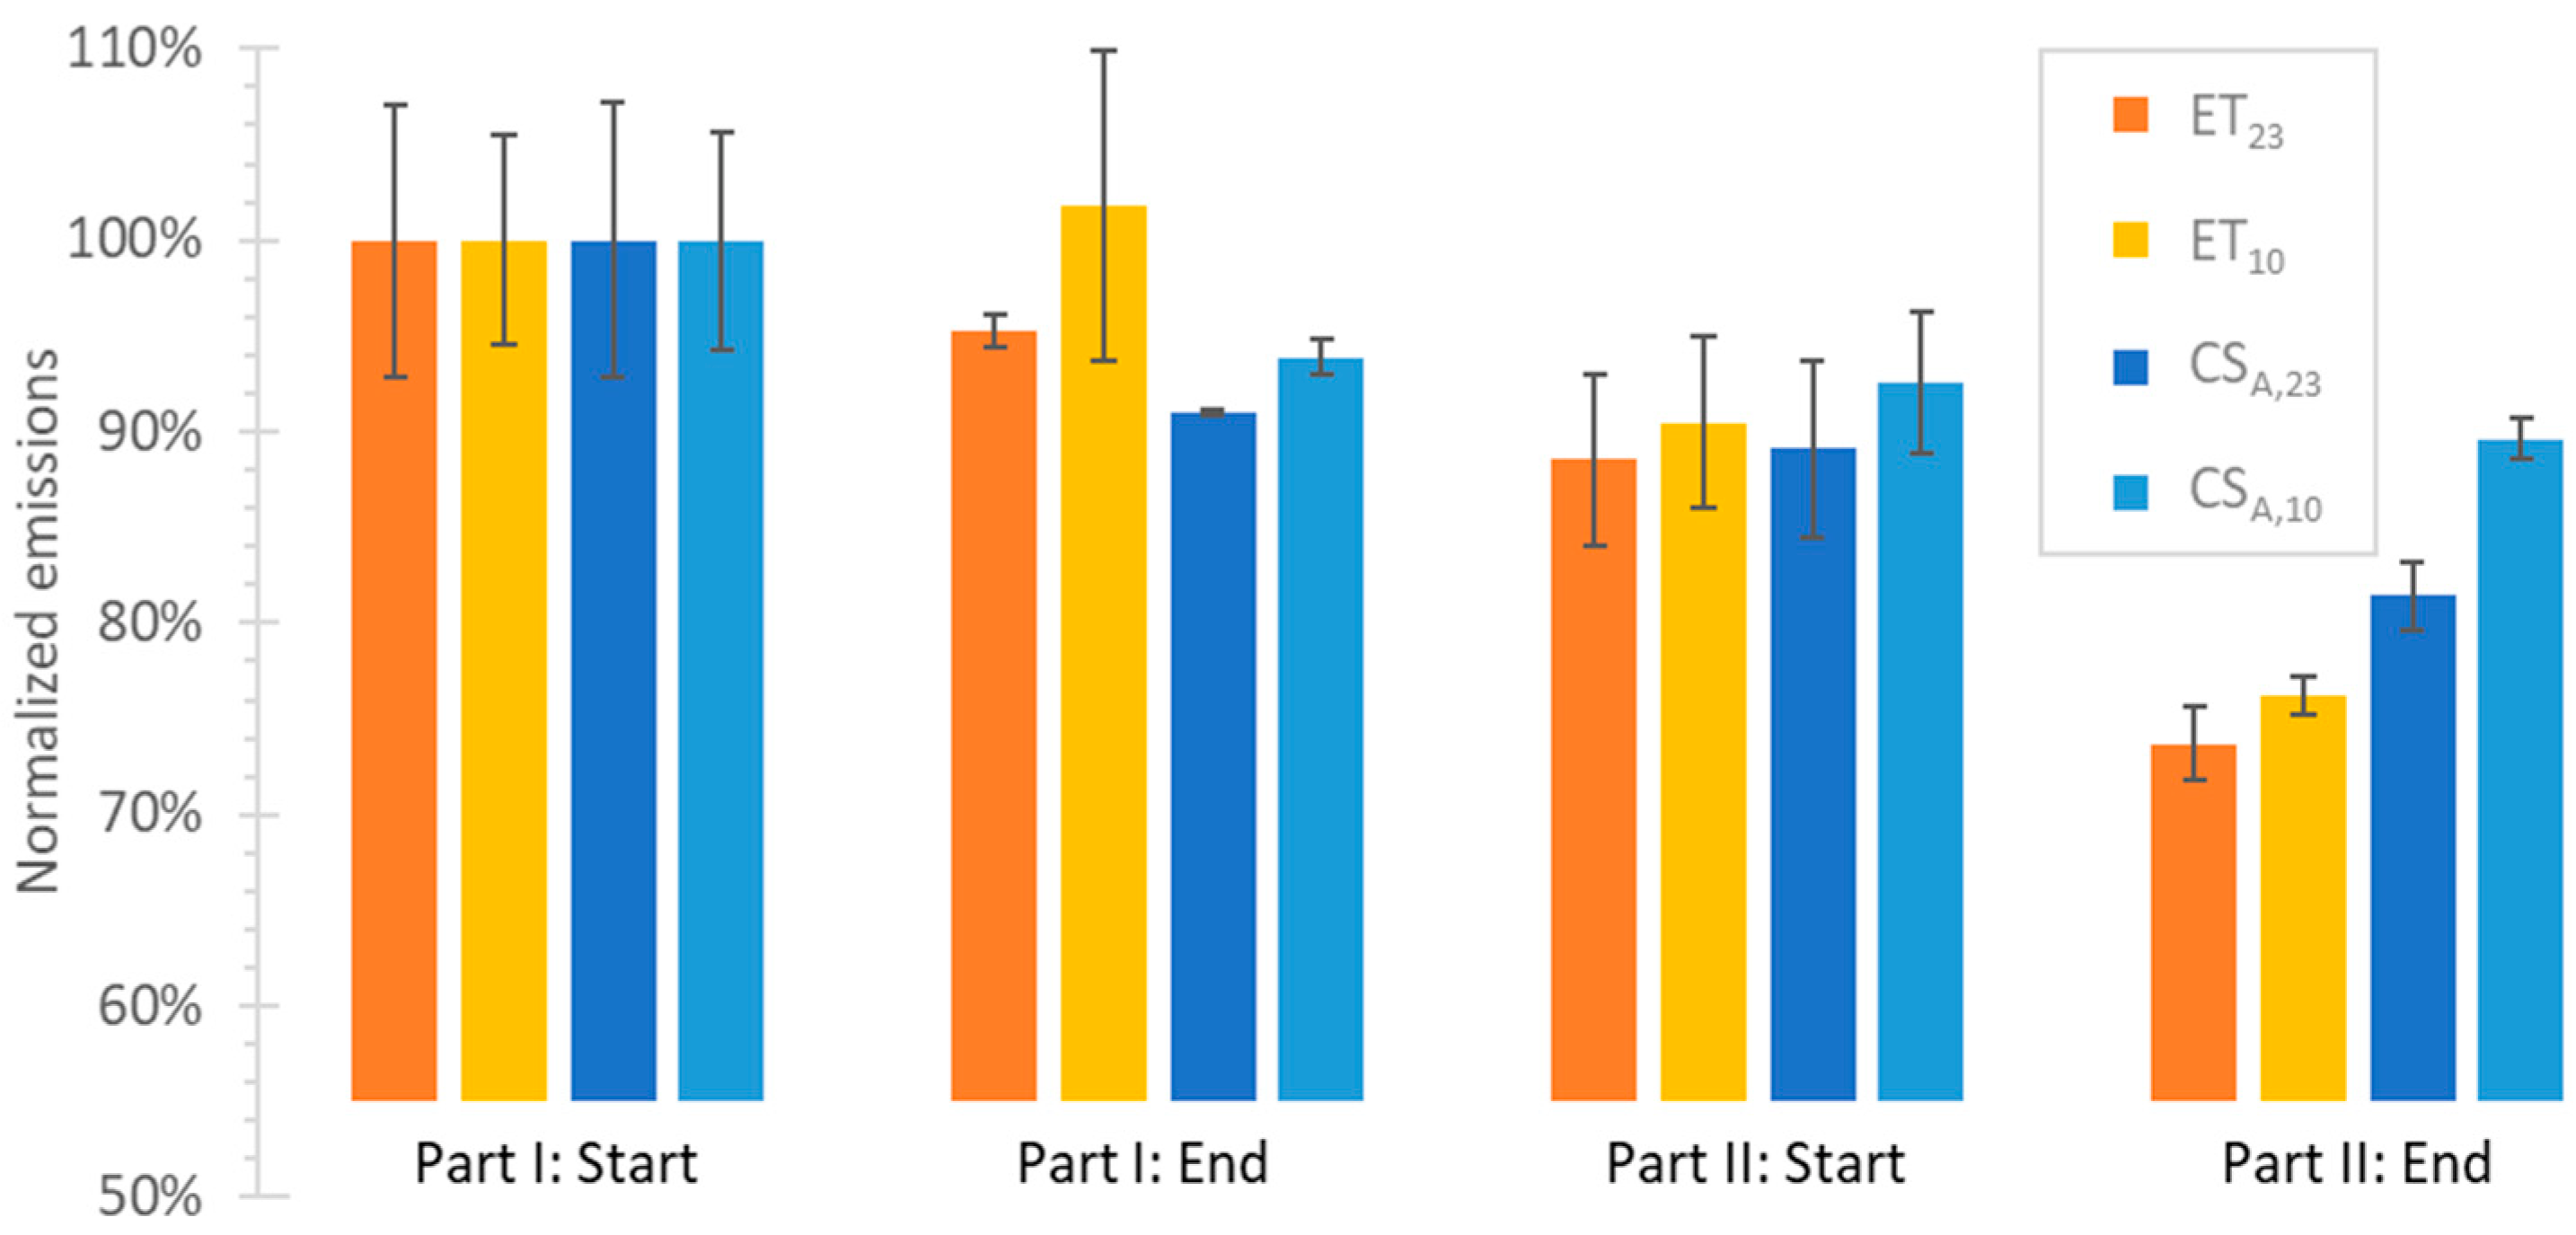
3.1. Vehicle Stability
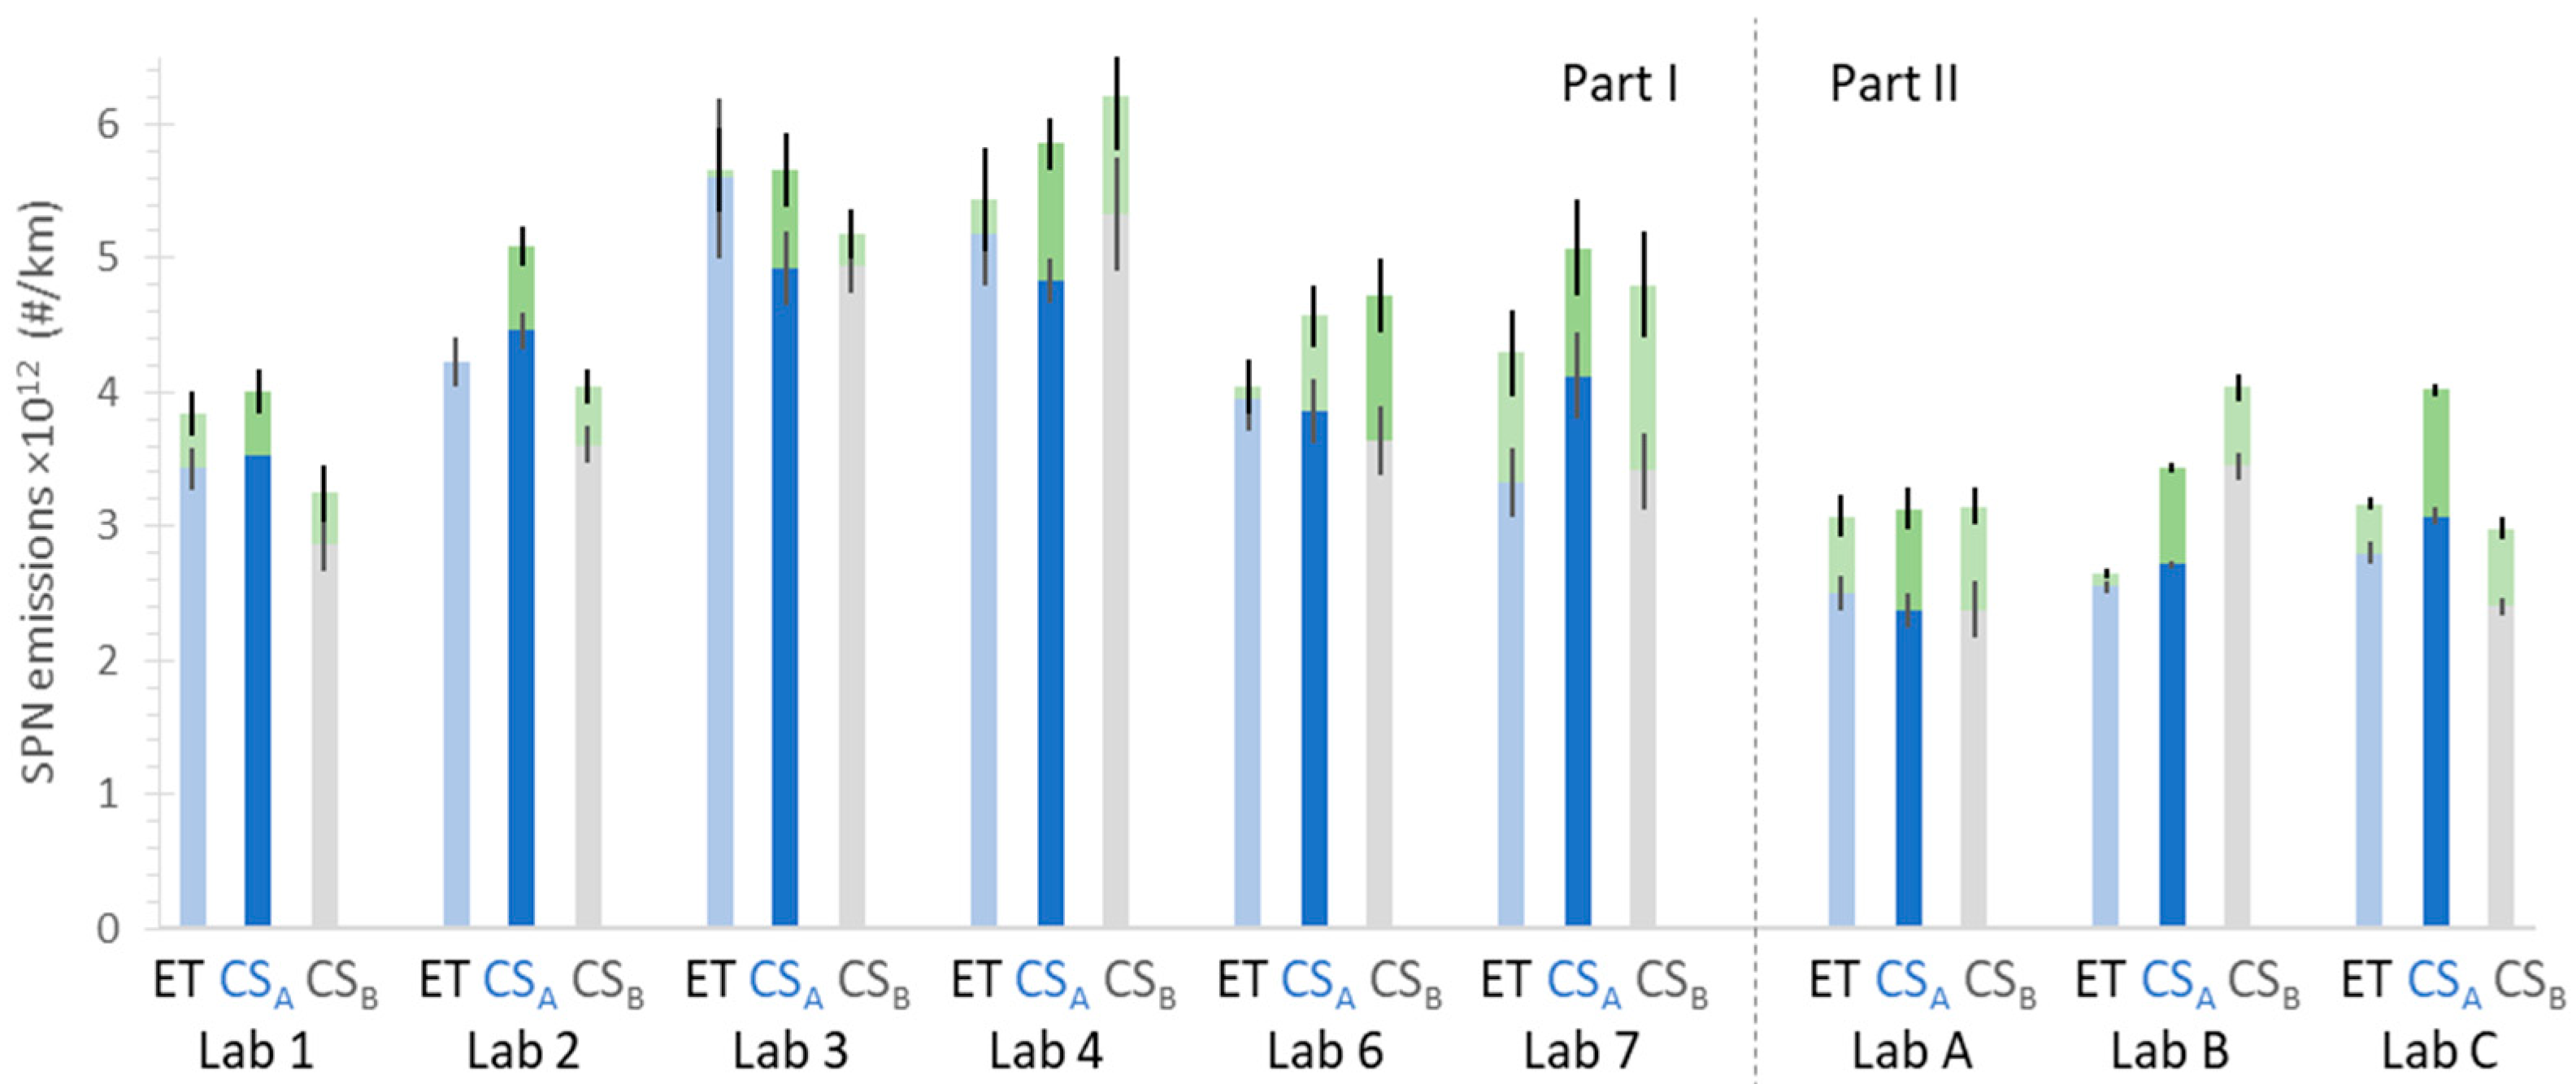
3.2. WLTC Absolute Emissions
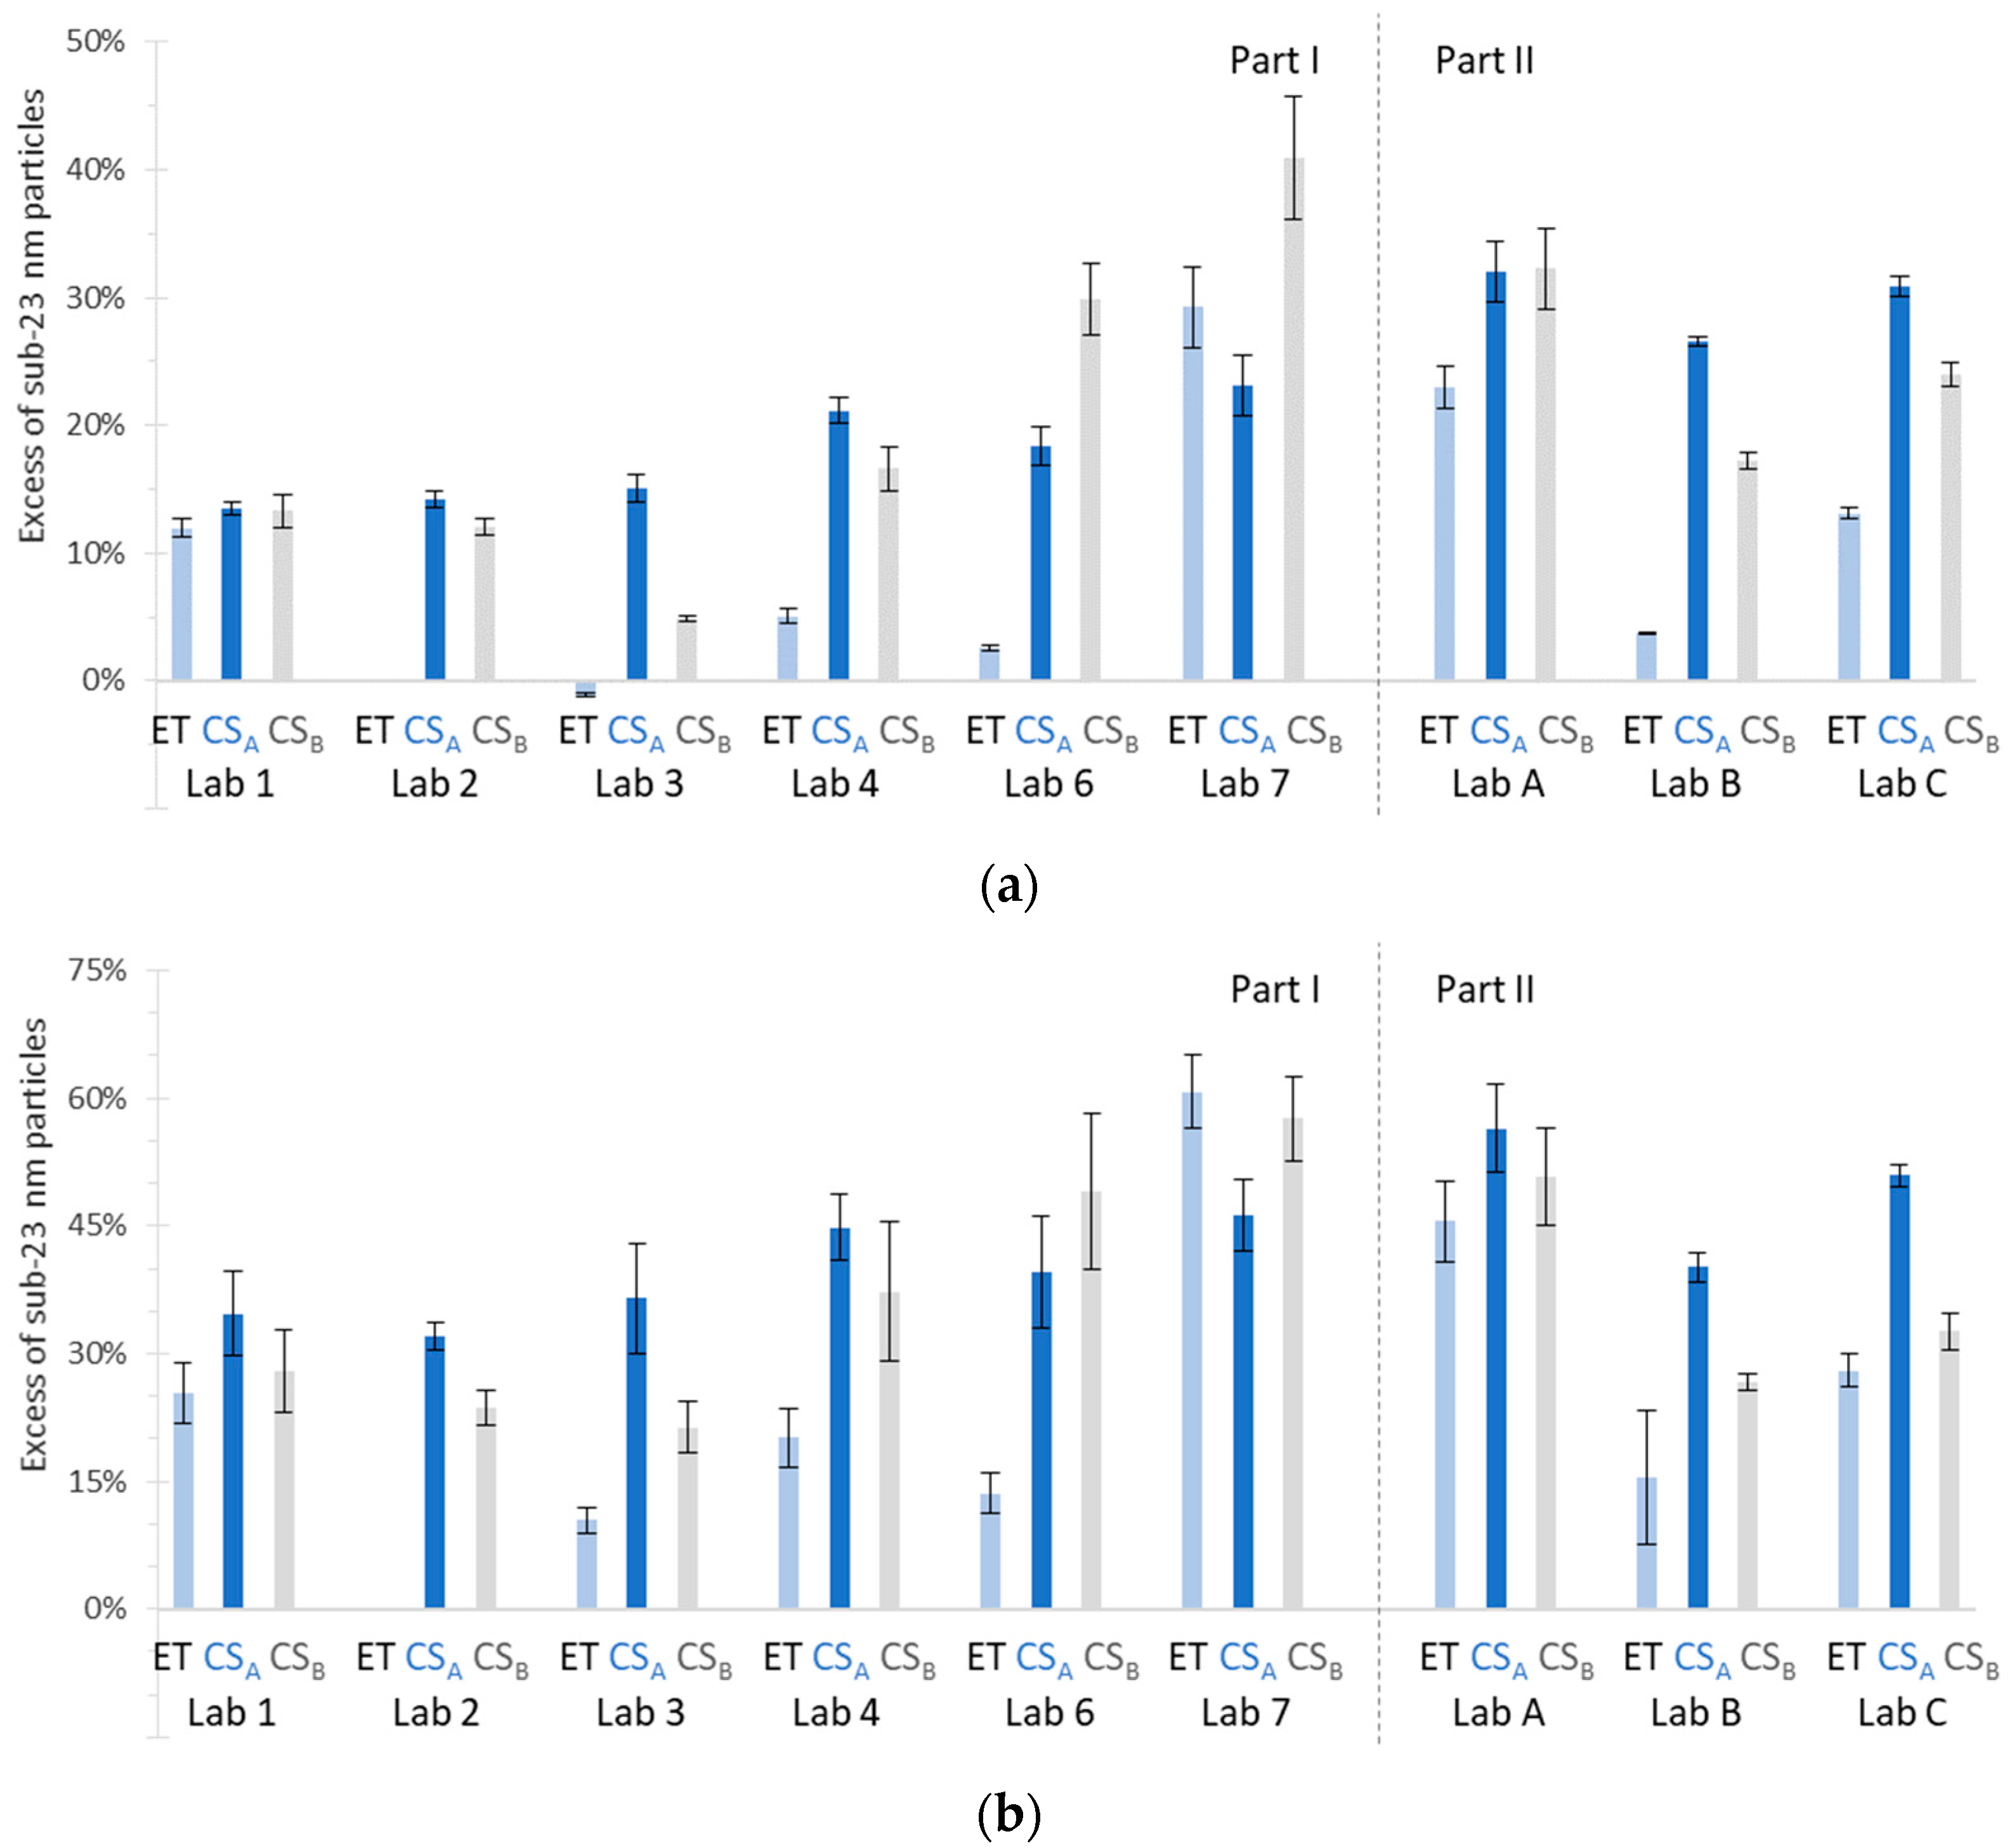
3.3. Sub-23 nm Particles
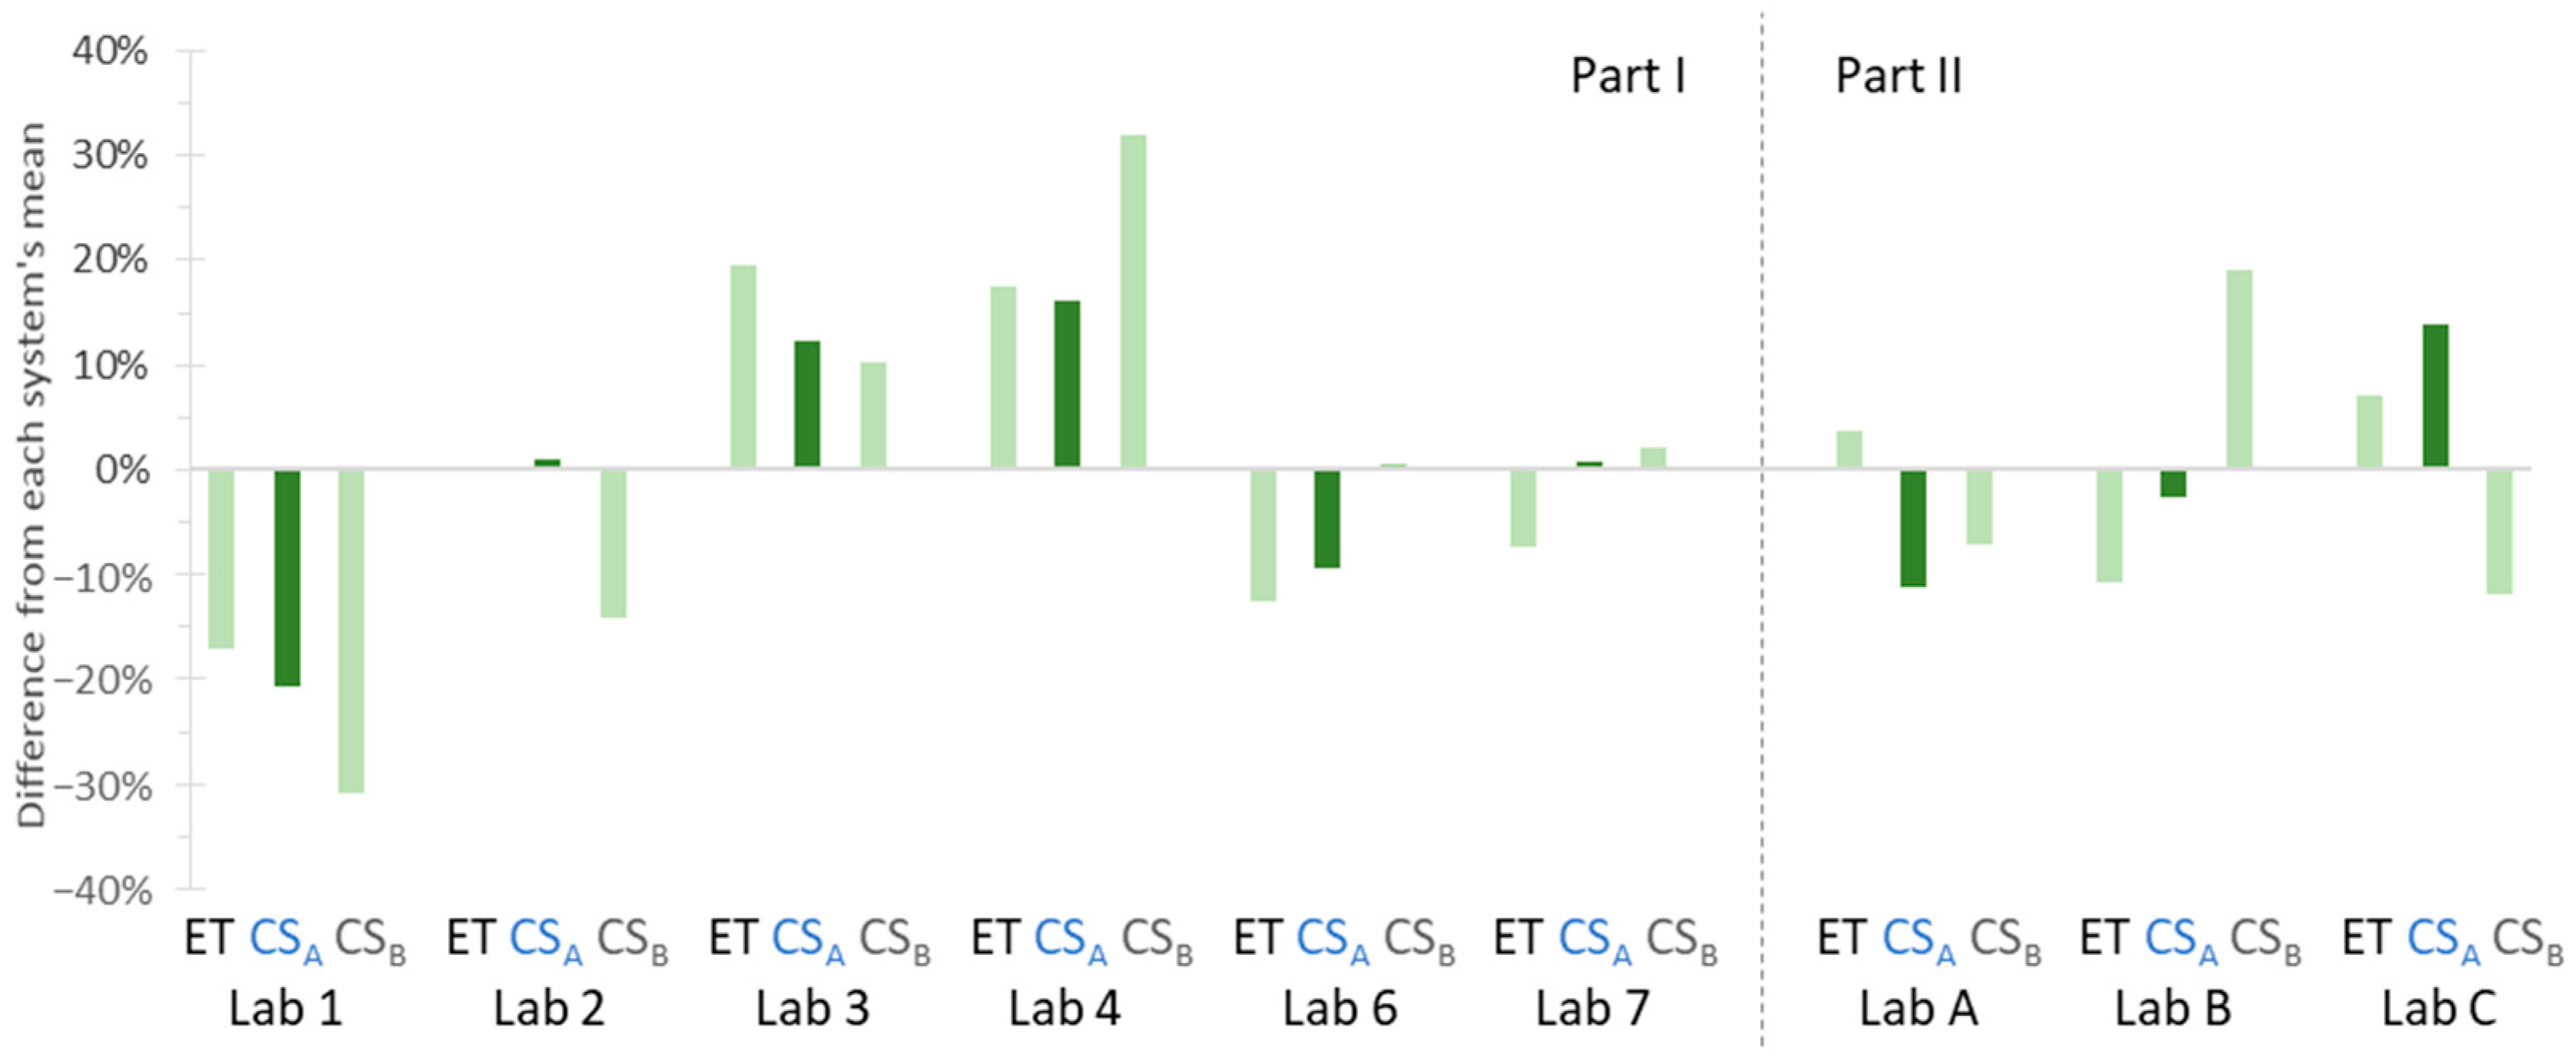
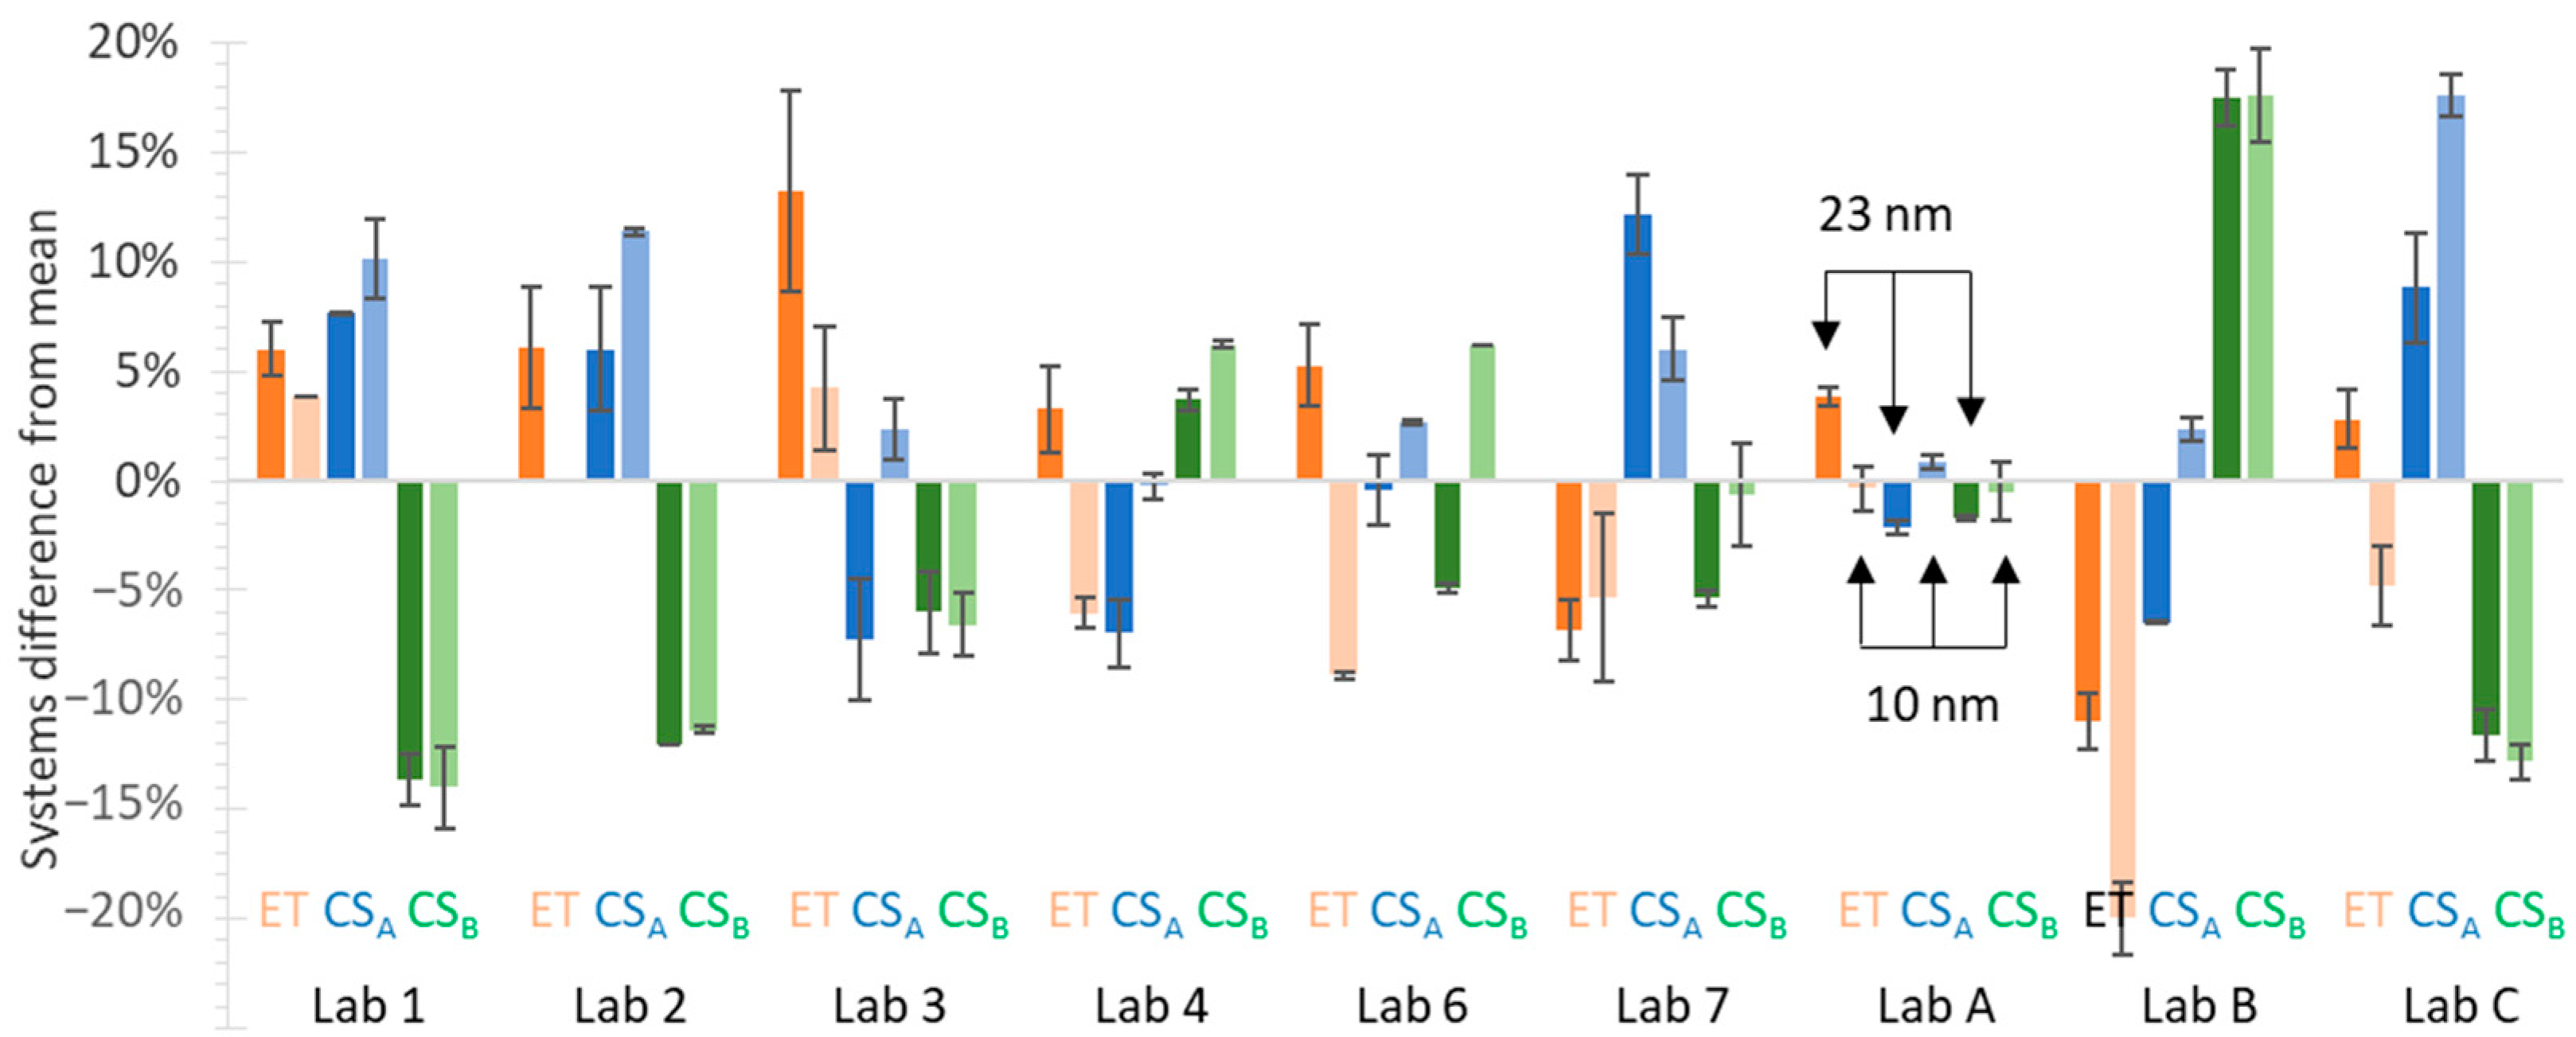
3.4. Comparisons of Measurement Systems
3.5. Reproducibilities
3.6. Emissions in WLTC Phases
4. Discussion
5. Conclusions
Author Contributions
Funding
Institutional Review Board Statement
Informed Consent Statement
Data Availability Statement
Acknowledgments
Conflicts of Interest
Appendix A

References
- Giechaskiel, B.; Lähde, T.; Suarez-Bertoa, R.; Clairotte, M.; Grigoratos, T.; Zardini, A.; Perujo, A.; Martini, G. Particle Number Measurements in the European Legislation and Future JRC Activities. Combust. Engines 2018, 174, 3–16. [Google Scholar] [CrossRef]
- Giechaskiel, B.; Mamakos, A.; Andersson, J.; Dilara, P.; Martini, G.; Schindler, W.; Bergmann, A. Measurement of Automotive Nonvolatile Particle Number Emissions within the European Legislative Framework: A Review. Aerosol Sci. Technol. 2012, 46, 719–749. [Google Scholar] [CrossRef]
- Giechaskiel, B.; Joshi, A.; Ntziachristos, L.; Dilara, P. European Regulatory Framework and Particulate Matter Emissions of Gasoline Light-Duty Vehicles: A Review. Catalysts 2019, 9, 586. [Google Scholar] [CrossRef] [Green Version]
- Giechaskiel, B.; Melas, A.; Martini, G.; Dilara, P. Overview of Vehicle Exhaust Particle Number Regulations. Processes 2021, 9, 2216. [Google Scholar] [CrossRef]
- Giechaskiel, B.; Dilara, P.; Andersson, J. Particle Measurement Programme (PMP) Light-Duty Inter-Laboratory Exercise: Repeatability and Reproducibility of the Particle Number Method. Aerosol Sci. Technol. 2008, 42, 528–543. [Google Scholar] [CrossRef]
- Giechaskiel, B.; Drossinos, Y. Theoretical Investigation of Volatile Removal Efficiency of Particle Number Measurement Systems. SAE Int. J. Engines 2010, 3, 1140–1151. [Google Scholar] [CrossRef]
- Johnson, K.C.; Durbin, T.D.; Jung, H.; Chaudhary, A.; Cocker, D.R.; Herner, J.D.; Robertson, W.H.; Huai, T.; Ayala, A.; Kittelson, D. Evaluation of the European PMP Methodologies during On-Road and Chassis Dynamometer Testing for Dpf Equipped Heavy-Duty Diesel Vehicles. Aerosol Sci. Technol. 2009, 43, 962–969. [Google Scholar] [CrossRef]
- Zheng, Z.; Durbin, T.D.; Karavalakis, G.; Johnson, K.C.; Chaudhary, A.; Cocker, D.R.; Herner, J.D.; Robertson, W.H.; Huai, T.; Ayala, A.; et al. Nature of Sub-23-Nm Particles Downstream of the European Particle Measurement Programme (PMP)-Compliant System: A Real-Time Data Perspective. Aerosol Sci. Technol. 2012, 46, 886–896. [Google Scholar] [CrossRef]
- Giechaskiel, B.; Vanhanen, J.; Väkevä, M.; Martini, G. Investigation of Vehicle Exhaust Sub-23 Nm Particle Emissions. Aerosol Sci. Technol. 2017, 51, 626–641. [Google Scholar] [CrossRef] [Green Version]
- Alanen, J.; Saukko, E.; Lehtoranta, K.; Murtonen, T.; Timonen, H.; Hillamo, R.; Karjalainen, P.; Kuuluvainen, H.; Harra, J.; Keskinen, J.; et al. The Formation and Physical Properties of the Particle Emissions from a Natural Gas Engine. Fuel 2015, 162, 155–161. [Google Scholar] [CrossRef]
- Chan, T.W.; Saffaripour, M.; Liu, F.; Hendren, J.; Thomson, K.A.; Kubsh, J.; Brezny, R.; Rideout, G. Characterization of Real-Time Particle Emissions from a Gasoline Direct Injection Vehicle Equipped with a Catalyzed Gasoline Particulate Filter during Filter Regeneration. Emiss. Control Sci. Technol. 2016, 2, 75–88. [Google Scholar] [CrossRef] [Green Version]
- Schwanzer, P.; Rabl, H.-P.; Loders, S.; Seifert, P.; Himmelstoß, S.; Gaderer, M. Difference in the Tailpipe Particle Number by Consideration of Sub-23-Nm Particles for Different Injection Settings of a GDI Engine. Emiss. Control Sci. Technol. 2019, 5, 7–22. [Google Scholar] [CrossRef]
- Mamakos, A.; Martini, G.; Marotta, A.; Manfredi, U. Assessment of Different Technical Options in Reducing Particle Emissions from Gasoline Direct Injection Vehicles. J. Aerosol Sci. 2013, 63, 115–125. [Google Scholar] [CrossRef]
- Giechaskiel, B.; Lähde, T.; Schwelberger, M.; Kleinbach, T.; Roske, H.; Teti, E.; van den Bos, T.; Neils, P.; Delacroix, C.; Jakobsson, T.; et al. Particle Number Measurements Directly from the Tailpipe for Type Approval of Heavy-Duty Engines. Appl. Sci. 2019, 9, 4418. [Google Scholar] [CrossRef] [Green Version]
- Toumasatos, Z.; Kontses, A.; Doulgeris, S.; Samaras, Z.; Ntziachristos, L. Particle Emissions Measurements on CNG Vehicles Focusing on Sub-23nm. Aerosol Sci. Technol. 2021, 55, 182–193. [Google Scholar] [CrossRef]
- Yamada, H.; Inomata, S.; Tanimoto, H. Particle and VOC Emissions from Stoichiometric Gasoline Direct Injection Vehicles and Correlation between Particle Number and Mass Emissions. Emiss. Control Sci. Technol. 2017, 3, 135–141. [Google Scholar] [CrossRef]
- Giechaskiel, B.; Manfredi, U.; Martini, G. Engine Exhaust Solid Sub-23 Nm Particles: I. Literature Survey. SAE Int. J. Fuels Lubr. 2014, 7, 950–964. [Google Scholar] [CrossRef]
- Giechaskiel, B.; Martini, G. Engine Exhaust Solid Sub-23 Nm Particles: Ii. Feasibility Study for Particle Number Measurement Systems. SAE Int. J. Fuels Lubr. 2014, 7, 935–949. [Google Scholar] [CrossRef]
- Giechaskiel, B.; Martini, G. JRC Literature Survey State of Knowledge on Sub-23 Nm Particles. In Proceedings of the the PMP 28th meeting, Brussels, Belgium, 21 November 2013; Available online: https://Wiki.Unece.Org/Display/Trans/PMP+28th+session (accessed on 23 May 2022).
- Lahde, T.; Giechaskiel, B.; Martini, G. Development of Measurement Methodology for Sub 23 Nm Particle Number (PN) Measurements. SAE Int. J. Adv. Curr. Prac. Mobil. 2020, 3, 551–560. [Google Scholar] [CrossRef]
- Amanatidis, S.; Ntziachristos, L.; Giechaskiel, B.; Katsaounis, D.; Samaras, Z.; Bergmann, A. Evaluation of an Oxidation Catalyst (“Catalytic Stripper”) in Eliminating Volatile Material from Combustion Aerosol. J. Aerosol Sci. 2013, 57, 144–155. [Google Scholar] [CrossRef]
- Melas, A.D.; Koidi, V.; Deloglou, D.; Daskalos, E.; Zarvalis, D.; Papaioannou, E.; Konstandopoulos, A.G. Development and Evaluation of a Catalytic Stripper for the Measurement of Solid Ultrafine Particle Emissions from Internal Combustion Engines. Aerosol Sci. Technol. 2020, 54, 704–714. [Google Scholar] [CrossRef]
- Giechaskiel, B.; Melas, A.D.; Lähde, T.; Martini, G. Non-Volatile Particle Number Emission Measurements with Catalytic Strippers: A Review. Vehicles 2020, 2, 342–364. [Google Scholar] [CrossRef]
- GRPE-81-10 PMP. Revisions to ECE/TRANS/WP.29/GRPE/2020/14: Sub-23 Nm PN Measurements. In Proceedings of the GRPE 81st Session, Geneva, Switzerland, 9–11 June 2020. [Google Scholar]
- Giechaskiel, B.; Casadei, S.; Rossi, T.; Forloni, F.; Di Domenico, A. Measurements of the Emissions of a “Golden” Vehicle at Seven Laboratories with Portable Emission Measurement Systems (PEMS). Sustainability 2021, 13, 8762. [Google Scholar] [CrossRef]
- Zervas, E.; Dorlhène, P.; Forti, L.; Perrin, C.; Momique, J.C.; Monier, R.; Ing, H.; Lopez, B. Interlaboratory Test of Exhaust PM Using ELPI. Aerosol Sci. Technol. 2005, 39, 333–346. [Google Scholar] [CrossRef]
- Myung, C.-L.; Lee, H.; Kwon, S.; Lee, S.; Jun, J.; Lee, Y.; Woo, Y.; Lee, M.; Bae, G.-N.; Park, S. Inter-Laboratory Correlation Exercise on a Light-Duty Diesel Passenger Vehicle to Verify Nano-Particle Emission Characteristics by Korea Particle Measurement Program. J. Mech. Sci. Technol. 2009, 23, 729–738. [Google Scholar] [CrossRef]
- Dimopoulos Eggenschwiler, P.; Schreiber, D.; Schröter, K. Characterization of the Emission of Particles Larger than 10 Nm in the Exhaust of Modern Gasoline and CNG Light Duty Vehicles. Fuel 2021, 291, 120074. [Google Scholar] [CrossRef]
- Giechaskiel, B. Particle Number Emissions of a Diesel Vehicle during and between Regeneration Events. Catalysts 2020, 10, 587. [Google Scholar] [CrossRef]
- Bielaczyc, P.; Klimkiewicz, D.; Woodburn, J.; Szczotka, A. Exhaust Emission Testing Methods—Bosmal’s Legislative and Development Emission Testing Laboratories. Combust. Engines 2019, 178, 88–98. [Google Scholar] [CrossRef]
- ISO 5725-2:1994; Accuracy (Trueness and Precision) of Measurement Methods and Results—Part 2: Basic Method for the Determination of Repeatability and Reproducibility of a Standard Measurement Method. International Organization for Standardization: Geneva, Switzerland, 1994.
- Zhang, R.; Howard, K.; Kirkman, P.; Browne, D.; Lu, Z.; He, S.; Boger, T. A Study into the Impact of Engine Oil on Gasoline Particulate Filter Performance through a Real-World Fleet Test; SAE: Warrendale, PN, USA, 2019; no. 2019-01-0299. [Google Scholar]
- Lähde, T.; Giechaskiel, B.; Pavlovic, J.; Suarez-Bertoa, R.; Valverde, V.; Clairotte, M.; Martini, G. Solid Particle Number Emissions of 56 Light-Duty Euro 5 and Euro 6 Vehicles. J. Aerosol Sci. 2022, 159, 105873. [Google Scholar] [CrossRef]
- Valverde, V.; Mora, B.A.; Clairotte, M.; Pavlovic, J.; Suarez-Bertoa, R.; Giechaskiel, B.; Astorga-LLorens, C.; Fontaras, G. Emission Factors Derived from 13 Euro 6b Light-Duty Vehicles Based on Laboratory and on-Road Measurements. Atmosphere 2019, 10, 243. [Google Scholar] [CrossRef] [Green Version]
- Zhao, Y.; Li, X.; Hu, S.; Ma, C. Effects of the Particulate Matter Index and Particulate Evaluation Index of the Primary Reference Fuel on Particulate Emissions from Gasoline Direct Injection Vehicles. Atmosphere 2019, 10, 111. [Google Scholar] [CrossRef] [Green Version]
- Peng, W.; McCaffery, C.; Kuittinen, N.; Rönkkö, T.; Cocker, D.R.; Karavalakis, G. Secondary Organic and Inorganic Aerosol Formation from a GDI Vehicle under Different Driving Conditions. Atmosphere 2022, 13, 433. [Google Scholar] [CrossRef]
- Kim, K.; Chung, W.; Kim, M.; Kim, C.; Myung, C.-L.; Park, S. Inspection of PN, CO2, and Regulated Gaseous Emissions Characteristics from a GDI Vehicle under Various Real-World Vehicle Test Modes. Energies 2020, 13, 2581. [Google Scholar] [CrossRef]
- Raza, M.; Chen, L.; Leach, F.; Ding, S. A Review of Particulate Number (PN) Emissions from Gasoline Direct Injection (GDI) Engines and Their Control Techniques. Energies 2018, 11, 1417. [Google Scholar] [CrossRef] [Green Version]
- Jin, D.; Choi, K.; Myung, C.-L.; Lim, Y.; Lee, J.; Park, S. The Impact of Various Ethanol-Gasoline Blends on Particulates and Unregulated Gaseous Emissions Characteristics from a Spark Ignition Direct Injection (SIDI) Passenger Vehicle. Fuel 2017, 209, 702–712. [Google Scholar] [CrossRef]
- Karavalakis, G.; Short, D.; Vu, D.; Villela, M.; Asa-Awuku, A.; Durbin, T.D. Evaluating the Regulated Emissions, Air Toxics, Ultrafine Particles, and Black Carbon from SI-PFI and SI-DI Vehicles Operating on Different Ethanol and Iso-Butanol Blends. Fuel 2014, 128, 410–421. [Google Scholar] [CrossRef] [Green Version]
- Christianson, M.G.; Bardasz, E.; Nahumck, W. Impact of Lubricating Oil Condition on Exhaust Particulate Matter Emissions from Light Duty Vehicles. SAE Int. J. Fuels Lubr. 2010, 3, 476–488. [Google Scholar] [CrossRef]
- Pirjola, L.; Karjalainen, P.; Heikkilä, J.; Saari, S.; Tzamkiozis, T.; Ntziachristos, L.; Kulmala, K.; Keskinen, J.; Rönkkö, T. Effects of Fresh Lubricant Oils on Particle Emissions Emitted by a Modern Gasoline Direct Injection Passenger Car. Environ. Sci. Technol. 2015, 49, 3644–3652. [Google Scholar] [CrossRef]
- Bielaczyc, P.; Merkisz, J.; Pajdowski, P.; Woodburn, J. Correlation between Two Commercially Available PMP-Compliant Particle Number Counting Systems. Combust. Engines 2012, 149, 10–21. [Google Scholar] [CrossRef]
- Giechaskiel, B.; Woodburn, J.; Szczotka, A.; Bielaczyc, P. Particulate Matter (PM) Emissions of Euro 5 and Euro 6 Vehicles Using Systems with Evaporation Tube or Catalytic Stripper and 23 Nm or 10 Nm Counters; SAE: Warrendale, PN, USA, 2020; no. 2020-01–2203. [Google Scholar]
- Giechaskiel, B.; Lähde, T.; Melas, A.D.; Valverde, V.; Clairotte, M. Uncertainty of Laboratory and Portable Solid Particle Number Systems for Regulatory Measurements of Vehicle Emissions. Environ. Res. 2021, 197, 111068. [Google Scholar] [CrossRef]
- Giechaskiel, B.; Melas, A.; Lähde, T. Detailed Characterization of Solid and Volatile Particle Emissions of Two Euro 6 Diesel Vehicles. Appl. Sci. 2022, 12, 3321. [Google Scholar] [CrossRef]
- Giechaskiel, B.; Casadei, S.; Mazzini, M.; Sammarco, M.; Montabone, G.; Tonelli, R.; Deana, M.; Costi, G.; Di Tanno, F.; Prati, M.; et al. Inter-Laboratory Correlation Exercise with Portable Emissions Measurement Systems (PEMS) on Chassis Dynamometers. Appl. Sci. 2018, 8, 2275. [Google Scholar] [CrossRef] [Green Version]
- Terres, A.; Giechaskiel, B.; Nowak, A.; Ebert, V. Calibration Uncertainty of 23nm Engine Exhaust Condensation Particle Counters with Soot Generators: A European Automotive Laboratory Comparison. Emiss. Control Sci. Technol. 2021, 7, 124–136. [Google Scholar] [CrossRef]
- Wang, X.; Caldow, R.; Sem, G.J.; Hama, N.; Sakurai, H. Evaluation of a Condensation Particle Counter for Vehicle Emission Measurement: Experimental Procedure and Effects of Calibration Aerosol Material. J. Aerosol Sci. 2010, 41, 306–318. [Google Scholar] [CrossRef]
- Giechaskiel, B.; Wang, X.; Horn, H.-G.; Spielvogel, J.; Gerhart, C.; Southgate, J.; Jing, L.; Kasper, M.; Drossinos, Y.; Krasenbrink, A. Calibration of Condensation Particle Counters for Legislated Vehicle Number Emission Measurements. Aerosol Sci. Technol. 2009, 43, 1164–1173. [Google Scholar] [CrossRef]
- Kiwull, B.; Wolf, J.-C.; Niessner, R. Response Characteristics of PMP Compliant Condensation Particle Counters toward Various Calibration Aerosols. Aerosol Sci. Technol. 2015, 49, 98–108. [Google Scholar] [CrossRef]


| Parameter | Unit | Lab 1 to Lab 7 (Part I) | Lab A, Lab B (Part II) | Lab C (Part II) |
|---|---|---|---|---|
| T10 | °C | 52.6 | 55.6 | 52.8 |
| T50 | °C | 98.4 | 92.0 | 90.1 |
| T90 | °C | 159.3 | 143.9 | 164.8 |
| Olefins | % (vol.) | 7 | 9 | 8 |
| Aromatics | % (vol.) | 32.2 | 28.2 | 28.1 |
| Ethanol | % (vol.) | 4.9 | 9.5 | 9.4 |
| Oxygen | % (mass) | 0.9 | 3.5 | 3.5 |
| Density (15 °C) | kg/m3 | 745.6 | 753.2 | 747.3 |
| Part I (European) | Part II (Asian) | |||||
|---|---|---|---|---|---|---|
| WLTC | ET | CSA | CSB | ET | CSA | CSB |
| C (23 nm) | 4.3 (24%) | 4.2 (14%) | 3.9 (26%) | 2.6 (07%) | 2.7 (14%) | 2.7 (23%) |
| C (10 nm) | 4.8 (17%) | 5.0 (14%) | 4.7 (24%) | 3.0 (10%) | 3.5 (14%) | 3.4 (17%) |
| H (23 nm) | 2.0 (19%) | 1.8 (13%) | 1.7 (17%) | 1.4 (19%) | 1.4 (25%) | 1.5 (36%) |
| H (10 nm) | 2.5 (18%) | 2.5 (11%) | 2.3 (15%) | 1.8 (11%) | 2.1 (20%) | 2.0 (28%) |
Publisher’s Note: MDPI stays neutral with regard to jurisdictional claims in published maps and institutional affiliations. |
© 2022 by the authors. Licensee MDPI, Basel, Switzerland. This article is an open access article distributed under the terms and conditions of the Creative Commons Attribution (CC BY) license (https://creativecommons.org/licenses/by/4.0/).
Share and Cite
Lähde, T.; Giechaskiel, B.; Martini, G.; Woodburn, J.; Bielaczyc, P.; Schreiber, D.; Huber, M.; Dimopoulos Eggenschwiler, P.; Fittavolini, C.; Florio, S.; et al. Reproducibility of the 10-nm Solid Particle Number Methodology for Light-Duty Vehicles Exhaust Measurements. Atmosphere 2022, 13, 872. https://doi.org/10.3390/atmos13060872
Lähde T, Giechaskiel B, Martini G, Woodburn J, Bielaczyc P, Schreiber D, Huber M, Dimopoulos Eggenschwiler P, Fittavolini C, Florio S, et al. Reproducibility of the 10-nm Solid Particle Number Methodology for Light-Duty Vehicles Exhaust Measurements. Atmosphere. 2022; 13(6):872. https://doi.org/10.3390/atmos13060872
Chicago/Turabian StyleLähde, Tero, Barouch Giechaskiel, Giorgio Martini, Joseph Woodburn, Piotr Bielaczyc, Daniel Schreiber, Mathias Huber, Panayotis Dimopoulos Eggenschwiler, Corrado Fittavolini, Salvatore Florio, and et al. 2022. "Reproducibility of the 10-nm Solid Particle Number Methodology for Light-Duty Vehicles Exhaust Measurements" Atmosphere 13, no. 6: 872. https://doi.org/10.3390/atmos13060872
APA StyleLähde, T., Giechaskiel, B., Martini, G., Woodburn, J., Bielaczyc, P., Schreiber, D., Huber, M., Dimopoulos Eggenschwiler, P., Fittavolini, C., Florio, S., Pellegrini, L., Schuster, N., Kirchner, U., Yamada, H., Momique, J.-C., Monier, R., Lai, Y., Murtonen, T., Vanhanen, J., ... Spielvogel, J. (2022). Reproducibility of the 10-nm Solid Particle Number Methodology for Light-Duty Vehicles Exhaust Measurements. Atmosphere, 13(6), 872. https://doi.org/10.3390/atmos13060872