Abstract
Particulate matter (PM) is among the deadliest air pollutants due to its negative health impacts and environmental harm. This study reports on monthly and seasonal concentrations of PM10, PM2.5, and PM1, along with their ratios. Twelve-day samples were collected once a month in Mingora city (Swat, Pakistan) from January to December 2019 using a low volume sampler. Maximum average mass concentrations of PM10, PM2.5, and PM1 were recorded in December having values of 78, 56, and 32 μg m−3, respectively. Minimum average values for PM10 (44 μg m−3) and PM2.5 (25.1 μg m−3) were recorded in April, while the lowest PM1 (11 μg m−3) was recorded in August. In comparison to other months, the maximum average mass concentrations were 1.77 times (PM10), 2.23 times (PM2.5), and 2.9 times (PM1) higher in December. During the winter season, average mass concentrations remained high. Substantial correlation coefficients of 0.92, 0.79, and 0.75 were recorded between PM10 and PM2.5, PM2.5 and PM1, and PM2.5 and PM1, respectively. The overall average ratios PM2.5: PM10, PM1: PM2.5, and PM1: PM10 were 68.3, 52.6, and 35.4%, respectively. A moderate negative correlation of PM10, PM2.5, and PM1 with wind speed (−0.34, −0.39, and −0.41), a strong negative correlation with temperature (−0.69, −0.71, and −0.74) and rainfall (−0.63, −0.61, and −0.59), and a weak relationship with relative humidity (−0.32, −0.1, and −0.02) were recorded.
1. Introduction
Atmospheric pollution is a major problem worldwide, especially in developing countries [1]. Particulate matter (PM) is a complex mixture of contaminants that includes dust, smoke, and other kinds of liquid and solid items suspended in the air, as well as bio-particulates. A positive link exists between acute and chronic exposure to PM in the air and the risk of health complications, such as airway inflammation and lung performance [2,3,4]. PM is a major pollutant that has been associated with several health problems, the most common of which are respiratory and cardiovascular problems [5,6,7,8,9].
PM is a major pollutant in the environment that can penetrate the respiratory system and create health concerns and problems due to its size (aerodynamic diameter) [10,11]. Depending on the climatological parameters, PM with a diameter of less than 10 µm is classified as repairable-suspended-particulate-matter. It can change its physicochemical properties and can float in the air for a short to longer period. As a result, it has the potential to alter the environment’s radiative balance on a local to regional scale, potentially harming the ecosystem and climate [12,13,14]. These PM sizes absorb hazardous substances, which are then breathed into the human body and deposited in the lungs, resulting in a variety of cardiovascular and respiratory problems, leading to morbidity and mortality [15,16,17,18]. According to previous research in Sao Paulo, environmental particles have a significant impact on human and animal health [4,19,20].
Suspended particles in the air with a larger mass and size fall to the ground through a dry or wet deposition process. On the contrary, the fine and ultra-fine particles stay in the atmosphere for longer periods, sometimes up to weeks, and can be carried to different regions by air circulations, thereby affecting the environment of distant and far-off locations [21]. Moreover, particles in the atmosphere have an impact on cloud formation and dissipation, which govern heat transport in the atmosphere and cause climate change [22]. Studies underscore the importance of suspended particles, particularly PM and its fractions, to be observed and checked. These facts are crucial to (i) characterize particles chemically and physically, (ii) identify particle sources and quantify their contributions, (iii) evaluate particle temporal and geographical variability, and (iv) investigate particle effects on the environment and human health [22]. PM mass concentration is also affected by a variety of meteorological factors, including temperature, rainfall, relative humidity, and wind speed [23]. Furthermore, the quantity and composition of PM are influenced by local geological conditions and land use type [24]. The concentration and contents of PM vary from one location to the next, depending on background levels and emission sources [25].
These particles have different physical and chemical properties, including chemical structure and composition, reactivation, residence time, shape, size, solubility, and toxicity. In addition to the chemical and physical properties of PM, the definition of pollution sources also has a role in determining pollution reduction techniques [26,27]. Atmospheric stability, wind speed, rainfall, temperature, and relative humidity are all factors that play a vital influence in lowering PM mass concentration on a local and regional scale [26,27,28,29,30,31,32]. Due to a rise in anthropogenic activities, such as industrialization, urbanization, and automobile emissions, in many regions of the world, especially in developing countries, the PM has attracted greater attention in the last decade [32]. Pakistani cities have been confronted with grave air pollution-associated problems; consequently, PM has considerably affected air quality in the area [33]. The location discussed in this work, i.e., Mingora, Swat, is located in the foothills of the Hindus-Kush regions. Hence, in this region, in-depth characterization of PM will be essential for air quality, climate studies, and human health. The findings of the present study would be useful for developing an effective air quality control plan in the Mingora city of Khyber Pakhtunkhwa, Pakistan, and elsewhere. In the present study, the concentration of PM10, PM2.5, and PM1 on a monthly and seasonal basis; the correlation between the three fractions of PM; and the ratios of PM2.5 to PM10, PM1 to PM2.5, and PM1 to PM10 were investigated. Furthermore, how meteorological variables, such as wind speed, relative humidity, rainfall, and temperature affect PM mass concentration were studied.
2. Materials and Methods
2.1. Research Area and Its Meteorological Conditions
The present research work was conducted in Mingora City, Swat, Pakistan (34.77° N 72.36° E), which is 984 m above sea level (Figure 1). The study area is located in the humid and subtropical climate zone. It is the largest city in Khyber Pakhtunkhwa province (Pakistan), as well as the regional center. The 240 km Swat River flows through the city, with its origins in the Hindu-Kush Mountains. Mountains surround the study area (city) in an easterly direction. These peaks are offshoots of the well-known Hindu-Kush mountain range. As a huge city, it has a significant number of restaurants, hotels, and public and private better health care institutions. In addition, this city is a hub for a variety of crafts, including woodworking, gemstone mining, and marble, as well as several small-scale enterprises, including plastic, steel, marble, and cosmetics.
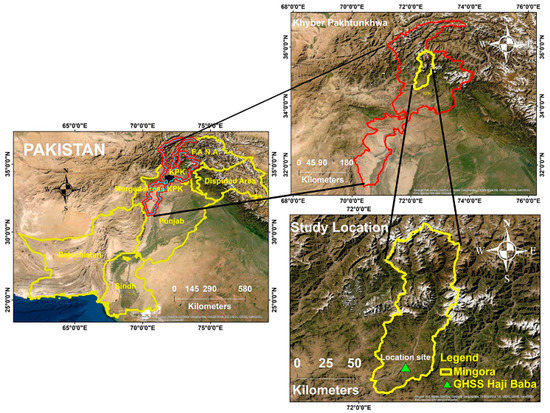
Figure 1.
Map of the study area.
Figure 2 shows the monthly change in the metrology of Mingora Swat (Pakistan). In January, September, October, and December, the wind speed (WS) is zero; however, in June, the average maximum wind speed is 1.5 ms−1. The average minimum temperature (5.8 °C) was recorded in January, while the average maximum temperature (30 °C) was recorded in July. During the sampling period, the average maximum rainfall (RF) was recorded in April, while the minimum RF was observed in September. Relative humidity (RH) had an average minimum value of 54.9% in June and an average maximum RH of 83.1% in January.
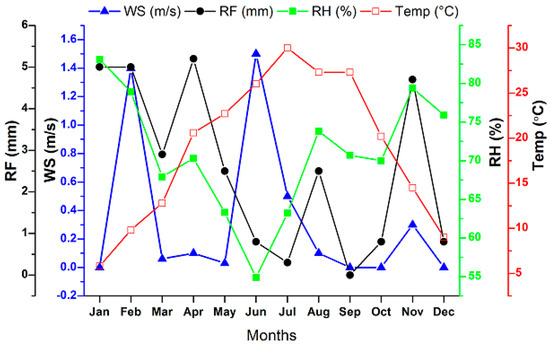
Figure 2.
Monthly mean values of wind speed, temperature, rainfall, and relative humidity.
2.2. Sample Collections
Particulate matter (PM) was collected in three-size fractions (PM10, PM2.5, and PM1) using the low volume sampler (LVS). The LVS was programmed to operate at a uniform flow rate of 16LM-1 during sampling. Sampling took place on the roadside near the Govt. Higher Secondary School, Mingora building (15 feet above the ground). PM sampling was carried out on alternating second days for a year in 2019, totaling 504 samples of each fraction. Substrates made of a quartz-fiber filter, with a 47 mm diameter, were used for the collection of PM samples. The samples were taken over 24 h, from 7 a.m. to 7 a.m. While using the sampler, filters that had been prepared and pre-weighed were placed and suitably fastened in the filter holder. Before the further investigation, the loaded filters were taken with care from the holder, placed in a Petri dish, weighed, and conditioned. The samples were kept in the refrigerator at 4 °C to avoid volatile compounds evaporating and heat damage. The PM masses were determined using gravimetric methods, with the help of microbalance; the mass of the blank filter was subtracted from the mass of the loaded filter. All the masses were taken as the average of three measurements. The following steps were used to calculate the gravimetric mass of filters pre-and post-sampling: the filters were let equilibrate for 24 h before weighing at room temperature the next day, between 24 and 48 h. The mean values were computed after weighing each filter substrate many times before and after sampling.
2.3. Linear Regression Analysis
Various regression analyses were performed between meteorological parameters and PM concentration to assess the effects of meteorological parameters (temperature, RF, RH, and WS) on PM concentration. The regression analyses provide useful information on the effect of meteorological conditions on PM concentrations. According to Bibi et al. [33] and Järvi et al. [34], multiple regression analysis was performed for meteorological characteristics, such as temperature, RF, RH, and WS, in relation to PM concentration. With known coefficients of each variable, the best-fit model can be expressed as:
where b0 represents intercept and b1, b2, b3,, and b4 are the regression coefficients of Temp RF, RH, and WS.
3. Results and Discussion
3.1. Monthly and Seasonal Variation in PM10, PM2.5, and PM1 Mass Concentration
Figure 3a,b show monthly and seasonal fluctuations in mass concentrations of three fractions (PM10, PM2.5, and PM1). A concave parabolic pattern can be seen in the PM mass concentration, which decreased from January to April, and then increased from May to December. In December, the average maximum mass concentrations of PM10, PM2.5, and PM1 were 78, 56, and 32 µg m−3, respectively. According to the WHO standards, the twenty-four hours mass concentration of PM2.5 is 15 μg m−3, and PM10 is 45 μg m−3 [35]. From 2009 to 2011, Li et al. [36] found the greatest average mass concentrations of PM10, PM2.5, and PM1 in January, reaching 118, 101, and 93 µg m−3, respectively, in Chengdu. During April, minimum levels of 44 µg m−3 (PM10), 25.1 µg m−3 (PM2.5), and 11 µg m−3 (PM1), respectively, were reported.
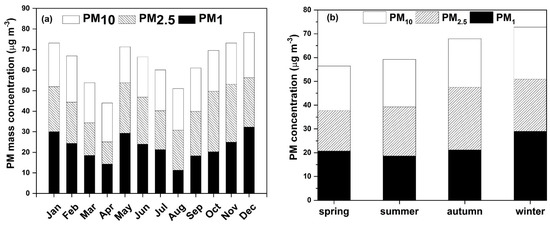
Figure 3.
(a) Monthly and (b) seasonal values of average mass concentration of PM10, PM2.5, and PM1 [spring (March, April, May), summer (Jun, July, August), autumn (September, October, November), winter (December, January, February)].
Figure 3a showed that the highest average mass concentration (PM10, PM2.5, and PM1) was observed during the winter season, which is attributable to low wind speed, rainfall, and temperature. Li et al. [36] found a similar pattern of mass concentration, with maximum concentrations of PM10 (98 µg m−3), PM2.5 (83 µg m−3), and PM1 (77 µg m−3) in winter and minimum concentrations of PM10 (49 µg m−3), PM2.5 (43 µg m−3), and PM1 (40 µg m−3) in summer at Chennai city (India). Srimuruganandam and Nagendra [37] noted PM10 (135 µg m−3), PM2.5 (73 µg m−3), and PM1 (59 µg m−3) concentrations in winter; PM10 (102 µg m−3), PM2.5 (50 µg m−3), and PM1 (34 µg m−3) concentrations in summer; and PM10 (189 µg m−3), PM2.5 (84 µg m−3) and PM1 (66 µg m−3) concentrations post-monsoon. Figure 3b depicts seasonal mass concentration. From spring through winter, there is an upward trend in mass concentration. The increase in PM concentration in the air during the winter season can be linked to a decrease in moist deposition of PM, which causes PM concentration to rise [38,39]. Furthermore, rain only has a minor effect on micro and ultrafine particles, whereas coarse and bigger particles are significantly removed [40]. The fact that temperature or thermal inversion occurs in the winter months reduces the dispersion and scattering of PM, resulting in a high concentration in the air [26,41,42]. Tecer et al. [41] observed a similar tendency of elevated mass concentrations of PM over the winter season.
3.2. Relation between PM10, PM2.5, and PM1
The relationship among three fractions of PM in 2019 is depicted in Figure 4. The correlation coefficients during the study year are found to be 0.92, 0.79, and 0.75 between PM10 and PM2.5, PM2.5 and PM1, and PM2.5 and PM1, respectively. These results indicate a significant correlation in between the three main fractions of particulate. Similar to our results, significant correlations among PM10, PM2.5, and PM1 were noted by other researchers. For example, Li et al. [36] noted a correlation coefficient of 0.92 for PM10 and PM2.5, 0.84 for PM10 and PM1, and 0.98 for PM2.5 and PM1. Similarly, a correlation coefficient of 0.93 was noted between PM10 and PM2.5 [43]. Srimuruganandam and Nagendra [37] at Chennai city (India) documented the correlation coefficients between PM10 and PM2.5 as 0.76, 0.74, and 0.54 in winter, summer, and post-monsoon, respectively. A correlation coefficient of 0.92 between PM2.5 and PM1 in winter, 0.93 in summer, and 0.97 in post-monsoon was noted, and the correlation coefficient between PM10 and PM1 was noted as 0.68 in winter, 0.59 in summer, and 0.43 in post-monsoon.
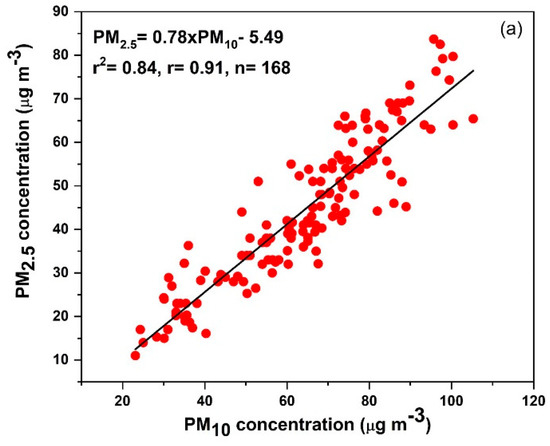
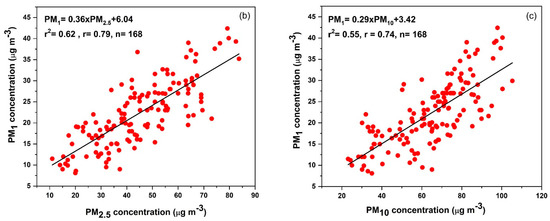
Figure 4.
Cumulative annual scatterplots between average concentrations of different PM fractions: (a) PM10 vs. PM2.5, (b) PM2.5 vs. PM1, (c) PM10 vs. PM1.
Figure 5 depicts season-wise percentage ratios of PM2.5:PM10 in spring (63%), summer (67.3%), autumn (69.9%), and winter (72.8%); PM1:PM2.5 in spring (60.8%), summer (47.1%), autumn (49%), and winter (53.6%); and PM1:PM10 in spring (37.3%), summer (31.9%), autumn (33.9%), and winter (38.6%). Average percentage ratios for PM2.5:PM10, PM1:PM2.5 and PM1:PM10 were calculated as 68.3, 52.6, and 35.4%, and they ranged between 63.0–72.8, 47.1–60.8, and 31.9–38.6%, respectively. Li et al. [36] calculated average PM2.5:PM10 (85%), PM1:PM10 (78%), and PM1:PM2.5 (92%) with ranges of 74–94% (PM2.5:PM10), 64–89% (PM1:PM10), and 87–95% (PM1:PM2.5), respectively. This analysis indicates that part of PM2.5 in PM10 is quite high during the winter season due to the elimination of coarse particles because of temperature inversion and high relative humidity. PM1:PM2.5 is observed to be high (60.8%) in spring, whereas PM1:PM10 was high (38.6%) in winter. Furthermore, the main reason for fine particle growth in the winter could be domestic heating; on the contrary, coarse particle concentration in the atmosphere increase during summer, which decreases the ratios of PM2.5:PM10, PM1:PM10, and PM1:PM2.5 [8]. Similar results were indicated by Zhao et al. [44] and Tiwari et al. [22].
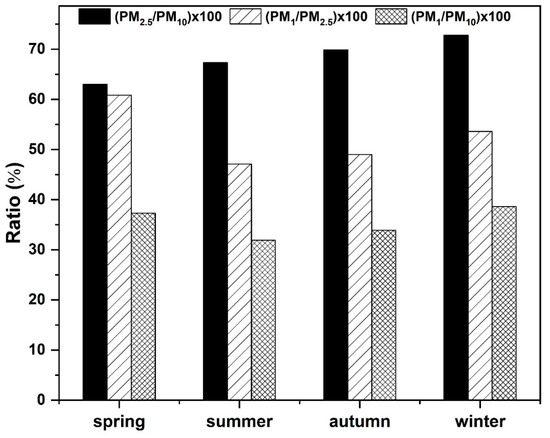
Figure 5.
The seasonal mean ratio of PM2.5 to PM10, PM1 to PM2.5, and PM1 to PM10.
3.3. Correlation between PM10, PM2.5, and PM1 Concentrations with Meteorological Parameters
The relation of PM mass concentration in three size fractions (PM10, PM2.5, and PM1) with metrological parameters, such as temperature, RF, RH, and WS, were investigated to comprehend the influence of metrological parameters on PM mass concentrations. Previous research has found that both particle emissions and meteorological parameters influence air particle pollution [45,46]. Meteorological parameters are mainly responsible for atmospheric pollution whenever PM emission in an area is constant [36], such as removal (dry and wet deposition) and transport dispersion of PM from the atmosphere is influenced by meteorological factors, such as wind, temperature, and RH. These factors also have an impact on atmospheric chemistry, resulting in the development of secondary PM [23,47].
Figure 6a depicts that WS in Mingora city was very small (0–1.5 m s−1) in 2019. From Figure 6a, it is clear that WS is calm in all the months except in Feb and Jun (very gentle WS is observed). PM concentration in the study area is not changed profoundly by the wind. This may be related to the region’s topography and surface roughness. The influence of structures and urban meteorology are other wind-limiting factors. The city is situated on mountainous terrain with intensive, unplanned, residential and commercial buildings. On the wind speed, this structure has a breaking, diverging, and diluting effect [41]. Table 1 indicates a negative correlation between WS and PM10 in the study period; PM2.5 and PM1 with values of −0.34, −0.39, and −0.41. The correlation coefficients follows the pattern as PM1 > PM2.5 > PM10. Li et al. [36] noted correlation coefficients of −0.35 for PM10, −0.56 for PM2.5, and −0.62 for PM1 in the Sichuan Basin’s urban area. The correlation coefficients between PM10, PM2.5, and WS were not significant with p > 0.05. However, there was a clear correlation between PM1 and wind speed, with p < 0.05. Kliengchuay et al. [48] recorded a negative correlation between PM and WS with a correlation coefficient value of −0.14 for PM10 in Lamphun (Thailand). The negative correlation of WS with PM is because wind disperses and transports the PM somewhere else.
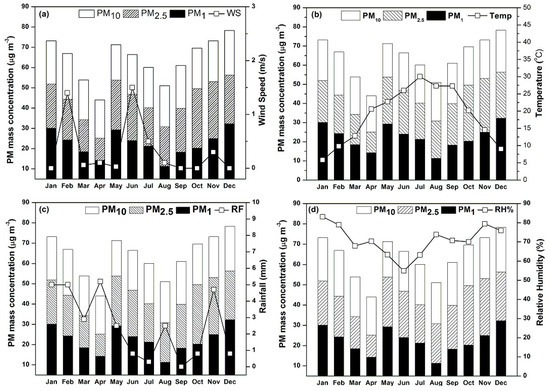
Figure 6.
Monthly mean values of wind speed (a), temperature (b), rainfall (c), and relative humidity (d) in relation to the different PM fractions.

Table 1.
Correlation coefficients (r2) between mass concentrations of PM10, PM2.5, and PM1 and average meteorological parameters (wind speed, temperature, rainfall, relative humidity).
The relationship between temperature and PM mass concentration is shown in Figure 6b. A strong negative correlation coefficient (p < 0.01) with values of −0.69 for PM10, −0.71 for PM2.5, and −0.74 for PM1 was recorded (Table 1). Intense convection is facilitated by high temperatures in Jul, Aug, and Sep, as indicated in Figure 6b. PM in the atmosphere is carried swiftly and efficiently, allowing it to disperse PM more quickly; the temperature affects the chemistry of PM, which results in the creation of secondary PM, and, resultantly, the local concentration of PM decreases [23,47,48,49].
The relationship between RF and PM mass concentration is shown in Figure 6c, which shows a negative correlation between them RF and PM. Rain has a negative impact on PM mass concentrations, indicating the occurrence of the atmospheric washout process [41,50]. As depicted in Table 1, the monthly correlation coefficient between RF and PM10, PM2.5, and PM1 were observed to be −0.63, −0.61, and −0.59, with corresponding values p < 0.05, p < 0.05, and p > 0.05, respectively, particularly in Jun, Jul, Oct, and December. Li et al. [36] noted −0.59 (PM10), −0.58 (PM2.5), and −0.57 (PM1) correlation coefficients between RF and PM. RF has a two-fold effect on PM concentration in the atmosphere. First, PM is micro-physically treated by raindrops, such as collision and adsorption, and, resultantly, wet deposition of PM occurs. Second, following the rain whether PM is already suspended in the air is remarkably decreased [25,51].
The mass concentration of PM10, PM2.5, and PM1 in association with RH is depicted in Figure 6d. The correlation coefficient of PM2.5 and PM1 with RH was found to be weak and negative (–0.1) and (–0.02), respectively, while the correlation between PM10 and RH was moderately negative with the value of –0.32. Early researchers documented that RF has a reverse effect on ultra-fine particles; this indicates that RH has different effects on coarse and fine particle concentrations [48,52]. This is the reason that RH had a moderate negative correlation (–0.32) with PM10, while PM2.5 was (–0.1) and (–0.02). RH was noted to be high throughout the study year; high RH was observed in Jan, Feb, Nov, and Dec. The correlation coefficient between RH and PM10, PM2.5, and PM1 was noted to be under –0.32. During the winter season followed by autumn, RH remained high. High PM concentration is attributed to the condition that whenever RH is high, the growth of hygroscopicity is also high and air pollution is usually at maximum under the layer of thermal inversion or when there is very little airflow [53]. Kliengchuay et al. [48] recorded a negative correlation of –0.12 between PM10 and RH in the upper north of Thailand from 2009 to 2017. Munir et al. [25] showed a correlation of RH with PM10 and PM2.5 of −0.30 and −0.17 values in Makah, Saudi Arabia.
3.4. Emission Sources
The majority of the particles were found to be carbonaceous at the study site because the collection of samples was done by the roadside. Vehicular emissions mainly contributed to carbonaceous particles. In the surroundings of the study area, it is common to burn biomass in autumn. Particles of soot were produced from the combustion of diesel, gasoline, fuel oil, and butane [54,55]. Traffic emissions were assumed to be the primary source of this pollution as no substantial industrial sources were found in the surroundings of the study area. Aluminosilicates were also found to be the highest in amount. Similarly, chloride-related particles were also found. Soil dust and re-suspended road dust were the main contributing sources of pollution [56]. Ca-rich particles are found in limestone, a mineral found in the crust, road dust, and soils and commonly used in cement production. The construction of buildings, homes, and roads releases calcium particles into the air. Ca-rich particles were revealed as a result of building constructions and the suspension of dust in the study site [57]. Biological particles were also explored in the air of the study site. The contributing sources of such particles are bacteria, viruses, fungal spores, plant debris, pollen, and animal matter. Moreover, there were several agricultural activities, trees, plants, and fields all around the sampling site.
4. Conclusions
This study looked at PM pollution in Mingora City, Swat, Pakistan, and its link to weather, which is important for improving local air quality. Higher mass concentrations (78, 56, and 32 µg m−3, respectively) of PM10, PM2.5, and PM1 were observed in December 2019, while low mass concentrations were recorded in April 2019 for PM10 (44 µg m−3) and PM2.5 (25.1 µg m−3) and for PM1 (11 µg m−3) in August 2019. The highest average mass concentrations of PM10, PM2.5, and PM1 were 1.77, 2.23, and 2.9 times higher during August, in comparison to the other months of 2019. In the winter season, there were high average mass concentrations. The investigation of the correlation between PM10, PM2.5, and PM1 indicated that the average mass concentrations correlation coefficient of PM10:PM2.5, PM10:PM1, and PM2.5:PM1 were at maximum approaching the peak values of 0.92, 0.79, and 0.75, respectively. The overall average ratios PM2.5: PM10, PM1: PM2.5, PM1: PM10 were 68.3, 52.6, and 35.4%, respectively. This is a clear indication that fine and ultrafine PM is the key pollutant to the environment of Mingora city. Average temperature and rainfall had a strong negative link with PM concentration, whereas wind speed and relative humidity had a moderate-to-weak negative correlation. These data could be used to aid future strategies targeted at lowering emissions in northern Pakistan near the glacier region. The potential sources of pollution are agricultural residue burning, organisms, coal, biomass, vehicles, and waste material incineration. Moreover, construction and demolition of buildings, dust from unpaved roads, mining, crush-plants, marble (granite) factories, and poor drainage system are sources of pollution. Thus, the mentioned sources could have hostile effects on the climate, fauna and flora, hydrological cycle, and, in particular, on glaciers situated in the Hindu-Kush range.
Author Contributions
Conceptualization, F.U., B.Z. and K.A.; Data curation, F.U., A.D., A.S., R.R., I.A. and R.I.; Formal analysis, F.U., B.Z., K.A., M.V., A.D., A.S., R.R., I.A. and R.I.; Funding acquisition, M.V.; Investigation, F.U.; Methodology, B.Z., K.A., A.D. and A.S.; Project administration, B.Z., K.A. and A.D.; Resources, K.A., M.V., A.S., R.R., I.A. and R.I.; Software, F.U., B.Z., M.V., A.D., A.S., I.A. and R.I.; Supervision, K.A.; Validation, F.U., B.Z., K.A., M.V., A.D., A.S., R.R., I.A. and R.I.; Visualization, F.U., B.Z., K.A., M.V., A.D., A.S., R.R., I.A. and R.I.; Writing—original draft, F.U.; Writing—review and editing, F.U., B.Z., K.A., M.V., A.D., A.S., R.R., I.A. and R.I. All authors have read and agreed to the published version of the manuscript.
Funding
This research received no external funding.
Institutional Review Board Statement
Not applicable.
Informed Consent Statement
Not applicable.
Data Availability Statement
Not applicable.
Acknowledgments
The authors thank the Director of the Centralized Resource Laboratory University of Peshawar for help with different analyses conducted during the present study.
Conflicts of Interest
The authors declare no conflict of interest.
References
- Tian, G.; Qiao, Z.; Xu, X. Characteristics of particulate matter (PM10) and its relationship with meteorological factors during 2001–2012 in Beijing. Environ. Pollut. 2014, 192, 266–274. [Google Scholar] [CrossRef]
- Pope, C.A., III; Burnett, R.T.; Thun, M.J.; Calle, E.E.; Krewski, D.; Ito, K.; Thurston, G.D. Lung cancer, cardiopulmonary mortality, and long-term exposure to fine particulate air pollution. JAMA 2002, 287, 1132–1141. [Google Scholar] [CrossRef] [PubMed]
- Churg, A.; Brauer, M.; del Carmen Avila-Casado, M.; Fortoul, T.I.; Wright, J.L. Chronic exposure to high levels of particulate air pollution and small airway remodeling. Environ. Health Perspect. 2003, 111, 714–718. [Google Scholar] [CrossRef]
- Rivero, D.H.; Soares, S.R.; Lorenzi-Filho, G.; Saiki, M.; Godleski, J.J.; Antonangelo, L.; Dolhnikoff, M.; Saldiva, P.H. Acute cardiopulmonary alterations induced by the fine particulate matter of Sao Paulo, Brazil. Toxicol. Sci. 2005, 85, 898–905. [Google Scholar] [CrossRef]
- Hoek, G.; Raaschou-Nielsen, O. Impact of fine particles in ambient air on lung cancer. Chin. J. Cancer 2014, 33, 197. [Google Scholar] [CrossRef]
- Chen, M.J.; Yang, P.H.; Hsieh, M.T.; Yeh, C.H.; Huang, C.H.; Yang, C.M.; Lin, G.M. Machine learning to relate PM2.5 and PM10 concentrations to outpatient visits for upper respiratory tract infections in Taiwan: A nationwide analysis. World J. Clin. 2018, 6, 200. [Google Scholar] [CrossRef] [PubMed]
- He, Y.; Gao, Z.; Guo, T.; Qu, F.; Liang, D.; Li, D.; Shi, J.; Shan, B. Fine particulate matter associated mortality burden of lung cancer in Hebei Province, China. Thorac. Cancer 2018, 9, 820–826. [Google Scholar] [CrossRef] [PubMed]
- Huang, F.; Zhao, Y.; Wang, P.; Wang, Y.; Zhang, L.; Luo, Y. Short-term exposure to particulate matter on heart rate variability in humans: A systematic review of crossover and controlled studies. Environ. Sci. Pollut. Res. 2021, 28, 35528–35536. [Google Scholar] [CrossRef]
- Choi, E.; Yi, S.M.; Lee, Y.S.; Jo, H.; Baek, S.O.; Heo, J.B. Sources of airborne particulate matter-bound metals and spatial-seasonal variability of health risk potentials in four large cities, South Korea. Environ. Sci. Pollut. Res. 2022, 29, 28359–28374. [Google Scholar] [CrossRef] [PubMed]
- Villanueva, F.; Tapia, A.; Cabañas, B.; Martínez, E.; Albaladejo, J. Characterization of particulate polycyclic aromatic hydrocarbons in an urban atmosphere of central-southern Spain. Environ. Sci. Pollut. Res. 2015, 22, 18814–18823. [Google Scholar] [CrossRef]
- Zeb, B.; Alam, K.; Ditta, A.; Ullah, S.; Ali, H.M.; Ibrahim, M.; Salem, M.Z.M. Variation in coarse particulate matter (PM10) and its characterization at multi-locations in the semiarid region. Front. Environ. Sci. 2022, 10, 843582. [Google Scholar] [CrossRef]
- Vautard, R.; Builtjes, P.H.; Thunis, P.; Cuvelier, C.; Bedogni, M.; Bessagnet, B.; Honore, C.; Moussiopoulos, N.; Pirovano, G.; Schaap, M.; et al. Evaluation and intercomparison of Ozone and PM10 simulations by several chemistry-transport models over four European cities within the City Delta project. Atmos. Environ. 2007, 41, 173–188. [Google Scholar] [CrossRef]
- Saliba, N.A.; El Jam, F.; El Tayar, G.; Obeid, W.; Roumie, M. Origin and variability of particulate matter (PM10 and PM2.5) mass concentrations over an Eastern Mediterranean city. Atmos. Res. 2010, 97, 106–114. [Google Scholar] [CrossRef]
- Kong, H.K.; Yoon, D.K.; Lee, H.W.; Lee, C.M. Evaluation of particulate matter concentrations according to cooking activity in a residential environment. Environ. Sci. Pollut. Res. 2021, 28, 2443–2456. [Google Scholar] [CrossRef]
- Katsouyanni, K.; Toulomi, G.; Samoli, G.; Gryparis, A.; LeTertre, A.; Monopolis, Y. Confounding and effect modification in the short-term effects of ambient particles on total mortality: Results from 29 European cities within the APAEA2 project. Epidemiology 2001, 12, 521–533. [Google Scholar] [CrossRef]
- Dockery, D.W.; Pope, C.A., III; Xu, X.; Spengler, J.D.; Ware, J.H.; Martha, E.F.; Ferris, B.G.; Dominici, F.; McDermott, A.; Daniels, M.; et al. Revised analyses of the national morbidity, mortality and air pollution study: Mortality among residents of 90 cities. J. Toxicol. Environ. Health Part A 2005, 68, 1071–1092. [Google Scholar]
- Lim, J.M.; Lee, J.H.; Moon, J.H.; Chung, Y.S.; Kim, K.H. Source apportionment of PM10 at a small industrial area using positive matrix factorization. Atmos. Res. 2010, 95, 88–100. [Google Scholar] [CrossRef]
- Makkonen, U.; Hellén, H.; Anttila, P.; Ferm, M. Size distribution and chemical composition of airborne particles in south-eastern Finland during different seasons and wildfire episodes in 2006. Sci. Total Environ. 2010, 408, 644–651. [Google Scholar] [CrossRef] [PubMed]
- Camargo Pires-Neto, R.; Julia Lichtenfels, A.; Regina Soares, S.; Macchione, M.; Hilario Nascimento Saldiva, P.; Dolhnikoff, M. Effects of Sao Paulo air pollution on the upper airways of mice. Environ. Res. 2006, 101, 356–361. [Google Scholar] [CrossRef]
- Cendon, S.; Pereira, L.A.; Braga, A.L.; Conceição, G.; Cury Junior, A.; Romaldini, H.; Lopes, A.C.; Saldiva, P.H. Air pollution effects on myocardial infarction. Rev. Saude Publica 2006, 40, 414–419. [Google Scholar] [CrossRef]
- Furuta, N.; Lijima, A.; Kambe, A.; Sakai, K.; Sato, K. Concentrations enrichment and predominant sources of Sb and other trace elements in size classified airborne particulate matter collected in Tokyo from 1995 to 2004. J. Environ. Monit. 2005, 7, 1155–1161. [Google Scholar] [CrossRef]
- Tiwari, S.; Bisht, D.S.; Srivastava, A.K.; Pipal, A.S.; Taneja, A.; Srivastava, M.K.; Attri, S.D. Variability in atmospheric particulates and meteorological effects on their mass concentrations over Delhi, India. Atmos. Res. 2014, 145, 45–56. [Google Scholar] [CrossRef]
- Munir, S.; Habeebullah, T.M.; Seroji, A.R.; Morsy, E.A.; Mohammed, A.M.F.; Saud, W.A.; Esawee, A.L.; Awad, A.H. Modeling particulate matter concentrations in Makkah, applying a statistical modeling approach. Aerosol Air Qual. Res. 2013, 13, 901–910. [Google Scholar] [CrossRef]
- Khodeir, M.; Shamy, M.; Alghamdi, M.; Zhong, M.; Sun, H.; Costa, M.; Chen, L.C.; Maciejcczyk, P.M. Source apportionment and elemental composition of PM2.5 and PM10 in Jeddah City, Saudi Arabia. Atmos. Pollut. Res. 2012, 3, 331–340. [Google Scholar] [CrossRef] [PubMed]
- Munir, S.; Habeebullah, T.M.; Mohammed, A.M.; Morsy, E.A.; Rehan, M.; Ali, K. Analyzing PM2.5 and its association with PM10 and meteorology in the arid climate of Makkah, Saudi Arabia. Aerosol Air Qual. Res. 2017, 17, 453–464. [Google Scholar] [CrossRef]
- Hien, P.D.; Bac, V.T.; Tham, H.C.; Nhan, D.D.; Vinh, L.D. Influence of meteorological conditions on PM2.5 and PM2.5−10 concentrations during the monsoon season in Hanoi, Vietnam. Atmos. Environ. 2002, 36, 3473–3484. [Google Scholar] [CrossRef]
- Laakso, L.; Hussein, T.; Aarnio, P.; Komppula, M.; Hiltunen, V.; Viisanen, Y.; Kulmala, M. Diurnal and annual characteristics of particle mass and number concentrations in urban, rural and Arctic environments in Finland. Atmos. Environ. 2003, 37, 2629–2641. [Google Scholar] [CrossRef]
- Querol, X.; Alastuey, A.; Viana, M.M.; Rodriguez, S.; Artíñano, B.; Salvador, P.; Do Santos, S.G.; Patier, R.F.; Ruiz, C.R.; De la Rosa, J.; et al. Speciation and origin of PM10 and PM2.5 in Spain. Aerosol Sci. 2004, 35, 1151–1172. [Google Scholar] [CrossRef]
- Elminir, H.K. Dependence of urban air pollutants on meteorology. Sci. Total Environ. 2005, 350, 225–237. [Google Scholar] [CrossRef]
- Yang, L.X.; Wang, D.C.; Cheng, S.H.; Wang, Z.; Zhou, Y.; Zhou, X.H.; Wang, W.X. Influence of meteorological conditions and particulate matter on visual range impairment in Jinan, China. Sci. Total Environ. 2007, 383, 164–173. [Google Scholar] [CrossRef]
- Hogrefe, C.; Porter, P.S.; Gego, E.; Gilliland, A.; Gilliam, R.; Swall, J.; Irwin, J.; Rao, S.T. Temporal features in observed and simulated meteorology and air quality over the Eastern United States. Atmos. Environ. 2006, 40, 5041–5055. [Google Scholar] [CrossRef]
- Yadav, S.K.; Jain, M.K. Variation in concentrations of particulate matter with various sizes in different weather conditions in mining zone. Int. J. Environ. Sci. Technol. 2020, 17, 695–708. [Google Scholar] [CrossRef]
- Bibi, S.; Alam, K.; Chishtie, F.; Bibi, H.; Rahman, S. Temporal variation of Black Carbon concentration using Aethalometer observations and its relationships with meteorological variables in Karachi, Pakistan. J. Atmos. Sol. Terr. Phys. 2017, 157, 67–77. [Google Scholar] [CrossRef]
- Järvi, L.; Junninen, H.; Karppinen, A.; Hillamo, R.; Virkkula, A.; Mäkelä, T.; Pakkanen, T.; Kulmala, M. Temporal variations in black carbon concentrations with different time scales in Helsinki during 1996–2005. Atmos. Chem. Phys. 2008, 8, 1017–1027. [Google Scholar] [CrossRef]
- WHO. WHO Global Air Quality Guidelines: Particulate Matter (PM2.5 and PM10), Ozone, Nitrogen Dioxide, Sulfur Dioxide and Carbon Monoxide: Executive Summary 2021; WHO: Geneva, Switzerland, 2021. [Google Scholar]
- Li, Y.; Chen, Q.; Zhao, H.; Wang, L.; Tao, R. Variations in PM10, PM2.5, and PM1 in an urban area of the Sichuan Basin and their relation to meteorological factors. Atmosphere 2015, 6, 150–163. [Google Scholar] [CrossRef]
- Srimuruganandam, B.; Nagendra, S.M.S. Analysis and interpretation of particulate matter–PM10, PM2.5, and PM1 emissions from the heterogeneous traffic near an urban roadway. Atmos. Pollut. Res. 2010, 1, 184–194. [Google Scholar] [CrossRef]
- Chen, B.H.; Li, Y.Q. Relationships between air particle and meteorological elements in Chengdu. Urban Environ. Urban Ecol. 2006, 19, 18–20. [Google Scholar]
- Tao, J.; Zhang, L.; Engling, G.; Zhang, R.; Yang, Y.; Cao, J.; Zhu, C.; Wang, Q.; Luo, L. Chemical composition of PM2.5 in an urban environment in Chengdu, China: Importance of springtime dust storms and biomass burning. Atmos. Res. 2013, 122, 270–283. [Google Scholar] [CrossRef]
- Hu, M.; Liu, S.; Wu, Z.J. Effects of high temperature, high relative humidity and rain process on particle size distributions in the summer of Beijing. Environ. Sci. 2006, 27, 2293–2298. [Google Scholar]
- Tecer, L.H.; Süren, P.; Alagha, O.; Karaca, F.; Tuncel, G. Effect of meteorological parameters on fine and coarse particulate matter mass concentration in a coal-mining area in Zonguldak, Turkey. J. Air Waste Manag. Assoc. 2008, 58, 543–552. [Google Scholar] [CrossRef]
- Trinh, T.T.; Trinh, T.T.; Le, T.T.; Tu, B.M. Temperature inversion and air pollution relationship, and its effects on human health in Hanoi City, Vietnam. Environ. Geochem. Health 2019, 41, 929–937. [Google Scholar] [CrossRef] [PubMed]
- Deng, L.; Qian, J.; Liao, R.; Tong, H. Pollution characteristics of atmospheric particulates in Chengdu from August to September in 2009 and their relationship with meteorological conditions. China Environ. Sci. 2012, 32, 1433–1438. [Google Scholar]
- Zhao, H.; Che, H.; Ma, Y.; Xia, X.; Wang, Y.; Wang, P.; Wu, X. Temporal variability of the visibility, particulate matter mass concentration, and aerosol optical properties over an urban site in Northeast China. Atmos. Res. 2015, 166, 204–212. [Google Scholar] [CrossRef]
- Galindo, N.; Varea, M.; Gil-Moltó, J.; Yubero, E.; Nicolás, J. The influence of meteorology on particulate matter concentrations at an urban Mediterranean location. Water Air Soil Pollut. 2011, 215, 365–372. [Google Scholar] [CrossRef]
- Pateraki, S.; Asimakopoulos, D.N.; Flocas, H.A.; Maggos, T.; Vasilakos, C. The role of meteorology on different sized aerosol fractions (PM10, PM2.5, PM2.5–10). Sci. Total Environ. 2012, 419, 124–135. [Google Scholar] [CrossRef]
- Andersson, C.; Langner, J.; Bergstrom, R. Interannual variation and trends in air pollution over Europe due to climate variability during 1958–2001 simulated with a regional CTM coupled to the ERA40 reanalysis. Tellus. B Chem. Phys. Meteorol. 2006, 59, 77–98. [Google Scholar] [CrossRef]
- Kliengchuay, W.; Worakhunpiset, S.; Limpanont, Y.; Meeyai, A.C.; Tantrakarnapa, K. Influence of the meteorological conditions and some pollutants on PM10 concentrations in Lamphun, Thailand. J. Environ. Health Sci. Eng. 2021, 19, 237–249. [Google Scholar] [CrossRef] [PubMed]
- Lin, J.; Liu, W.; Yan, I. Relationship between meteorological conditions and particle size distribution of atmospheric aerosols. J. Meteorol. Environ. 2009, 25, 1–5. [Google Scholar]
- Larssen, S.; Barrett, K.; Adams, A.; Van het Bolscher, M.; de Leeuw, F.; Pulles, T.; van Loon, M.; van Pul, A. Air Pollution in Europe 1997–2004; Chemical Coordinating Centre of the European Monitoring and Evaluation Programme: Copenhagen, Denmark, 2007; p. 70. [Google Scholar]
- Shen, Z.Y.; Lu, B.; Chen, H.B. Effects of meteorology condition in precipitation on aerosol concentration in Zhengzhou. Meteorol. Environ. Sci. 2009, 32, 55–58. [Google Scholar]
- Charron, A.; Harrison, R.M. Primary particle formation from vehicle emissions during exhaust dilution in the roadside atmosphere. Atmos. Environ. 2003, 37, 4109–4119. [Google Scholar] [CrossRef]
- Caiyun, M.; Yueqing, T.; Yao, F. Effect analysis of meteorological factors on the inhalable particle matter concentration of atmosphere in Hami. Meteorol. Environ. Sci. 2011, 34, 75–79. [Google Scholar]
- Usman, F.; Zeb, B.; Alam, K.; Huang, Z.; Shah, A.; Ahmad, I.; Ullah, S. In-depth analysis of physicochemical properties of particulate matter (PM10, PM2.5 and PM1) and its characterization through FTIR, XRD and SEM–EDX Techniques in the Foothills of the Hindu Kush Region of Northern Pakistan. Atmosphere 2022, 13, 124. [Google Scholar] [CrossRef]
- Zeb, B.; Alam, K.; Sorooshian, A.; Blaschke, T.; Ahmad, I.; Shahid, I. On the morphology and composition of particulate matter in an urban environment. Aerosol Air Qual. Res. 2018, 18, 1431. [Google Scholar]
- Gugamsetty, B.; Wei, H.; Liu, C.N.; Awasthi, A.; Hsu, S.C.; Tsai, C.J.; Roam, G.D.; Wu, Y.C.; Chen, C.F. Source characterization and apportionment of PM10, PM2.5 and PM0.1 by using positive matrix factorization. Aerosol Air Qual. Res. 2012, 12, 476–491. [Google Scholar] [CrossRef]
- Lough, G.C.; Schauer, J.J.; Park, J.S.; Shafer, M.M.; Deminter, J.T.; Weinstein, J.P. Emissions of Metals associated with motor vehicle roadways. Environ. Sci. Technol. 2005, 39, 826–836. [Google Scholar] [CrossRef] [PubMed]
Publisher’s Note: MDPI stays neutral with regard to jurisdictional claims in published maps and institutional affiliations. |
© 2022 by the authors. Licensee MDPI, Basel, Switzerland. This article is an open access article distributed under the terms and conditions of the Creative Commons Attribution (CC BY) license (https://creativecommons.org/licenses/by/4.0/).