Article

An Estimation of Precipitation Retention Time Using Depth Metres in the Northern Basin of Lake Biwa

1
Department of Civil Engineering and Architecture, Maizuru College, National Institute of Technology (NIT), 234 Shiroya, Maizuru, Kyoto 625-8511, Japan
2
Lake Biwa Museum, Research Division, Kusatsu 525-0001, Japan
3
Lake Biwa Environmental Research Institute, Comprehensive Analysis Division, Otsu 520-0022, Japan
4
School of Environmental Science, The University of Shiga Prefecture, Hikone 522-8533, Japan
*
Author to whom correspondence should be addressed.
Atmosphere 2022, 13(5), 724; https://doi.org/10.3390/atmos13050724
Submission received: 23 March 2022 / Revised: 27 April 2022 / Accepted: 29 April 2022 / Published: 1 May 2022
(This article belongs to the Special Issue The Water Cycle and Climate Change)

Abstract

:
To facilitate climate change adaptations and water management, estimates of precipitation retention time (time required for precipitation to reach a lake) can help to accurately determine a water body’s terrestrial water storage capacity and water cycle. Although estimating the precipitation retention time on land is difficult, estimating the lag between precipitation on land and a rise in lake water levels is possible. In this study, the delay times (using a depth metre installed in the mooring system in the northern basin of Lake Biwa from August 2017 to October 2018) were calculated using response functions, and it evaluated the precipitation retention time in the catchment. However, as several delays between the river surface flow (<1 d) and shallow subsurface flow (≈45 d) remained unidentified, the delay times resulting from direct precipitation on the lake as well as from internal seiches were determined. The results suggest that delay times of approximately 20 d correspond to the paddy–waterway system between the river inflow and the subsurface flow, and that this effect corresponds to that of large rivers such as the Ane River. These findings can enhance water management strategies regarding the regulation of river flows, adapting to climate change-induced fluctuations in precipitation.

1. Introduction

Climate change is expected to accelerate the water cycle [1] and directly and indirectly affect watershed dynamics, nutrient loads, thermal structures, salinity regimes, pollutant dynamics, methane emission, sedimentation processes, and inland aquatic ecosystems [2,3]. With respect to terrestrial water storage, it is important to identify the precipitation retention time (residence time), which refers to the time required for precipitation to reach a lake via a river. It is difficult to determine the delay time of inflow from rivers to the sea; however, it is possible to determine the delay time for precipitation falling on land to reach lakes, which have a controlled outflow, using response functions [4,5,6]. Estimation of response using the response function or modelling has been successfully applied to rivers and groundwater in hydrology [7,8,9,10]. Iwaki et al., 2020 applied the concept of response function to a lake and its catchments—which flow into more than 450 rivers—estimated the delay times for each river, and discussed the factors and the processes influencing the delay times [6,11]. Water takes a long time to flow from a river to the catchments, but this method is useful in estimating the delay times of river water, and it could help in estimating the flow delay from estuaries to the sea. The shape of the response function reflects the lake system itself, and identifying this shape can be used to analyse the water cycle. If the effect of response to water level can be determined, then the following can be determined: (i) the precipitation retention time at the surface (above the impermeable layer) of a catchment area and (ii) the time required for precipitation to reach a lake. This could ensure appropriate management of the lake and help to understand the water cycle. Climate-adaptive water level management will help to protect valuable habitats based on the knowledge of the dynamic–response relationships between precipitation and water level changes.
Lake water levels are balanced by short-term events such as direct precipitation, seiches, river inflow caused by precipitation in the catchment area and subsurface flow, evaporation (both at the lake surface and in the catchment area), and groundwater inflow and outflow [12]. Each factor controlling the water level of a lake has unique temporal and spatial scales. To understand complex lake level changes, spectral analysis should be performed. This analysis is based on waves that can be separated into several periods, and the periods can be determined when these processes are dominant. The present study area, Lake Biwa, is a large, deep subtropical lake in central Japan. The outflow of Lake Biwa is controlled by underflow gates that are managed according to operational regulations for water supply and hydropower—ensuring water level maintenance that is conducive to fish breeding—but it is ultimately based on determining floods that can be prevented. Seasonal changes in lake water levels are important for the ecosystem in the littoral zone and spawning habitats of endemic fish species [13,14,15].
The dynamics of water levels in Lake Biwa are complex because of its large area (surface area of 670.25 km2) and complex catchment characteristics. The frequency analysis of some timescales may be an effective analytical approach in understanding the response of water levels to climate. Factors directly affecting the changes in the water level include wind and waves (seconds to minutes), seiches (minutes to hours), precipitation (direct to months), river outflow (minutes to days), evaporation (direct to months), groundwater flux (days to years), and other factors such as direct water extraction. Over a short timescale of several days, heavy precipitation has the strongest effect on water level changes [16]. Precipitation on a lake surface directly contributes to water level changes, whereas it can take a long time for precipitation in a catchment area to have a discernible effect (e.g., months via the subsurface and years via groundwater) [6,9,10].
For several years, estimating the precipitation retention time has been difficult owing to its complexity [4]. Here, the delay times using the response function were calculated and each factor of concern was identified based on fluctuations in lake water levels, including, direct precipitation, surface seiches, river inflow, (quick and slow) return flow, internal seiches, and subsurface flow. Direct precipitation on the lake has the most rapid effect on the lake water level [6,16]. Previously, the effects of direct precipitation on lakes had been estimated based on the water temperature [17,18]. However, water level fluctuations occur from direct precipitation on lakes and from river inflows caused by precipitation in a catchment as well as seiches in lakes. These complex fluctuations are rarely discussed because of the difficulty in identifying all factors. Therefore, an attempt was made to identify the delay time of the paddy–waterway system. The results of this study will assist in developing management strategies to respond to climate change in lake catchment systems. The proposed method can be used to evaluate the effects of rivers on the lake, and the results will help to clarify lake metabolism and inform lake management.

2. Materials and Methods

2.1. Study Site and Measurement of the Lake Water Level

The study site is located to the northeast of Lake Biwa (Takeshima-oki, Figure 1). Lake Biwa is the largest freshwater resource in Japan, with a surface area of 670.25 km2 and a maximum depth of 104.1 m [19,20]. The combined water and land surface area of the catchment (area: 3174 km2) is 3848 km2. Approximately one-third of this area is a plain with an elevation of <200 m, that is, <120 m above the lake surface (Figure 1). The area northeast of Lake Biwa is bound by Mt. Ibuki, with an elevation of >800 m. The lake can be divided into two basins (Figure 1): (i) The northern basin, which is wide and deep, and (ii) the southern basin, which is narrower and considerably shallower. The surface area and the mean water depth of the northern basin are 618.65 km2 and 43 m, respectively, whereas those of the southern basin are 51.60 km2 and 4 m, respectively [21]. The catchment area of Lake Biwa is located along the boundary region between the Sea of Japan (which experiences heavy precipitation in winter) and the Pacific Ocean climactic zones (which experience a small amount of precipitation in winter); and, thus is subjected to substantial annual weather fluctuations. More than 450 rivers and streams flow directly into the lake, but there is just one natural outlet: the Seta River. The discharge of the Seta River is controlled by the opening and the closing of multiple weirs. Its outflow is finely recorded; thus, it can be used to estimate the delay time via the response function.
A mooring system (Figure 2) was installed in the northern basin of Lake Biwa and operated from July 2017 to September 2018. A depth metre (COMPACT-TD water temperature and depth metre, JFE Advantech) was installed near the surface (5 and 10 m) of the lake. The sampling interval of the depth metre was 10 min, and the sampling period was from 22 August 2017 to 20 May 2018. The statistical characteristics of the input data are shown in Table A1. The water level metre at depths of 5 and 10 m had a resolution of 1 mm and an accuracy of ±1 cm.

2.2. Acquisition of Additional Data

Additional data are shown in Table 1. Precipitation data were obtained from the Japan Meteorological Agency (JMA). The sampling interval of the data logger, Δt, at the six precipitation observation points was 10 min (Figure 1). In addition, to confirm the observed water level data (Appendix B), water level data provided by Kinki Regional Development Bureau, Biwako Office in the Ministry of Land, Infrastructure, Transport, and Tourism (MLIT) were used.
Discharge data of four outlets from Lake Biwa were available. The total discharge data from the Seta River (10 min interval) were provided by the MLIT. The discharge data through the two canals and the channel of the hydropower station were provided by the Waterworks Bureau, City of Kyoto, and Kansai Electric Power Corporation, respectively. The volume of water discharged from Lake Biwa through the Seta River is controlled by the opening and the closing of multiple weirs, which stabilises the discharge to a relatively fixed rate. When the discharge change is excessive, especially after heavy precipitation, the discharge can be increased. Various changes in the outflow amounts were achieved via weir operation. These changes were made over several hours to avoid an abrupt change within the range of 20–700 m3 s−1, which were incorporated into the calculation of water levels.
For flood-control purposes, the lower limit of the water level of Lake Biwa was set to −0.2 m from 16 June to 31 August and −0.3 m from 1 September to 15 October annually. When the water level increased above 0.3 m, the water level was decreased. The water levels from March to June and June to September were controlled between +0.3 m and −0.3 m, respectively, to support the spawning and the hatching seasons of spring-breeding fish and the use of water for agricultural activities. From September to December, the water level was adjusted only slightly. The impact of precipitation on the water level of Lake Biwa was reduced by artificially increasing the runoff.

2.3. Response Function

A method to calculate delay times that is based on the use of the response function was established (Figure A2). In the calculation of the response function, x(t) signifies the precipitation at a certain location representative of the lake’s watershed and y(t) indicates the lake level; both x(t) and y(t) are functions of time. It was assumed that y(t) could be described as a function of the integral of x(t) (t ≤ 0). More specifically, y(t) is the sum of the product of past precipitation, x(t − τ), multiplied by the impulse response function h(τ). Thus,
y ( t ) = 0 + x ( t τ ) h ( τ ) d τ ,
where τ is the time lag. Because h(τ) represents the correlation between x(t) and y(t), it reflects the process based on which precipitation affects the lake level [4,6,11]. In this study, h(τ) was determined using Equation (1).
Therefore, the key information needed for the response function included the timing of the precipitation events (impulse) and the height and the timing of the water level changes (response). The correlations of the input and the output as well as the autocorrelation of the input were calculated. Then, a fast Fourier transform (FFT) was conducted, and the results were converted to the frequency domain. The cross-correlation function, Cxy(τ), was divided by the autocorrelation function, Cxx(τ), and then a reverse Fourier transform was performed to return to the time domain and to identify the parameters of the response function [6,22].

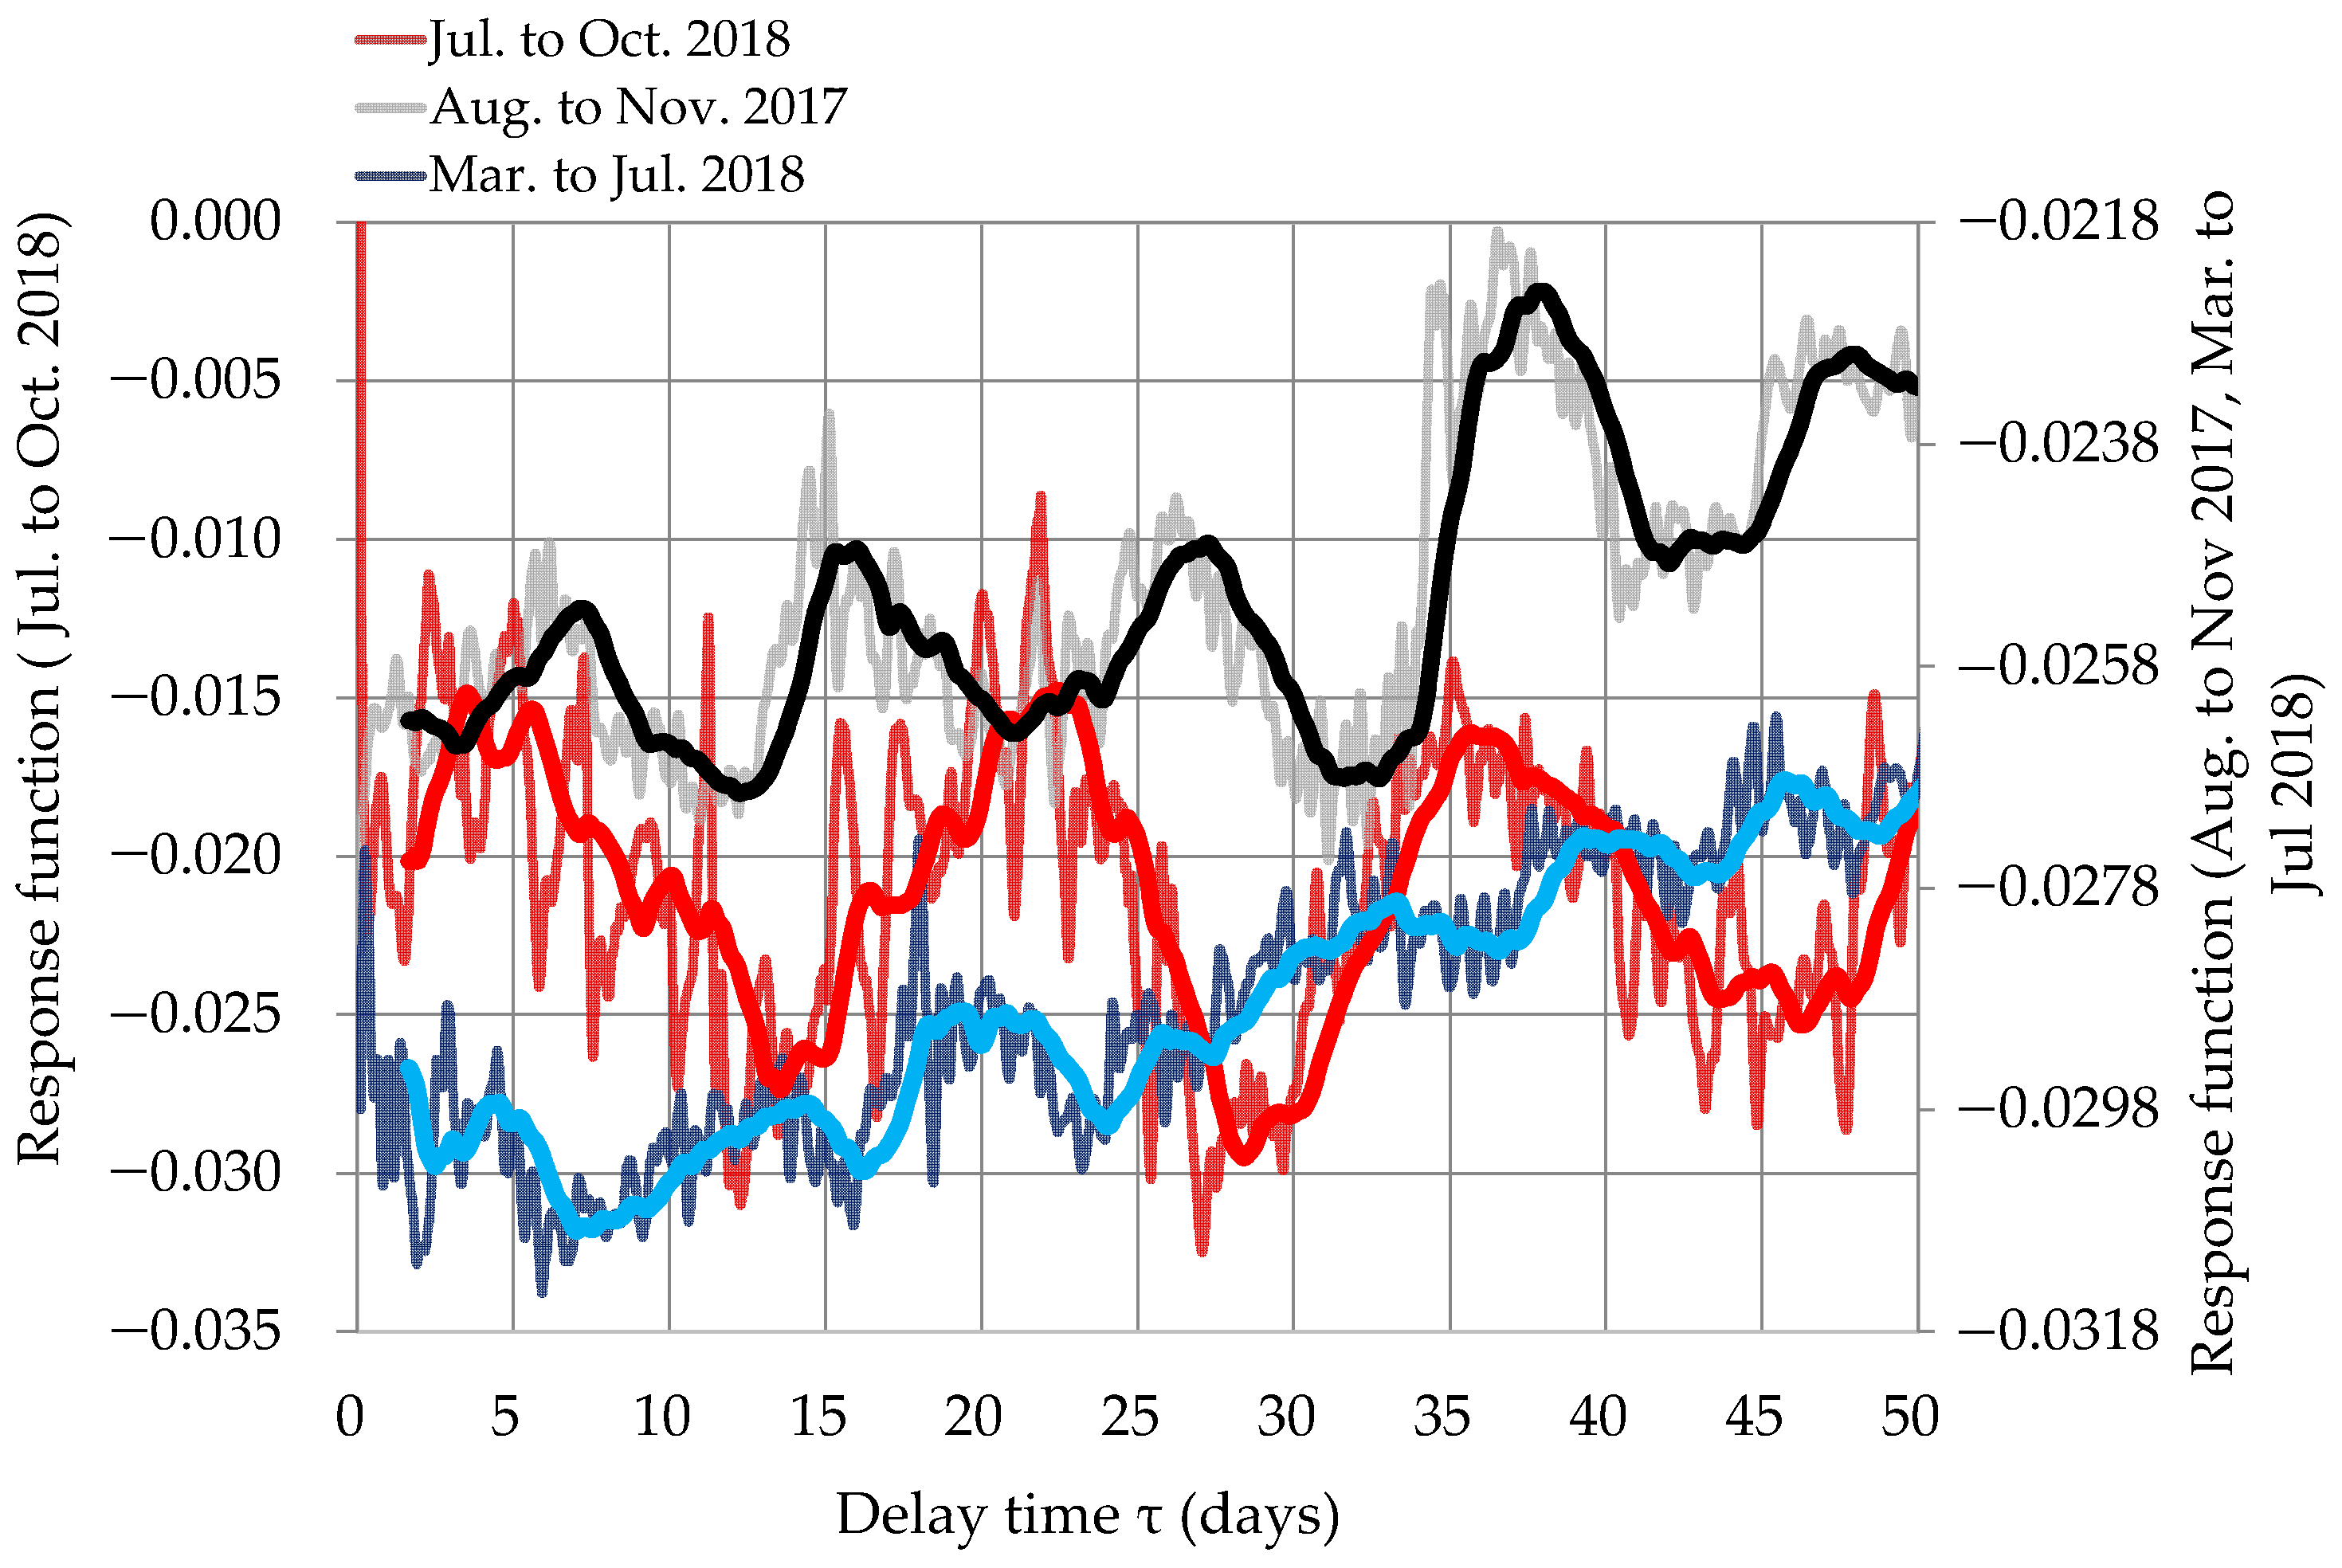
3. Results and Discussion

In this section, the effect of direct precipitation on the lake is described. Thereafter, the inherent lake oscillation is described, specifically, seasonal internal seiches. Finally, the delay times resulting from paddy–waterway systems in which the peak delay times (around 20 d) were slower than the rapid surface inflow from the river (1–3 d), but faster than the subsurface flow through the plain area, have been described (averaging 45 d).

3.1. Delay Times Due to Direct Precipitation on the Lake

The calculated delay times using response functions—within 48 h—for average precipitation for both 5- and 10-m depths are shown in Figure 3. The delay times were caused by a direct precipitation on the lake, surface seiches, and river inflow. Based on the calculated delay times for the lake, it was found that the response resulting from direct precipitation on the lake had a delay time of 0.3–0.5 d (Figure 3). Although the response of direct precipitation on the lake was strong and positive, the response was for a short period. The second peaks at approximately 4.2–4.5 h corresponded to the first mode of surface seiche. The peak at approximately 7.7 h was from the surface river inflow from a river length of approximately 20 km, the peak near 16 h was formed by surface river inflows of approximately 40–50 km from the northern basin of Lake Biwa, and the peak near 24 h was identified as river inflow from the Yasu River (south Basin)—the largest and the longest river in the Lake Biwa catchment. The delay time of the Yasu River was estimated to be approximately 24 h based on a previous study of the river inflow [6]. As a statistical analysis, only two-sided t-tests with correspondence on the peaks of the response functions in summer were conducted (Appendix D, Table A2a; none of the values were significant); and, therefore, the peaks were treated independently. In the rapid response, the 5- and 10-m responses were similar, and the trends in the water-depth fluctuations at 10-min intervals were determined. The 10-m depth was chosen because the wind effect was estimated to be less at 10 m than at 5 m. Although the effect of the wire of inclination must be considered, it was almost vertical, and in this instance, it could be ignored because of the similarity in the 5- and 10-m changes.

3.2. Inherent Oscillation of the Lake Internal Seiches

Generally, internal seiches are induced by strong winds. In this study, the period in which internal seiches were induced was identified using the response function for precipitation to the lake water level in the northern basin of Lake Biwa. The results showed that the internal seiches correlate with the change in lake water level. Similar to the findings of previous research, the periodic change of 56 h corresponds to the longitudinal internal seiche of the northern basin of Lake Biwa, which was caused by the northerly component of the wind that blew over the lake during an internal period of approximately 24 h; the period of internal seiches in Lake Biwa was 66.7 h [23,24,25]. Figure 4 shows the response functions with respect to average precipitation from 24 June to 17 July 2018, indicating 30 h < τ < 100 h. Additionally, from Figure 4, the delay times of 55 h (≈2.3 d) or 68–71 h (2.8–3 d) from July to October 2018 (internal seiches were observed during the thermocline, and it was estimated that this period could be observed until August or September) correspond to the internal seiches. Two-sided t-tests with correspondence on the peaks of the response functions in summer were conducted (Appendix D, Table A2b; none of the values were significant); and, therefore, the peaks were treated independently.

3.3. Paddy–Waterway System

The calculated water-level response functions with respect to average precipitation in summer from August 2017 to October 2018 showed τ < 50 d (Figure 5). The bold line represents a running mean for approximately 45 d. The peaks in the dotted ellipse are the delay times of a paddy–water way system. Herein, four reasons for the paddy–waterway delay time to be approximately 20 d are provided. Two-sided t-tests with correspondence on the peaks of the response functions in summer were conducted (Appendix D, Table A2c; none of the values were significant); and, therefore, the peaks were treated independently.
(i)
Runoff process
A total of 25 lagoons and vast paddy fields are distributed in the study region around Lake Biwa. Therefore, many agricultural systems connect waterways in this region (Appendix E). The surface outflow water of the rivers following precipitation enters the lake after the water that enters the paddy fields and lagoons has left the river system. Paddy fields around Lake Biwa contain agricultural canals that allow water to flow out smoothly. This indicates the possibility of addressing this issue through shallow intermediate runoff. When precipitation in the vast paddy areas near the shores of the lake enters the canals through the paddy fields or lagoons, it tends to flow out after briefly pooling in the paddy fields or lagoons, then it flows through the paddy–waterway systems and runs off. Thus, the delay time required for rainwater to flow through this paddy-related route is shorter than the time estimated for groundwater and longer than the surface river outflow. In other words, after infiltration, water tends to enter the channel as shallow intermediate flow rather than entering the groundwater flow path. When it rains heavily, water from the main river flows into the connected waterways, and the network prevents the main river from overflowing. The water from the waterway is slower in movement and lower in quantity than that from the river; however, it is faster than the subsurface flow, as works water conveys. It was found that the outflows from the paddy–waterway system appear as independent signals from the water-level fluctuations in the lake.
(ii)
Delay times compared with river inflow (slow return flow; delay times are cited from Iwaki et al., 2020 [6])
Among the responses that depend on the river length and basin size, 14–15 d is the delay time of the Ane River mainstream (16 d) and approximately 26 d is the delay time of the large rivers in the northern part of the lake (24.5 d for the Hino River, 28 d for the Takatoki River, and 31.5 d for the Ado River). However, a peak of 17.5–22.8 d can be observed in all periods, and only one river corresponds to this lag time (16 d in the mainstream of the Ane River, 20 d in the Echi River, and 24.5 d in the Hino River).
(iii)
Comparison with seasonal changes
These delay times were compared with those of Iwaki et al. (2021) [6]. The delay times were calculated using response functions for each season from 30-years’ data of Lake Biwa water levels and precipitation [6]. The main agricultural season (rice fields) lasts from April to September. The peak of 17.5–22.8 d was observed at the median value (not the average) of the response relationship between precipitation and the water quantity, except in June (the rainy season). March (the snowmelt season) and April–May (the rice-planting season) were clear, and July–September (growth and harvesting) were also confirmed [6]. Therefore, a peak delay time of around 20 d for the paddy–waterway system was estimated.
(iv)
Delay times did not change after a mega typhoon
In addition, because a mega typhoon affected this region in July 2018, Lake Biwa was severely damaged; this included an extreme change in water level and a massive loss of submerged macrophytes [26,27]. Accordingly, the timing of the delay-time peak varied annually. However, some peaks (such as the peaks of the delay times corresponding to 20 and 22 d between 2017 and 2018) remained consistent even after the mega typhoon; for this reason, these responses (the peak of the delay time of around 20 d) were considered characteristic of the paddy–waterway system. Moreover, the delay times from the paddy–waterway system, which are considered heavily influenced by human activities, may be less affected by mega typhoons and extreme weather events than other surface river inflows or subsurface flows.
Therefore, the peak of the response function of approximately 20 d is reflected in the delay time calculated from the response function, and it is necessary to consider this paddy–waterway system process as an integral part of the lake system (Figure A3). The rice paddy field response, differentiation from the inner lake, and accurate process estimations are issues that must be considered in future studies because they may affect the ploughing and the irrigation of fields and the outflow of agricultural chemicals.
Finally, the validity of the calculations and the considerations was examined. The water cycle in Lake Biwa and its catchment area are summarised in Figure A3. From this figure (data for 1980 and 1982), the ratio of the paddy–waterway system to the river flow and groundwater flow rate was examined. When return irrigation was not considered, the ratios were 13–16% for river flow and 25–29% for the groundwater flow rate. In contrast, when return irrigation (3 × 100 million m3y−1) was considered, the minimum and the maximum values were 5–6% and 20–25%, respectively, of the river flow. Moreover, the minimum and the maximum values for groundwater flow were 10–12% and 40–47%, respectively.
Compared to the strength of the response function in Figure 5, the intensity of the response of the paddy–waterway system around 20-d peaks at approximately the same intensity as the delay time of the Ane River at 16 d (16 d was cited from Iwaki et al., 2020 [6]). The average flow of the Ane River (estuary) during 1997–2013 was 16.55 m3s−1; hence, the average flow of the Ane River was 5.2 million m3y−1 [28]. Therefore, the flow rate of the paddy–waterway system is approximately the same as that of the Ane River, and the strength of the response in Figure 5 is approximately the same as that of the Ane River. Hence, the calculation results and the discussion based on them are reasonable.

3.4. Neglected Factors

To determine the precipitation retention time on the surface of the catchment area, the calculations were simplified and the changes in several factors were neglected (Figure A3). In humid areas, the changes in the lake surface area were small, the seepage of deep groundwater into the lake was considerably slow, and the ratio of evaporation to outflow in Lake Biwa was estimated to be approximately 2% [29,30]. The variation in evaporation was detected using an FFT because the data had a clear periodicity. In contrast to that in arid areas, the water level of Lake Biwa insignificantly changes with the daily evaporation [29,30]. Therefore, factors that cause changes in the deep groundwater recharge and evaporation of water from the lake surface were excluded from our calculations; their effects were not considered because of the above-mentioned factors. In the future, for more precise estimates of water balance, longer delay times, and deeper ground water responses should be considered using models with statistical analyses [9,10].

4. Conclusions

To facilitate adaptations to climate change and water management, it is necessary to understand the water cycle by calculating the delay times and identifying each factor that affects lake water levels. These include direct precipitation, surface seiches, river inflow, (quick and slow) return flow, internal seiches, and subsurface flow. It was identified that the peak of the response function of approximately 20 d corresponds to the paddy–waterway system; therefore, it is necessary to consider this process as an integral part of the lake system. It can be concluded that the delay time is caused by a paddy–waterway system between the river inflow and the subsurface flow, and that its effect corresponds to that of large rivers such as the Ane River. The paddy–waterway system response, differentiation from the inner lake, and accurate process estimations are issues that must be considered in future studies because they may affect the ploughing and the irrigation of fields and the outflow of agricultural chemicals.

Author Contributions

Conceptualisation, M.I.; methodology, M.I. and N.G.; formal analysis, M.I.; investigation, N.G., K.H. and M.I.; data curation, N.G.; writing—original draft preparation, M.I.; writing—review and editing, N.G. and K.H.; project administration, K.H.; funding acquisition, K.H. All authors have read and agreed to the published version of the manuscript.

Funding

This research was partially performed by the Environment Research and Technology Development Fund, number 5-1607, of the Ministry of the Environment, Japan.

Institutional Review Board Statement

Not applicable.

Informed Consent Statement

Informed consent was obtained from all subjects involved in the study.

Data Availability Statement

Not applicable.

Acknowledgments

The mooring survey of this research was performed by the Environment Research and Technology Development Fund (No. 5-1607) of the Ministry of the Environment, Japan. We thank the Lake Biwa Work Office, Ministry of Land, Infrastructure, Transport and Tourism, General Affairs Division, Waterworks Bureau City of Kyoto, Kansai Electric Power Corporation, Japan Meteorological Agency, and Geospatial Information Authority of Japan for providing the necessary data. We thank Kyoto University, the Lake Biwa Environmental Research Institute, and the Lake Biwa Museum for providing the research space.

Conflicts of Interest

The authors declare no conflict of interest.

Appendix A

Table A1. Statistical characteristics of input data.
DurationThe Observation Data of Depth Metre around 5 m (m)The Observation Data of Depth Metre around 10 m (m)Six Points Average Precipitation (mm)
AverageS.D.AverageS.D.AccumulatedS.D.
21 August 2017–12 November 2017 5.890.6410.660.627964.02.6
13 November 2017–8 February 20184.330.119.160.104174.50.8
16 March 2018–16 July 20185.400.2210.220.2311,578.02.5
20 July 2018–21 October 2018 4.300.509.120.467006.52.3

Appendix B

To confirm the observational data, water-level observation values at 1-h intervals from June to July 2018 in Lake Biwa from the MLIT were compared. Hourly data for the average water level of Lake Biwa at three observation points were used (Katayama, Omizo, and Hikone; Figure 1), with the data representing the water level relative to the Lake Biwa baseline ±0 m (BSL; +84.371 m a.s.l.; [19]) provided by the MLIT. Observations of the lake water level were compared against MLIT data for the heavy precipitation associated with the typhoon from 3 to 8 July (total precipitation of 274 mm in Hikone). The present observations were compared with the water level data obtained in the same period by the MLIT (Figure A1). The water level responded strongly to the extreme precipitation event; during this period, the water level increased by approximately 1.5 m (Figure A1). Therefore, it can be considered that the depth metre data from Lake Biwa can register the change in lake level as accurately as the observed water level data.

Appendix C

Figure A2. Flowchart showing the response function calculation [6].
Atmosphere 13 00724 g0a2

Appendix D

A test in which the peak of the response function during summer was calculated at 4.2, 7.7, 16, 24.5, and 34 h was conducted (Figure 3, Table A2a). The values obtained before and after the peaks were verified using a paired two-sided t-test; however, none of the values were significant (Table A2a). Therefore, it was concluded that the value of the peak was τ = 4.2, 7.7, 16, 24.5, and 34 h. Thus, these were used as different peaks.
A test in which the peak of the response function during summer was calculated at 55 and 71 h was conducted (Figure 4, Table A2b). The values obtained before and after the peaks were verified using a paired two-sided t-test; however, none of the values were significant (Table A2b). Therefore, it was concluded that the value of the peak was τ = 55 and 71 h. Thus, these were used as different peaks.
A test in which the peak of the response function from August to November 2017 was calculated on days 17.4 and 21.8 was conducted (Figure 5, Table A2c). The values obtained before and after the peaks were verified using a paired two-sided t-test, and they were found to be significant (Table A2c). Therefore, it was concluded that the value of the peak was τ = 17.4 and 21.8 days. Thus, these were used as different peaks.
A test in which the peak of the response function from July to October 2018 was calculated on days 17.2 and 21.8 was conducted (Figure 5, Table A2c). The values obtained before and after the peaks were verified using a paired two-sided t-test, and they were found to be significant (Table A2c). Therefore, it was concluded that the value of the peak was τ = 17.2 and 21.8 days. Thus, these were used as different peaks.
Table A2. Two-sided t-tests with correspondence between two peaks of delay times.
(a)
Two-sided t-tests with correspondence between two peaks of delay times
n_4.2h = 47, m_7.7h = 71p < 0.005
n_7.6h = 47, m_16h = 47p < 0.005
n_16h = 145, m_24.5h = 145p < 0.005
n_24.5h = 47, m_34h = 47p < 0.005
(b)
Two-sided t-tests with correspondence between two peaks of delay times
n_55h = 51, m_71h = 51p < 0.005
(c)
Two-sided t-tests with correspondence between two peaks of delay times
n_17.4d = 101, m_21.8d = 101p < 0.005
n_17.2d = 101, m_21.8d = 101p < 0.005

Appendix E

Figure A3. Schematic model showing the water flow from the catchment area to Lake Biwa and water balance. The values of the water balance were obtained from the literature [31,32].
Atmosphere 13 00724 g0a3

References

  1. Oki, T.; Kanae, S. Global hydrological cycles and world water resources. Science 2006, 313, 1068–1072. [Google Scholar] [CrossRef] [PubMed] [Green Version]
  2. Ostrovsky, I.; Rimmer, A.; Yacobi, Z.Y.; Nishri, A.; Sukenik, A.; Hadas, O.; Zohary, T. Long-term changes in the Lake Kinneret ecosystem: The effects of climate change and anthropogenic factors. In Climatic Change and Global Warming of Inland Waters: Impacts and Mitigation for Ecosystems and SOCIETIES; Goldman, R.C., Kumagai, M.M., Robarts, D.R., Eds.; John Wiley & Sons: West Sussex, UK, 2013; Volume 16, pp. 271–291. [Google Scholar]
  3. Chen, S.C.; Liao, C.M.; Chio, C.P.; Chou, H.H.; You, S.H.; Cheng, Y.H. Lagged temperature effect with mosquito transmission potential explains dengue variability in southern Taiwan: Insights from a statistical analysis. Sci. Total Environ. 2010, 408, 4069–4075. [Google Scholar] [CrossRef] [PubMed]
  4. Hidaka, K. The Theory of Applied Integral Equation; Kawakita Press: Tokyo, Japan, 1943. (In Japanese) [Google Scholar]
  5. Yokoki, H.; Kuwahara, Y.; Hanawa, N.; Gunji, M.; Tomura, T.; Hirayama, A.; Miura, N. Estimation of the future flood and inundation risk on Japanese major river basins caused by climate change. Chikyu Kankyo Assoc. Int. Res. Initiat. Environ. Stud. 2009, 14, 237–246. (In Japanese) [Google Scholar] [CrossRef]
  6. Iwaki, M.; Yamashiki, Y.; Muraoka, K.; Toda, T.; Jiao, C.; Kumagai, M. Effect of precipitation-influenced river influx on Lake Biwa water levels: Time scale analysis based on an impulse response function. Inland Waters 2020, 10, 283–294. [Google Scholar] [CrossRef]
  7. Delbart, C.; Valdés, D.; Barbecot, F.; Tognelli, A.; Couchoux, L. Spatial organization of the impulse response in a karst aquifer. J. Hydrol. 2016, 537, 18–26. [Google Scholar] [CrossRef]
  8. Hocking, M.; Kelly, B.F.J. Groundwater recharge and time lag measurement through Vertosols using impulse functions. J. Hydrol. 2016, 535, 22–35. [Google Scholar] [CrossRef]
  9. Tatas; Chu, H.J.; Burbey, J.T. Estimating future (next-month’s) spatial groundwater response from current regional pumping and precipitation rates. J. Hydrol. 2022, 604, 127160. [Google Scholar] [CrossRef]
  10. Burgan, H.I.; Aksoy, H. Daily flow duration curve model for ungauged intermittent subbasins of gauged rivers. J. Hydrol. 2022, 604, 127249. [Google Scholar] [CrossRef]
  11. Iwaki, M.; Yamashiki, Y.; Toda, T.; Jiao, C.; Kumagai, M. Estimation of the average retention time of precipitation at the surface of a catchment area for Lake Biwa. Water 2021, 13, 1711. [Google Scholar] [CrossRef]
  12. Zohary, T.; Ostrovsky, I. Ecological impacts of excessive water level fluctuations in stratified freshwater lakes. Inland Waters 2011, 1, 47–59. [Google Scholar] [CrossRef]
  13. Mizuno, T.; Otuska, T.; Ogawa, M.; Funao, T.; Kanao, S.; Maehata, M. Spawning migration triggers in round crucian carp Carassius auratus glandoculis and water level fluctuations in Lake Biwa. Jpn. J. Conserv. Ecol. 2010, 15, 211–217. (In Japanese) [Google Scholar]
  14. Sato, Y.; Nishino, M. Model analysis of the impact on spawning of cyprinid fishes by water level manipulation and prediction of the effect of measures. Wetl. Res. 2010, 1, 17–31. (In Japanese) [Google Scholar]
  15. Kikko, T.; Nemoto, M.; Ban, S.; Saegusa, J.; Sawada, N.; Ishizaki, D.; Nakahashi, T.; Teramoto, N.; Fujioka, Y. Efficient rearing of larvae and juveniles of Honmoroko Gnathopogon caerulescens in paddy fields. Aquac. Sci. 2013, 61, 303–309. [Google Scholar]
  16. Iwaki, M.; Kumagai, M.; Jao, C.; Nishi, K. Evaluation of river inflows during heavy precipitation based on water level changes in a large lake. Jpn. J. Limnol. 2014, 75, 87–98. (In Japanese) [Google Scholar] [CrossRef] [Green Version]
  17. Kizza, M.; Westerberg, I.; Rodhe, A.; Ntale, K.H. Estimating areal rainfall over Lake Victoria and its basin using ground-based and satellite data. J. Hydrol. 2012, 464–465, 401–411. [Google Scholar] [CrossRef]
  18. Rooney, G.G.; van Lipzig, N.; Thiery, W. Estimating the effect of rainfall on the surface temperature of a tropical lake. Hydrol. Earth Syst. Sci. 2018, 22, 6357–6369. [Google Scholar] [CrossRef] [Green Version]
  19. The Editorial Committee of Biwako Handbook (Eds.). Fluctuation of Lake Biwa. In Biwako Handbook; Shiga Prefecture: Shiga, Japan, 2010; p. 192. (In Japanese) [Google Scholar]
  20. Sakamoto, M.; Kumagai, M. Lakes and Drainage Basins in East Asia Monsoon Area; Nagoya University Press: Nagoya, Japan, 2006; p. 186. (In Japanese) [Google Scholar]
  21. Haga, H. Confirmation of surface area of the southern basin of Lake Biwa Japan. Jpn. J. Limnol. 2006, 67, 123–126. (In Japanese) [Google Scholar] [CrossRef] [Green Version]
  22. Hino, M. Spectrum Analysis; Asakura Press: Tokyo, Japan, 1977. (In Japanese) [Google Scholar]
  23. Kanari, S. Internal waves in Lake Biwa (I)-The responses of the thermocline to the wind action. Bull. Disaster Prev. Res. Inst. 1970, 19, 19–26. [Google Scholar]
  24. Kanari, S. The long-period internal waves in Lake Biwa. Limnol. Oceanogr. 1975, 20, 544–553. [Google Scholar] [CrossRef]
  25. Jiao, C.; Kumagai, M. Large amplitude nonlinear internal surge in Lake Biwa. Jpn. J. Limnol. 1995, 56, 279–289. [Google Scholar] [CrossRef] [Green Version]
  26. Nakada, S.; Haga, H.; Iwaki, M.; Mabuchi, K.; Takamura, N. High-resolution flow simulation in Typhoon 21, 2018: Massive loss of submerged macrophytes in Lake Biwa. Prog. Earth Planet. Sci. 2021, 8, 46. [Google Scholar] [CrossRef]
  27. Iwaki, M.; Takamura, N.; Nakada, S.; Oguma, H. Monitoring of lake environment using a fixed point and time-lapse camera—Case study of south basin of Lake Biwa. J. Remote Sens. Soc. Jpn. 2021, 41, 563–574. (In Japanese) [Google Scholar]
  28. Report of Kinki Regional Development Bureau, Infrastructure, Transport and Tourism, 2014, 2; 1–31. Available online: https://www.kkr.mlit.go.jp/river/iinkaikatsudou/kensyou/datatenkenkawaniu.html (accessed on 1 January 2022). (In Japanese).
  29. Kotoda, K. The estimation method of lake evaporation using climatological data. In Report of the Hydraulic Experiment University of Tsukuba Environmental Research Center Papers; University of Tsukuba: Tsukuba, Japan, 1977; pp. 53–65. (In Japanese) [Google Scholar]
  30. Ikebuchi, S.; Seki, M.; Ohtoh, A. Evaporation from Lake Biwa. J. Hydrol. 1988, 102, 427–449. [Google Scholar] [CrossRef]
  31. Fujino, Y. Water Budget. In An Introduction to Limnology of Lake Biwa; Mori, S., Ed.; Kyoto University: Kyoto, Japan, 1980; pp. 19–26. (In Japanese) [Google Scholar]
  32. Kawabata, H. Groundwater infiltration into the lake. Environ. Sci. Res. Rep. 1982, S704, 29–36. (In Japanese) [Google Scholar]
Figure 1. Lake Biwa and its catchment area including the main inflowing rivers and the major outflow (Seta River) as well as the location of water level and discharge gauges and meteorological stations. Data from the Lake Biwa Work Office and the Automated Meteorological Data Acquisition System are shown in Table 1. This map was created using a Digital Elevation Model (Geospatial Information Authority of Japan).
Atmosphere 13 00724 g001
Figure 2. Mooring system in Lake Biwa and the depth metre (water temperature depth metre COMPACT- TD, JFE Advantech, 10-min interval) near the surface (5 and 10 m) settled at the observation point in the lake (Figure 1).
Atmosphere 13 00724 g002
Figure 3. Calculated water-level response functions with respect to average precipitation from 24 June to 17 July 2018, showing τ < 48 h. These functions were calculated using MATLAB software, and the figure was drawn using Microsoft Excel.
Atmosphere 13 00724 g003
Figure 4. Calculated water-level response functions with respect to average precipitation from August 2017 to October 2018, showing τ < 25 h. The circled peaks were considered internal seiches. These functions were calculated using MATLAB software, and the figure was drawn using Microsoft Excel.
Atmosphere 13 00724 g004
Figure 5. Calculated water-level response functions with respect to average precipitation from August 2017 to October 2018, showing τ < 50 d. The bold line indicates a running mean of approximately 45 d. The dotted circle peaks are regarded as the delay times of the paddy–waterway system. These functions were calculated using MATLAB software, and the figure was drawn using Microsoft Excel.
Atmosphere 13 00724 g005
Figure A1. Time series comparison of the observed data obtained using a depth metre near the surface (5 and 10 m) of the lake and water level data of MLIT.
Atmosphere 13 00724 g0a1
Table 1. Weather, water level, and water quality data. Abbreviations: JMA; Japan Meteorological Agency, MLIT; Ministry of Land, Infrastructure, Transport and Tourism.
ParameterTime IntervalData ProviderWebsiteFormats
Precipitation10 minJMA https://www.data.jma.go.jp/obd/stats/etrn/ (accessed on 1 January 2022).csv
Water level10 minMLIT http://www1.river.go.jp/cgi-bin/SiteInfo.exe?ID=306041286603060 (accessed on 1 January 2022).txt
Publisher’s Note: MDPI stays neutral with regard to jurisdictional claims in published maps and institutional affiliations.

