Article

Investigation of the Upper Respiratory Tract of a Male Smoker with Laryngeal Cancer by Inhaling Air Associated with Various Physical Activity Levels

by
Hamidreza Mortazavy Beni
1,*,
Hamed Mortazavi
1,*,
Ebrahim Tashvighi
1 and
Mohammad S. Islam
2
1
Department of Biomedical Engineering, Arsanjan Branch, Islamic Azad University, Arsanjan 6134937333, Iran
2
School of Mechanical and Mechatronic Engineering, University of Technology Sydney (UTS), 15 Broadway, Sydney, NSW 2007, Australia
*
Authors to whom correspondence should be addressed.
Atmosphere 2022, 13(5), 717; https://doi.org/10.3390/atmos13050717
Submission received: 1 April 2022 / Revised: 22 April 2022 / Accepted: 29 April 2022 / Published: 30 April 2022
(This article belongs to the Special Issue Heat Wave, Bush Fire and Air-Quality: Impacts on Respiratory Health)

Abstract

:
Smokers are at a higher risk of laryngeal cancer, which is a type of head and neck cancer in which cancer cells proliferate and can metastasize to other tissues after a tumor has formed. Cigarette smoke greatly reduces the inhaled air quality and can also lead to laryngeal cancer. In this study, the upper airway of a 70-year-old smoker with laryngeal cancer was reconstructed by taking a CT scan using Mimics software. To solve the governing equations, computational fluid dynamics (CFD) with a pressure base approach was used with the help of Ansys 2021 R1 software. As a result, the maximum turbulence intensity occurred in the larynx. At 13 L/min, 55 L/min, and 100 L/min, the maximum turbulence intensity was 1.1, 3.5, and 6.1, respectively. The turbulence intensity in the respiratory system is crucial because it demonstrates the ability to transfer energy. The maximum wall shear stress (WSS) also occurred in the larynx. At 13 L/min, 55 L/min, and 100 L/min, the maximum WSS was 0.62 Pa, 5.4 Pa, and 12.4 Pa, respectively. The WSS index cannot be calculated in vivo and should be calculated in vitro. Excessive WSS in the epiglottis is inappropriate and can lead to an airway obstruction. Furthermore, real mathematical modeling outcomes provide an approach for future prevention, treatment, and management planning by forecasting the zones prone to an acceleration of disease progression. In this regard, accurate computational modeling leads to pre-visualization in surgical planning to define the best reformative techniques to determine the most probable patient condition consequences.

1. Introduction

Laryngeal cancer is a type of cancer that affects the larynx. The larynx contains the vocal cords, which vibrate to produce sound when air is directed at them. When laryngeal cancer begins, malignant cells grow in the larynx. It is a type of head and neck cancer in which cancer cells grow rapidly and can migrate or metastasize to other tissues in the throat after a tumor has formed. Many studies have been undertaken on the respiratory system of a healthy person. Amongst the studies that have simulated the respiratory system of a healthy person is the numerical investigation of Ball et al. [1]. They simulated the human respiratory system at different flow rates. Henan et al. [2] numerically and experimentally studied the flow through the respiratory system. They examined the flow movement in several human bodies and collected general results, which provided a complete model for simulating this system. Kleinstreuer and Zhang [3] examined the change in laminar to turbulent flow in the airway. In other numerical studies, comparisons have been made between the passage of micro- and nano-sized particles through the airway and their deposition at the top of the airway [4,5]. Matida et al. [6] achieved acceptable results in 2004 by examining the deposition of various substances in the throat. Stapleton et al. [7] proposed a study of the respiratory system using a large eddy simulation model. Despite many studies of the respiratory system of a healthy person, limited numerical studies have been performed on the human respiratory system with laryngeal cancer.
In 2015, Taylan et al. [8] simulated respiratory tract cancer. They found that the upper part of the larynx, where the pressure reaches its lowest point, was the most susceptible point for laryngeal cancer. By simulating the respiratory system in a state of a sudden cross-sectional change, Kaushik et al. [9] found that a significant change in flow behavior occurred due to opening and expansion. Lin et al. [10] investigated the effect of roughness characteristics of the laryngeal cross-section on the passage flow through this part of the respiratory system. By modeling the pharyngeal part and the pressure passing through it for adults, Kumar et al. [11] concluded that the flow behavior changed in this part. By considering the muscles and tissues of the pharynx, Carrigy et al. [12] studied its behavior when particles and air passed through this part. Hiramatsu et al. [13] simulated three-dimensional laryngeal behavior before and after vocal cord failure. In their simulation, all parts related to the vocal cords were examined and a complete view of their behavior was displayed. Vampola et al. [14] analyzed the human larynx and the effects of waves on it using the finite element method. Chen et al. [15] in 2012 were able to improve laryngeal tissues by reconstructing them on a micro scale.
By numerically simulating the upper part of the respiratory tract and the dynamic movement of the vocal cords in three dimensions as well as the final passage of the current through the larynx, Zheng et al. [16] concluded that fluctuations in the passage of the flow increased the movement of the vocal cords. In 2012, Švec et al. [17] processed an image of the larynx and were able to detect the vibrations generated in the larynx at different times with a high accuracy. Zhang et al. [18] also studied the vibrational modes of vocal cords from an aerodynamic and acoustic perspective. Murray et al. [19] compared the vibrational responses of the respiratory system in different states. These simulations were performed from a biomechanical point of view based on the oscillations of the vocal cords. Yang et al. [20] numerically investigated the aeroelasticity of compressible fluid and its effect on the vibrations of the vocal cords. They performed their simulations using the finite element method and solved compressible Navier–Stokes equations. Gemci et al. [21] examined the computational model of air passing through a lung with 17 branches. Pollard et al. [22] studied the dynamics of blood flow and air passing through the surface of the respiratory system from both mechanical and pharmacological perspectives and found that bubbles may be placed between blood particles during heart surgery. In another study, the passage of air and medicine through the human respiratory tract was discussed. In this study, perturbation models to perform the simulations on patients with laryngeal cancer and the flow was passed through the tumors at different velocities.
In the present study, we simulated the upper airway of a seventy-year-old male smoker with a laryngeal tumor in the domain between the nostril entrances up to the lung entrance (carina zone). The pathway included the nasal cavity, nasopharynx, oropharynx, larynx, and trachea. The main purpose of the current study was to determine the variations in airflow characteristics inside all upper airway segments in inhalation associated with various activity levels, especially in the larynx zone of a pre-surgery condition.

2. Materials and Methods

The governing equations for the incompressible airflow in the human upper respiratory system are the equations of continuity (Equation (1)) and momentum (Equation (2)).
Continuity equation:
U i x i = 0
Navier–Stokes equation:
U i U j x i = 1 ρ p x i + x i [ μ ρ ( U i x j + U j x i ) U i U j ¯ ] + g i
In this study, the upper airway of a 70-year-old smoker with laryngeal cancer was reconstructed by taking a CT scan using Mimics software. This geometry consisted of several main segments of the nasal cavity, nasopharynx, oropharynx, larynx, and trachea, which were separately examined in the simulations. The image of this geometry can be seen in Figure 1. Figure 1A shows the anatomical segmentation of the present respiratory system. Figure 1C shows the grid generation image created of the current model by Ansys 2021 R1. In addition to covering the boundary layer, the mesh was selected in such a way that finer mesh was used in the critical zones, including the laryngeal narrowing zone, due to the presence of a tumor.
The input from the nostril was considered at three different airflow rates and the pressure output occurred from the carina zone. The three flow rates were 13 L/min for a light activity (such as walking at 2 mph), 55 L/min for a heavy activity (such as rock climbing), and 100 L/min for a severe activity (such as long-distance running) [23]. The non-slip boundary condition was also applied to the walls. In the present study, to solve the governing equations, the finite volume method with a pressure base approach was used with the help of Fluent 2021 R1 software (ANSYS, Inc., Canonsburg, PA, USA). The SIMPLE algorithm was used to couple the pressure and velocity and the second-order upwind method was used for the discrete momentum equation. The RNG k–ε turbulence model was also used to solve the turbulent flow. The convergence criterion of the results was equal to 10 4 .
As can be seen in Table 1, the number of elements of this computational mesh after a grid independency analysis was 3,502,459 with an average orthogonal quality = 0.7, skewness = 0.2, and aspect ratio = 4.4. The maximum y + adjacent to the geometry wall was five, which led to high accurate computations adjacent to the wall. The thickness of the first sub-layer of the boundary layer in the internal areas of the respiratory system was 0.028 mm and the total number of layers was 20 layers at a growth rate of 1.1. The thickness of the entire boundary layer was considered to be 1.6 mm for the numerical solution. By considering a line (center line) in a fixed location or various planes of different sizes (top plane and front plane), the diagram of changes for a specific parameter (such as velocity for different sizes of an element) could be calculated and the results compared to achieve the grid independence analysis. The top plane, front plane, and center line were defined as shown in Figure 2A. Table 1 shows the results of the grid independence study for the element size variations. Figure 2B also verifies the present research with the study of Ball et al. [1] for the trachea velocity profile entrance. As can be seen from this validation, the trend of alterations was almost the same. However, due to the difference in geometry, especially in the larynx, the trend of the velocity variation in the current study was relatively severe. According to Ball et al. [1], the process of changing the profile of the tracheal entry velocity of a healthy person is relatively gradual and more uniform.

3. Results

In the present work, we investigated the airflow behavior inside the respiratory system from the nasal entrance to the lung entrance. As previously mentioned, the air was directed into the nasal cavity at three different flow rates of 13 L/min, 55 L/min, and 100 L/min. The first value was the lowest state of air entering the body through the nose, the second was the intermediate state, and the last was the most severe state of air entering this respiratory system. Figure 3 shows the filled pressure contours of the respiratory system at the three flow rates of 13 L/min, 55 L/min, and 100 L/min. As can be seen from this figure, the pressure in the nasal cavity and nasopharynx region increased sharply due to the narrowing of the airway in the larynx. As can be seen in the figure, for the flow rates of 13 L/min, 55 L/min, and 100 L/min, the maximum pressure was 16.0 Pa, 205.9 Pa, and 588.2 Pa, respectively. In other words, with an increase in the flow rate, the maximum pressure growth rate was sharply curved. On the other hand, the lowest pressure occurred in the larynx and trachea. Therefore, we expected the air velocity to increase in these two areas, along with a vortical disturbed flow.
Figure 4 shows the airflow streamlines at the three flow rates of 13 L/min, 55 L/min, and 100 L/min. The maximum velocity occurred in the lower part of the larynx. As can be seen in the figure, at 13 L/min, 55 L/min, and 100 L/min, the maximum velocity was 5.3 m/s, 21.8 m/s, and 39.3 m/s, respectively. After this part, the oropharynx showed a significantly higher velocity than the other parts. As can be seen in the figure, at 13 L/min, 55 L/min, and 100 L/min, the maximum velocity was 2.6 m/s, 10.9 m/s, and 19.6 m/s, respectively.
In medical evaluations, several parts of the respiratory system are more important than other parts in terms of sensitivity. The upper part of the nasopharynx is essential because it is the beginning of the entrance to the entire respiratory system [24]. Any disturbance in this part significantly impacts on other parts. The shape of this part is similar to half an ellipse. It may change due to external factors such as colds or allergies. Disorders in this region can cause cracking of the tongue and lips or excessive redness in these areas. In this part, the air had a high velocity than in a healthy person [25], so it may have been damaged due to this phenomenon.
Figure 5 shows the turbulence intensity contours. The maximum turbulence intensity occurred in the larynx. As can be seen at 13 L/min, 55 L/min, and 100 L/min, the maximum turbulence intensity was 1.1, 3.5, and 6.1, respectively. After this part, the oropharynx had a higher turbulence intensity than the other parts. At 13 L/min, 55 L/min, and 100 L/min, the maximum turbulence intensity was 0.9, 2.5, and 3.4, respectively. After these two segments, the amount of turbulence intensity in the trachea was also significant. The turbulence intensity was another parameter that could help us to better understand the airflow behavior in the respiratory system. The turbulence intensity in the respiratory system is crucial because it demonstrates the ability to transfer energy. If the turbulence intensity in the respiratory segment starts to vary or gradually increases, it can cause problems in that segment.
Figure 6 shows the WSS changes at flow rates of 13 L/min, 55 L/min, and 100 L/min. The maximum WSS occurred in the larynx. As can be seen at 13 L/min, 55 L/min, and 100 L/min, the maximum WSS was 0.62 Pa, 5.4 Pa, and 12.4 Pa, respectively. After this part, the oropharynx had a higher WSS than the other parts. At 13 L/min, 55 L/min, and 100 L/min, the maximum WSS was 0.22 Pa, 1.9 Pa, and 4.4 Pa, respectively. One of the most important indexes in a respiratory system study is wall shear stress (WSS). This parameter cannot be calculated in vivo and should be calculated in vitro. Excessive WSS in the epiglottis is inappropriate and can also lead to an airway obstruction.

4. Discussion

In the present study, as shown in Figure 1, a three-dimensional schema of a respiratory system of a person with laryngeal cancer was investigated. The input boundary condition for respiration was set based on the airflow rate. Thus, the selected values of airflow rates were considered to be three values: 13 L/min (minimum air inhalation), 55 L/min (approximately average air inhalation), and 100 L/min (maximum air inhalation) [23]. The available forms of laryngeal cancer indicate that the most common site of cancer in the airway is usually in the larynx. As seen in Figure 4, it could be seen that with laryngeal cancer, the air velocity in the larynx was more intense. This velocity concentration was simulated to be due to the formation of a laryngeal tumor and the eventual narrowing of the airway in the larynx. As shown in Figure 7, with the continuation of the anomaly due to the narrowing of the airway, the round sections of the respiratory system, which are the main and direct route of air movement, had problems.
A person will suffer from respiratory disorders due to changing the angle of movement of the air when it reaches the larynx; there should be a standard distance between this curvature and the main driveway to avoid such a problem. As shown in Figure 5 and Figure 6 above, the concentration of turbulence intensity and WSS in this area could lead to an airway obstruction. The end of the present airway model was the trachea. This is the beginning of the entrance tract airway into the lungs. The trachea is responsible for transporting air into the lungs. As shown in Figure 7, the maximum velocity values passed through the back of the trachea. According to Figure 8, the amount of pressure in the part that is the front part of the respiratory system had a balanced value. The noteworthy point in this section is that although the velocity varied across the tracheal cross-sections for all three airflow rates, as the flow passed through a common cross-section, an almost uniform behavior for the pressure was observed.
In addition to the parameter mentioned above, other indexes containing the patient mandible location, head situation, and weight alteration should be considered to influence airway tract changes. A limitation of this research was that these parameters were not included in the simulation. Although the variations in the airway form relative to gravity were considered using CT images taken in the supine position, there was a slight difference in the head situation. This was because the head location affects the airway form. In general, a CFD analysis is an efficient and powerful tool for modeling and investigating other domains in different critical locations [26,27,28,29], but has a few limitations [30]. Essential indexes of the respiratory system such as age [31,32], aerosol transport [33,34], lung cancer [35], drug delivery [36], air pollution emissions [37], stenosis airways [38], and in realistic lung airways [39] have been studied. However, this study is meaningful because the CFD analysis was applied to patients with laryngeal cancer. Thus, the attitude of airway changes seen after surgery in patients with laryngeal cancer and the situations where an airway obstruction could occur were recognized. This study is also meaningful because it provides basic data for future research. It also provides a basis for developing the means, such as respiratory rehabilitation, for improving the quality of life of patients with laryngeal cancer based on knowledge from follow-up studies with expanded groups of patients.

5. Conclusions

Laryngeal cancer is a widespread illness and a tumor leads to the narrowing of the airway in the larynx. Older people are more likely to get this type of cancer. The present study method could also be applied to younger patients. In this research, an upper airway cancer model was constructed based on a real human body. Air was directed into the nasal cavity at three different inhalation flow rates of 13 L/min, 55 L/min, and 100 13 L/min. The key findings of the present study are listed below:
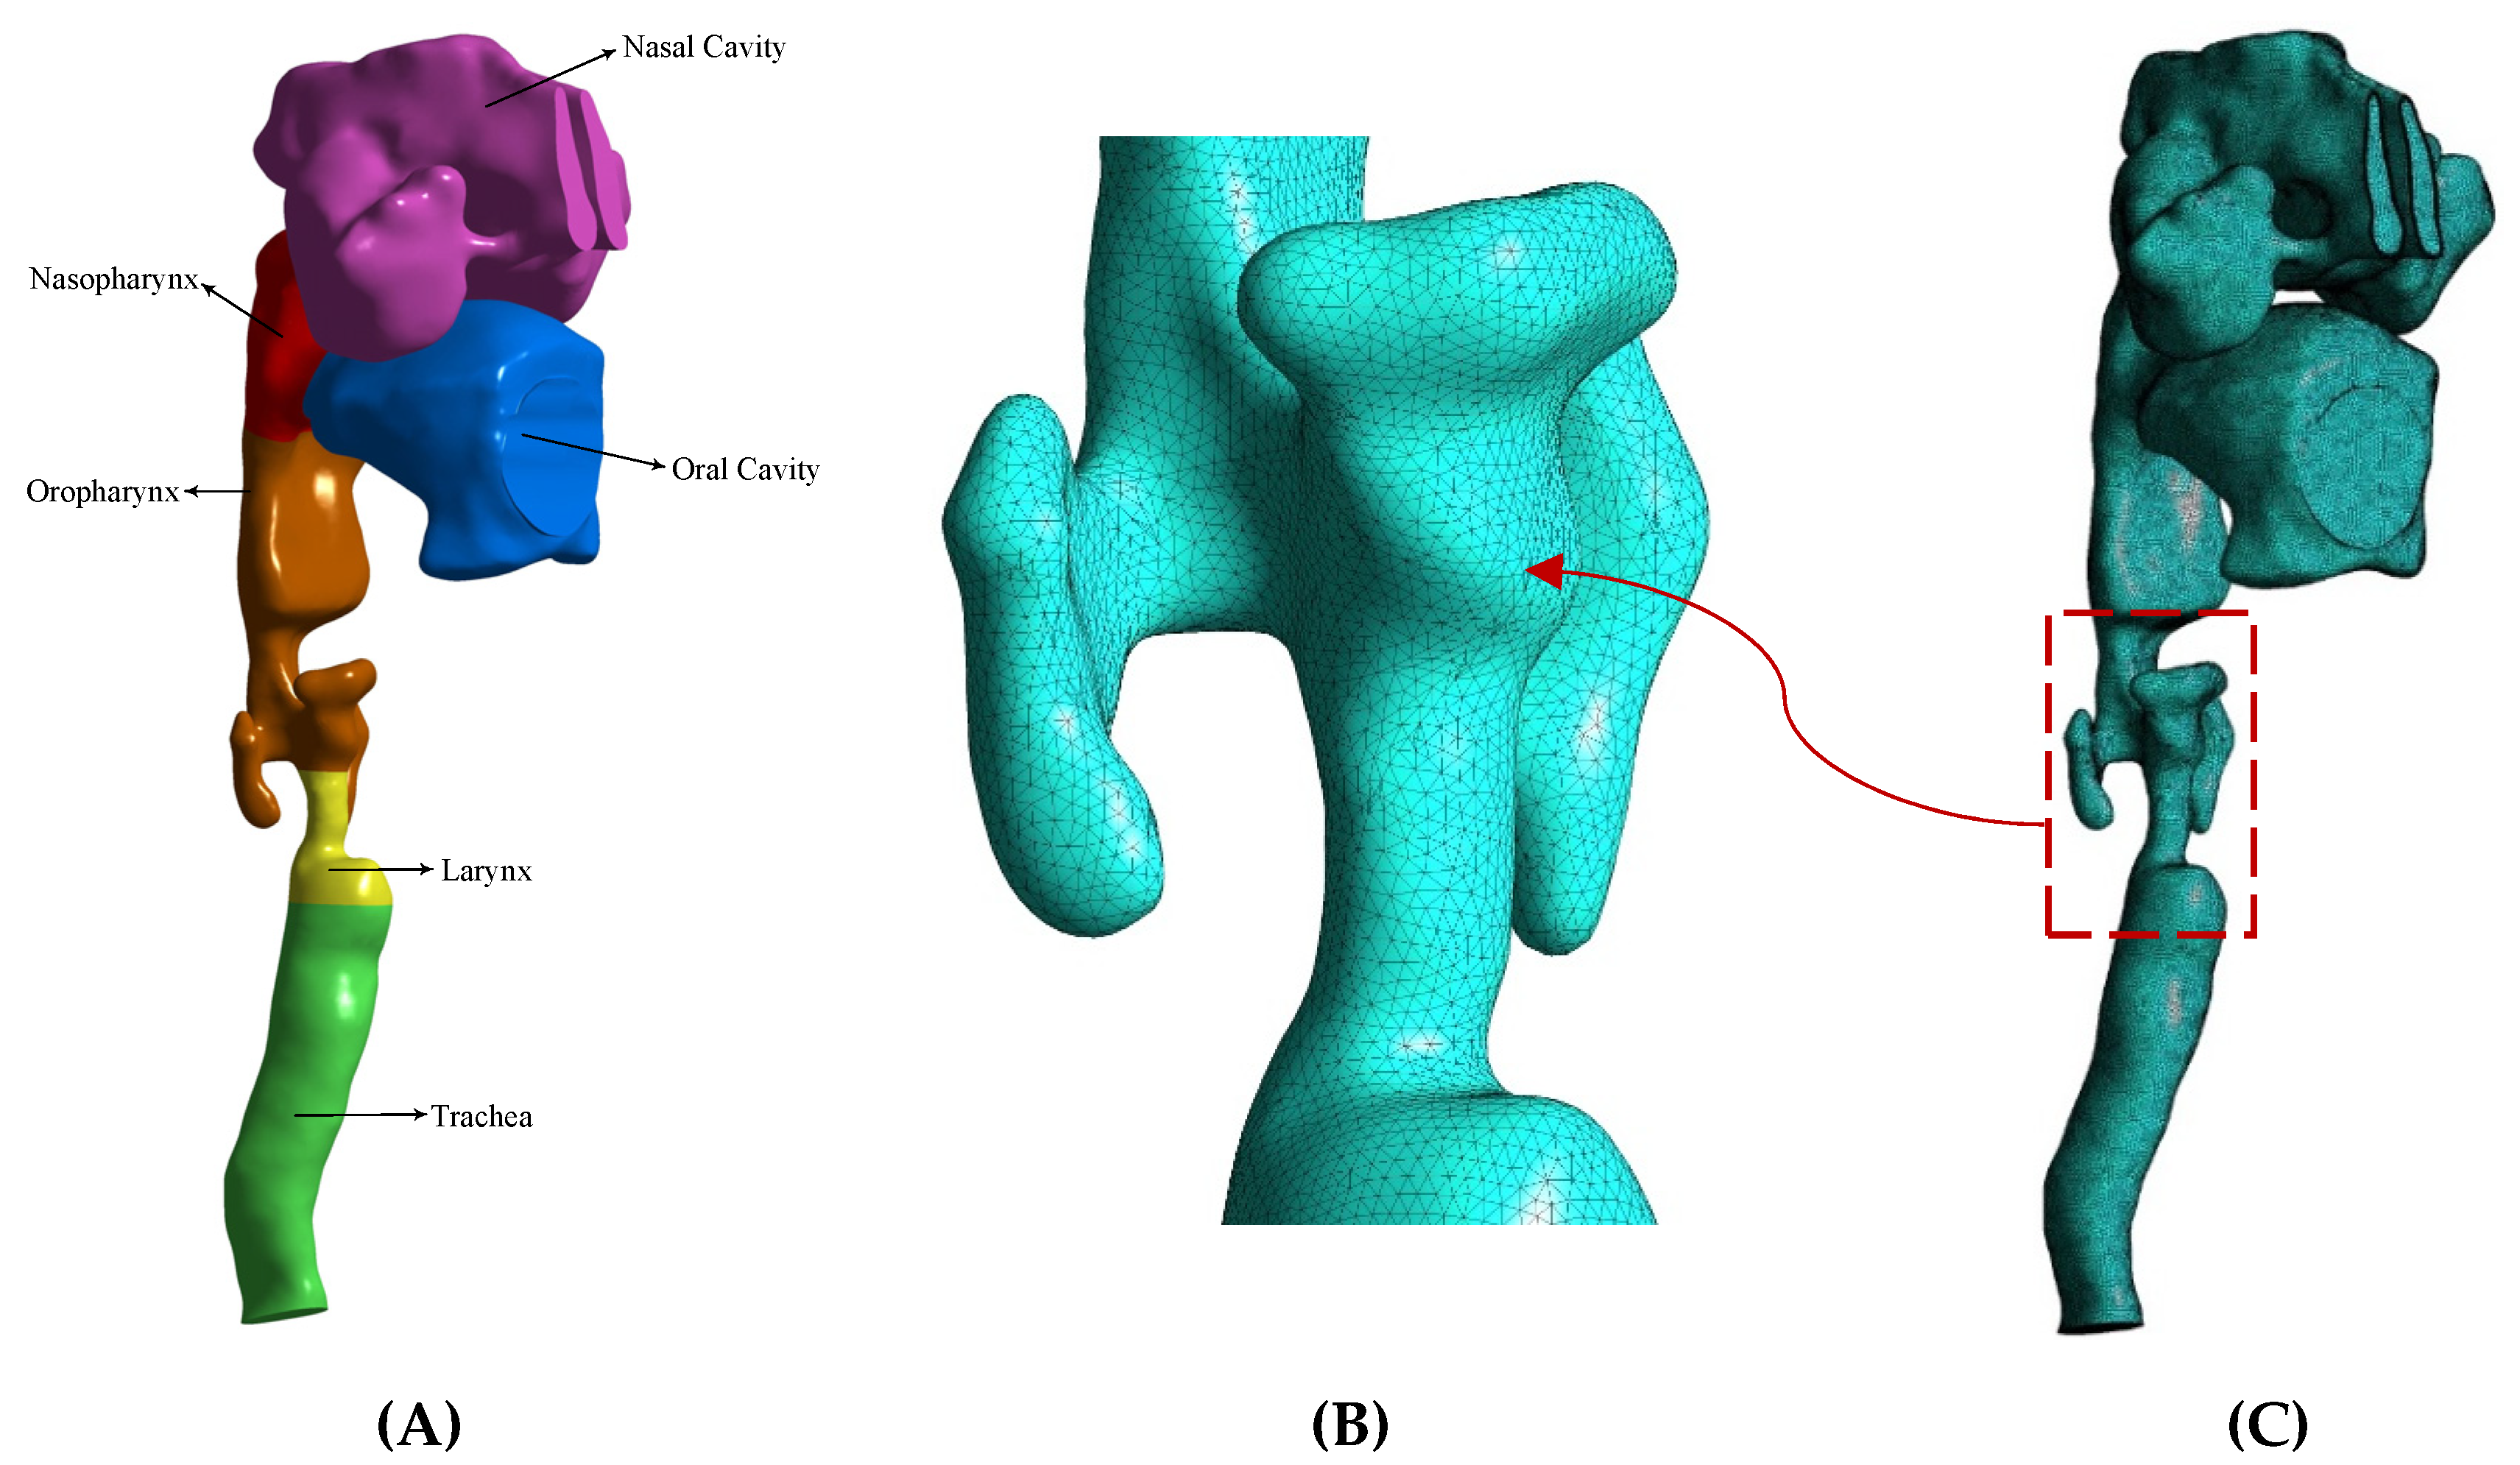
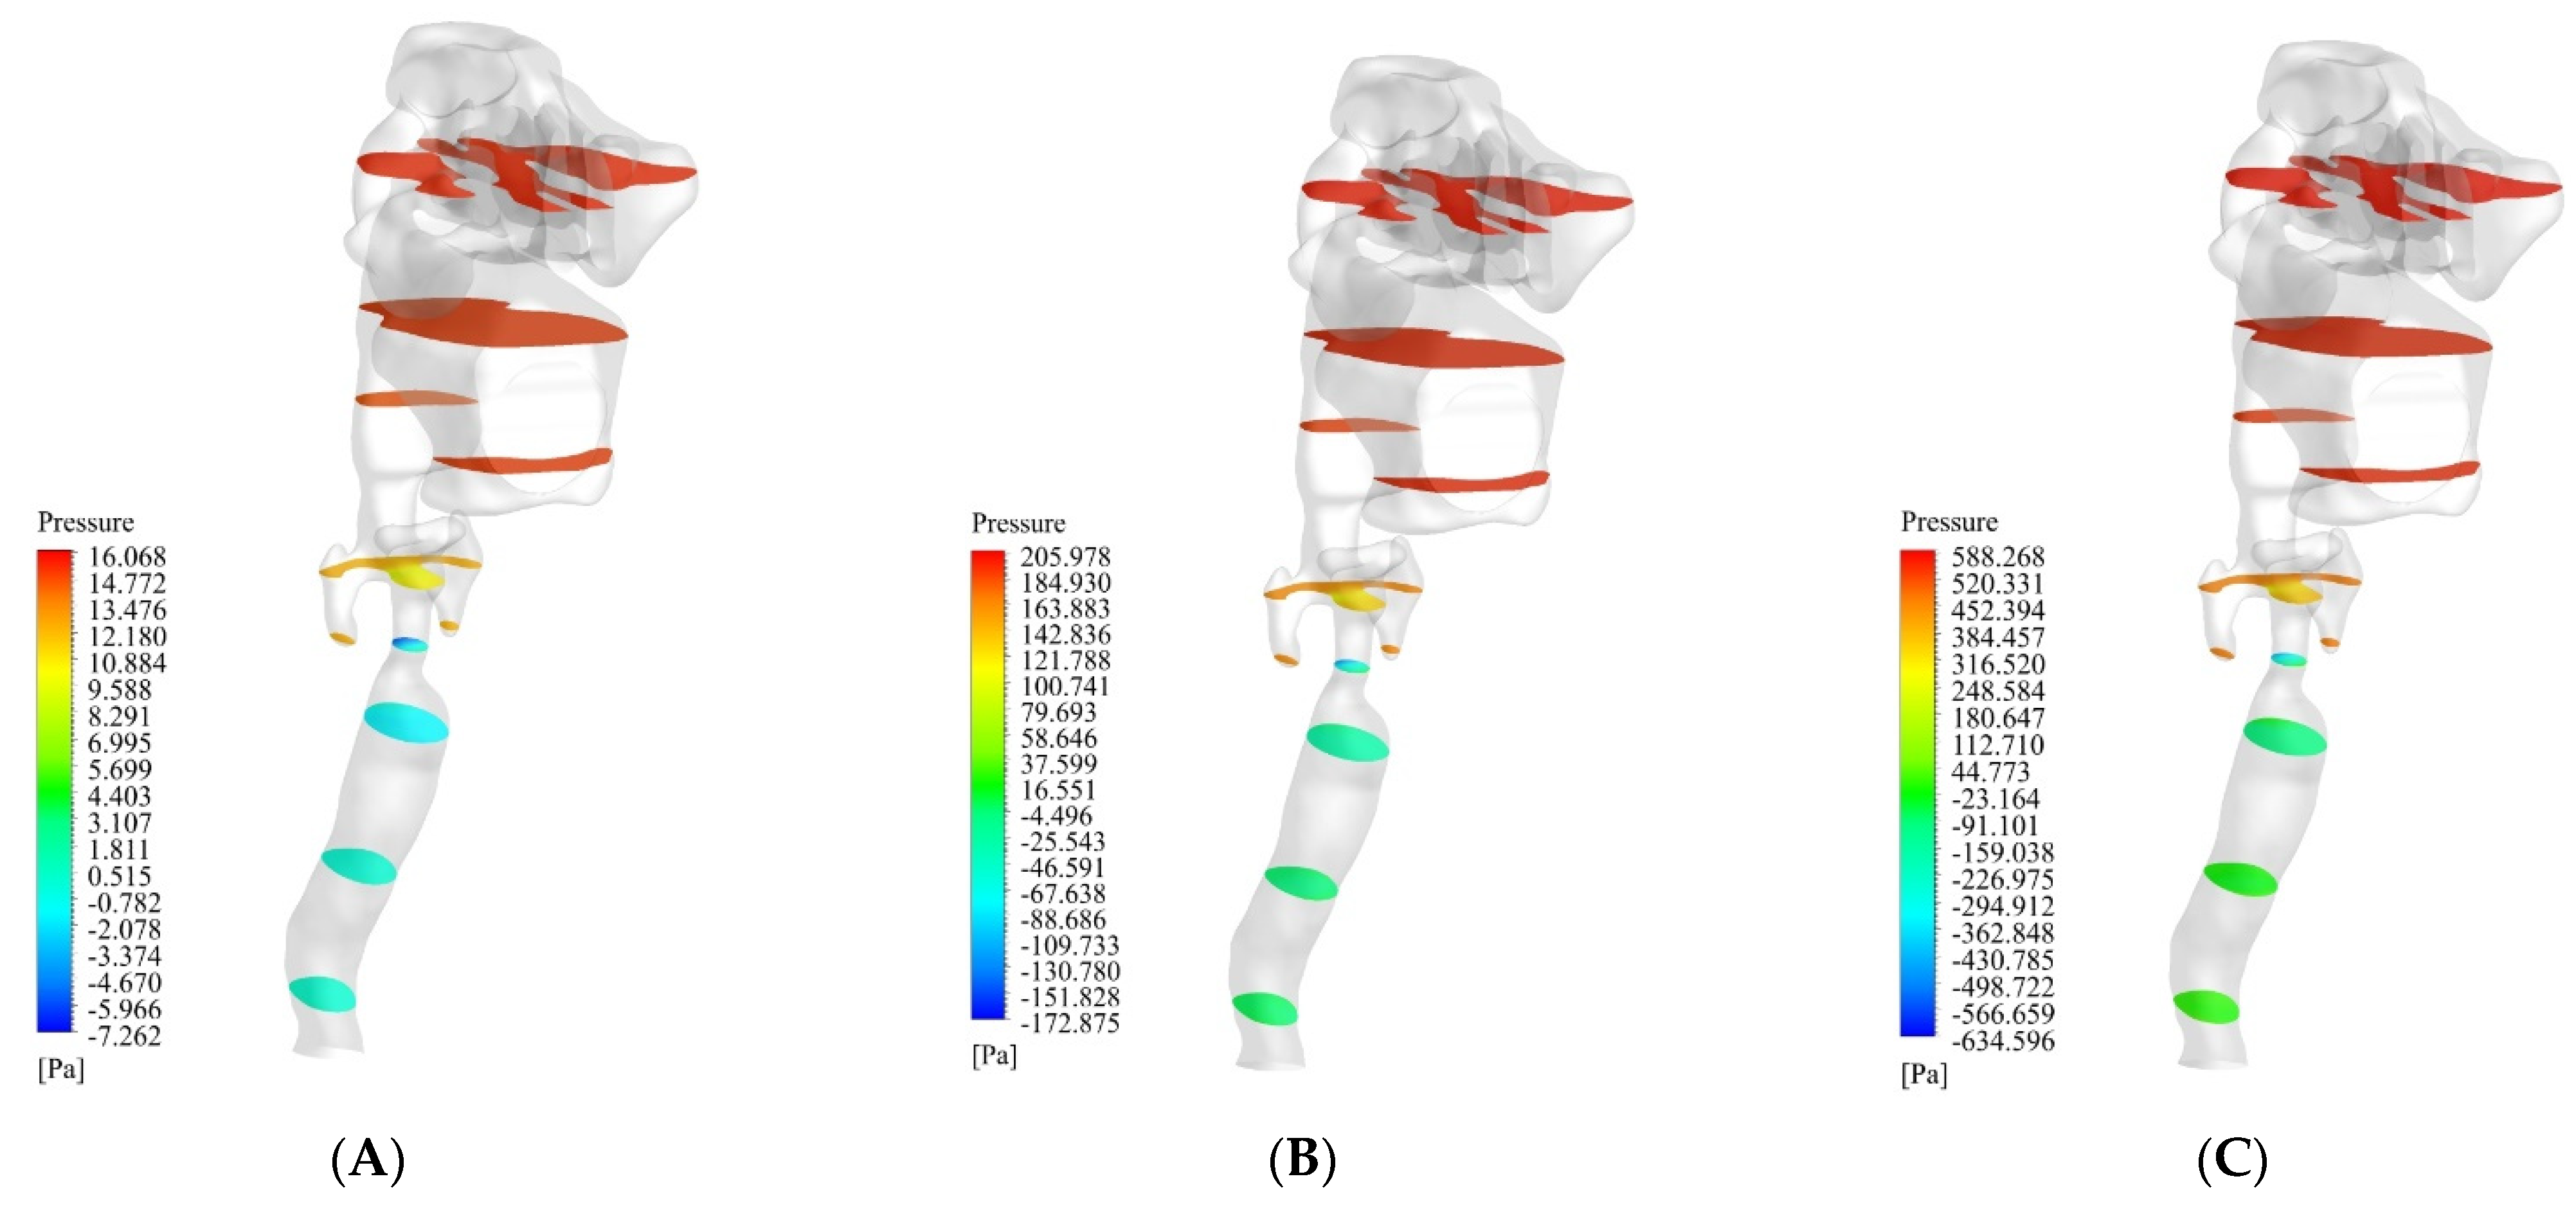
  • The pressure in the nasal cavity and nasopharynx region increased sharply due to the narrowing of the airway in the larynx;
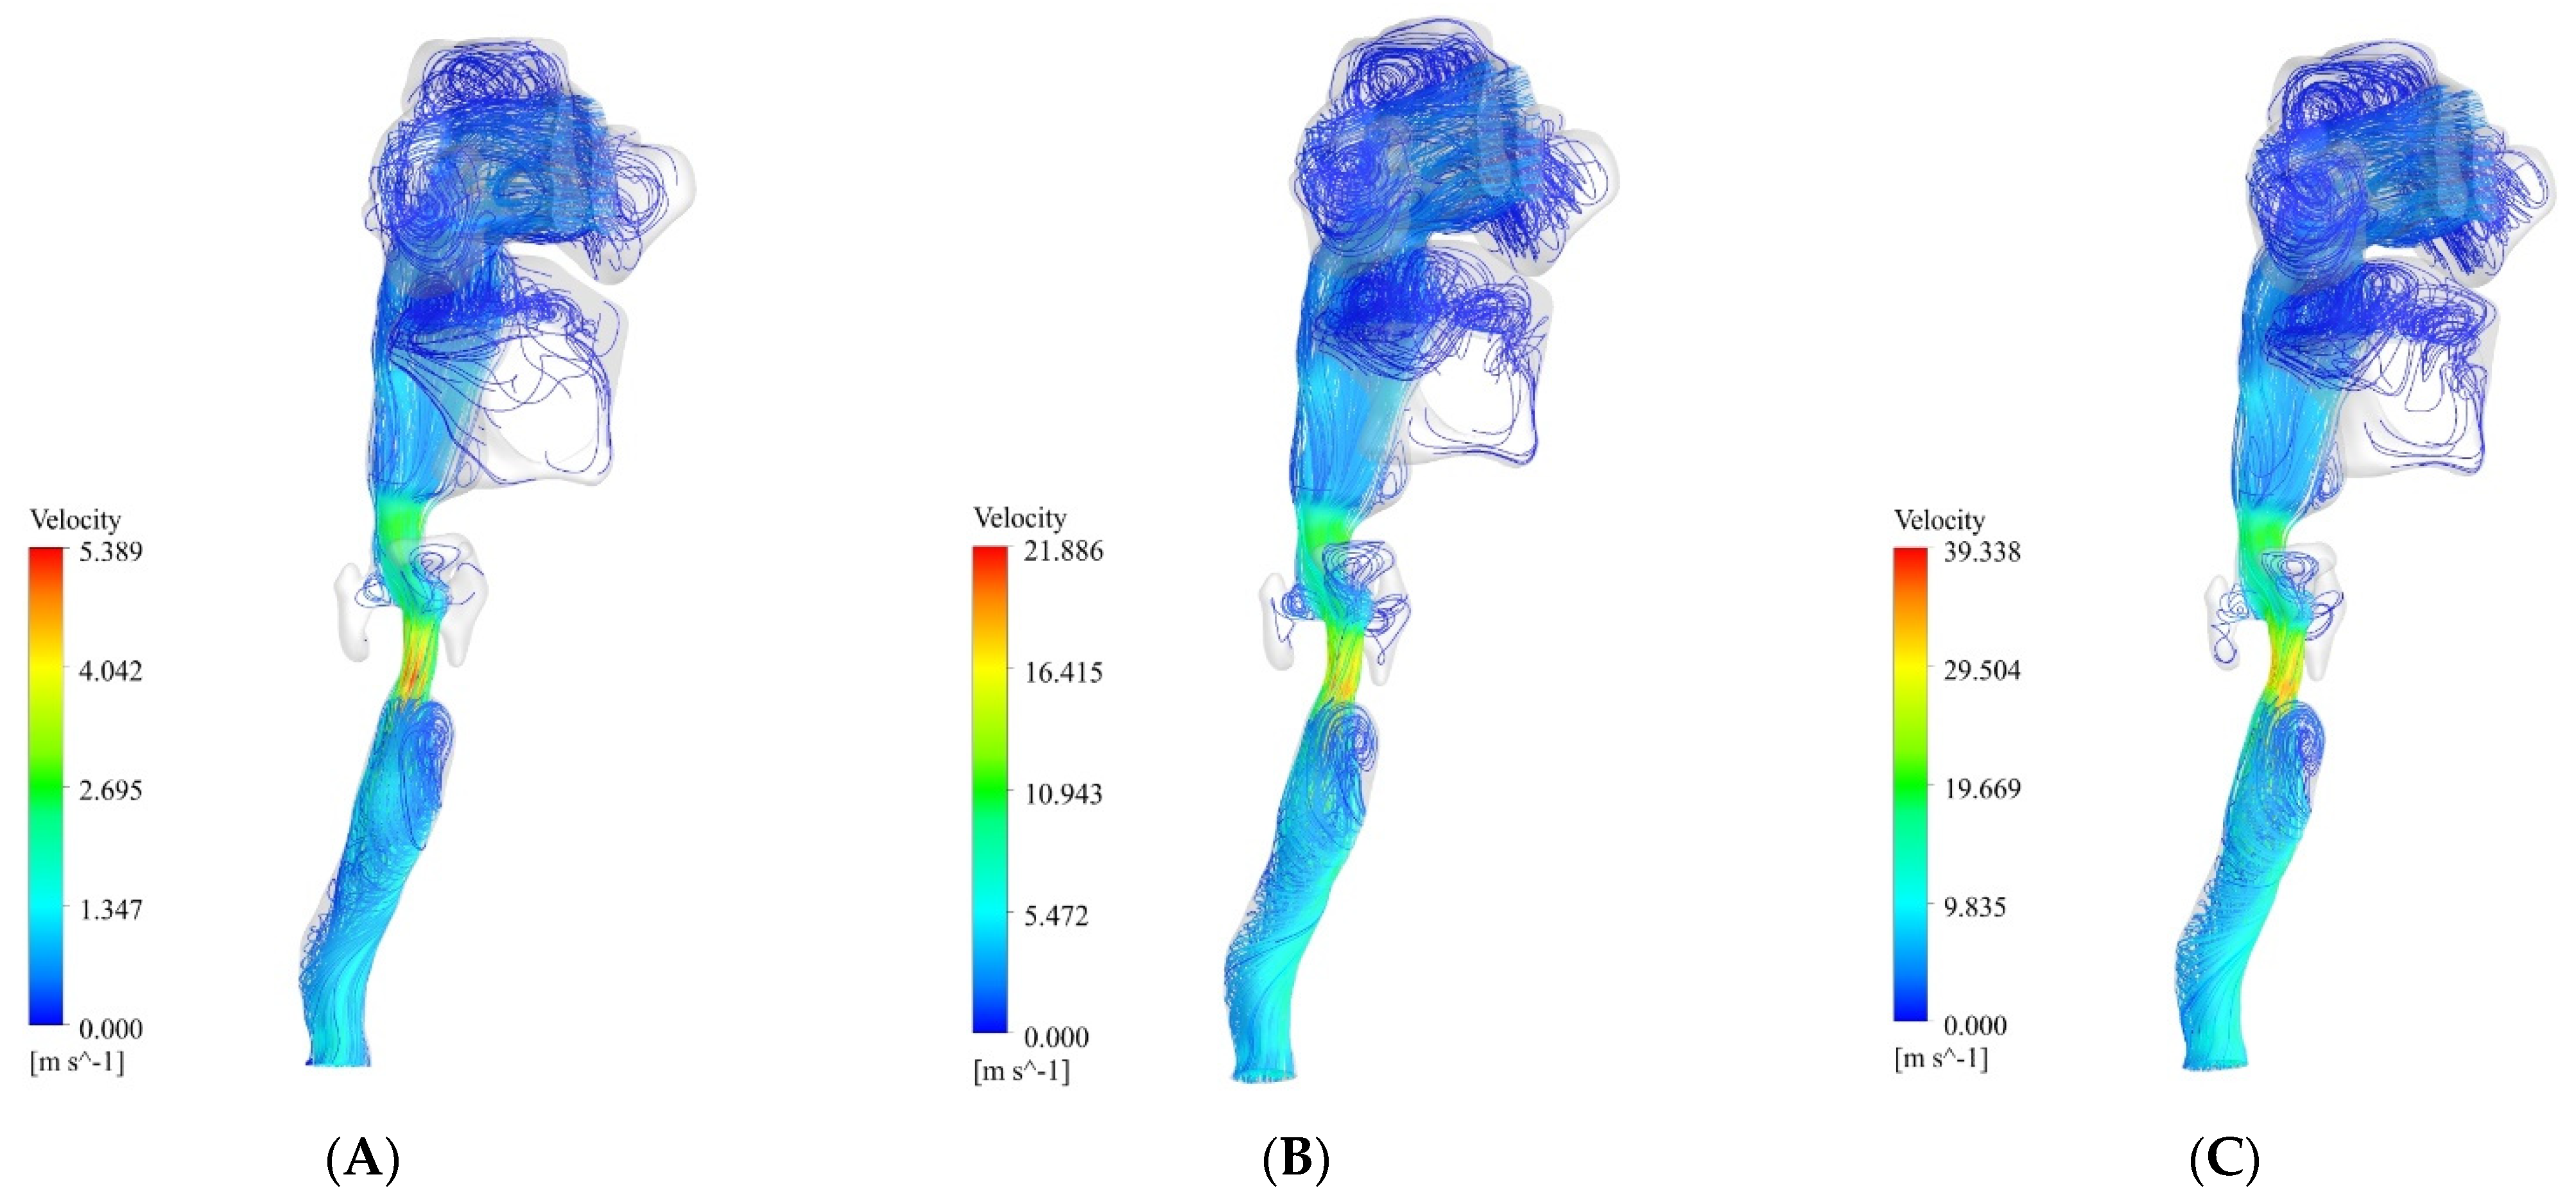
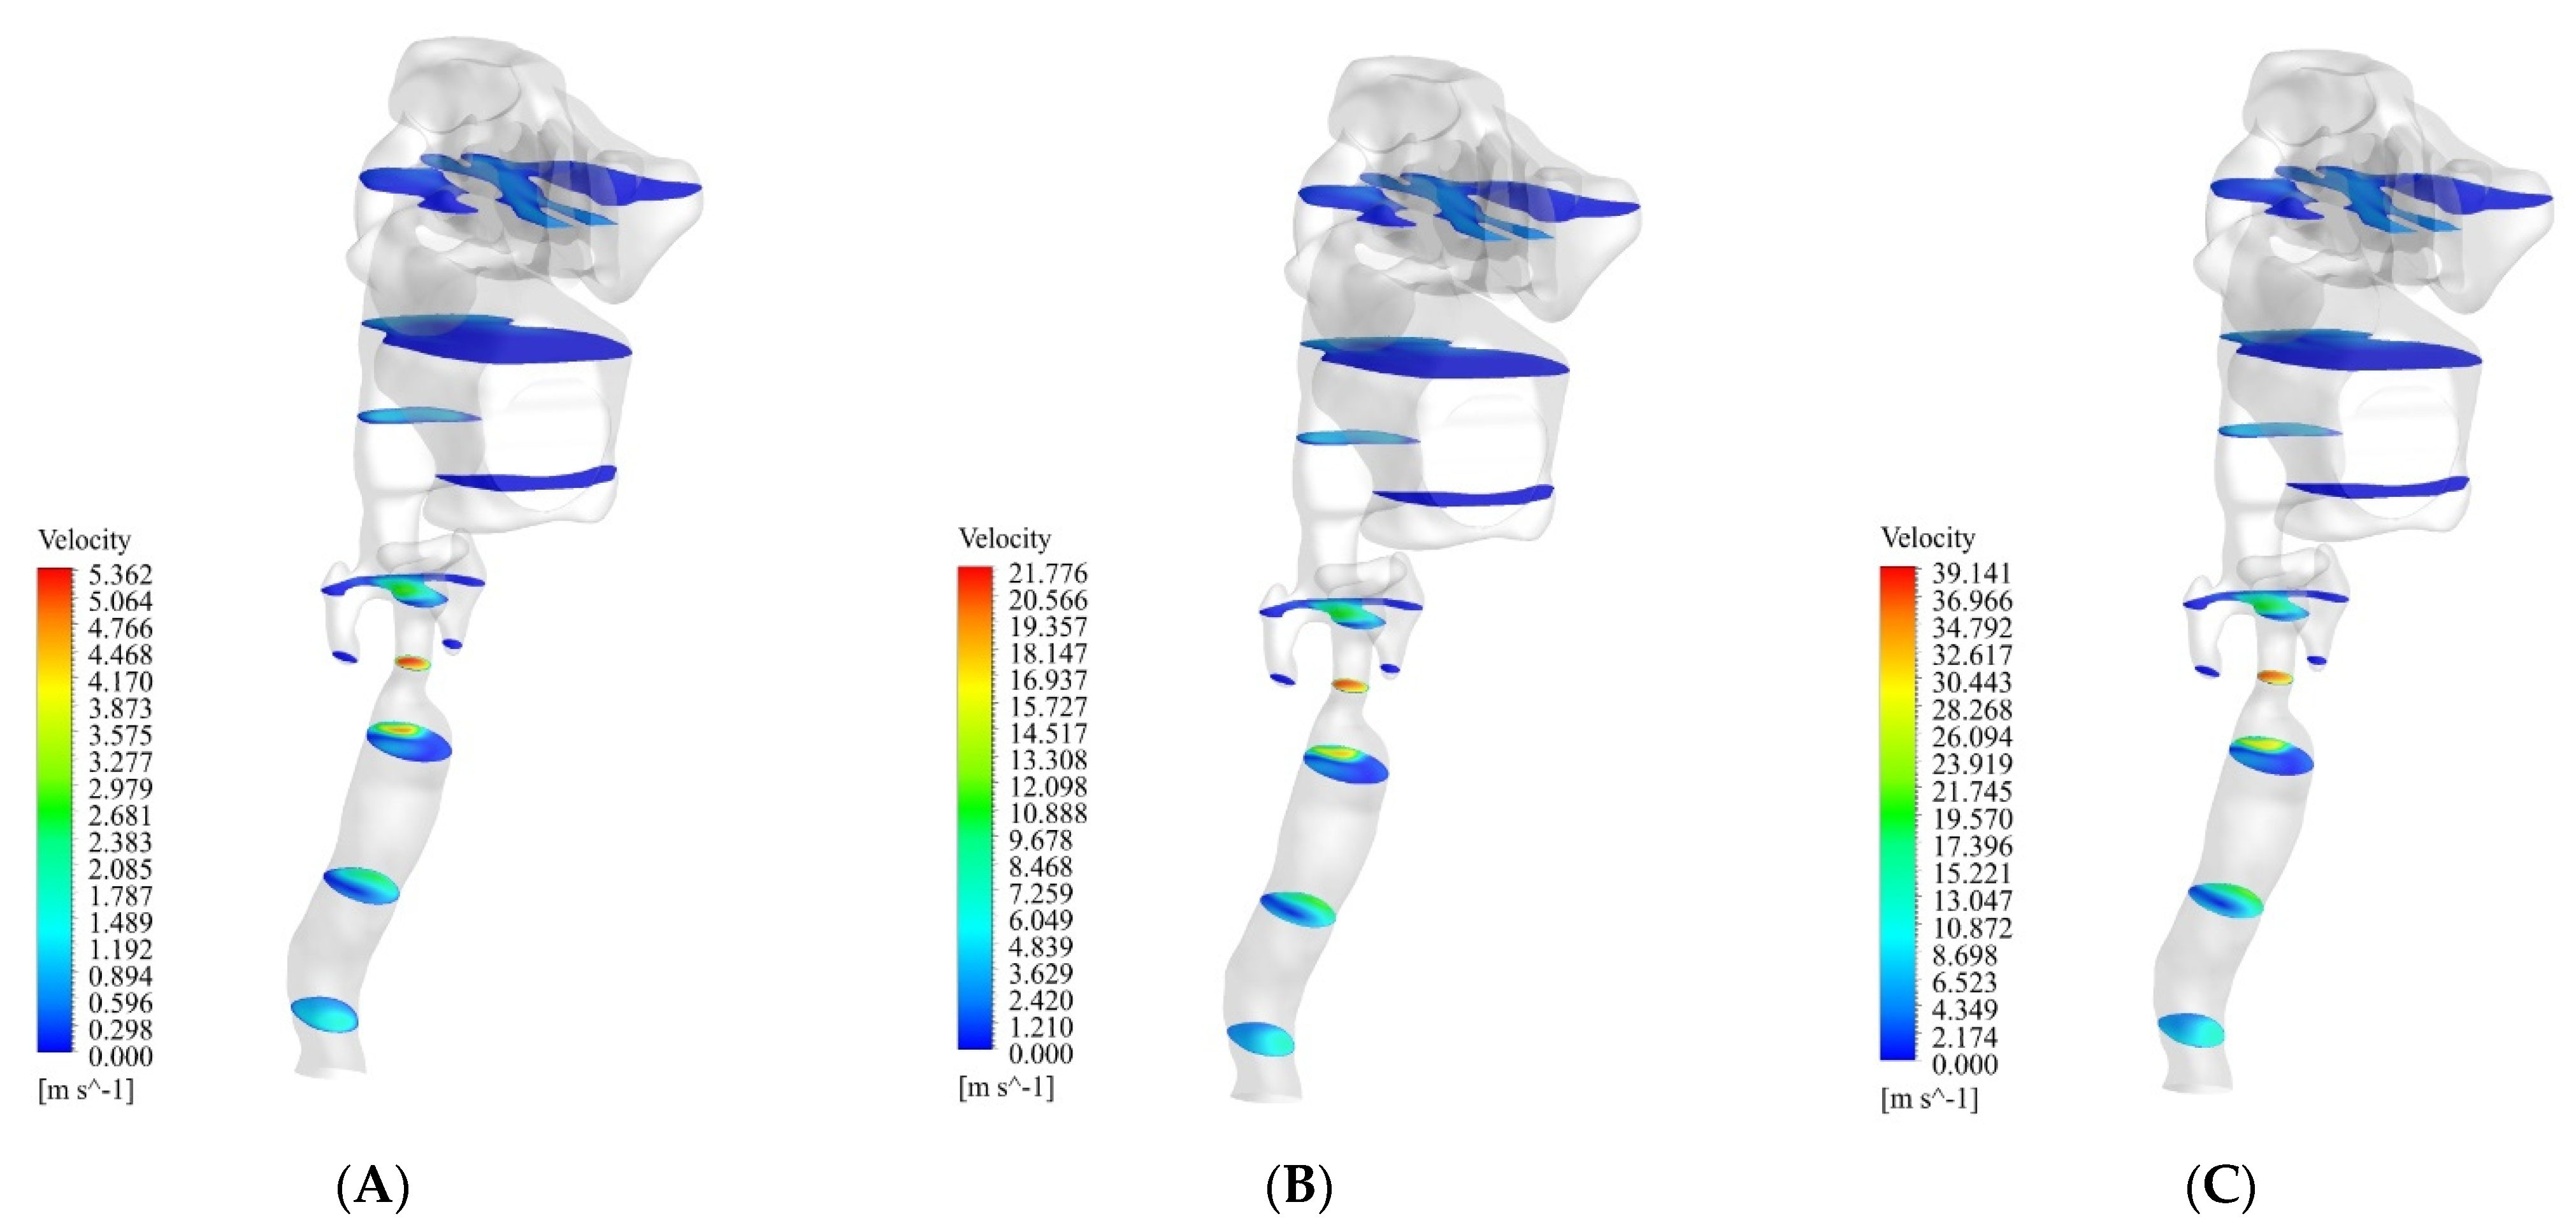
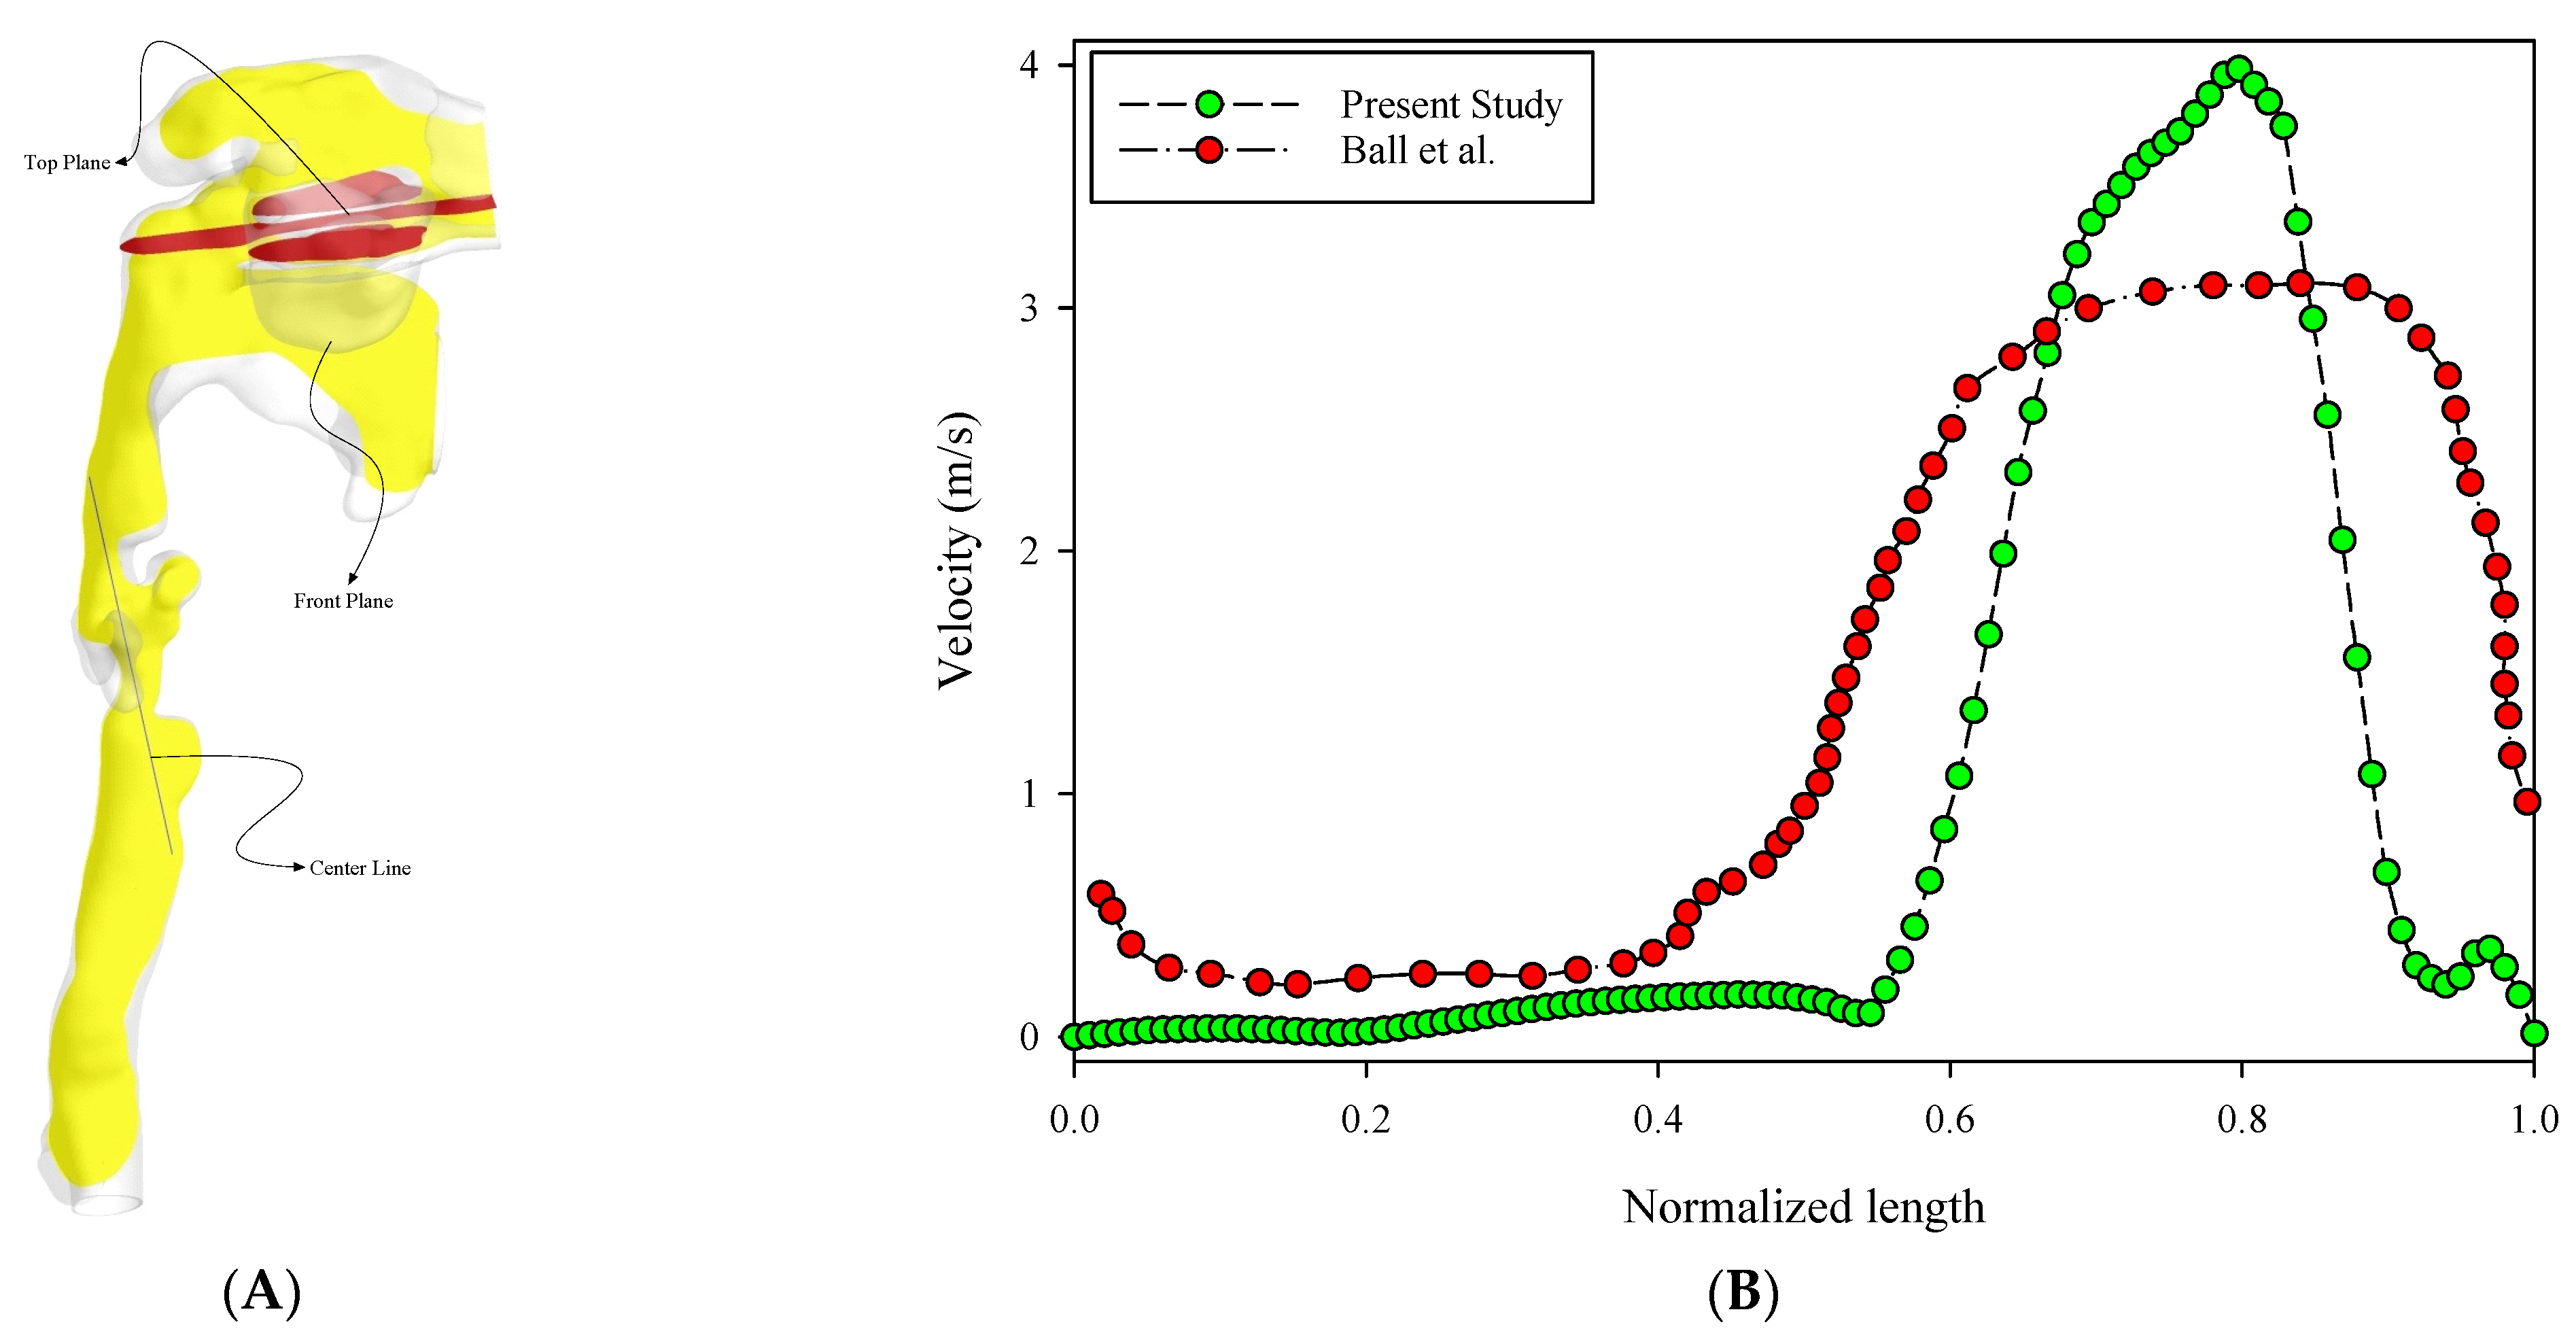
  • The maximum velocity occurred in the lower part of the larynx. After this part, the oropharynx showed a significantly higher velocity than the other parts;
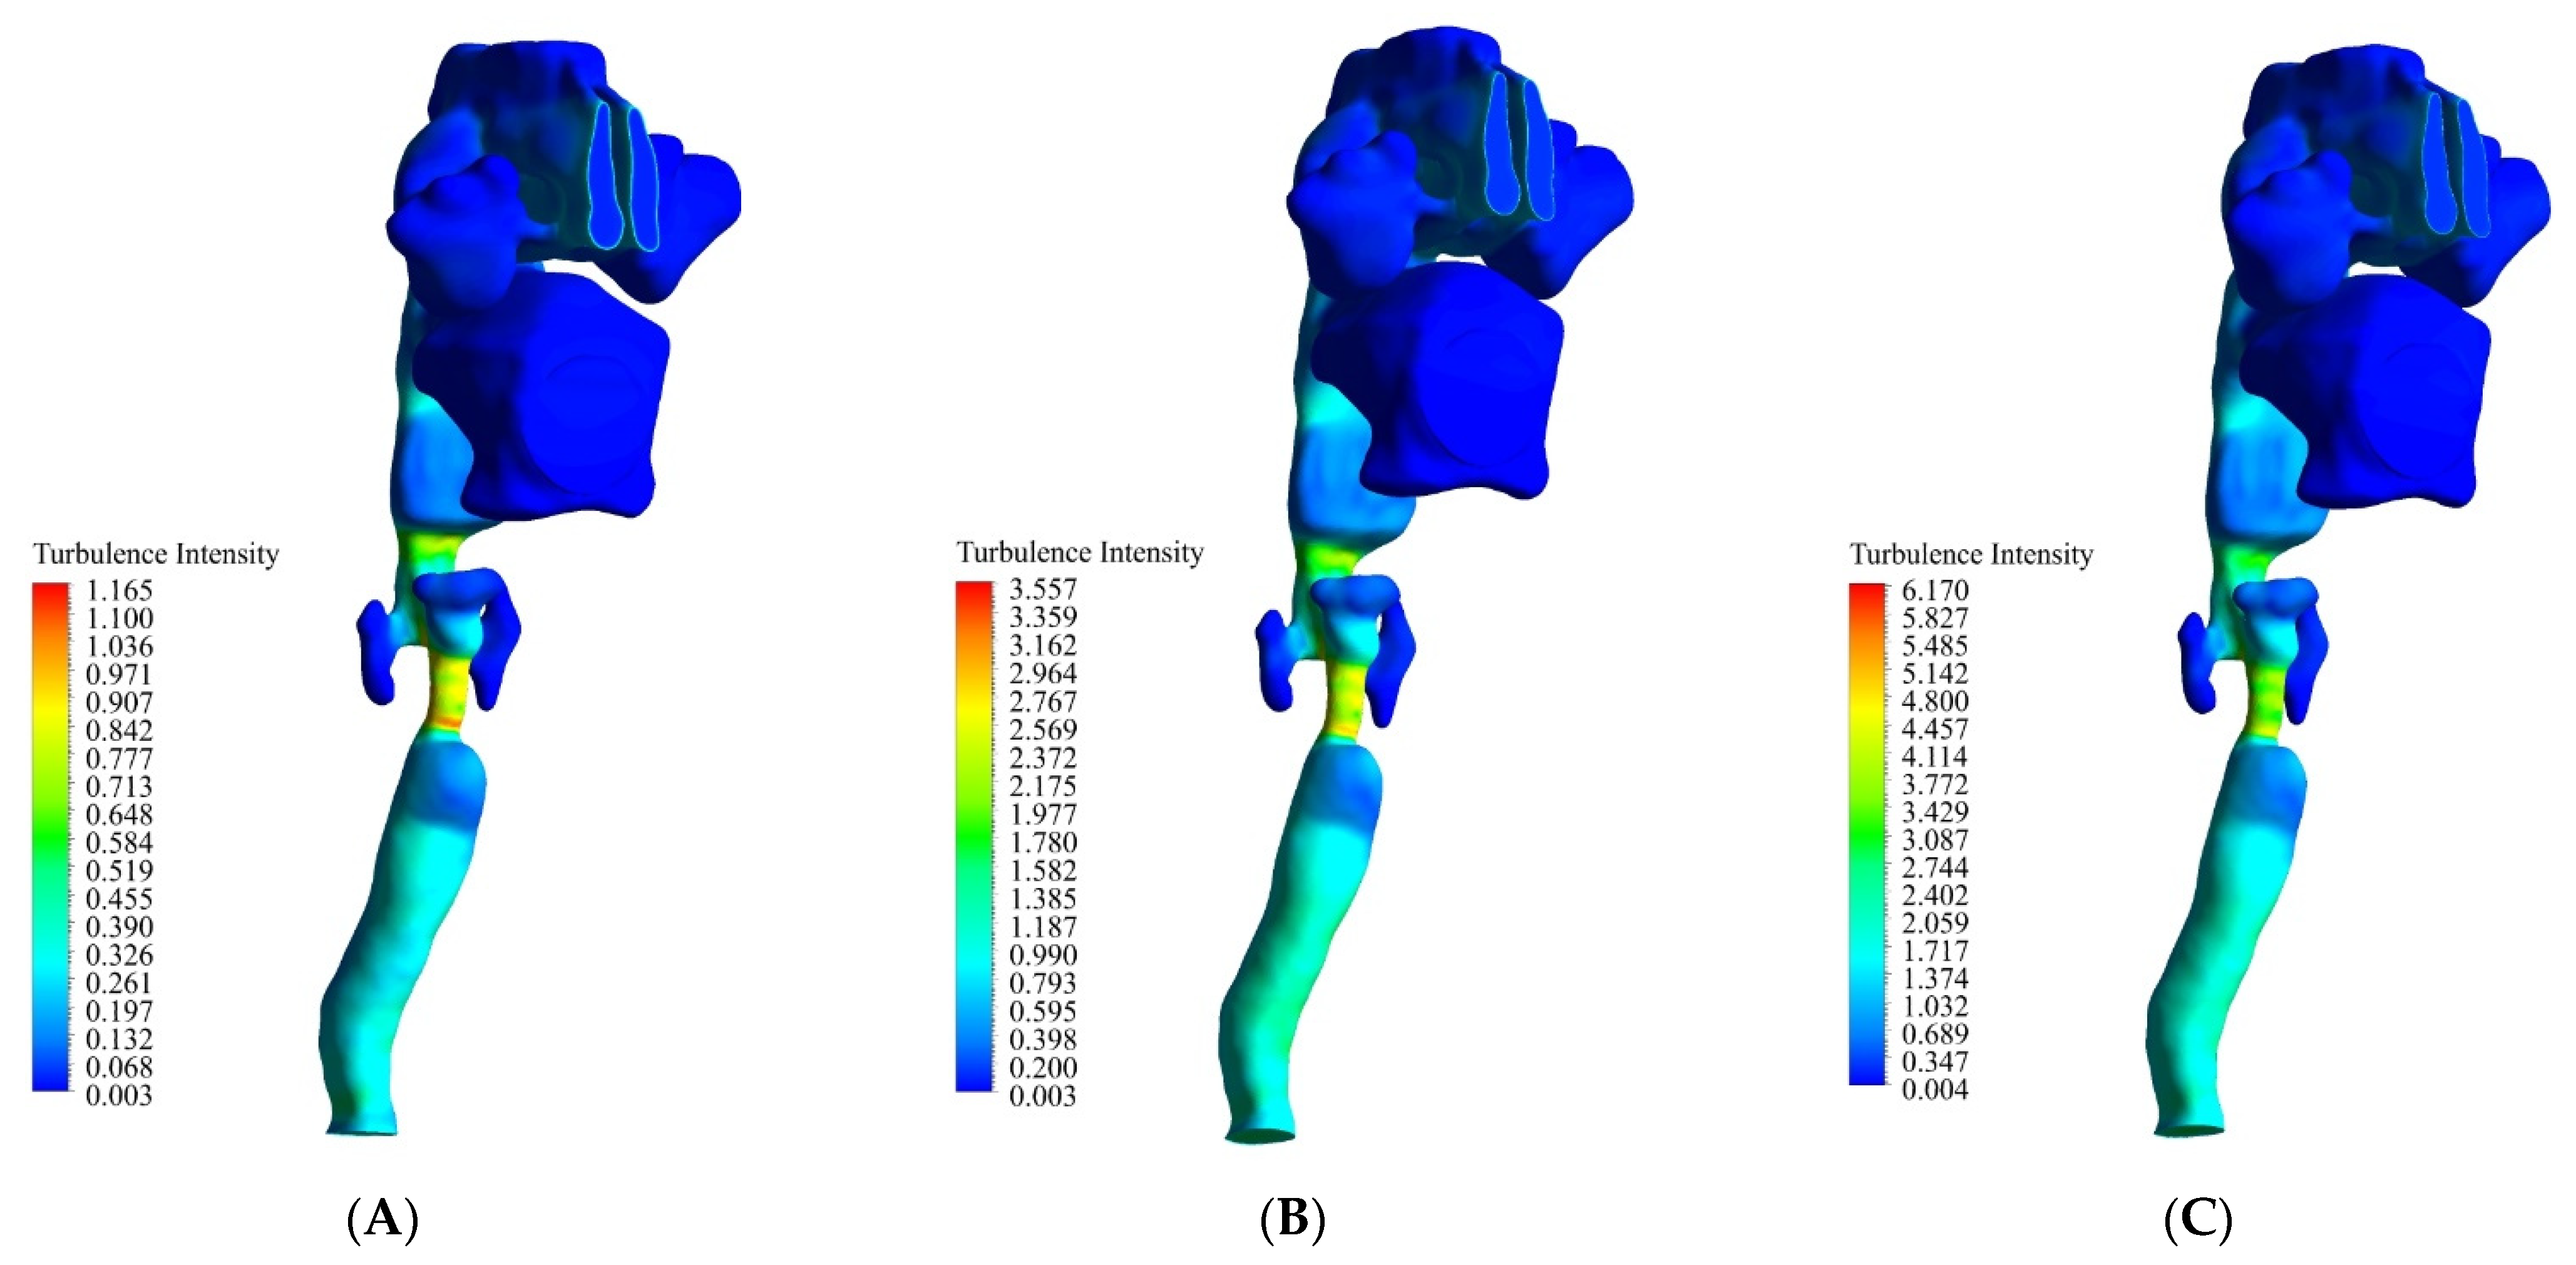
  • The maximum turbulence intensity occurred in the larynx. At 13 L/min, 55 L/min, and 100 L/min, the maximum turbulence intensity was 1.1, 3.5, and 6.1, respectively;
  • The maximum WSS occurred in the larynx. At 13 L/min, 55 L/min, and 100 L/min, the maximum WSS was 0.62 Pa, 5.4 Pa, and 12.4 Pa, respectively.

Author Contributions

Conceptualization, H.M.B. and M.S.I.; Data curation, E.T.; Formal analysis, H.M.B.; Funding acquisition, M.S.I.; Investigation, M.S.I.; Methodology, H.M.B. and H.M.; Project administration, H.M.; Software, H.M.B. and H.M.; Supervision, H.M.B.; Validation, H.M.; Visualization, H.M. and E.T.; Writing—original draft, H.M.B.; Writing—review & editing, H.M. and E.T. All authors have read and agreed to the published version of the manuscript.

Funding

This research was funded by the Teb Karan Aran Far Company through the National Talent Sponsorship Contract (No. RS141221) of the first author, which is highly acknowledged.

Institutional Review Board Statement

All procedures performed in studies involving human participants were in accordance with the ethical standards of the institutional and/or national research committee and with the 1964 Helsinki declaration and its later amendments or comparable ethical standards.

Informed Consent Statement

Informed consent was obtained from all subjects involved in the study.

Conflicts of Interest

The authors declare no conflict of interest.

References

  1. Ball, C.G.; Uddin, M.; Pollard, A. High resolution turbulence modelling of airflow in an idealized human extra-thoracic airway. Comput. Fluids 2008, 37, 943–964. [Google Scholar] [CrossRef]
  2. Heenan, A.F.; Matida, E.; Pollard, A.; Finlay, W.H. Experimental measurements and computational modeling of the flow field in an idealized extra-thoracic airway. Exp. Fluids 2003, 35, 70–84. [Google Scholar] [CrossRef]
  3. Kleinstreuer, C.; Zhang, Z. Laminar-to-turbulent fluidparticle flows in a human airway model. Int. J. Multiph. Flow 2003, 29, 271–289. [Google Scholar] [CrossRef]
  4. Zhang, Z.; Kleinstreuer, C.; Donohue, J.; Kim, C. Comparison of micro-and nano-size particle depositions in a human upper airway model. J. Aerosol Sci. 2005, 36, 211–233. [Google Scholar] [CrossRef]
  5. Zhang, Z.; Kleinsteuer, C. Species heat and mass transfer in a human upper airway model. Int. J. Heat Mass Transfer 2003, 45, 55–68. [Google Scholar] [CrossRef]
  6. Matida, E.; Finlay, W.; Lange, C.; Grgic, B. Improved numerical simulation of aerosol deposition in an idealized mouth–throat. J. Aerosol Sci. 2004, 35, 1–19. [Google Scholar] [CrossRef]
  7. Stapleton, K.W.; Guentsch, E.; Hoskinson, M.K.; Finlay, W.H. The suitability of k–turbulence modeling for aerosol deposition in the mouth and throat: Acomparison with experiment. J. Aerosol Sci. 2000, 31, 739–749. [Google Scholar] [CrossRef]
  8. Taylan, M.; Can, O.; Cetincakmak, M.G.; Ozbay, M. Effect of Airway Dynamics on the Development of Larynx Cancer. Laryngoscope 2016, 126, 1136–1142. [Google Scholar] [CrossRef]
  9. Kaushik, V.; Ghosh, S.; Das, G.; Das, P.K. CFD simulation of core annular flow through sudden contraction and expansion. J. Pet. Sci. Eng. 2012, 86, 153–164. [Google Scholar] [CrossRef]
  10. Lin, C.L.; Tawhai, M.H.; McLennan, G.; Hoffman, E.A. Characteristics of the turbulent laryngeal jet and its effect on airflow in the human intra-thoracic airways. Respir. Physiol. Neurobiol. 2007, 157, 295–309. [Google Scholar] [CrossRef] [Green Version]
  11. Kumar, H.; Spence, C.J.; Tawhai, M.H. Modeling of pharyngeal pressure dur-ing adult nasal high flow therapy. Respir. Physiol. Neurobiol. 2015, 219, 51–57. [Google Scholar] [CrossRef] [PubMed]
  12. Carrigy, N.B.; Carey, J.P.; Martin, A.R. Simulation of muscle and adipose tissue deformation in the passive human pharynx. Comput. Methods Biomech. Biomed. Eng. 2016, 19, 780–788. [Google Scholar] [CrossRef] [PubMed]
  13. Hiramatsu, H.; Tokashiki, R.; Suzuki, M. Usefulness of three-dimensional computed tomography of the larynx for evaluation of unilateral vocal fold paralysis before and after treatment: Technique and clinical applications. Eur. Arch. Otorhinolaryngol. 2008, 265, 725–730. [Google Scholar] [CrossRef] [PubMed] [Green Version]
  14. Vampola, T.; Horáček, J.; Klepáček, I. Computer simulation of mucosal waves on vibrating human vocal folds. Biocybern. Biomed. Eng. 2016, 36, 451–465. [Google Scholar] [CrossRef]
  15. Chen, T.; Chodara, A.M.; Sprecher, A.J.; Fang, F.; Song, W.; Tao, C.H. A new method of reconstructing the human laryngeal architecture using micro-MRI. J. Voice 2012, 26, 55–62. [Google Scholar] [CrossRef]
  16. Zheng, X.; Mittal, R.; Xue, Q.; Bielamowicz, S. Directnumerical simulation of the glottal jet and vocal-fold dynamics in athree-dimensional laryngeal model. J. Acoust. Soc. Am. 2011, 130, 404–415. [Google Scholar] [CrossRef] [Green Version]
  17. Švec, J.G.; Schutte, H.K. Kymographic imaging of laryngeal vibrations. Curr. Opin. Otolaryngol. Head Neck Surg. 2012, 20, 458–465. [Google Scholar] [CrossRef]
  18. Zhang, Z.; Neubauer, J.; Berry, D.A. Aerodynamically and acoustically driven modes of vibration in a physical model of the vocal folds. J. Acoust. Soc. Am. 2006, 120, 2841–2849. [Google Scholar] [CrossRef]
  19. Murray, P.R.; Thomson, S.L. Vibratory responses of synthetic, self-oscillating vocal fold models. J. Acoust. Soc. Am. 2012, 132, 3428–3438. [Google Scholar] [CrossRef] [Green Version]
  20. Yang, J.; Wang, X.; Krane, M.; Zhang, L.T. FullyCoupled Aeroelastic Simulation with Fluid Compressibility-for Application to Vocal Fold Vibration. Comput. Methods Appl. Mech. Eng. 2016, 315, 584–606. [Google Scholar] [CrossRef] [Green Version]
  21. Gemci, T.; Ponyavin, V.; Chen, Y.; Chen, H. Collins Computational model of airflow in upper 17 generations of human respiratory tract. J. Biomech. 2008, 41, 2047–2054. [Google Scholar] [CrossRef] [PubMed]
  22. Pollard, A.; Secretain, F.; Milne, B. Air and blood fluid dynamics: At the interface between engineering and medicine. J. Phys. Conf. Ser. 2014, 530, 012005. [Google Scholar] [CrossRef] [Green Version]
  23. U.S. EPA. Exposure Factors Handbook 2011 Edition (Final Report); EPA/600/R-09/052F; U.S. Environmental Protection Agency: Washington, DC, USA, 2011.
  24. Beni, H.M.; Mortazavi, H.; Aghaei, F.; Kamalipour, S. Experimental tracking and numerical mapping of novel coronavirus micro-droplet deposition through nasal inhalation in the human respiratory system. Biomech. Model. Mechanobiol. 2021, 20, 1087–1100. [Google Scholar] [CrossRef] [PubMed]
  25. Hamed, M.; Beni, H.M.; Aghaei, F.; Sajadian, H. SARS-CoV-2 droplet deposition path and its effects on the human upperairway in the oral inhalation. Comput. Methods Programs Biomed. 2020, 200, 105843. [Google Scholar]
  26. Alaodolehei, K.B.; Jafarian, A.; Sheikhani, H.; Beni, H.M. Performance enhancement of an achalasia automatic detection system using ensemble empirical mode decomposition denoising method. J. Med. Biol. Eng. 2020, 40, 179–188. [Google Scholar] [CrossRef]
  27. Beni, H.M.; Mortazavi, H. Mathematical modeling of the solar regenerative heat exchanger under turbulent oscillating flow: Applications of renewable and sustainable energy and artificial heart. Results Eng. 2022, 13, 100321. [Google Scholar] [CrossRef]
  28. Mortazavi, H.; Beni, H.M.; Islam, M.S. Thermal/fluid characteristics of the inline stacked plain-weave screen as solar-powered Stirling engine heat regenerators. IET Renew. Power Gener. 2022, 16, 956–965. [Google Scholar] [CrossRef]
  29. Mortazavi, H.; Beni, H.M.; Islam, M.S. Front Cover: Thermal/fluid characteristics of the inline stacked plain-weave screen as solar-powered Stirling engine heat regenerators. IET Renew. Power Gener. 2022, 16, i. [Google Scholar] [CrossRef]
  30. Mortazavi, H.; Beni, H.M.; Islam, M. S Biomedical and Biophysical Limits to Mathematical Modeling of Pulmonary System Mechanics: A Scoping Review on Aerosol and Drug Delivery. Biomech. Model. Mechanobiol. 2021, 21, 79–87. [Google Scholar]
  31. Islam, M.S.; Larpruenrudee, P.; Saha, S.C.; Pourmehran, O.; Paul, A.R.; Gemci, T.; Collins, R.; Paul, G.; Gu, Y. How severe acute respiratory syndrome coronavirus-2 aerosol propagates through the age-specific upper airways. J Phys. Fluids 2021, 33, 081911. [Google Scholar] [CrossRef]
  32. Islam, M.; Larpruenrudee, P.; Hossain, S.; Rahimi-Gorji, M.; Gu, Y.; Saha, S.; Paul, G. Polydisperse Aerosol Transport and Deposition in Upper Airways of Age-Specific Lung. J. Int. J. Environ. Res. Public Health 2021, 18, 6239. [Google Scholar] [CrossRef] [PubMed]
  33. Islam, M.S.; Larpruenrudee, P.; Paul, A.R.; Paul, G.; Gemci, T.; Gu, Y.; Saha, S.C. SARS CoV-2 aerosol: How far it can travel to the lower airways? J. Phys. Fluids 2021, 33, 061903. [Google Scholar] [CrossRef] [PubMed]
  34. Islam, M.S.; Saha, S.C.; Sauret, E.; Ong, H.; Young, P.; Gu, Y. Application, Euler–Lagrange approach to investigate respiratory anatomical shape effects on aerosol particle transport and deposition. J. Toxicol. Res. 2019, 3, 1–15. [Google Scholar] [CrossRef] [Green Version]
  35. Gu, Q.; Qi, S.; Yue, Y.; Shen, J.; Zhang, B.; Sun, W.; Qian, W.; Islam, M.S.; Saha, S.C.; Wu, J. Structural and functional alterations of the tracheobronchial tree after left upper pulmonary lobectomy for lung cancer. BioMed. Eng. Online 2019, 18, 105. [Google Scholar] [CrossRef] [Green Version]
  36. Ghosh, A.; Islam, M.S.; Saha, S.C. Targeted drug delivery of magnetic nano-particle in the specific lung region. J. Comput. 2020, 8, 10. [Google Scholar] [CrossRef] [Green Version]
  37. Hendryx, M.; Islam, M.S.; Dong, G.-H.; Paul, G.; Health, P. Air Pollution Emissions 2008–2018 from Australian Coal Mining: Implications for Public and Occupational Health. J. Int. J. Environ. Res. 2020, 17, 1570. [Google Scholar] [CrossRef] [Green Version]
  38. Singh, P.; Raghav, V.; Padhmashali, V.; Paul, G.; Islam, M.S.; Saha, S.C. Airflow and Particle Transport Prediction through Stenosis Airways. Int. J. Environ. Res. Public Health 2020, 17, 1119. [Google Scholar] [CrossRef] [Green Version]
  39. Islam, M.S.; Saha, S.C.; Sauret, E.; Gu, Y.; Ristovski, Z. Numerical investigation of aerosol particle transport and deposition in realistic lung airway. In Proceedings of the International Conference on Computational Methods, Auckland, New Zealand, 14–17 July 2015; Scientech Publisher LLC: Berkeley, CA, USA, 2015. [Google Scholar]
Figure 1. The upper airway of a 70-year-old smoker with laryngeal cancer. (A) The anatomical segmentation of the present respiratory system. (B) Finer mesh was used in the laryngeal narrowing zone due to the presence of a tumor. (C) The grid generation image.
Atmosphere 13 00717 g001
Figure 2. Upper respiratory tract view and validation. (A) The top plane (red), front plane (yellow), and center line are defined in the 3D model. (B) Verification of the present research with the study of Ball et al. [1] for the trachea velocity profile entrance.
Atmosphere 13 00717 g002
Figure 3. Filled pressure contour of the respiratory system at three flow rates of 13 L/min, 55 L/min, and 100 L/min. (A) 13 L/min. (B) 55 L/min. (C) 100 L/min.
Atmosphere 13 00717 g003
Figure 4. Streamlines of the airflow at three flow rates of 13 L/min, 55 L/min, and 100 L/min. (A) 13 L/min. (B) 55 L/min. (C) 100 L/min.
Atmosphere 13 00717 g004
Figure 5. The turbulence intensity contours at three flow rates of 13 L/min, 55 L/min, and 100 L/min. (A) 13 L/min. (B) 55 L/min. (C) 100 L/min.
Atmosphere 13 00717 g005
Figure 6. The WSS changes at flow rates of 13 L/min, 55 L/min, and 100 L/min. (A) 13 L/min. (B) 55 L/min. (C) 100 L/min.
Atmosphere 13 00717 g006
Figure 7. Cross-sectional velocity distribution of the airflow at three flow rates of 13 L/min, 55 L/min, and 100 L/min. (A) 13 L/min. (B) 55 L/min. (C) 100 L/min.
Atmosphere 13 00717 g007
Figure 8. Cross-sectional pressure distribution of the airflow at three flow rates of 13 L/min, 55 L/min, and 100 L/min. (A) 13 L/min. (B) 55 L/min. (C) 100 L/min.
Atmosphere 13 00717 g008
Table 1. Numerical values related to changes in the average velocity value according to mesh size.
Grid Parameters Average Velocity (m/s)
Element Size (m) NodesElementsTop PlaneFront PlaneCenter Line
0.004 51,652197,2140.210770.905622.40075
0.003 62,219243,6830.219780.855322.58929
0.002 225,436659,9330.219050.749902.72969
0.001 1,111,9623,502,4590.199950.686052.79816
0.0009 1,416,5064,557,8110.200610.686002.79471
0.0007 2,672,9128,853,9020.203320.656862.80306
Publisher’s Note: MDPI stays neutral with regard to jurisdictional claims in published maps and institutional affiliations.

