Article

Analysis of the Characteristics of Ozone Pollution in the North China Plain from 2016 to 2020

1
College of Resource Environment and Tourism, Capital Normal University, Beijing 100048, China
2
Beijing Municipal Ecological and Environmental Monitoring Center, Beijing 100048, China
3
Satellite Application Center for Ecology and Environment, Beijing 100048, China
*
Author to whom correspondence should be addressed.
Atmosphere 2022, 13(5), 715; https://doi.org/10.3390/atmos13050715
Submission received: 19 April 2022 / Accepted: 27 April 2022 / Published: 30 April 2022
(This article belongs to the Special Issue Air Pollution in China)

Abstract

:
As a major gaseous pollutant, ozone (O3) adversely affects human health and ecosystems. In recent years, ozone pollution in China has gradually become a prominent issue, especially in the North China Plain (NCP). To study the long-term spatio-temporal variation patterns of O3 in the NCP, this study selected 230 monitoring stations in the NCP from 2016 to 2020 as research objects, used the Kriging interpolation method and global Moran’s index to discuss the spatial-temporal distribution of O3, combining meteorological and social statistical data to analyze the causes underlying regional differences. The temporal analysis demonstrated that the O3-8h average concentrations increased annually from 2016 to 2018 and decreased from 2019 to 2020. The O3 concentrations were higher in spring and summer (117.89–154.20 μg/m3) and lower in autumn and winter (53.81–92.95 μg/m3). The spatial analysis revealed that O3 concentrations were low in the north and south of the NCP but high in the central area. The spatial distribution of O3 exhibited considerable cross-seasonal variability. Both meteorological conditions of high temperature and low pressure increased O3 concentrations. The spatial distribution of O3 varied depending on the period. However, the central and western regions of the Shandong Province were constantly characterized by high O3 concentrations. This pattern has been likely formed by heavy industry in the Shandong Province, as large-scale industrial production and frequent traffic flows produce a large amount of precursors, thereby exacerbating regional O3 pollution. These characteristics were attributed to emission reduction policies, meteorological conditions, the emission intensity of anthropogenic sources, and regional transport in the NCP. Overall, for cities with heavy industrial facilities in the central NCP, a timely adjustment of the energy and industrial structure, effectively controlling the emission of precursors, promoting new clean energy, and strengthening regional joint prevention and control are effective ways to alleviate O3 pollution.

1. Introduction

Photochemical pollution is one of the major types of atmospheric environmental pollution in China. With rapid urbanization and industrialization, the problem of ozone pollution has recently become acute, thereby attracting the attention of atmospheric and environmental researchers [1,2]. As a secondary photochemical pollutant, near-ground ozone (O3) is mainly formed by photochemical reactions of precursors such as nitrogen oxides (NOx) and volatile organic compounds (VOCs) [3,4]. Unlike particulate pollution (e.g., aerosol pollution), O3 pollution is insidious; it occurs even in sunny weather, and its detection and quantification are challenging. These challenges must be alleviated as near-ground O3 concentrations, exceeding a certain threshold, can cause a series of adverse effects on human health, the ecological environment and crops [5,6]. At present, O3 has replaced fine particulate matter as the primary pollutant, inherently affecting the number of good air days in spring and summer [7,8]. O3 concentrations have already directly affected the ranking of cities based on urban air quality. Therefore, identifying the pollution characteristics and the related drivers is quintessential for formulating air pollution prevention and control strategies.
In the past, scholars usually studied O3 based on satellite data due to the lack of large-scale and long-term monitoring networks. For instance, Liu et al. [9] used OMI satellite data to analyze the trend of O3 changes in east-central China from 2005 to 2014. Zhang et al. [10] used satellite observations of tropospheric O3 data to assess the spatial distribution of O3 in China. Since 2013, the Ministry of Environmental Protection has been monitoring the pollutant on a large scale in China. Many studies are exploring O3 concentrations and distribution in various regions of China based on O3 data from monitoring stations, yielding a multitude of results. For instance, Meng [11] conducted O3 monitoring in 74 Chinese cities over 3 consecutive years. In particular, it has been previously reported that O3 concentrations had been increasing annually, and O3 pollution exhibited distinct regional patterns. Zhang et al. [12] obtained O3 concentrations data for the Chengdu-Chongqing urban agglomeration from 2015 to 2019 using monitoring station data to discuss the spatio-temporal variation patterns of O3 in the study region. In addition, the chemical transport model has been implemented to analyze O3 formation and transport. For instance, Li et al. [13] used the WRF/CMAQ model to simulate the response of PM2.5 and O3 to emission reduction policies in the Yangtze River Delta region. Guo et al. [14] examined the characteristics of O3 pollution, elucidating its sensitivity to emissions using isolines. They showed that NOx drives O3 concentrations in most areas of China, hinting that a reduction in NOx can substantially reduce the concentration of O3. Fundamentally, O3 pollution is not only affected by anthropogenic emissions but also by meteorological factors. On a meteorological scale, Wang et al. [15] argued that O3 concentrations were closely associated with meteorological conditions. High concentrations of O3 pollution were usually observed under strong solar radiation and low wind speed. Li et al. [16] concluded that O3 concentrations negatively correlated with relative humidity by analyzing the correlation between O3 and meteorological factors in 74 Chinese cities. Cui et al. [17] integrated O3 concentrations with dynamic meteorological factors in the Beijing–Tianjin–Hebei region and found that the O3 concentrations positively correlated with temperature and evaporation; however, there was a distinct regional difference in the wind direction and the wind speed.
The NCP is one of the most densely populated areas in the world. The Beijing–Tianjin–Hebei region has a large population and represents China’s political and cultural center, where the air pollution issue has become increasingly urgent [18]. The Jiangsu–Anhui–Shandong–Henan region in the southern part of the NCP is the connecting belt of air pollution in the Beijing–Tianjin–Hebei region and the Yangtze River Delta [19]. Only a few studies described the O3 pollution in the above areas, and the progress toward improving air quality is slow. With its rapid economic development, the NCP suffers from severe air pollution due to anthropogenic emissions, accumulation, and regional transmission [20]. Thus far, the lack of long-term research on the spatio-temporal characteristics of O3 constrains the progress in this regard. To address this gap, this study investigated the spatio-temporal distribution and drivers of O3 pollution in the NCP using data on O3 concentrations (from 230 air monitoring stations), meteorology (from 54 meteorological stations), and social factors between 2016 and 2020 to provide a reference for the management of O3 pollution.

2. Materials and Methods

2.1. Study Area

As shown in Figure 1, the North China Plain (NCP) is located between 32°–40° N and 114°–121° E along the east coast of China. It represents 1 of the 3 major plains in China, including Beijing, Tianjin, 9 cities in the Hebei Province, 15 cities in the Henan Province, 16 cities in the Shandong Province, 6 cities in the Anhui Province, and 5 cities in the Jiangsu Province. The names and abbreviations of all cities are shown in Table S1. The study area extends from the south foot of Yanshan Mountain in the north, Taihang Mountain and Funiu Mountain in the west, Dabie Mountain in the south, and the Bohai and Yellow Seas in the east. The total area of the study region is 300,000 km2. The topography is flat and low in altitude, with numerous rivers and lakes and a dense population. Most cities in the study area are characterized by a temperate monsoon climate, whereas a few provinces (such as Jiangsu and Anhui) have a subtropical monsoon climate. The four seasons of the study region have been changing significantly, driven by the monsoon climate. The region is characterized by hot and rainy summers, while winters are cold and dry. The precipitation mostly occurs between June and September. Notably, the region stands out with exceptional natural conditions, rendering it an important grain base and geographical space in China [21,22,23].

2.2. Data Source and Processing

The O3 data used in this study were obtained from the national urban air quality real-time release platform of the China National Environmental Monitoring Centre (http://106.37.208.233:20035/) (accessed on 6 May 2021). The daily surface monitoring data of O3 in the NCP from 2016 to 2020 were used. This study analyzed data from 230 sites within the study area. The selection was performed after removing the inactive sites and those with incomplete data. According to Ambient Air Quality Standards (GB 3095-2012), the daily maximum 8-h moving average of O3 is considered the actual O3 concentration (hereafter referred to as O3-8h). In addition, the daily arithmetic average of O3-8h in a calendar month is taken as the monthly average concentration. Note that it is implied that spring lasts from March to May, summer lasts from June to August, autumn lasts from September to November, and winter lasts from December to February of the following year. The quarterly average concentrations were calculated from the arithmetic average of the daily O3-8h concentrations. The arithmetic average of daily O3-8h concentrations in a calendar year was taken as the annual average concentration. The meteorological data were obtained from the China Meteorological Data Service Centre (http://data.cma.cn) (accessed on 12 May 2021). More specifically, temperature (TEM, °C) and air pressure (Pa, hPa) from 54 meteorological stations in the NCP from 2016–2020 were selected. The point of interest data for the plants were obtained from AutoNavi (https://amap.com/) (accessed on 1 August 2021). The administrative boundary vector data and the digital elevation model (DEM 500 m) data were obtained from the Institute of Geographical Sciences and Natural Resources Research, CAS (https://www.resdc.cn/) (accessed on 12 May 2021). To this end, the statistical data for 2016–2020 were obtained from the China Statistical Yearbook, China Urban Statistical Yearbook, China Environmental Statistical Yearbook, and the Local Statistical Bulletin of National Economic and Social Development (http://www.stats.gov.cn/tjsj/ndsj/, https://data.cnki.net/NewHome/Index) (accessed on 2 December 2021). The time described in this study is Chinese Standard Time (CST).

2.3. Statistical Methods

2.3.1. Kriging Interpolation

Kriging interpolation is fundamentally based on the variogram and basic assumption of a spatially related prior model. Given the dual characteristics of randomness and the structure of natural phenomena in space, the Kriging method can be utilized to quantitatively analyze environmental parameters [24,25]. It has been extensively used in numerous fields such as geology, meteorology, and remote sensing [26]. The Kriging interpolation method was utilized in this study to predict the spatial-temporal distribution of O3.

2.3.2. Spatial Autocorrelation Test

The first law of geography stipulates that the closer things are in space, the stronger their correlation, also referred to as “spatial autocorrelation” [27]. To elucidate the spatial distribution of O3, global Moran’s index I was utilized according to Equation (1):
I = N i j W i j ( X i X ¯ ) ( X j X ¯ ) ( i j W i j ) i ( X i X ¯ ) 2
where N represents the number of municipal administrative divisions, Xi and Xj represent the average value of O3 concentrations in administrative regions i and j, respectively; X ¯ represents the mean value of O3 concentrations in all administrative regions; and Wij represents the spatial weight matrix. The value range of I was considered [−1, 1]. Note that I < 0, I = 0, and I > 0 indicate a spatially negative correlation, the absence of correlation, and positive spatial correlation, respectively, whereas the closer I is to 1, the stronger the spatial correlation is.
To facilitate the interpretation, I is usually transformed into a standardized statistic, Z(I), using Equation (2):
Z ( I ) = [ I E ( I ) ] V a r ( I )
where Z(I) represents the significance level of the global Moran’s index, E(I) represents the expected value, and Var(I) represents the variance. In particular, Z < −2.58 indicates that O3 concentrations have a negative spatial correlation, and −2.58 < Z < 2.58 indicates that the spatial correlation is not significant. Finally, Z > 2.58 indicates the positive spatial autocorrelation of O3 concentrations [28,29].

3. Results

3.1. Characteristics of Ozone Time Variation

3.1.1. Interannual Variation Characteristics

According to the Ambient Air Quality Standard (GB 3095-2012), the first-level standard limit of the maximum 8-h average concentrations of O3 per day is 100 μg/m3, while the secondary level standard is 160 μg/m3. On this basis, our study considered the secondary standard limit concentrations as the threshold, implying that when O3-8h is >160 μg/m3, the standard is exceeded. The annual statistics for O3-8h are provided in Table 1. As seen, the annual average concentrations of O3 from 2016 to 2020 were 97.84 ± 4.55, 107.96 ± 5.40, 110.28 ± 5.82, 108.05 ± 4.94, and 104.04 ± 8.87 μg/m3, respectively.
By ranking the average O3 concentrations in the NCP, the following order was identified: 2018 > 2019 > 2017 > 2020 > 2016. O3 concentrations exhibited an increasing trend since 2016, peaked in 2018, and then gradually decreased. We suggest that the change in O3 concentrations after 2018 is closely related to the following environmental policies. In 2017, China issued “The 2017 work plan for air pollution prevention and control in Beijing, Tianjin, Hebei, and surrounding areas”, which urged Beijing–Tianjin–Hebei and surrounding cities to adjust their industrial structure; banned small, scattered polluting enterprises; and actively promoted the substitution of clean energy, such as electricity and natural gas, for coal. These measures bolstered the efficiency of treatment of industrial air pollution, strengthened the control of motor vehicle emissions, and tightened NOx emissions control.
The analysis of the statistical yearbook data indicated that the total NOx emissions in the study area remarkably decreased in 2018. Namely, the total NOx emissions decreased by 21.34% compared with 2017. The total NOx emissions in 2019 and 2020 also exhibited a downward trend, with decreases of 26.57% and 48.14%, respectively, compared with 2017. In 2018, China also issued “The Action Plan for Comprehensive Treatment of Air Pollution in Autumn and Winter from 2018 to 2019 in Beijing, Tianjin, Hebei, and surrounding areas”, which put forward special treatment of VOCs in key industries for the first time and achieved its first tangible results by 2019 [30]. Given the efficient control of the emissions of O3 precursors, the average O3 concentrations decreased. Notably, O3 concentrations declined in 2020. We argue that this concurrent reduction was attributed to the reduction in industrial production and anthropogenic activities under the measures enforced to control and prevent the spread of COVID-19 in China in 2020 [31].

3.1.2. Seasonal Variations

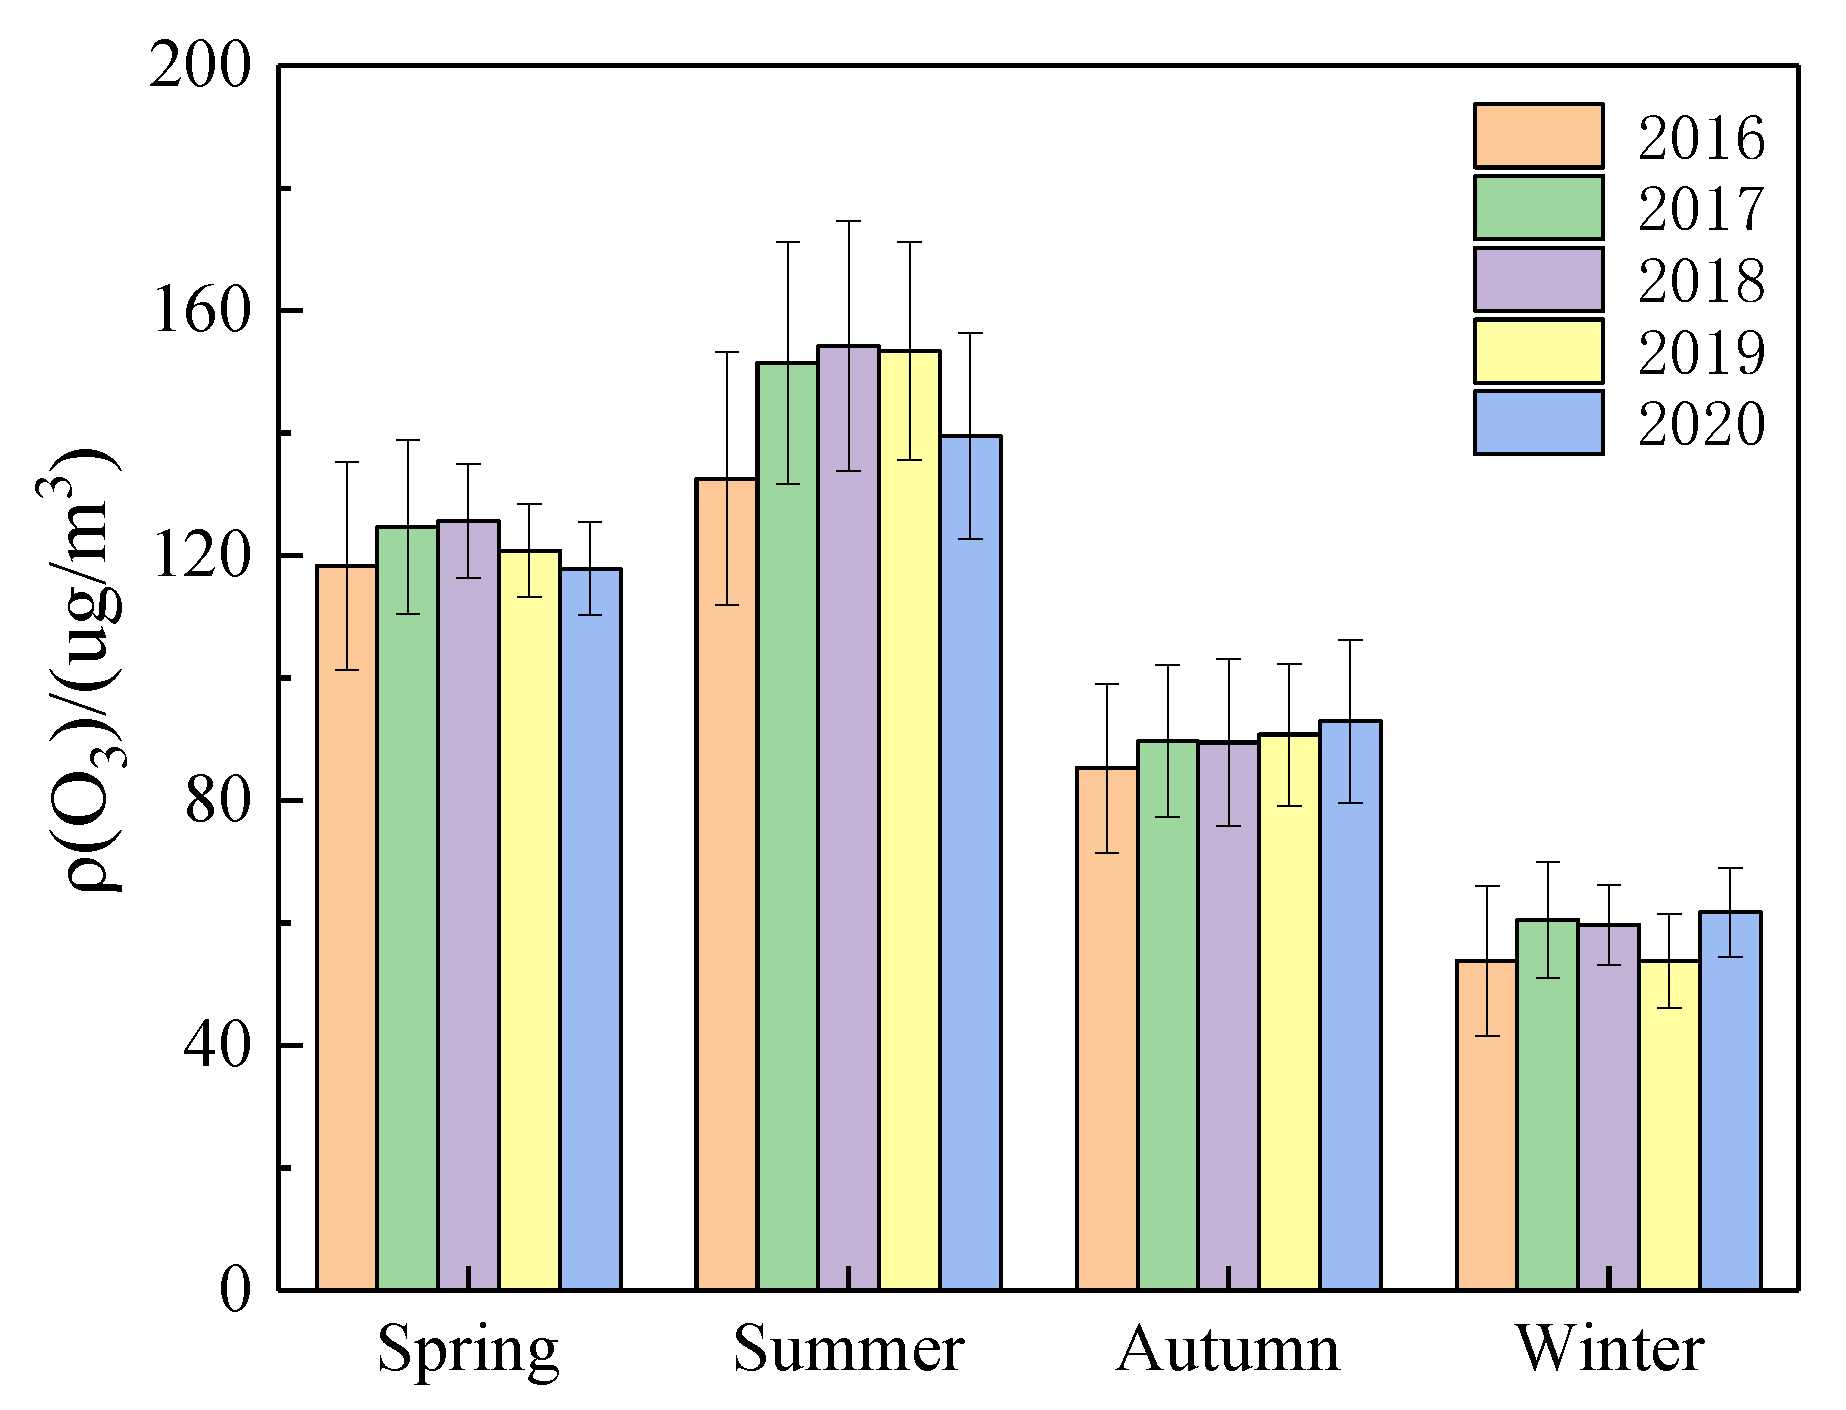
The seasonal variations in the O3 concentrations from 2016 to 2020 are shown in Figure 2. As shown, the variation trend of O3 average concentrations was approximately the same in different years in the NCP. Moreover, O3 concentrations gradually increased during spring, peaked in summer (132.53–154.20 μg/m3), and decreased gradually in autumn and winter, reaching the lowest value in winter (53.81–61.75 μg/m3). The seasonal variation characteristics of O3 concentrations were ranked in the following order: summer > spring > autumn > winter. Overall, O3 pollution mainly developed in summer, as higher concentrations were identified in spring and summer, while lower concentrations were observed in autumn and winter.
The changes in O3 concentrations are fundamentally closely related to meteorological conditions. The photochemical reaction process can be formalized by Equations (3)–(5) (see below) [32,33]. The main process is NO oxidation by atmospheric oxidants to generate NO2, whose photolysis generates O3. Temperature and solar radiation play important roles in the formation and transport of O3. For instance, Xu, et al. [34] reported that O3 concentrations positively correlated with temperature and the intensity of solar radiation because intense solar radiation and high temperature promoted the photochemical reaction process. We found that the temperature in the NCP gradually increased from spring, while summer was characterized by the strongest solar radiation and highest temperature throughout the year. Therefore, this period was the most conducive for O3 formation, whose concentrations reached the highest level. In autumn and winter, the solar radiation intensity and irradiation time gradually weakened. Thus, O3 concentrations gradually dwindled, reaching the lowest value in winter. We identified only a slight difference in temperature between spring and autumn. However, O3 concentrations in spring were significantly higher compared with those in autumn due to the influence of more precursors, drought, and less precipitation in spring:
NO + O3→NO2 + O2
NO2 + hv→NO + O
O + O2→O3

3.2. Spatial Distribution Characteristics of O3

3.2.1. Spatial Aggregation Characteristics

To analyze the spatial aggregation and trends of O3, we performed a global spatial autocorrelation analysis of the average annual O3 concentrations. As a result, we obtained Moran’s I and Z values. Table 2 demonstrates that Moran’s I from 2016 to 2020 were 0.17, 0.36, 0.45, 0.45, and 0.51, respectively, while Z values were all >2.58 with an upward trend (p < 0.01). This indicates that the administrative units with high O3 concentrations or those with low O3 concentrations were significantly clustered in space (e.g., they are spatially positive). The O3 spatial aggregation increased annually in recent years. We noted a strong spatial autocorrelation and possible spatial aggregation.
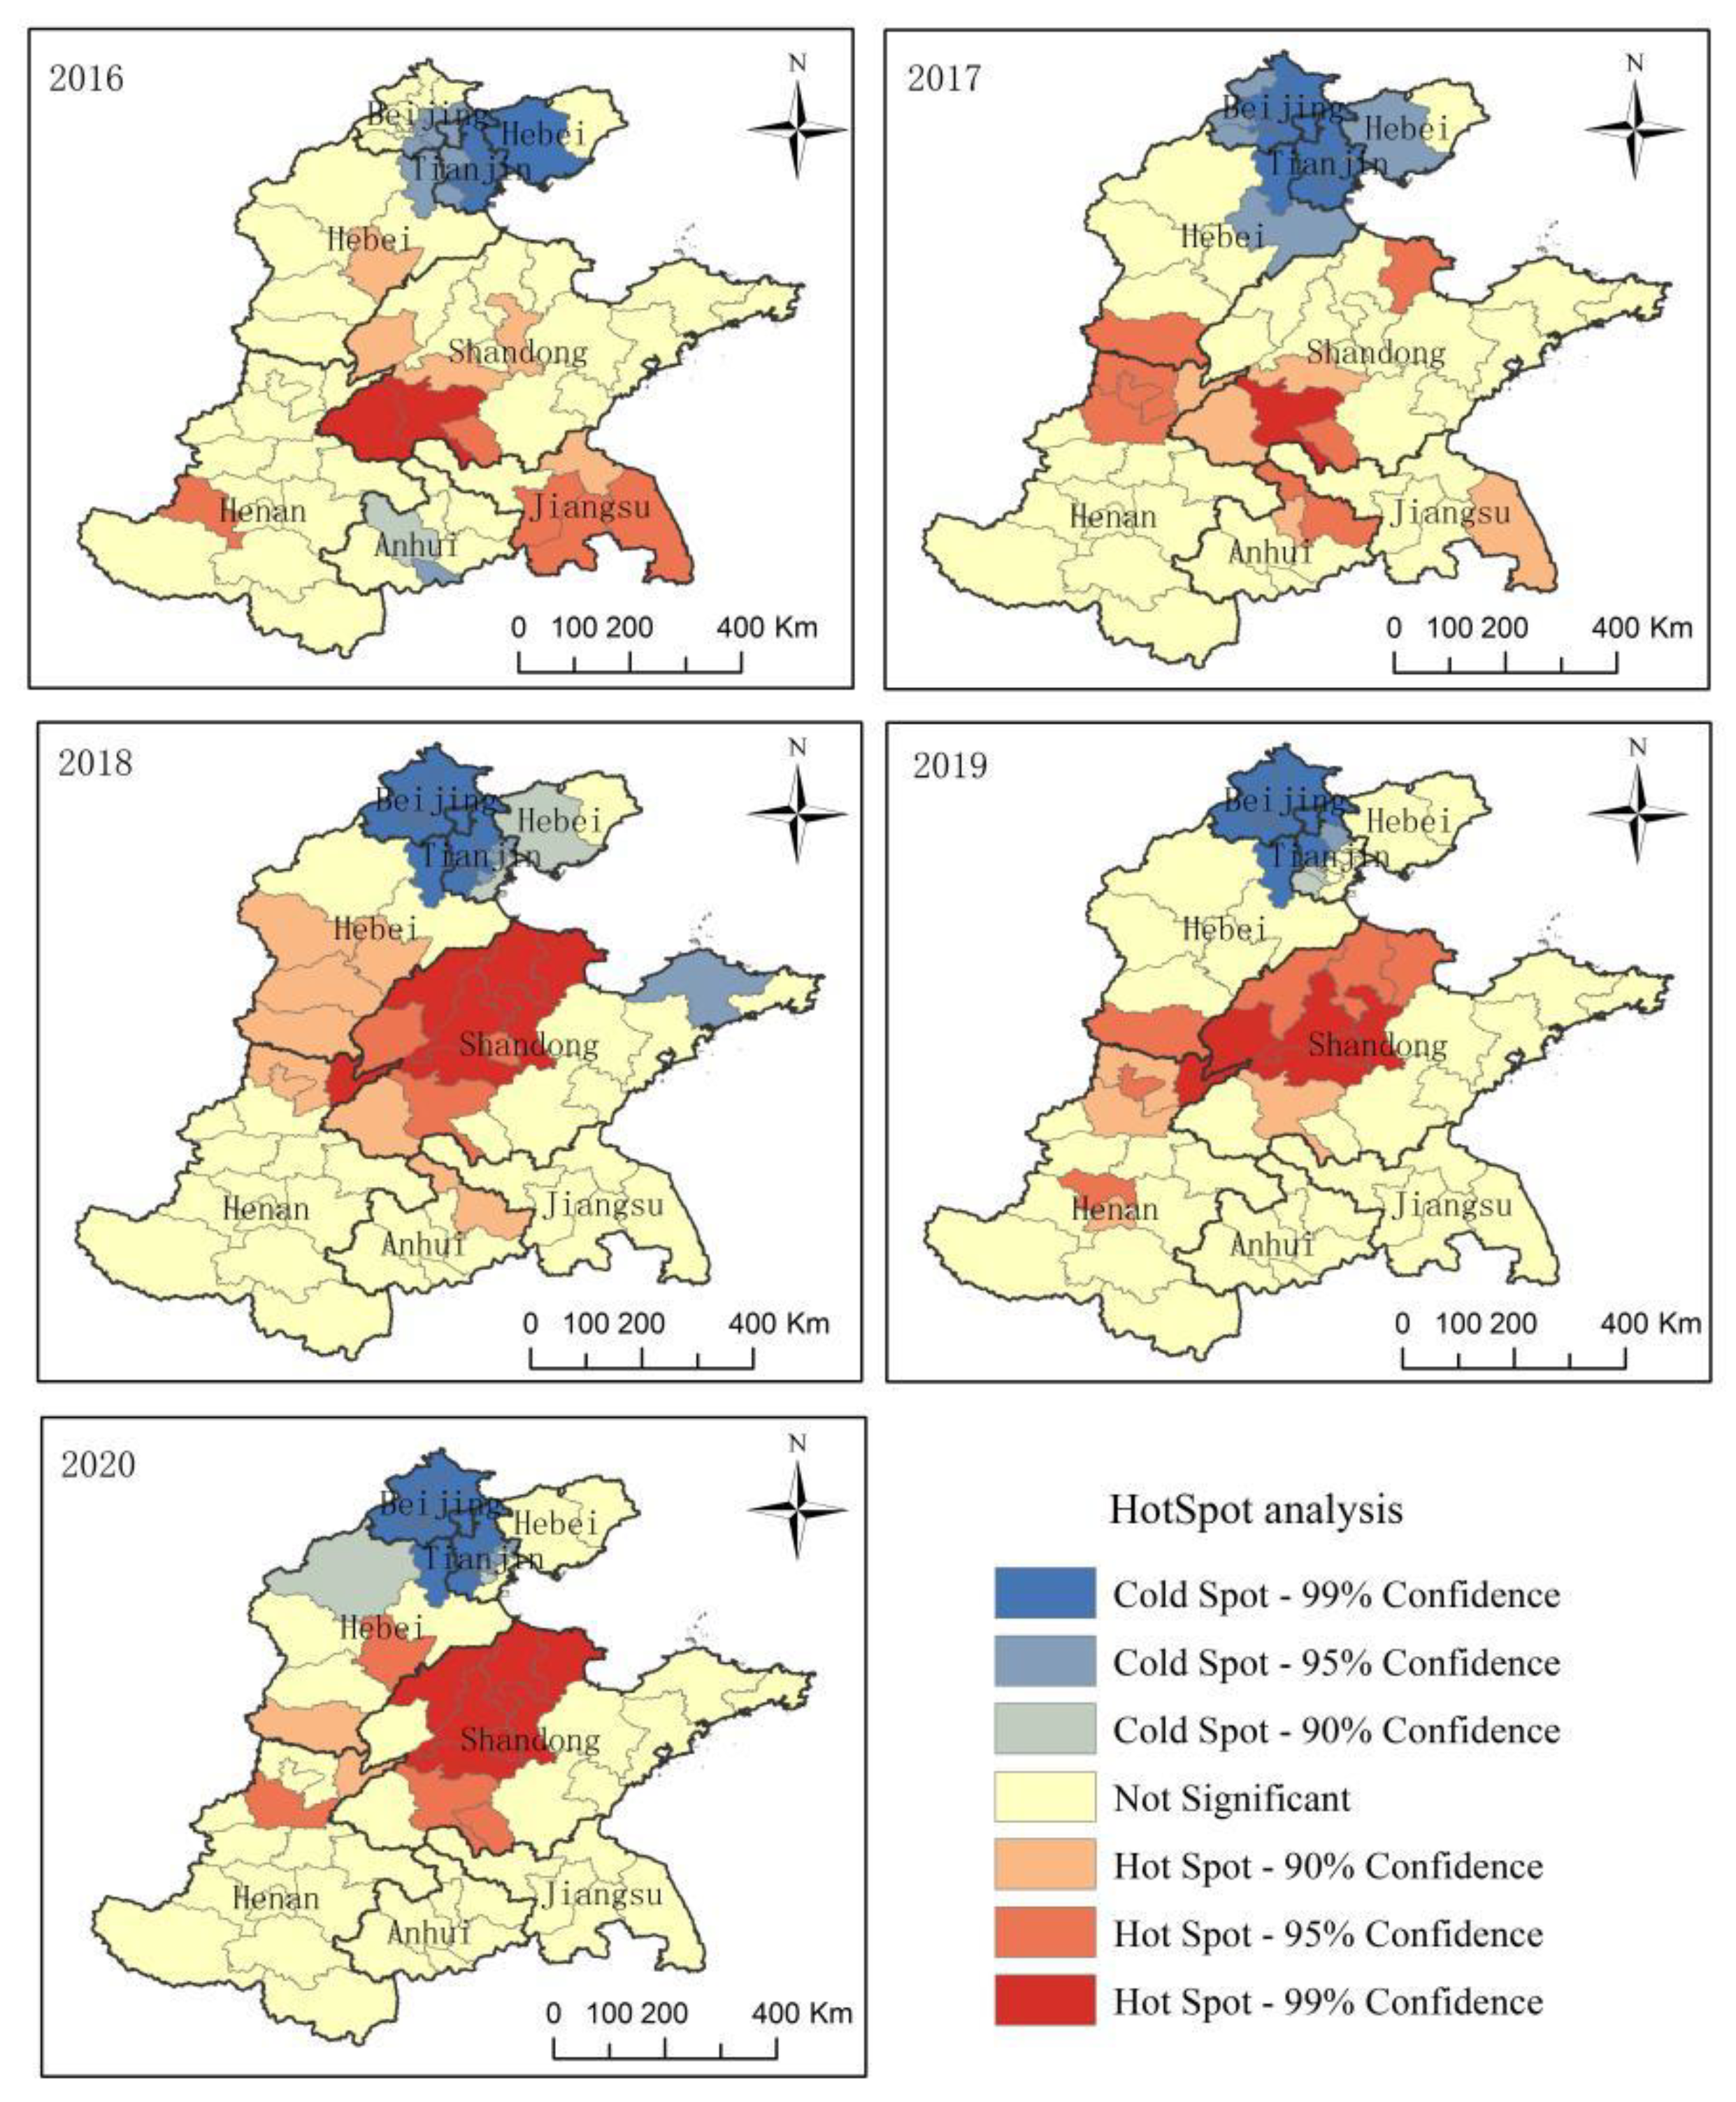
To further discuss the spatial aggregation of O3 concentrations, this study analyzed the cold hotspot map for O3 concentrations in the NCP; the results are shown in Figure 3. As shown in the figure, the hotspots in the NCP in 2016–2017 were mainly concentrated in the southwestern area of Shandong bordering Henan and Anhui Province. Jiangsu Province was also relatively concentrated. From 2018 to 2020, hotspots were concentrated in the western part of Shandong Province and the junction area of Henan Province and Hebei. From 2016–2020, cold spots were concentrated in Beijing, Tianjin, and surrounding areas, while the agglomeration in other areas was not prominent. Furthermore, after 2016, the spatial correlation of O3 in the western part of Shandong became increasingly more pronounced, and the aggregation characteristics were the most prominent in 2018, showing the clustering characteristics of the Hebei–Henan–Shandong–Anhui region. Overall, the comprehensive 2016–2020 trends of O3 spatial aggregation changes show that the western area of Shandong bordering other provinces forms a stable high-value aggregation feature, whereas Beijing, Tianjin, and the surrounding areas form a stable low-value aggregation. These two parts of the regional spatial correlation of O3 concentrations were substantial and not easily influenced by other regions.

3.2.2. Annual Variation of the Spatial Distribution of O3

The spatial distribution of O3 in the NCP is shown in Figure 4. As shown, the spatial distribution of O3 was approximately the same and consistent with the spatial aggregation trend (Figure 3) from 2016 to 2020. Overall, the study area exhibited a spatial variation trend characterized by low O3 concentrations in the north and south and high concentrations in the central area. Among these, O3 concentrations in the west of the Shandong Province and the junction of the Jiangsu, Shandong, Hebei, Henan, and Anhui provinces were high, with a maximum value of 120.79 μg/m3. This area was characterized by high O3 concentrations, which are related to the presence of industrialized cities in the region. Meanwhile, the O3 concentrations in Beijing, southern cities of Henan Province, Anhui Province, Jiangsu Province, and coastal areas of Shandong Peninsula were low, with the lowest value being 85.58 μg/m3. Furthermore, O3 concentrations in the study area significantly increased from 2016 to 2018, while the high-value area of O3 concentrations gradually expanded. In 2019, O3 concentrations in Jiangsu Province and some surrounding cities in the south of the NCP decreased. In 2020, the pattern changed, and the overall O3 concentrations in the study area decreased. In previous years, O3 concentrations in Henan and Hebei Provinces with higher O3 concentrations significantly decreased, while some areas with high concentrations persisted in the central and western regions of the Shandong Province.
Precursors are essential for O3 formation. The sources of O3 precursors can be fundamentally divided into natural and anthropogenic sources. Natural sources include soil, lightning, and plant emissions, while anthropogenic sources include motor vehicle exhaust, coal combustion, and industrial and power plant emissions [35]. As the compilation of the VOC source emission inventory was delayed and underwent changes every year, no latest VOC source emission data were available for 2020. Due to this, the NOx emissions data were taken as the measurement index of precursors. Note that, as a precursor of O3, the NOx concentration is closely related to that of O3 [36,37]. The total NOx emissions comprise industrial, motor vehicle, and domestic emissions. According to data from the China Environmental Statistics Yearbook (2019), industrial and motor vehicle emissions account for more than 90% of the total emissions in China. Since municipal-level data on NOx emitted by motor vehicles were not available, industrial NOx emissions and civil vehicle ownership were selected as relevant indicators to measure the change in O3 concentrations. Given the lack of statistical data for some years, we considered the data of industrial NOx emissions in 2017 and civil vehicle ownership in 2019 as examples to shed light on the impact of O3 precursors on the spatial distribution of O3. The results are shown in Figure 5.
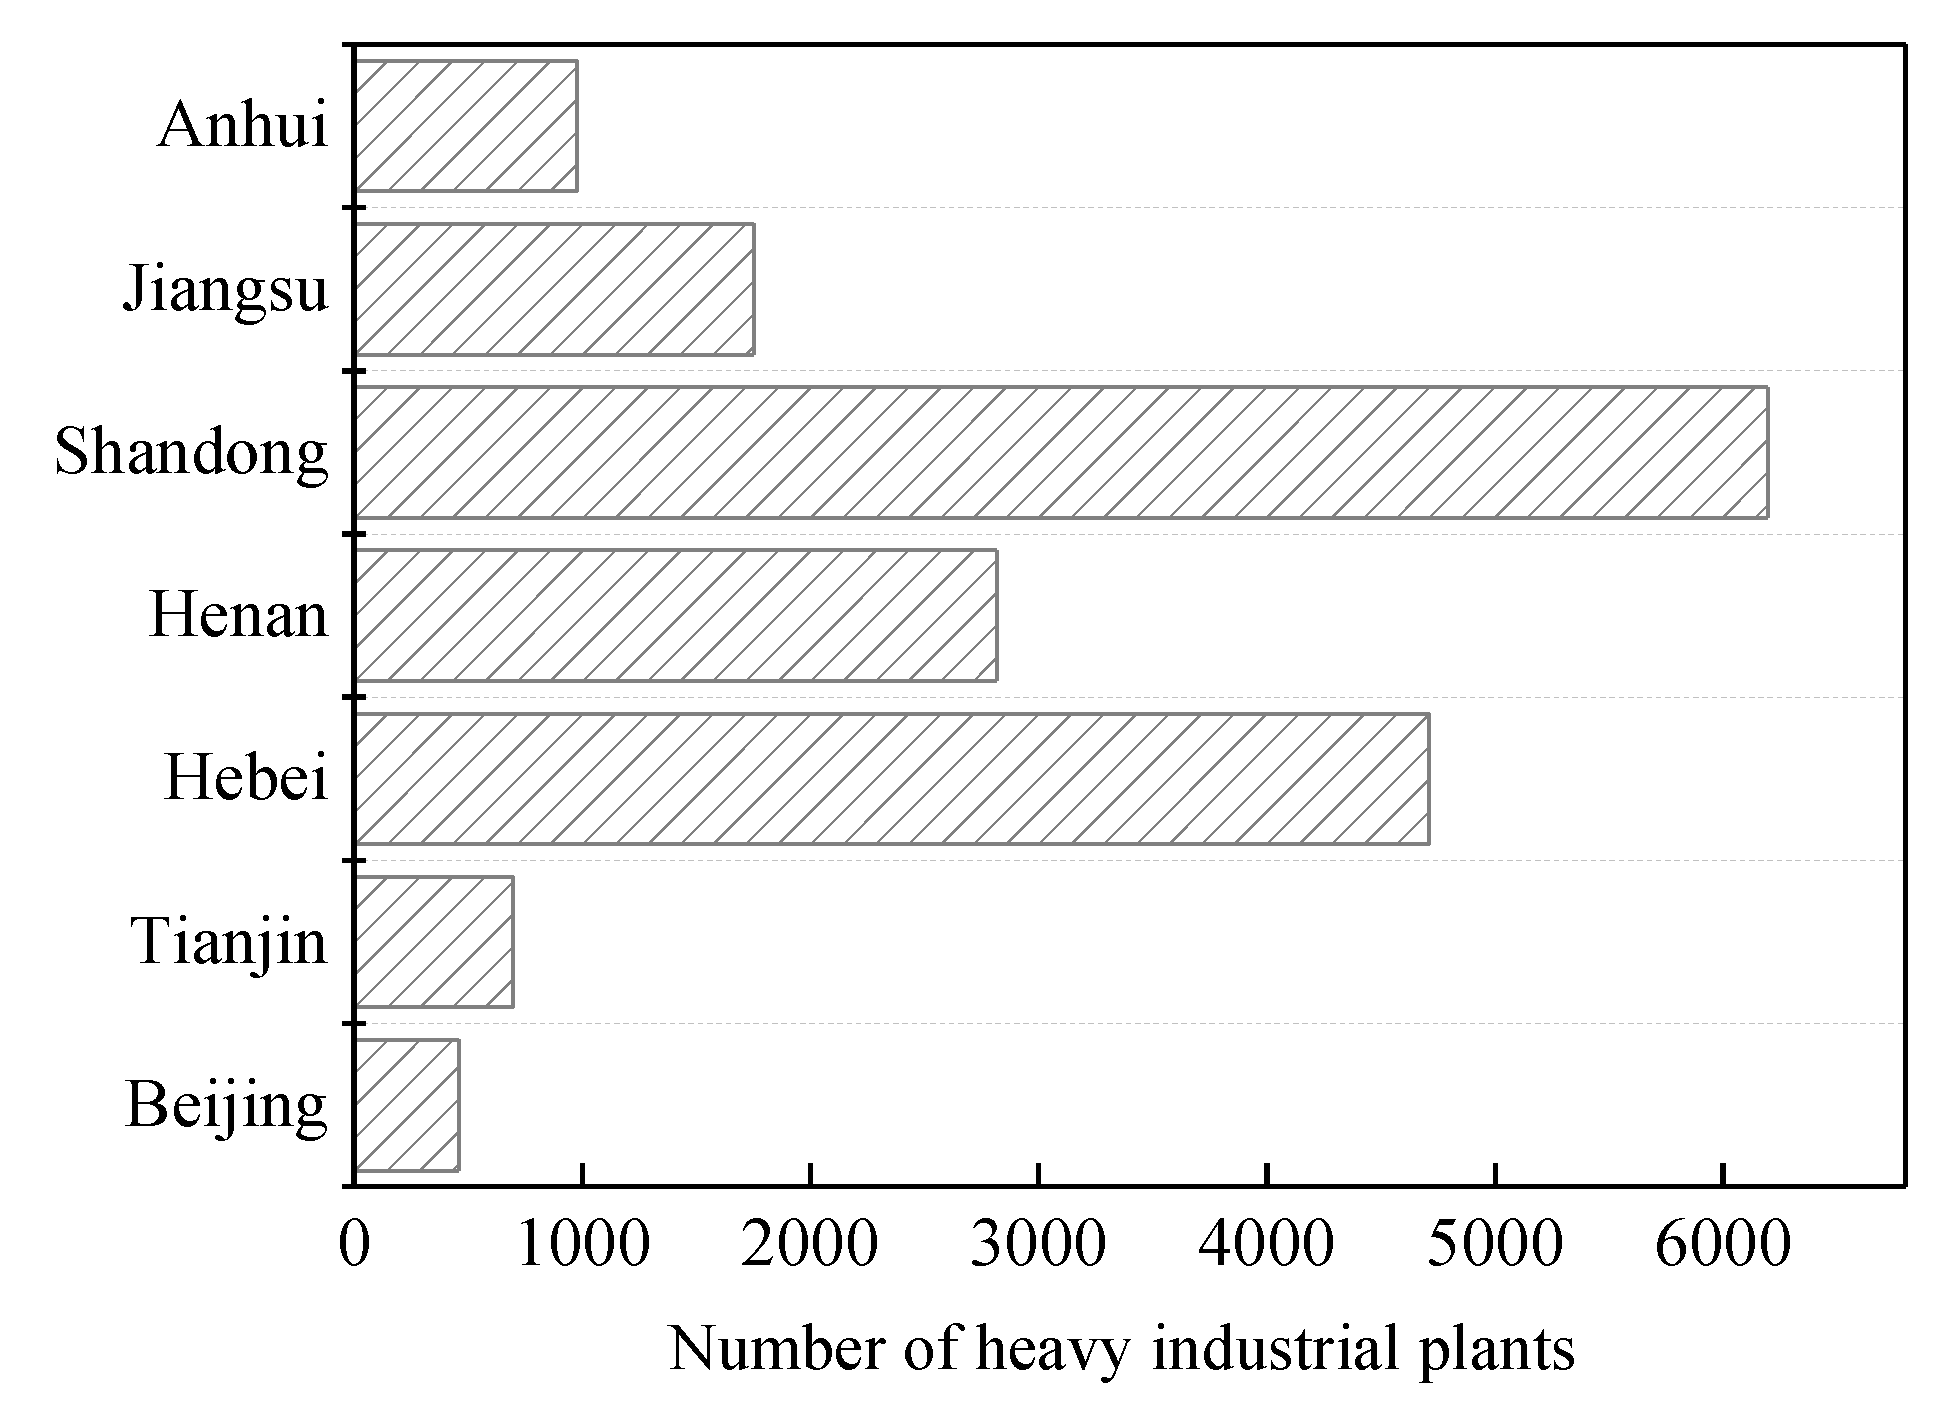
Figure 5a shows the civilian car ownership map. As seen, the car ownership in Beijing–Tianjin–Hebei is generally high. The capital city of Beijing, being the political and cultural center of China, is characterized by the highest car ownership of 5.908 million, followed by Zhengzhou (Henan Province), with car ownership of 3.814 million. Jinan, Linyi and the Shandong Peninsula are also characterized by high car ownership. This pattern is driven by the population density of the Beijing–Tianjin–Hebei urban agglomeration. The area is large, and the degree of social and economic development is also high. As a highly populated province, the Shandong Province had a population of >100 million people in 2017 (Chinese Statistic Year, 2018), and motor vehicles were used extensively. As a result, these regions are characterized by the largest car ownership, whereas car ownership in most regions of the Henan and Anhui Provinces is low (the lowest car ownership is equal to 282,300 in the Hebi City of the Henan Province). The distribution map of industrial NOx emissions (Figure 5b) indicated that Tianjin, Tangshan, Qinhuangdao, southern Hebei Province, and central Shandong Province, such as Binzhou and Zibo, and other cities had higher industrial NOx emissions. Of these administrative units, Tangshan was characterized by the strongest annual emissions (196,572 tons/year), followed by Tianjin (73,249 tons/year). These cities are heavily industrialized with an economy focused on structure, metallurgy, chemical industry, building materials, and high-energy consuming industries, causing emissions of large amounts of pollutants. However, in the southern part of the study area (the Henan and Anhui Provinces), the emissions of industrial NOx were relatively low, with the lowest value being 2296 tons. Moreover, the emissions of industrial NOx in Beijing and the Shandong Peninsula were also relatively low. We combined the number of heavy industrial plants in each province in the study area, shown in Figure 6, and showed that Shandong Province had the largest number of heavy industrial plants, followed by Hebei Province. We argue that this is a manifestation of the convergence of the industrial structure between the provinces and the cities in Beijing–Tianjin–Hebei and the surrounding areas.
Combined with the analysis results in Figure 4, the areas with high O3 concentrations were mainly clustered in the central and western regions of Shandong Province, the southern part of Hebei Province, and the junction of Jiangsu, Shandong, Henan, and Anhui Provinces. This finding is in line with the regions characterized by a large number of motor vehicles and large industrial NOx emissions. However, although Beijing and Tianjin were characterized by a large number of motor vehicles, the O3 concentrations in the area remained low. This pattern was driven by the strict motor vehicle emission reduction policies implemented by key cities such as Beijing and Tianjin, which effectively controlled the pollution of motor vehicle emissions [38]. Generally, precursor emissions are closely related to O3 concentrations [39]. Large-scale industrial production and massive traffic flow lead to larger NOx emissions. Namely, the greater the NOx emissions in the region, the more conducive the photochemical reaction conditions are and the greater the O3 concentration. However, the Qinhuangdao City (Hebei Province) was characterized by a large amount of industrial NOx emissions, and the Shandong Peninsula had a large number of motor vehicles. Thus, one could anticipate that more emissions of precursors could emerge in these areas, and O3 concentrations would inevitably increase. Nevertheless, O3 concentrations remained at a moderately low level. As these cities are close to the ocean and experience good atmospheric diffusion conditions, clean ocean air masses moderately exert a dilution effect on local pollution sources.

3.2.3. Seasonal Variation of O3 Spatial Distribution

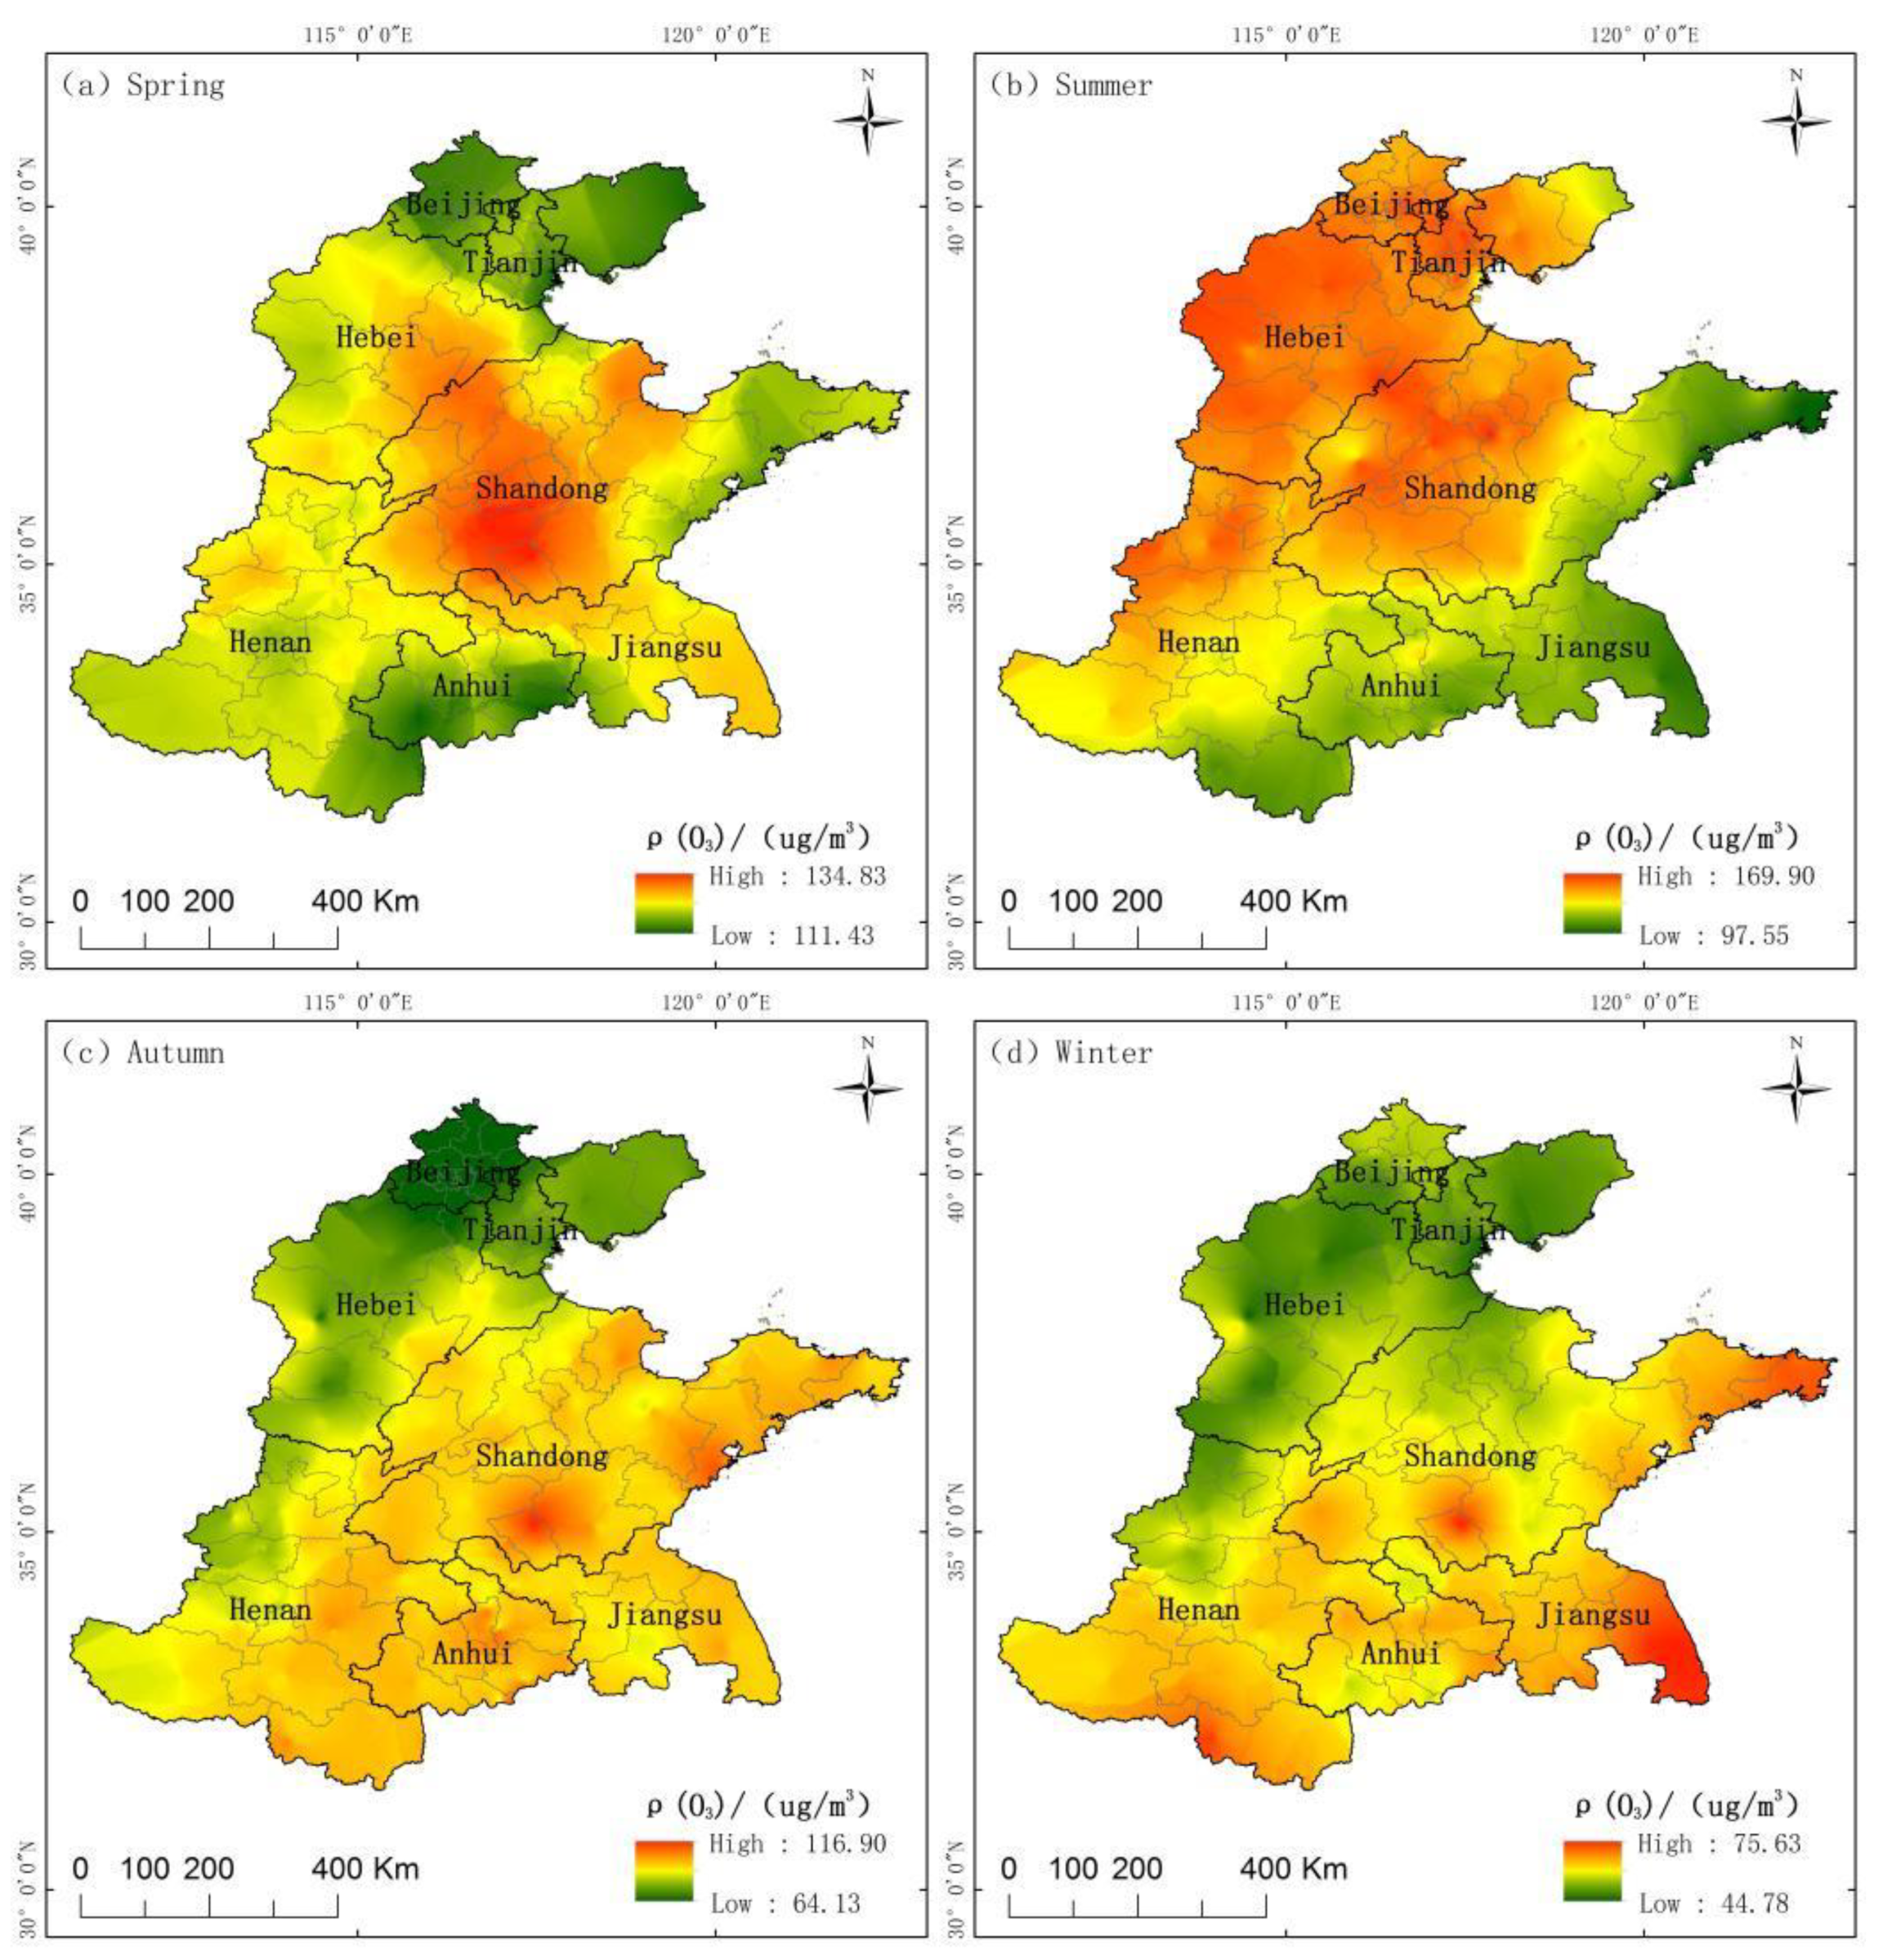
The O3 concentrations in the NCP significantly changed during all seasons from 2016 to 2020. Furthermore, the seasonal-scale spatial distribution of O3 is shown in Figure 7. In spring, the cities in the northern part of the NCP (such as Beijing and Tianjin) were characterized by the lowest O3 concentrations, with the lowest value of 111.43 μg/m3. O3 concentrations in the southern Anhui Province were also low. The high O3 concentrations areas were mainly concentrated in the southwest part of the Shandong Province, junction cities between the west of Shandong Province and the southeast of Hebei Province, with a maximum of 134.83 μg/m3. In summer, O3 concentrations in the study area were high, with widely distributed high-concentration areas. The high-value areas of O3 were mainly clustered in the Beijing–Tianjin–Hebei urban agglomeration, western Shandong Province, and northern Henan Province, with a maximum of 169.90 μg/m3. O3 concentrations in the Shandong Peninsula, Anhui, and Jiangsu provinces to the south of the NCP were relatively low, with the lowest value of 97.55 μg/m3. In autumn, O3 concentrations distribution exhibited the low concentrations pattern in the north and the high concentrations in the south. O3 concentrations in the Beijing–Tianjin–Hebei urban agglomeration were the lowest, with the lowest value of 64.13 μg/m3, while in southern Shandong Province and Anhui Province, they were higher, with a maximum of 116.90 μg/m3. In winter, O3 concentrations in the study area were lower than those in other seasons. Moreover, O3 concentration generally exhibited a trend of low concentrations in the north and high concentrations in the south. From a regional perspective, O3 concentrations in eastern coastal cities were the highest, with a maximum of 75.63 μg/m3, while O3 concentrations in the Beijing–Tianjin–Hebei urban agglomeration were low, with the lowest value of 44.78 μg/m3. Overall, although the regional distribution range of high O3 concentrations exhibited a certain degree of seasonal variability, the central and western parts of Shandong Province were always characterized by high concentrations. This pattern is attributed to the developed industrial structure of the heavy industry in Shandong Province.
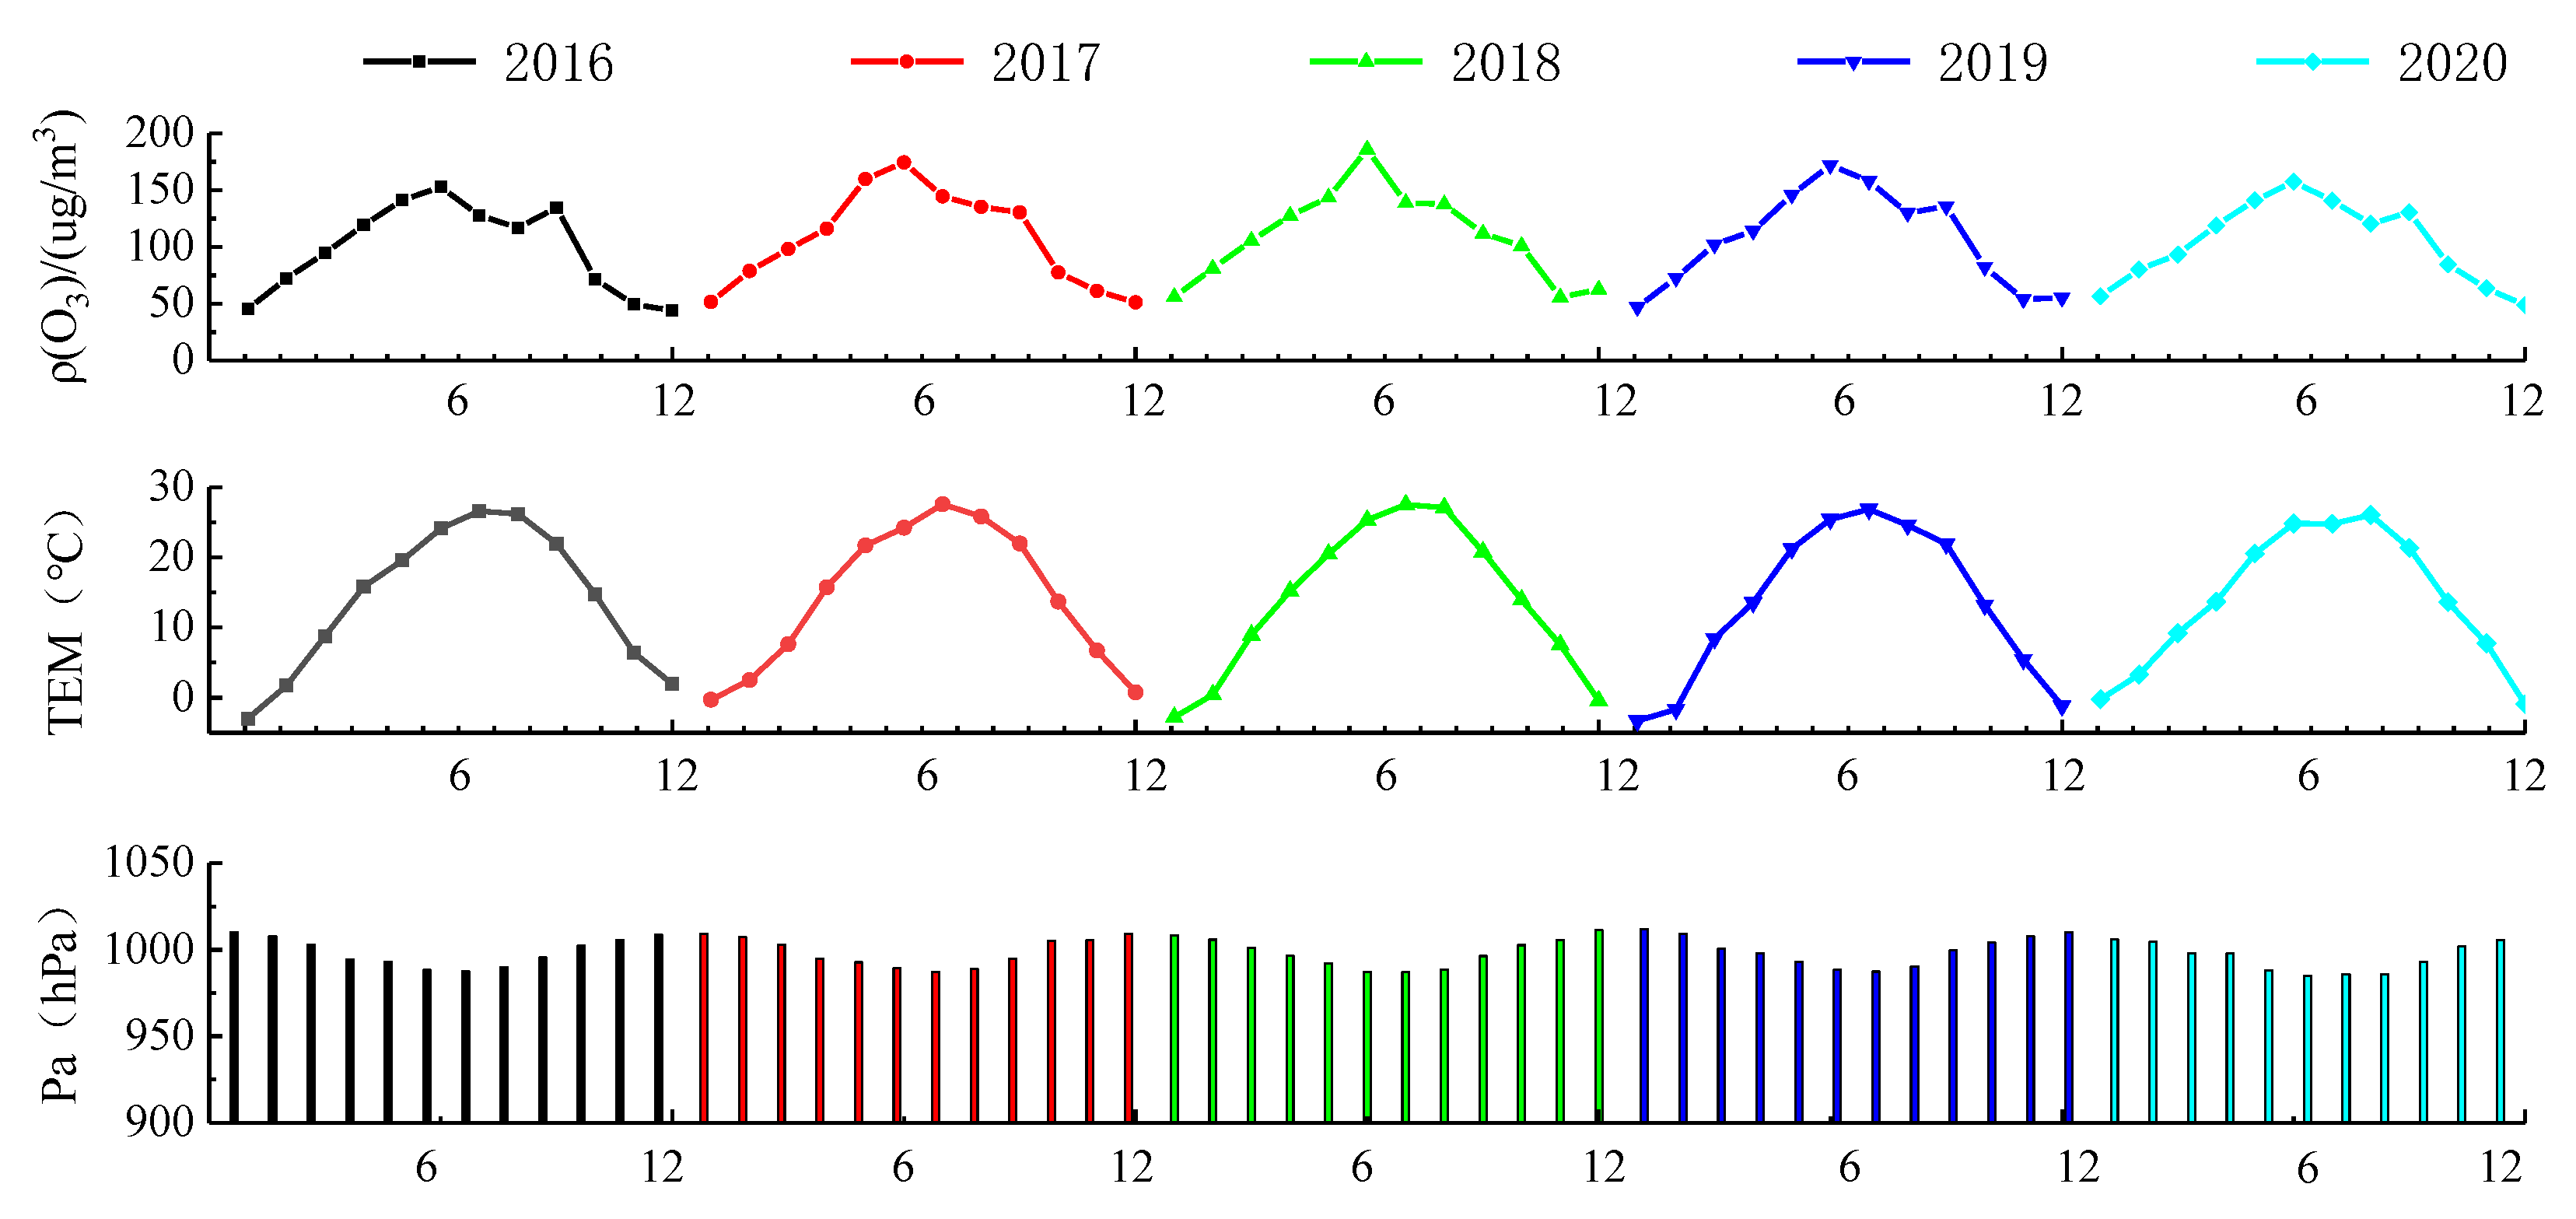
If we consider only the impact of precursor emissions, the spatial distribution of O3 in different seasons reveals the same trend. However, due to the differences in the spatial distribution of O3 in the four seasons, meteorological conditions must be considered to analyze their impact on the regional differences in O3. The variations in O3 concentrations and meteorological conditions are shown in Figure 8. As shown, the annual variation trends in O3 concentrations, average temperature, and average air pressure in the NCP were nearly the same from 2016 to 2020. To study the relationship between meteorological conditions and O3, the daily O3 concentrations and excessive rate were statistically analyzed under different meteorological conditions using 2020 as a typical study year. As shown in Figure 9, when the temperature was greater than 30 °C, O3 concentrations were the highest, and the excessive rate reached 32%; when the temperature was less than 0 °C, O3 concentrations were 54.47 μg/m3, and the excessive rate was 0%. Particularly, the higher the temperature, the greater the O3 concentration and the excessive rate. When the air pressure was in the range of 1000–1013.25 hPa, O3 concentrations were high, with a maximum value of 116.52 μg/m3, and the excessive rate reached 15%. When the air pressure was greater than 1020 hPa and less than 990 hPa, the O3 concentrations were lower, and the excessive rate was 0% at this time. In general, the O3 concentrations and excessive rate were rather higher under low air pressure meteorological conditions (Pa < 1013.25 hpa standard atmospheric pressure). This trend was driven by the following phenomenon: When the near-ground air pressure is low, O3 is horizontally transported from the surroundings to the low-pressure area. The O3 and its precursors converge in the low-pressure area, increasing the O3 concentration. At the high pressure near the ground, O3 diffuses into the surroundings. Moreover, the lower the air pressure, the higher the O3 concentration [40] and vice versa.
To this end, we analyzed the meteorological conditions in the study area to elucidate the drivers behind the regional differences in O3 concentrations in different seasons. We found that, in spring, O3 concentrations were low in large areas, particularly in the northern, southern, and eastern coastal cities of the NCP. However, O3 concentrations were high in the central and western cities of the Shandong Province. At this time, there was only a minor difference in the average temperature and other meteorological conditions between the provinces in the study area. The regional difference was driven by abundant heavy industrial cities in central and southwest Shandong and due to large energy consumption. This, in turn, enhanced the emission of pollutants. At the same time, the central area of Shandong is a mountainous and hilly area, where the complex terrain is conducive to the accumulation of pollutants. Therefore, being affected by the industrial structure and topography of this region, O3 pollution has been more severe compared to other cities [41].
We found that, in summer, the concentration of O3 in the Beijing–Tianjin–Hebei urban agglomeration and its surrounding areas was high. On the one hand, as the core economic zone of China, the Beijing–Tianjin–Hebei urban agglomeration stands out with a large population density, rapid industrial development, high economic development [42,43], strong urban heat island effect, and higher temperature compared with other regions. Note that high temperatures are conducive to the generation of O3. On the other hand, some previous studies [44,45] argued that given the complex and regional characteristics of the Beijing–Tianjin–Hebei region, the regional transport of pollutants is prevented. In summer, the O3 concentrations in the Beijing–Tianjin–Hebei region and cities such as Jinan, Zibo, and Liaocheng in western Shandong Province are relatively high. At the same time, the southeast wind prevails in the northern cities, and the high O3 concentrations areas are more likely to spread to the northwest, which may lead to the formation of a high O3 concentrations cluster northwest of the NCP.
In autumn, given the difference in latitude, cities in the southern part of the study area experienced strong solar radiation and high temperatures, which provided favorable conditions for the generation of O3. The concentrations of O3 were generally high in the south and low in the north. In winter, the northern part of the study area was closer to the high-pressure center in Asia, and the weather conditions were stable. O3 generation is affected by the latitude and heat; the temperature and O3 generation rate in the northern part were lower than those in the southern region, and the O3 concentrations reached their lowest in a year. However, similar spatial distribution characteristics (low in the north and high in the south) were still evident. Geographically, the coastal areas of the Shandong Peninsula and the Yancheng City of the Jiangsu Province were characterized by the highest O3 concentrations, possibly caused by external transport and ship-driven pollution [46].

4. Discussion

Previous studies have mostly discussed the spatial and temporal distribution characteristics of O3 in major urban groups in China, but there are fewer studies on long-term O3 monitoring and regional causal analysis in the NCP. Therefore, we used the ground monitoring station data to make spatial-temporal distribution maps of O3, combined with the statistical data of each administrative unit, and discussed the influencing factors of O3 pollution in a comprehensive manner. This study can provide a reference for O3 prevention and control in the NCP.
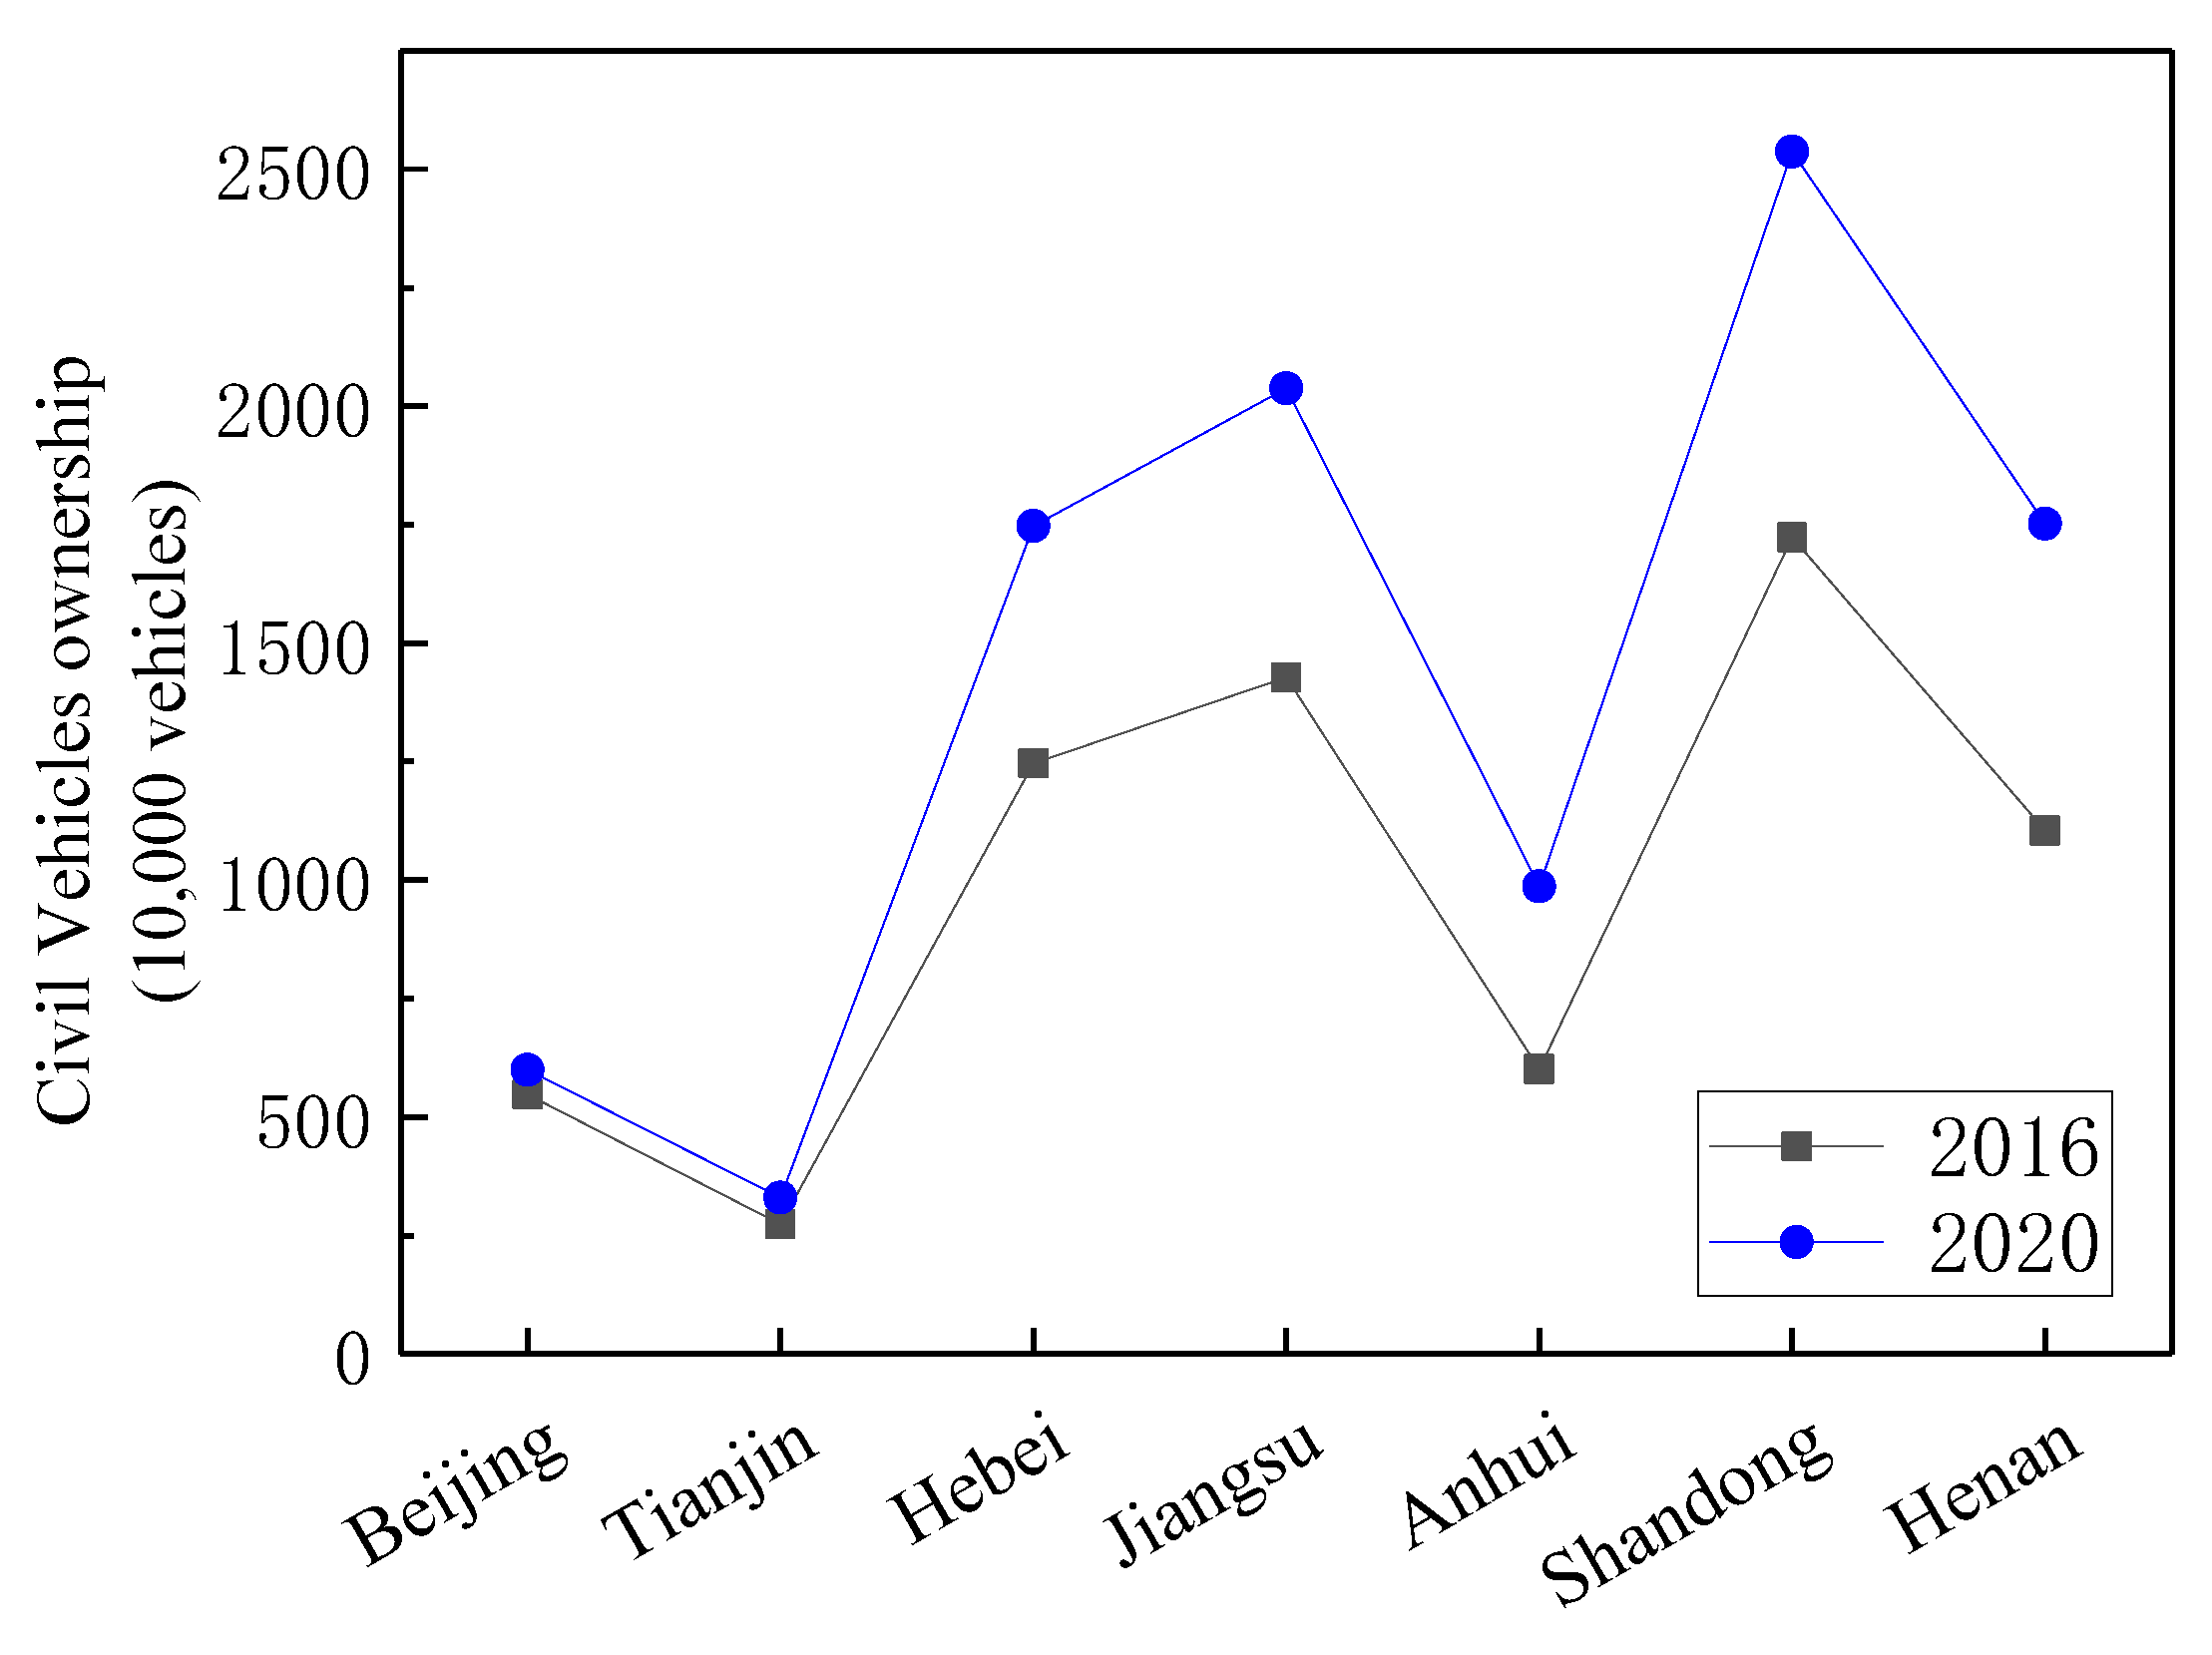
The annual variation in O3 showed that, compared with the previous two years, O3 concentrations moderately decreased by 2020, but O3 pollution was still severe compared with that in 2016. We argue that this pattern is related to high emission intensity of anthropogenic sources. The NCP is rich in mineral resources and coal, but the proportion of energy consumption is unbalanced. Due to this, the industrial structure is unreasonably unsustainable, being characterized by high energy consumption and highly polluting industries, such as metallurgy and building materials, which are common in the region. Moreover, heavily polluting enterprises are highly concentrated in the border areas of the Hebei, Shandong, and Henan provinces. Industrial production inevitably triggers the emission of pollutants, except in Beijing, where the industrial structure, similar to other cities, is low [30]. Figure 10 shows the number of civilian vehicles from 2016 to 2020. It can be seen that the number of civilian vehicles in seven provinces in the study area annually increased from 2016 to 2020. Compared to 2016, the number of civilian vehicles increased by 9.47% in Beijing, 20.36% in Tianjin, 40.24% in Hebei, 58.59% in Henan, 47.22% in Shandong, 64.20% in Anhui, and 42.73% in Jiangsu. In 2020, the number of vehicles in Shandong Province reached 25.524 million. Moreover, there is a large freight volume in the study area, and the transportation structure is mainly represented by highways. The O3 precursors such as CO and NOx, produced by a large number of heavy diesel vehicles and other motor vehicles, exacerbate O3 pollution. The data of China’s anthropogenic emission inventory in 2020 [47] indicates that the anthropogenic source emissions of VOCs and NOx in Shandong Province were the largest, while the Jiangsu and Hebei Provinces were also characterized by large emissions. The increase in precursor emissions facilitates the secondary conversion to generate O3. Therefore, anthropogenic emissions are one of the main factors affecting regional air quality.
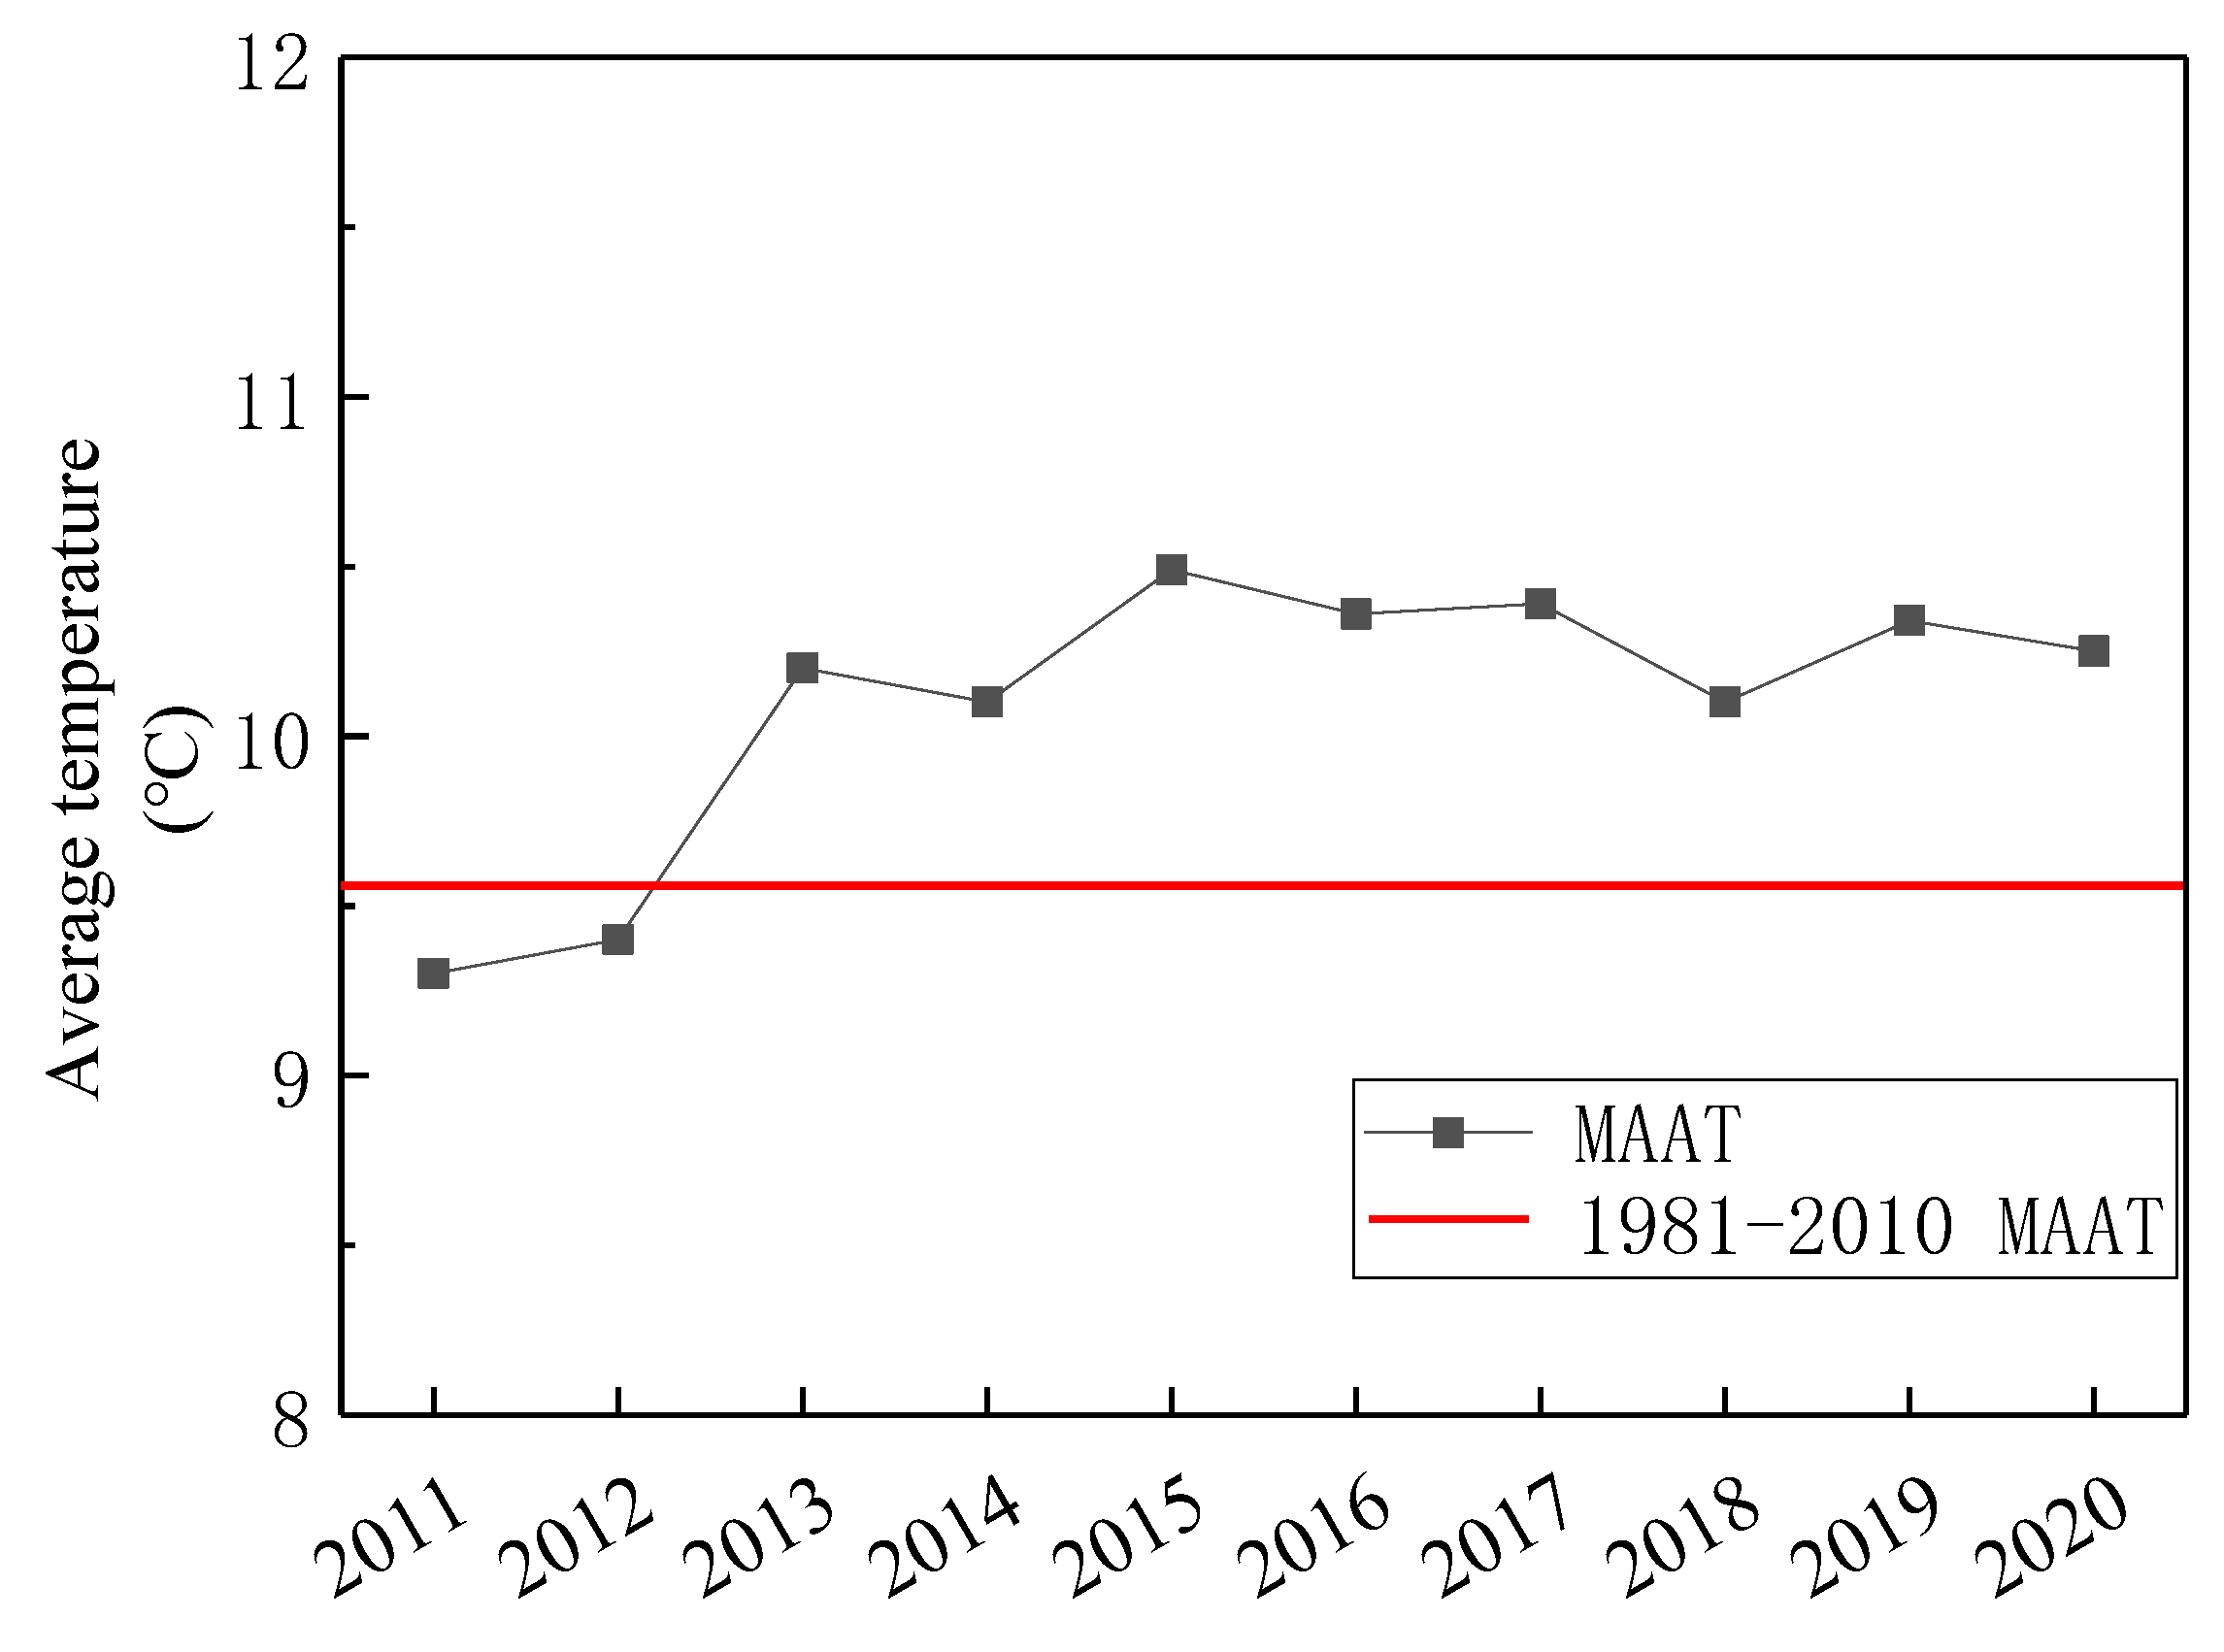
In addition to precursor-related factors, meteorological factors can also affect O3 concentrations through a series of reaction processes. Adverse meteorological conditions and high-intensity precursor emissions are often the preconditions for O3 pollution. Generally, O3 pollution events occur under high-temperature conditions, strong solar radiation, low pressure, low relative humidity, and weak winds [15,16]. Figure 11 shows the change in mean annual average temperature (MAAT) in China from 2011 to 2020, showing that the annual average temperature in China has increased significantly in the past decade, with the highest temperature in the past decade being recorded in 2015, rising by 0.94 °C compared to the average temperature from 1981 to 2010 (9.55 °C). The frequency of extreme weather in China has recently intensified and is currently higher than usual. Moreover, extreme weather conditions such as high temperatures and heavy precipitation have also intensified in China. According to the “Blue book on climate change in China 2021”, released by the Climate Change Center of the China Meteorological Administration, the warming rate in China has been higher than the global trend during the same period, and the climate warming continues. Climate warming bolsters atmospheric stability, weakening the regional atmospheric convection and diffusion. In turn, the change in air quality caused by climate change is also one of the drivers behind the increase in near-ground O3 concentrations.
The external transmission somewhat affects the urban atmosphere. For instance, Jia et al. [48] utilized Ozone Source Apportionment Technology (OSAT) technology to analyze O3 pollution in the summer of 2015. The simulation of the O3 sources in Beijing and its surrounding areas indicated that Beijing was mainly affected by external transportation in the Hebei Province, followed by the Shandong Province and the Henan Province, while Tianjin was mainly affected by the Hebei and Shandong Provinces. Liu et al. [49] studied the transport pathways of atmospheric pollutants in Henan Province in 2017 using the WRF/CAMQ model. Their results showed that O3 concentrations in Henan Province were influenced by a combination of regional transport and natural sources, with the border between Henan Province and neighboring provinces being more significantly influenced by regional transport. Furthermore, Xing et al. [50] used the extended response surface modeling (ERSMv2.0) technique to quantify the contribution of multi-regional sources to PM2.5 and O3 in the Beijing–Tianjin–Hebei region. The results showed that PM2.5 was more influenced by local than regional transport in most regions, while O3 showed the opposite trend, being more heavily influenced by regional transport. Through relevant articles, we know that regional transport fundamentally affects O3 pollution. The central areas in the NCP have serious O3 pollution, thereby exacerbating the pressure on the ambient air quality of the transmitted cities. Thus, joint prevention and control measures are essential for mitigating O3 pollution in the NCP.
In general, O3 pollution is the result of the combined influence of natural conditions and human factors. As the natural conditions are fundamentally unaffected by human being, the anthropogenic sources of pollutants should be primarily addressed. The key to controlling O3 pollution is to reduce the emissions of precursors. Cities in the central part of the NCP are seriously polluted by O3; we should manage the core cities with heavy industrial structures in the region, timely adjust the energy structure, promote clean energy, and adopt a long-term control strategy for NOx and VOCs. At the same time, the NCP region needs to strengthen regional cooperation to form joint prevention and control of air management mechanisms to effectively solve the problem of O3 transmission across regions. Moreover, as individuals, we should privilege green travel, which is an effective way to alleviate O3 pollution. However, due to the unavailability of detailed O3 precursor emission data for recent years, there are some methodological shortcomings in the analysis of O3 causation correlation, and the correlation between precursors and O3 should be discussed in detail in future studies.

5. Conclusions

This study investigated the characteristics, spatio-temporal distribution, and drivers of O3 pollution in the NCP from 2016 to 2020, providing an effective management reference for O3 pollution control policies. It was proven that O3 pollution in the NCP was severe from 2016 to 2018, but after 2018, O3 concentrations gradually decreased. The seasonal variation of O3 concentrations was found to be regular. The O3 concentrations were higher in spring and summer (117.89–154.20 μg/m3) and lower in autumn and winter (53.81–92.95 μg/m3). The spatial analysis revealed that O3 exhibited distinct spatial patterns from 2016 to 2020. On an interannual scale, the overall concentrations of O3 exhibited a spatial distribution trend of low concentrations in the north and south and high concentrations in the central area. This pattern was attributed to the characteristics of the regional industrial structure and the pollutants discharged by motor vehicles. Fundamentally, large-scale industrial production and frequent traffic flow trigger strong precursor emissions. In addition, the greater the number of precursors, the worse the O3 pollution. The analysis showed that the spatial distribution of O3 exhibited certain differences being affected by precursor emissions and meteorological conditions in different seasons. Of note, high temperature and low pressure can increase O3 concentrations, and high emissions of precursors also contribute to O3 pollution. This calls for further decreasing the emissions of precursors to alleviate O3 pollution.

Supplementary Materials

The following supporting information can be downloaded at: https://www.mdpi.com/article/10.3390/atmos13050715/s1, Table S1: Names and abbreviations of cities in the study area.

Author Contributions

Conceptualization, X.W. and W.Z. (Wenhui Zhao); methodology, L.L.; software, X.W. and T.Z. and L.W. and D.Z.; resources, M.W.; writing—original draft preparation, X.W.; writing—review and editing, W.Z. (Wenji Zhao) and P.M. and Y.Q.; supervision, W.Z. (Wenji Zhao) All authors have read and agreed to the published version of the manuscript.

Funding

This research was funded by National Key Research and Development Program of China (2018YFC0706004) and National Natural Science Foundation (42071422).

Institutional Review Board Statement

Not applicable.

Informed Consent Statement

Not applicable.

Data Availability Statement

The atmospheric O3 data used in this study are available at http://106.37.208.233:20035/. Meteorological data are available at http://data.cma.cn. Vector data and DEM data are available at https://www.resdc.cn/. The statistical data from 2016 to 2020 are available at http://www.stats.gov.cn/tjsj/ndsj/ and https://data.cnki.net/NewHome/Index. The POI data are available at https://amap.com/ (accessed on 18 April 2022).

Conflicts of Interest

The authors declare no conflict of interest.

References

  1. Yu, R.; Lin, Y.; Zou, J.; Dan, Y.; Cheng, C. Review on Atmoshperic Ozone Pollution in China: Formation, Spatiotemporal Distribution, Precursors and Affection Factors. Atmosphere 2021, 12, 1675. [Google Scholar] [CrossRef]
  2. Wang, X.; Li, J.; Zhang, Y.; Xie, S.; Tang, X. Ozone source attribution during a severe photochemical smog episode in Beijing, China. Sci. China Ser. B Chem. 2009, 52, 1270–1280. [Google Scholar] [CrossRef]
  3. Toro, A.R.; Seguel, R.; Morales, S.R.; Leiva, G.M. Ozone, nitrogen oxides, and volatile organic compounds in a central zone of Chile. Air Qual. Atmosphere Health 2014, 8, 545–557. [Google Scholar] [CrossRef]
  4. Shao, P.; An, J.; Xin, J.; Wu, F.; Wang, J.; Ji, D.; Wang, Y.S. Source apportionment of VOCs and the contribution to photochemical ozone formation during summer in the typical industrial area in the Yangtze River Delta, China. Atmos. Res. 2016, 176, 64–74. [Google Scholar] [CrossRef]
  5. Lehman, J.; Swinton, K.; Bortnick, S.; Hamilton, C.; Baldridge, E.; Eder, B.; Cox, B. Spatio-temporal characterization of tropospheric ozone across the eastern United States. Atmos. Environ. 2004, 38, 4357–4369. [Google Scholar] [CrossRef]
  6. Wang, X.; Lu, W.; Wang, W.; Leung, A.Y. A study of ozone variation trend within area of affecting human health in Hong Kong. Chemosphere 2003, 52, 1405–1410. [Google Scholar] [CrossRef]
  7. Yi, R.; Wang, Y.; Zhang, Y.; Shi, Y.; Li, M. Pollution characteristics and influence factors of ozone in Yangtze River Delta. Acta Sci. Circumstantiae 2015, 35, 2370–2377. [Google Scholar] [CrossRef]
  8. Zhang, P.; Wang, X.; Pan, B.; Guo, C. A Preliminary Study on the Distribution Characteristics and Sources of O3 Concentration in the Central Plains Urban Agglomeration. Environ. Monit. China 2017, 33, 132–139. [Google Scholar] [CrossRef]
  9. Liu, X.; Lou, S.; Chen, Y.; Liu, Q.; Wang, J.; Shan, Y.; Huang, S.; Du, H. Spatiotemporal distribution of ground-level ozone in mid-east China based on OMI observations. Acta Sci. Circumstantiae 2016, 36, 2811–2818. [Google Scholar] [CrossRef]
  10. Zhang, Q.-Q.; Zhang, X.-Y. Ozone Spatial-temporal Distribution and Trend over China Since 2013: Insight from Satellite and Surface Observation. Environ. Sci. 2019, 40, 1132–1142. [Google Scholar] [CrossRef]
  11. Meng, X.; Gong, Z.; Ye, C.; Wang, S.; Sun, H.; Zhang, X. Characteristics of Ozone concentration variation in 74 cities from 2013 to 2016. Environ. Monit. China 2017, 33, 101–108. [Google Scholar] [CrossRef]
  12. Zhang, T.; Shen, N.; Zhao, X.; Wang, X.; Zhao, W. Spatiotemporal variation characteristics of ozone and its population exposure risk assessment in Chengdu-Chongqing urban agglomeration during 2015 to 2019. Acta Sci. Circumstantiae 2021, 41, 4188–4199. [Google Scholar] [CrossRef]
  13. Li, Z.; Yu, S.; Li, M.; Chen, X.; Zhang, Y.; Song, Z.; Li, J.; Jiang, Y.; Liu, W.; Li, P.; et al. The Modeling Study about Impacts of Emission Control Policies for Chinese 14th Five-Year Plan on PM2.5 and O3 in Yangtze River Delta, China. Atmosphere 2022, 13, 26. [Google Scholar] [CrossRef]
  14. Guo, H.; Chen, K.; Wang, P.; Hu, J.; Ying, Q.; Gao, A.; Zhang, H. Simulation of summer ozone and its sensitivity to emission changes in China. Atmos. Pollut. Res. 2019, 10, 1543–1552. [Google Scholar] [CrossRef]
  15. Wang, T.; Wu, Y.; Cheung, T.; Lam, K. A study of surface ozone and the relation to complex wind flow in Hong Kong. Atmospheric Environ. 2001, 35, 3203–3215. [Google Scholar] [CrossRef]
  16. Li, M.; Yu, S.; Chen, X.; Li, Z.; Zhang, Y.; Wang, L.; Liu, W.; Li, P.; Lichtfouse, E.; Rosenfeld, D.; et al. Large scale control of surface ozone by relative humidity observed during warm seasons in China. Environ. Chem. Lett. 2021, 19, 3981–3989. [Google Scholar] [CrossRef]
  17. Cui, M.; Bai, Y.; Feng, J.; Lin, X.; Li, H.; Gao, W.; Li, Z. Analysis of temporal and spatial variations of ozone coupling with dynamics of meteorological factors in the Beijing-Tianjin-Tangshan region. Acta Sci. Circumstantiae 2021, 41, 373–385. [Google Scholar] [CrossRef]
  18. Jia, M.; Zhao, T.; Cheng, X.; Gong, S.; Zhang, X.; Tang, L.; Liu, D.; Wu, X.; Wang, L.; Chen, Y. Inverse Relations of PM2.5 and O3 in Air Compound Pollution between Cold and Hot Seasons over an Urban Area of East China. Atmosphere 2017, 8, 59. [Google Scholar] [CrossRef] [Green Version]
  19. Wang, X.; Yan, G.; Lei, Y.; Ning, M. The Status and Problems of Air Pollution of the Border Area of Jiangsu, Anhui, Shandong and Henan. Environ. Prot. 2020, 48, 45–48. [Google Scholar] [CrossRef]
  20. Dong, Y.; Li, J.; Guo, J.; Jiang, Z.; Chu, Y.; Chang, L.; Yang, Y.; Liao, H. The impact of synoptic patterns on summertime ozone pollution in the North China Plain. Sci. Total Environ. 2020, 735, 139559. [Google Scholar] [CrossRef]
  21. Zhao, S.; Gong, Z.; Liu, X. Correlation analysis between vegetation coverage and climate drought conditions in North China during 2001–2013. J. Geogr. Sci. 2015, 70, 717–729. [Google Scholar] [CrossRef]
  22. Wang, H. Spatial-Temporal Dynamics of Regional Economic Disparity in Jiangsu-Shandong-Henan-Anhui Provinces. Master’s Thesis, Henan University, Kaifeng, China, 2016. [Google Scholar]
  23. Duo, A.; Zhao, W.; Gong, Z.; Zhang, M.; Fan, Y. Temporal analysis of climate change and its relationship with vegetation cover on the north China plain from 1981 to 2013. Acta Ecol. Sin. 2017, 37, 576–592. [Google Scholar] [CrossRef]
  24. Qin, T.; Fu, Z. Comparision of several interpolation methods in Arcgis. Comput. Tech. Geophys. Geochem. Explor. 2007, 29, 72–75. [Google Scholar] [CrossRef]
  25. Goovaerts, P. Geostatistical approaches for incorporating elevation into the spatial interpolation of rainfall. J. Hydrol. 2000, 228, 113–129. [Google Scholar] [CrossRef]
  26. Wu, X.; Yan, L. Setting Parameters and Choosing Optimum Semivariogram Models of Ordinary Kriging Interpolation—A case study of spatial interpolation to January average temperature of Fujian province. Geo-Inf. Sci. 2007, 9, 104–108. [Google Scholar] [CrossRef]
  27. Tobler, W.R. A Computer movie simulating urban growth in the detroit region. Econ. Geogr. 1970, 46, 234–240. [Google Scholar] [CrossRef]
  28. Li, X.; Li, S.; Liu, P.; Kong, Y.; Song, H. Spatial and temporal variations of ozone concentrations in China in 2016. Acta Sci. Circumstantiae 2018, 38, 1263–1274. [Google Scholar] [CrossRef]
  29. Han, G.; Xu, J.; Wang, W.; Ma, J. The spatial statistic analysis of Air Pollutants in Chongqing city. Res. Environ. Sci. 2006, 19, 30–35. [Google Scholar] [CrossRef]
  30. Li, H.; Wang, S.; Zhang, W.; Wang, H.; Wang, H.; Wang, S.; Li, H. Characteristics and influencing factors of urban air quality in Beijing-Tianjin-Hebei and its surrounding areas (‘2 + 26’ cities). Res. Environ. Sci. 2021, 34, 172–184. [Google Scholar] [CrossRef]
  31. Yue, X.; Lei, Y.; Zhou, H.; Liu, Z.; Hu, S.; Cai, Z.; Lin, J.; Jiang, Z.; Liao, H. Changes of anthropogenic carbon emissions and air pollutants during the COVID-19 epidemic in China. Trans. Atmos. Sci. 2020, 43, 265–274. [Google Scholar] [CrossRef]
  32. Cui, M. Characteristics of ozone pollution and the sensitivity of its formation to precursors in Beijing. Master’s Thesis, Chengdu University of Information Technology, Chengdu, China, 2019. [Google Scholar]
  33. Zou, Y.; Charlesworth, E.; Yin, C.; Yan, X.; Deng, X.; Li, F. The weekday/weekend ozone differences induced by the emissions change during summer and autumn in Guangzhou, China. Atmos. Environ. 2019, 199, 114–126. [Google Scholar] [CrossRef]
  34. Xu, W.Y.; Zhao, C.S.; Ran, L.; Deng, Z.Z.; Liu, P.F.; Ma, N.; Lin, W.L.; Xu, X.B.; Yan, P.; He, X.; et al. Characteristics of pollutants and their correlation to meteorological conditions at a suburban site in the North China Plain. Atmos. Chem. Phys. 2011, 11, 4353–4369. [Google Scholar] [CrossRef] [Green Version]
  35. Fu, C.; Zhou, H. Research progress on the formation mechanism and impact factors of urban ozone pollution in China. Environ. Monit. China 2021, 37, 33–43. [Google Scholar] [CrossRef]
  36. Kajino, M.; Hayashida, S.; Sekiyama, T.T.; Deushi, M.; Ito, K.; Liu, X. Detectability assessment of a satellite sensor for lower tropospheric ozone responses to its precursors emission changes in East Asian summer. Sci. Rep. 2019, 9, 19629. [Google Scholar] [CrossRef]
  37. Yu, Y.-J.; Wang, Z.; He, T.; Meng, X.-Y.; Xie, S.-Y.; Yu, H.-X. Driving factors of the significant increase in surface ozone in the Yangtze River Delta, China, during 2013–2017. Atmos. Pollut. Res. 2019, 10, 1357–1364. [Google Scholar] [CrossRef]
  38. Guo, Y.; Wang, Z.; Xu, C. Spatio-temporal evolution and influencing factors of total particulate matter emissions of vehicles in China. Acta Ecol. Sin. 2021, 41, 4406–4417. [Google Scholar] [CrossRef]
  39. Jhun, I.; Coull, B.A.; Zanobetti, A.; Koutrakis, P. The impact of nitrogen oxides concentration decreases on ozone trends in the USA. Air Qual. Atmos. Health 2015, 8, 283–292. [Google Scholar] [CrossRef] [Green Version]
  40. Ke, B.; He, C.; Yang, L.; Ye, Z.; Yi, J.; Tian, Y.; Mu, H.; Tu, P.; Han, C.; Hong, S. Study on the spatiotemporal variation of surface ozone and the main driving factors in North China. China Environ. Sci. 2021, 42, 1–13. [Google Scholar] [CrossRef]
  41. Liu, X. Analysis on Variation Characteristics of Air Pollution in Shandong Province during 2000–2005. Master’s Thesis, Shandong University, Jinan, China, 2008. [Google Scholar]
  42. Wang, S.; Fang, C.; Wang, Y. Quantitative investigation of the interactive coupling relationship between urbanization and eco-environment. Acta Ecol. Sin. 2015, 35, 2244–2254. [Google Scholar] [CrossRef] [Green Version]
  43. Lu, D. Function orientation and coordinating development of subregions within the Jing-Jin-Ji UrbanAgglomeration. Prog. Geogr. 2015, 34, 265–270. [Google Scholar] [CrossRef]
  44. Wang, Y.; Xue, W.; Lei, Y.; Wu, W. Model-derived source apportionment and regional transport matrix study of ozone in Jingjinji. China Environ. Sci. 2017, 37, 3684–3691. [Google Scholar] [CrossRef]
  45. Shao, P.; Wang, L.-L.; An, J.-L.; Zhou, Y.-L.; Wang, Y.-S. Observation and Analysis of Air Pollution in Zhangjiakou, Hebei. Environ. Sci. 2012, 33, 2538–2550. [Google Scholar] [CrossRef]
  46. Wu, J. Study on Ozone generation sensitivity and Source Analysis in Typical Coastal Cities in Summer. Master’s Thesis, Shandong Normal University, Jinan, China, 2019. [Google Scholar]
  47. Zheng, B.; Zhang, Q.; Geng, G.; Chen, C.; Shi, Q.; Cui, M.; Lei, Y.; He, K. Changes in China’s anthropogenic emissions and air quality during the COVID-19 pandemic in 2020. Earth Syst. Sci. Data 2021, 13, 2895–2907. [Google Scholar] [CrossRef]
  48. Jia, H.; Yin, T.; Qu, X.; Cheng, N.; Cheng, B.; Wang, J.; Tang, W.; Meng, F.; Chai, F. Characteristics and source simulation of ozone in Beijing and its surrounding areas in 2015. China Environ. Sci. 2017, 37, 1231–1238. [Google Scholar] [CrossRef]
  49. Liu, G.; Su, F.; Xu, Q.; Zhang, R.; Wang, K. One-year Simulation of Air Pollutions in Central China, Characteristic, Distribution, Inner Region Cross-transmission, and Path Way Research in 18 Cities. Environ. Sci. 2022, 1–17. [Google Scholar] [CrossRef]
  50. Xing, J.; Wang, S.; Zhao, B.; Wu, W.; Ding, D.; Jang, C.; Zhu, Y.; Chang, X.; Wang, J.; Zhang, F.; et al. Quantifying Nonlinear Multiregional Contributions to Ozone and Fine Particles Using an Updated Response Surface Modeling Technique. Environ. Sci. Technol. 2017, 51, 11788–11798. [Google Scholar] [CrossRef]
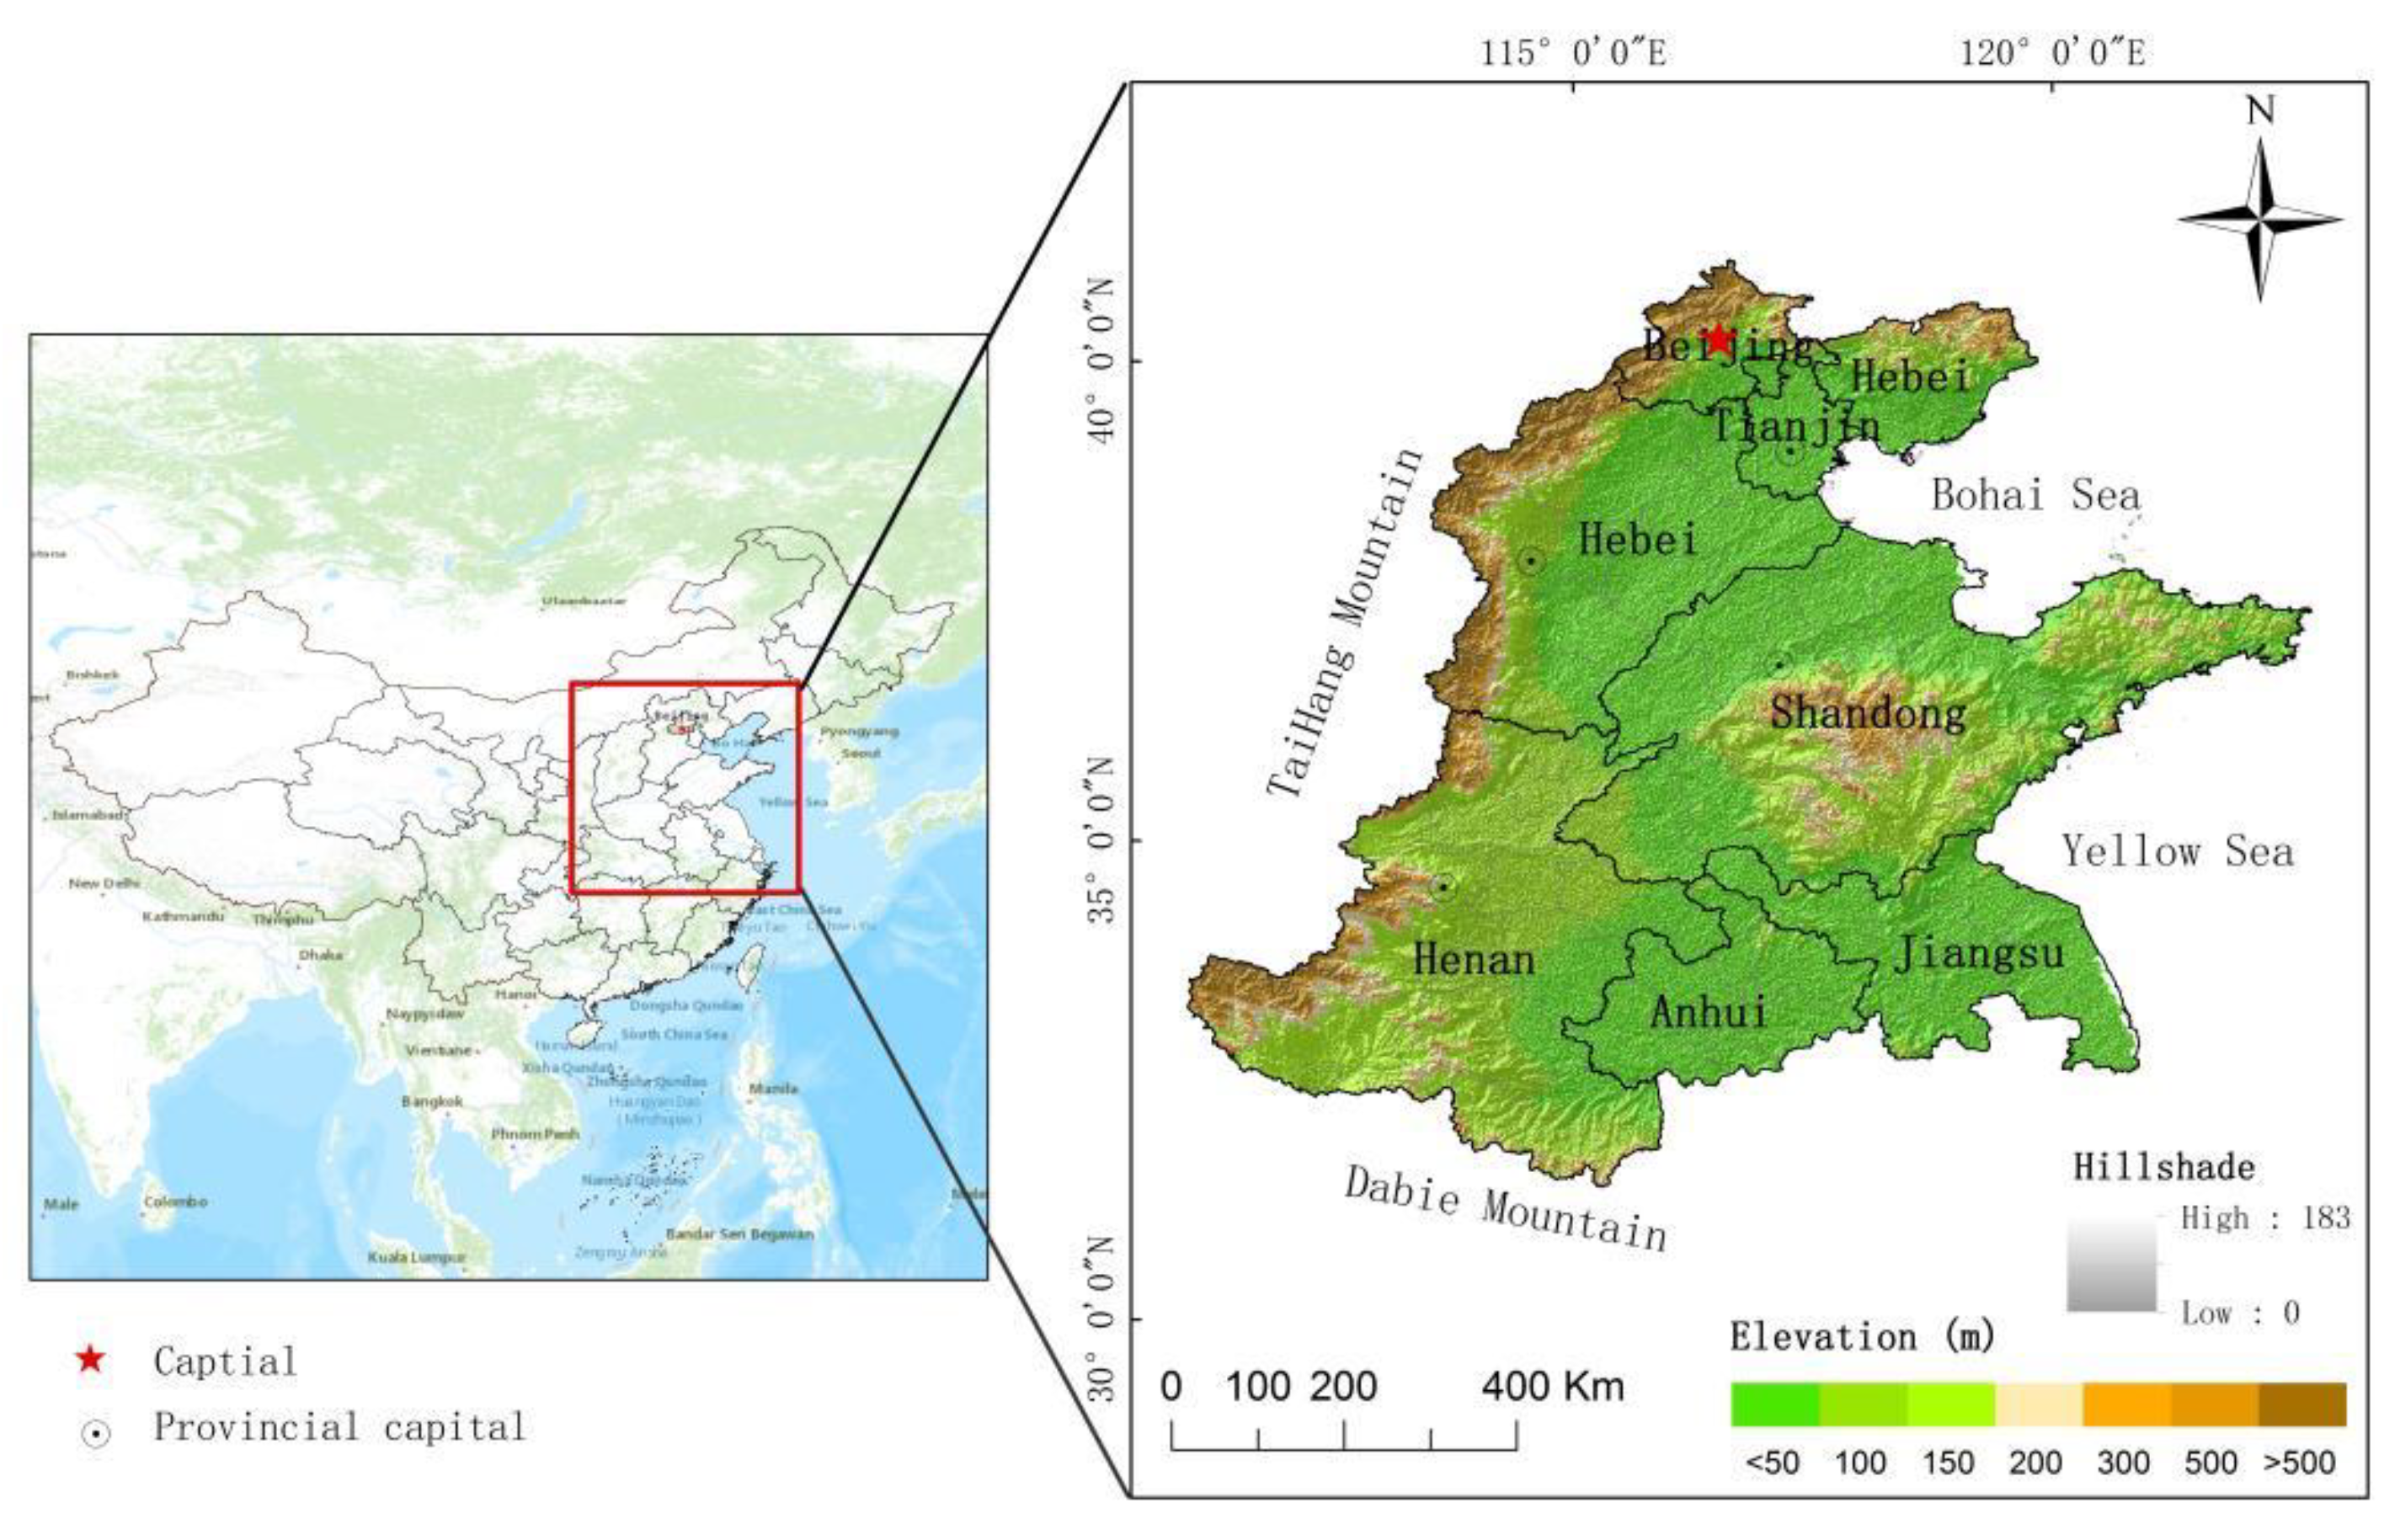
Figure 1. The geographical location of the study area.
Atmosphere 13 00715 g001
Figure 2. Seasonal changes in O3 concentrations in the NCP from 2016 to 2020.
Atmosphere 13 00715 g002
Figure 3. Spatial aggregation characteristics of O3 concentrations in the NCP from 2016–2020.
Atmosphere 13 00715 g003
Figure 4. Annual spatial distribution map of O3 in the NCP from 2016 to 2020: (a) Spatial distribution of O3 in 2016, (b) Spatial distribution of O3 in 2017, (c) Spatial distribution of O3 in 2018, (d) Spatial distribution of O3 in 2019, (e) Spatial distribution of O3 in 2020.
Atmosphere 13 00715 g004
Figure 5. (a) Spatial distribution of civil vehicle ownership in the NCP in 2019; (b) Spatial distribution of industrial NOx emissions in the NCP in 2017.
Atmosphere 13 00715 g005
Figure 6. Number of heavy industrial plants in each province of the NCP.
Atmosphere 13 00715 g006
Figure 7. Seasonal spatial distribution map of O3 in the NCP from 2016 to 2020: (a) Spatial distribution of O3 in spring, (b) Spatial distribution of O3 in summer, (c) Spatial distribution of O3 in autumn, (d) Spatial distribution of O3 in winter.
Atmosphere 13 00715 g007
Figure 8. Variation in O3 concentrations and meteorological conditions in the NCP from 2016 to 2020.
Atmosphere 13 00715 g008
Figure 9. (a) O3 concentrations and excessive rate under different temperature conditions, (b) O3 concentrations and excessive rate under different air pressure conditions.
Atmosphere 13 00715 g009
Figure 10. Changes in Civil Vehicle Ownership from 2016 to 2020.
Atmosphere 13 00715 g010
Figure 11. National mean annual average temperature changes over the years.
Atmosphere 13 00715 g011
Table 1. Statistics of O3-8h data in the NCP from 2016 to 2020. (Mean ± sd).
Date/yearMean
(μg/m3)
Minimum
(μg/m3)
Maximum
(μg/m3)
2020104.04 ± 8.8725.63203.56
2019108.05 ± 4.9419.77216.30
2018110.28 ± 5.8225.83219.83
2017107.96 ± 5.4024.81223.70
201697.84 ± 4.5519.54190.23
Table 2. Spatial autocorrelation test results.
Index20162017201820192020
Moran’s I0.170.360.450.450.51
Z-score5.0310.1412.6512.6614.36
p-value<0.01<0.01<0.01<0.01<0.01
Publisher’s Note: MDPI stays neutral with regard to jurisdictional claims in published maps and institutional affiliations.