Article

Mortality Burden of Heatwaves in Sydney, Australia Is Exacerbated by the Urban Heat Island and Climate Change: Can Tree Cover Help Mitigate the Health Impacts?

1
University Centre for Rural Health, The University of Sydney, Lismore, NSW 2480, Australia
2
Environment Protection Authority Victoria, Melbourne, VIC 3053, Australia
3
Centre for Air Pollution, Energy and Health Research (CAR), Sydney, NSW 2037, Australia
4
New South Wales Department of Health Environmental Health Branch, Sydney, NSW 2050, Australia
5
Climate Change Research Centre, University of New South Wales, Sydney, NSW 2033, Australia
6
Strategic Analysis and Investment Unit, Strategic Reform and Planning Branch, NSW Ministry of Health, Sydney, NSW 2037, Australia
7
Climate, Air Quality Research Unit, School of Public Health and Preventive Medicine, Monash University, Melbourne, VIC 3800, Australia
8
Science, Economics and Insights Division, Department of Planning and Environment, Sydney, NSW 2150, Australia
9
School of Science, University of New South Wales, Canberra, ACT 2890, Australia
10
Sydney School of Public Health, The University of Sydney, Sydney, NSW 2050, Australia
11
School of Mathematics and Statistics, University of Sydney, Sydney, NSW 2050, Australia
12
WHO Collaborating Centre for Environmental Health Impact Assessment, School of Population Health, Curtin University, Perth, WA 6102, Australia
*
Author to whom correspondence should be addressed.
Atmosphere 2022, 13(5), 714; https://doi.org/10.3390/atmos13050714
Submission received: 31 March 2022 / Revised: 21 April 2022 / Accepted: 26 April 2022 / Published: 30 April 2022
(This article belongs to the Special Issue Impacts of Heatwaves on Health)

Abstract

:
Heatwaves are associated with increased mortality and are exacerbated by the urban heat island (UHI) effect. Thus, to inform climate change mitigation and adaptation, we quantified the mortality burden of historical heatwave days in Sydney, Australia, assessed the contribution of the UHI effect and used climate change projection data to estimate future health impacts. We also assessed the potential for tree cover to mitigate against the UHI effect. Mortality (2006–2018) records were linked with census population data, weather observations (1997–2016) and climate change projections to 2100. Heatwave-attributable excess deaths were calculated based on risk estimates from a published heatwave study of Sydney. High resolution satellite observations of UHI air temperature excesses and green cover were used to determine associated effects on heat-related mortality. These data show that >90% of heatwave days would not breach heatwave thresholds in Sydney if there were no UHI effect and that numbers of heatwave days could increase fourfold under the most extreme climate change scenario. We found that tree canopy reduces urban heat, and that widespread tree planting could offset the increases in heat-attributable deaths as climate warming progresses.

1. Introduction

Both hot and cold temperature extremes pose risks to human health, and the temperature–health risk association follows a U-shaped curve, with increasing risks below and above hot and cold thresholds. These thresholds differ between locations and climates, reflecting the human capacity for thermal adaptation [1,2,3,4], but also conditions of habitation [5,6].
Previous Australian time-series studies define heatwaves as two or more consecutive days in which ambient temperatures exceed historical thresholds [7,8]. Although heatwave declarations and associated health messaging have been developed based on morbidities [9], more heat warning systems are based on associations between mortality counts and means of the minimum temperature of the day and the maximum temperature from the previous day [10,11,12]. In a study of Sydney, Australia, Wang et al. [8] demonstrated that 24 h mean temperatures are the most sensitive predictor of heat-related mortality, and they established mortality risk estimates for percentile thresholds of temperatures.
Recent modelling indicates the potential to prevent heat deaths in Australian cities by mitigating urban heat [13]. Excess urban heating relates to the prevalence of low albedo surfaces, the density of human heat-producing activities and accumulation of heat in buildings, roads and structures [14]. Recently, the urban heat island (UHI) effect was measured at a high spatial resolution in the Sydney Greater Metropolitan Region (GMR) [15] using land surface temperatures (LST), which are available for the entire globe and are based on satellite infrared images. UHI temperature excesses of around 10 °C have been recorded in numerous cities globally [14]. Other studies demonstrate links between the UHI effect and land cover patterns [16] and quantitatively show impacts of various contributing elements, such as cool roofs [17], heat infiltration into buildings and anthropogenic heat [18].
Recognising the health risks of urban heat and the driving forces and pressures of global warming, human physiological and behavioural adaptations to heat may be overwhelmed in the coming decade [5,19]. Widespread tree planting may protect health in cities because vegetation influences the impact and magnitude of the UHI. However, whereas all vegetation types reduce urban heat by photosynthesizing, transpiring and shading [20], trees and shrubs are demonstrably more effective at reducing soil temperatures than herbaceous ground cover, such as grass [21]. The UHI effect also has multiple other influences, warranting the present assessment of tree cover, urban heat and climate change.
This study addresses current and future avoidable excessive heat exposures in Australia’s most populous city by comparing human health risks under various scenarios relating to climate change, urban heat and urban vegetation. Specifically, we statistically related temperature increases with attributable deaths using health impact assessment methods [22,23,24] and compared the mortality burden of heatwaves during the period of 2006–2018 with that under a counterfactual scenario of no UHI-driven heat excesses. Climate change projections were then used to estimate heat-attributable deaths for the future periods 2030–2049 and 2080–2099 under the high greenhouse gas emission representative concentration pathway (RCP) scenario (RCP8.5) [19]. We aimed to capture the range of uncertainty in climate change models by dynamically downscaling three global climate models (GCMs) with the regional weather research and forecasting (WRF) model under two combinations of physical parameterisations. The resulting six datasets of projected temperatures formed the basis for estimates of current and future heat-attributable deaths and the UHI-mitigating effect of increasing tree cover in urban areas.

2. Materials and Methods

2.1. Study Area

We divided the Sydney GMR into climate zones using a dataset created by Khalaj et al. [25]. Six regions: Sydney East, Sydney West, Gosford, Wyong, Newcastle and Wollongong (based on the classification defined in Khalaj et al. [25]) were distinguished from each other using a variance partitioning model for data from Sydney weather stations over the period 1998–2006 and are shown in Figure 1. The authors defined temperature regions by maximising the ratio of between-group to within-group temperature variance. Significant climate differences were identified between these regions [25] and we assumed that these would also be true of the present study periods.
Statistical area level 2 (SA2) areas from the Australian Bureau of Statistics (ABS) geographical boundary system were retrieved from the 2016 census and were then assigned to the regions. Australian census boundaries are adjusted periodically so that SA2 areas on average contain about 10,000 people (3000–25,000; https://www.abs.gov.au/ausstats/[email protected]/lookup/by%20subject/1270.0.55.001~july%202016~main%20features~statistical%20area%20level%202%20(sa2)~10014; accessed on 25 April 2022). Analyses of exposure to ambient air temperature were initially performed at the SA2 level to capture spatial variance in heat exposures and population demographics. To ensure that heatwave exposures were counted only from populated areas, time-series of daily air temperatures were calculated as population-weighted averages for each climate zone.

2.2. Heatwave Exposure Data

In line with the study by Wang et al. [8], heatwave days are defined by 24 h temperatures exceeding 90th, 95th, 98th and 99th percentile thresholds for two or more consecutive days. Thresholds were calculated for heatwave events from the period 1997–2016 with a grid resolution of 0.05 × 0.05 decimal degrees (approximately 5 × 5 km). These data originated from the Australian Water Availability Project (AWAP) temperature product [26] and were retrieved from the Centre for Air pollution, energy and health Research (CAR) data platform (http://cardat.github.io, accessed on 25 April 2022). Grid percentile temperature thresholds were calculated from average SA2 temperatures across climate zones. This two-decade baseline period can be considered climatically representative and the decades were specifically chosen to marginally precede the historical study period 2006–2018.
We computed 24 h temperatures for each SA2 in the study region. Daily temperature grids were then averaged within climate zones, and percentile thresholds were calculated from 48 h mean temperatures. As described above, heatwave days were defined as those exceeding the percentile thresholds for two or more days and were flagged for every year of the study period 2006–2018 and for temperature projections from the NSW and ACT Regional Climate Modelling (NARCLiM) RCP8.5 ensemble for the time periods 2006–2018, 2030–2049 and 2080–2099. By definition, 3.65 days could be expected to exceed the 99th percentile, on average, if no climate warming had occurred since the baseline period (1997–2016).

2.3. Health Impact Functions

To determine the mortality burden of current and future heatwave exposures, we used relative risk (RR) estimates for heatwaves based on the 24 h mean temperature thresholds as defined for Sydney populations under and over 75 years of age (Table 1) by Wang et al. [8]. That study was a daily time-series analysis using a Poisson generalised additive model of heatwaves coded as a binary variable (1 for heatwave day, 0 for nonheatwave day). The model was adjusted for confounders including day of week, humidity and seasonal trends in mortality. This approach is supported by evidence of the heat–mortality relationship in a multi-country study [4].

2.4. Baseline Daily Mortality Rates

Winter mortality exceeds summer mortality in Australia, in part due to increased infections during winter. However, the ratio of summer to winter deaths may be changing [27]. Thus, to estimate heat-attributable numbers (AN) of deaths on heatwave days during the present study period, we first estimated expected numbers of deaths on all days of the study years in each climate zone. To this end, we used monthly, statewide, age-stratified mortality rates from the Australian Institute of Health and Welfare (AIHW) and fitted a sinusoidal curve based on a daily continuous variable over time. Then, we estimated the fraction (F) of annual deaths in age group k (over and under 75 years) expected to fall on day i based on day i’s ordinal position within the year (Fik). Subsequently, to adjust this daily fraction to accommodate differences between locations, we collected annual deaths data from the Australian Bureau of Statistics deaths data for SA2s between 2006–2018 (ABS Cat. no. 3302.0; https://www.abs.gov.au/ausstats/[email protected]/mf/3302.0, accessed on 25 April 2022) and estimated daily expected mortality counts Eijk for each day i, climate zone j and age k as follows:
Eijk = Oijk × Fik,
where Oijk is the annual number of observed deaths in climate zone j for the year in which day i falls. Fik is the expected fraction of deaths per day defined above and was determined separately for each age group and for leap years.

2.5. Mortality Burden Assessment

AN of all deaths were calculated for each location jJ, each day iI and age group, according to the population attributable fraction (PAF) equation:
ANijk = Eijk × [(RRik − 1)/RRik],
where j is each climate zone from the Sydney GMR. i is the set of all days during the period 2006–2018 inclusive. RRik is the relative risk of all-cause mortality due to heatwaves on day i in age group k. This approach made use of RR estimates for age groups younger and older than 75 years and for four heatwave percentile cut-off intensities, as described by [8] and above. An RR of 1 was used on all nonheatwave days indicating no additional deaths from heatwave.

2.6. Climate Change Projections

We used data from the NARCliM Project, which is a research partnership between the NSW and ACT governments and the Climate Change Research Centre at the University of New South Wales [28]. NARCliM1.5 was the second iteration of NARCliM [29]. The fifth coupled model intercomparison project (CMIP5) is a collection of state-of-the-art GCMs, which underpinned the Intergovernmental Panel on Climate Change (IPCC) fifth assessment report (AR5). Each participating CMIP5 model generates simulations of historical and future climate under prescribed conditions, resulting in a range of projections that sample physical and structural uncertainty. Ensemble means are therefore traditionally used to predict future heatwave durations, intensities and frequencies with clear indication of uncertainty.
As part of NARCliM, three GCMs (ACCESS1-0, ACCESS1-3 and CanESM2) were selected from the CMIP5 ensemble to be dynamically downscaled with WRF regional climate models at 10 km for southeast Australia and 50 km for the Australian continent from 1950 to 2100. NARCliM1.5 is available for two future emission scenarios, RCP4.5 and RCP8.5 [30]. NARCliM1.5 simulations were performed at the same resolution and domain as the original NARCliM1.0 model, thus producing an expanded and complementary dataset for regional climate change. Daily mean temperatures were provided at 10 km resolution for southeast Australia from NARCliM1.5 simulations. In the present study, an ensemble approach was used to sample uncertainty of model-specific estimates for the RCP8.5 scenario. To ensure optimal spatial coverage, we used nonbias-corrected temperature data and calculated heatwave thresholds from nonbias-corrected NARCliM1.5 re-analyses of the baseline years.
To compute heatwave-relevant percentile thresholds as described using observed data from AWAP, we combined daily temperature data from the historical NARCliM modelled datasets (1997–2005) and the future model NARCliM datasets (2006–2016).

2.7. Assessment of Heatwave Days with and without the UHI Effect

We obtained data for UHI-related temperature excesses that were generated using satellite land surface temperature (LST) measurements over the Sydney GMR and surrounding wooded park lands during the summer of 2015–2016. To calculate temperature excesses related to urbanisation, LSTs in urban areas were compared with those at selected forested areas and national parks with representative elevation, distance from the coast, proximity to Sydney and vegetation characteristics. LSTs were up to 12.7 °C higher in mesh blocks (MB) of the Sydney GMR than in areas where no UHI effect could be present (Figure 2A). LST images were subjected to first order correction to remove broad linear temperature trends, such as those due to cooling with increased latitude, increased elevation and proximity to the coast. Maximum LST and maximum air temperatures (Tmax) differ in urbanised areas, primarily because in full sun many urban land surfaces, due to their physical, thermal and reflective properties, are heated more than the air. Herein, we made adjustments for the relationship between these measures according to vegetation cover, as described below.
After analysis of thermal and infrared data from the Landsat satellite, the dataset was combined with the Australian Bureau of Statistics (ABS) MB polygon dataset to provide mean UHI temperatures and to enable multiscale spatial analysis of the relationship between heat and green cover (Dataset: https://datasets.seed.nsw.gov.au/dataset/nsw-urban-heat-island-to-modified-mesh-block-2016, accessed on 25 April 2022).
For all summer days, we subtracted UHI thermal excesses from observed temperatures and derived a counterfactual temperature time-series dataset that represented what would have occurred in Sydney had the UHI not been present.

2.8. Assessment of Tree Cover Association with the UHI Effect

We used the Greater Sydney Region Urban Vegetation Cover to Modified Mesh Block 2016 data (Figure 2B) to calculate percentage vegetation and tree cover in city blocks and infrastructure corridors in the Greater Sydney Region as of 2016. (Dataset: https://datasets.seed.nsw.gov.au/dataset/greater-sydney-region-urban-vegetation-cover-to-modified-mesh-block, accessed 27 April 2022).
In a published spatiotemporal analysis of the relationship between air temperatures at 2 metres height (T2m) and LST [31], the two measures were highly correlated (r > 0.9), although LST in urban areas with low vegetation cover were considerably higher than air temperatures. In their correlations of all temperature measurement pairs globally (~4 × 10⁴), Tmax and LST day at elevation 0–499 m were related with a slope of 0.8 and an intercept 0.5 °C (r = 0.975; taken from a graph). However, with greater than 80% vegetation cover, the relationship between Tmax and LST day had a slope of 1 and an intercept of 0, indicating a linear relationship between the two measures. Hence, LST and T2m temperature estimates converge with increasing fractional vegetation cover (FVC), and this relationship was quantitated [31] with a slope of −1.06 °C/10% increase in vegetation cover and an intercept of 7.47 °C (at 0% vegetation cover). We used the following equation to calculate T2m UHI anomaly (ΔT2mUHI) from LST UHI anomaly (ΔLSTUHI):
ΔT2mUHI = ΔLSTUHI − [7.47 − (1.06 × FVC × 10)] × ΔLSTUHI/ΔLSTmax,
where ΔT2mUHI is the UHI air temperature anomaly. ΔLSTUHI is the UHI land surface temperature anomaly. FVC is fraction of the unit area covered by vegetation (0–1). ΔLSTmax is the maximum land surface temperature anomaly.
In this way, we assessed the impact that increasing vegetation cover might have for mitigating the adverse health effects of the UHI, and as an action against future climate-change-related heatwave impacts.

3. Results

3.1. Heatwaves and All-Cause Mortality in the Sydney GMR

Temperature thresholds were calculated for all climate zones of the Sydney GMR using population-weighted means of SA2-level daily temperatures from 1997 to 2016. The 90th, 95th, 98th and 99th percentile thresholds differed slightly between climate zones (data not shown) but averaged for the Sydney GMR were 23.5 °C, 24.7 °C, 26.1 °C and 27.1 °C, respectively (Table 2). These thresholds were comparable to those in the study by Wang et al. [8], differing slightly because our study area extends further from the city centre. In that epidemiological study, age-stratified analyses of heatwave-related mortality rates were performed to determine whether the risk of heat-death varies between age groups. In their sensitivity analyses, model fit was best served by a single distinction between populations under and over 75 years of age. Accordingly, we applied health impact functions that were derived specifically for the population of Sydney NSW [8] and considered the known heatwave-triggered deaths among people over 75 years of age. In the present calculations, 31% of heat-attributable deaths occurred in people aged under 75 years.
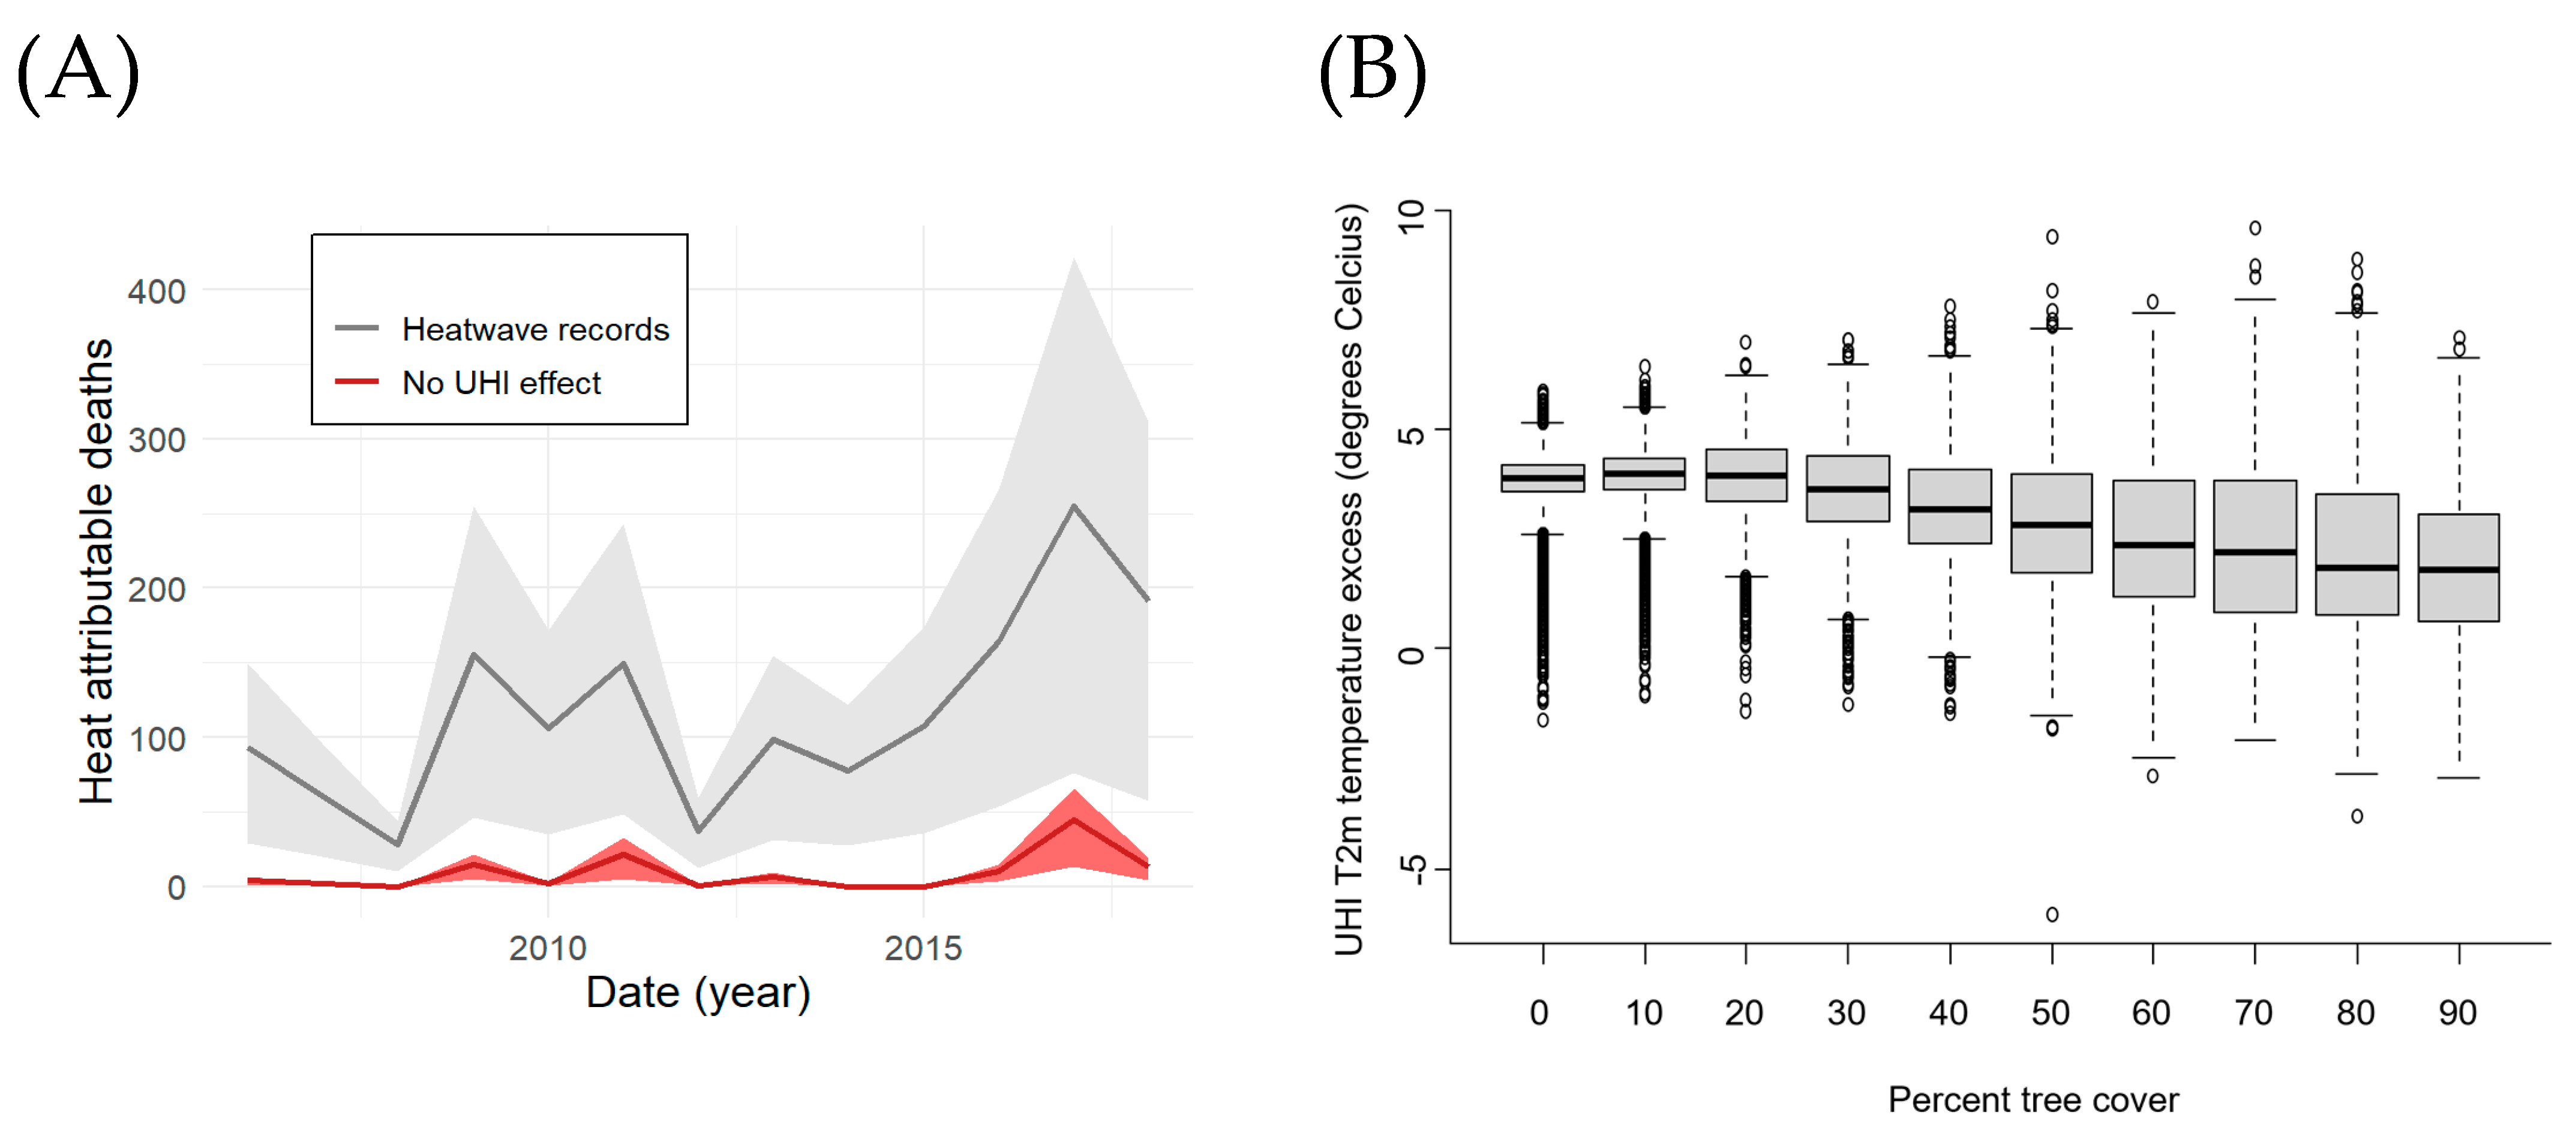
Figure 3A shows the total annual accumulation of deaths from heatwave days under each of the four heatwave percentile definitions throughout the Sydney GMR. Our analyses of the years 2006–2018 show fewer than 50 heat deaths during 2008 and 2012, but more than 250 heat deaths during the sustained and intense heatwaves of 2017 (Figure 3A).
The marked reduction in the mortality burden of heatwaves under a counterfactual scenario of no UHI effect (shown in red in Figure 3A) reflects a mean counterfactual air temperature decrease of 4.6 °C. The boxplot in Figure 3B shows that in areas with high tree cover, air temperature excesses due to the UHI effect are decreased on average. Scenarios with greater tree cover would result in marked decreases in the numbers of days on which temperatures exceed the health-relevant thresholds. In Table 3, we present numbers of heatwave days with no UHI effect. Under this counterfactual scenario, no heatwaves of two or more consecutive days would have breached the 99th percentile threshold and only 0.3 would have breached the 98th percentile threshold annually.
During the 12-year historical study period, heatwave days were experienced on an average of 3.23 days per year (Table 3). This value is slightly lower than the 3.65 mathematically expected 99th percentile days of the average baseline year (1997–2018), reflecting the more stringent heatwave definition of two or more days, which excludes single isolated days that exceed thresholds.
Because the heatwave thresholds were calculated from temperature observations in urban environments exposed to the full UHI effect, these data suggest that substantial health gains could be achieved if the UHI effect was reduced in the Sydney GMR. Annually, the heatwave death rate was 2.2 (95% CI, 0.7–3.5) per 100,000 people (Table 3), culminating in 117.3 heat deaths annually across the entire study area. If all residents of the study area were relieved of the UHI effect, the heat death rate would be reduced to 0.2 (95% CI, 0.1–0.2) per 100,000, or 9.3 (95% CI, 2.9–13.7) in total.

3.2. Mortality Burden of Future Heatwaves

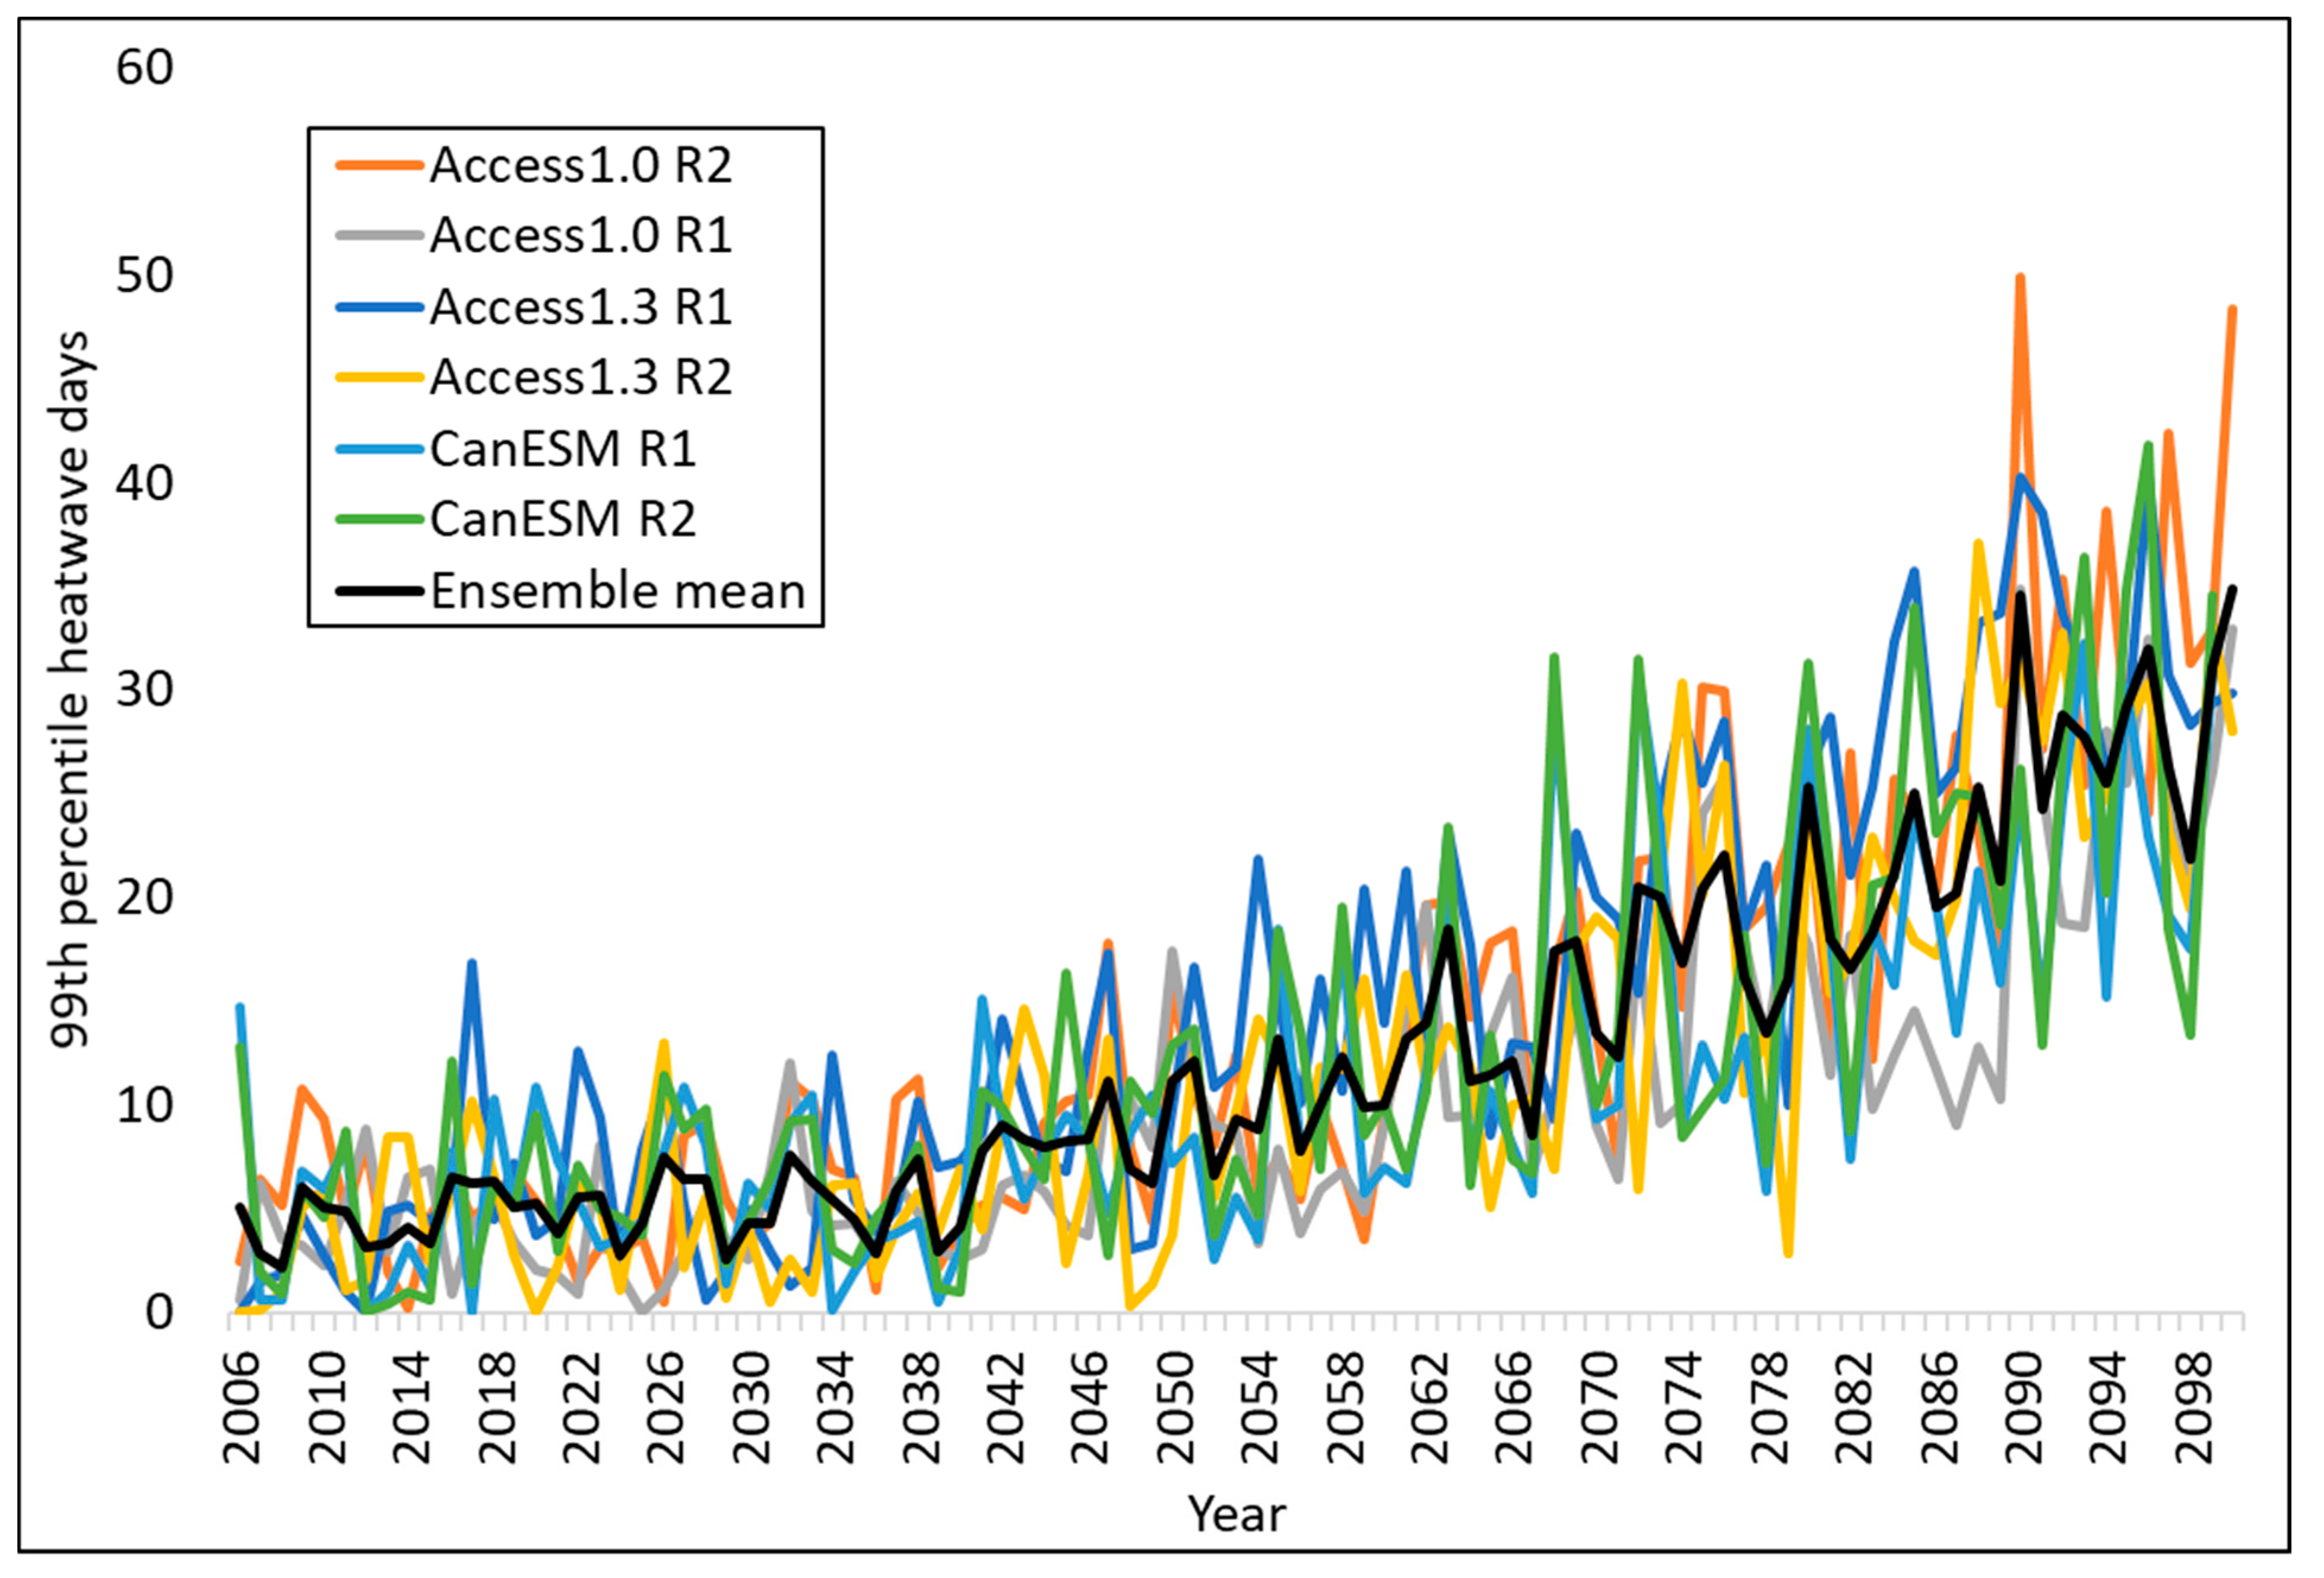
Using the methods described above for historical observations, we flagged heatwave days in physical climate change models of the NARCliM1.5 ensemble under the RCP8.5 scenario (Figure 4). From the 20-year baseline temperature distribution (1997–2016), 90th, 95th, 98th and 99th 24 h temperature thresholds were 22.6 °C, 24.0 °C, 25.5 °C and 26.6 °C, respectively (Table 2). In analyses of climate ensemble means for the period of 2006–2018, annual numbers of days exceeding these thresholds for at least two consecutive days were 20.1, 12.0, 3.9 and 4.5. These numbers are slightly higher than those from observations over the same period. This can be explained in part by the lower temperature thresholds from the modelled baseline period.
To enable counterfactual comparisons of mortality burden (Table 3) due to future heatwaves (Figure 4), we assumed no future changes in demographic factors (fertility, migration) and no physiological or societal adaptation to heat. A similar approach has been promoted by Vicedo-Cabrera et al. [32]. This assumption is designed to avoid inherent limitations of using uncertain future population assessments when considering demographic changes and adaptation measures that are very uncertain to model into the future. Hence, we estimated changes that might occur if all other variables influencing deaths were held constant. Comparison of data from the period of 2006–2018 with that projected for 2080–2099 (Table 3) shows an almost fourfold increase in numbers of heatwave days and heat deaths. During 2030–2049 and 2080–2099, 6.5 and 24.6 days can be expected to exceed the 99th percentile threshold annually, respectively, under the RCP8.5 scenario (Table 3). Our mortality burden calculations show a total of 2.4 (95% CI, 0.8–3.9) heatwave-attributable deaths per 100,000 under the RCP8.5 scenario from ensemble averages for the period of 2006–2018 (Table 3). In the future periods of 2030–2049 and 2080–2099, annual heatwave deaths per 100,000 people could increase to 3.7 (95% CI, 1.1–6.0) and 9.3 (95% CI, 2.7–15.3) per 100,000 people, respectively (Table 3), across the Sydney GMR.

3.3. The Effects of Tree Cover on Urban Heat Island Excesses

The effects of tree cover (Figure 2) on urban heat exposures have been quantified previously, and risk estimates for mortality have been estimated based on spatial comparisons [33,34]. Their risk estimates for heat deaths could be used to model the health effect modification by tree cover. However, the spatial comparisons on which they were derived may not be generalisable to the Sydney GMR. Further studies will be required to determine the independent health benefits of vegetation in Sydney.
To determine the heat mitigating effects of tree cover in Sydney, we calculated ΔT2mUHI for all MBs and plotted these values against the percentage of tree canopy. As shown in Figure 3B, the median UHI temperature excess in MBs with 0%–10% tree cover was 3.9 °C, whereas that in MBs with greater than 90% tree cover was 1.82 °C. Hence, tree cover reduces the UHI by a little over 50% on average. The remaining UHI effect is likely due to human activities, low albedo surfaces and heat accumulation in buildings, together overwhelming the heat-reducing properties of vegetation such as shade and evapotranspirative cooling. UHI temperature excesses were significantly (p < 2.2 × 10⁻¹⁶) correlated (r = −0.161) with MB area, which is an inverse proxy for population density. UHI temperature excesses were also highly correlated (r = 0.35; p < 2.2 × 10⁻¹⁶) with the percentage MB area with no vegetation, representing paved areas and roofs, and with percent tree cover (r = −0.36, p < 2.2 × 10⁻¹⁶). Other confounders of the association between tree cover and the UHI effect include proximity of high-canopy MBs to low-canopy MBs, proximity to the coast and elevation above sea level.

4. Discussion

We assessed heatwave exposures across the Sydney GMR and used baseline mortality rates with locally derived heat-mortality risk estimates to calculate heat-attributable deaths using the population attributable fraction (PAF) method [22,23,24]. We estimate that on average, 117.3 deaths can be attributed to heat per year in Sydney, with a 95% confidence interval (CI) of 37.2–189.8 deaths. After subtracting UHI-related temperature excesses from observed temperatures, numbers of heatwave days were reduced to fewer than 10% of the baseline, demonstrating the pronounced contribution of urban heat to health-relevant heatwave exposures (Table 2 and Table 3). Figure 2A,B clearly show heating and relative cooling effects of urbanisation and greenspace, respectively.
The association between heatwaves and mortality is well described and is of increasing concern as climate warming progresses [22]. The present data show that the future health burden of heatwaves could be effectively diminished by interventions that limit excess heat in urban environments. Among possible interventions, increased tree cover could reduce the impact of low albedo surfaces, which contribute substantially to excess urban heat [20]. The data in Figure 3B indicate that median UHI temperature excesses are approximately halved in areas with very high tree cover, warranting additional close consideration of other sources of urban heat.
The implications of our assessment for urban policy makers are that whereas increasing tree cover will mitigate the impact of urban heating, it will not be sufficient alone to avoid adverse health consequences of global warming. Further adaptive strategies will be required in urban areas, because anthropogenic heat, such as that from vehicles, air conditioners, combustion and body heat, is likely responsible for much of the UHI effect. Attempts to address these sources of heat will, in large part, contribute to reductions in greenhouse gas emissions.
The strengths of this analysis include high-resolution climate and UHI data and the fact that the health-impact function was derived from the same location/population as it is being applied to. Limitations include the a priori heatwave definitions that include 1%, 2%, 5% and 10% of all days. Although these definitions were developed based on large cohort studies, various other heatwave definitions consider humidity, wind and human physiological factors and could provide better models of heat-related mortality. This study also operates on the ‘all else being equal’ assumption relating to population growth, changes in population structures and changes in susceptibility due to chronic disease. This static population approach avoids the uncertainties of demographic modelling. Finally, further studies may improve the validity of the counterfactual no-UHI scenario using direct measurements of air temperatures to confirm the present adjusted LST estimates of UHI-related heat excesses.
In conclusion, this study shows the current mortality burden of heatwaves and projects the future burden that could be expected under the most severe climate change scenario. We focused on adaptations and interventions that could mitigate against the heat–health burden in urban areas and showed that a reduction of the UHI effect will curb the adverse health impact of heatwaves, and that widespread tree planting will deliver a part of this benefit. Based on a high-range greenhouse-gas-emissions scenario, Sydney could experience a fourfold increase in numbers of heatwave days and heatwave-attributable deaths by 2100, warranting immediate interventions to reduce the UHI effect.

Author Contributions

T.B.C. developed methods, performed analyses and wrote the manuscript. I.C.H. developed the methods and revised the manuscript. N.C. performed analyses. R.A.B. developed methods. G.D. and G.S.D. provided health data and advice. C.G. curated health datasets. Y.G. developed methods and revised the manuscript. F.J. provided data and advice. S.P.-K. advised on climate models and contributed text. Y.Z. and G.G.M. revised the manuscript. All authors have read and agreed to the published version of the manuscript.

Funding

Funding support was provided by NSW Ministry of Health and NSW Department of Planning and Environment (NSW DPE) via the Human Health and Social Impacts (HHSI) Node of the NSW Adaptation Research Hub. Data analysis was enabled by CoESRA (https://coesra.tern.org.au/) and the NHMRC Centre for Air pollution, energy and health Research (CAR) and “CARDAT” data platform (https://cardat.github.io/). S.E. P.-K. is supported by ARC grant number FT170100106. This research was supported by the use of the Air-Health-Data project (https://doi.org/10.47486/PS022) that received investment from the Australian Research Data Commons (ARDC). The ARDC is funded by the National Collaborative Research Infrastructure Strategy (NCRIS).

Institutional Review Board Statement

Ethical review and approval were waived for this study due to the use of nonidentifiable aggregated data on the population of NSW, Australia.

Informed Consent Statement

Not applicable.

Data Availability Statement

The data for deaths (daily expected) by age, Sydney Australia 2006–2018 from AIHW and ABS data (DOI 10.17605/OSF.IO/MZSWN) are available on request. Climate data are available from public sources.

Conflicts of Interest

The authors declare no conflict of interest. The funders had no role in the design of the study; in the collection, analyses, or interpretation of data; in the writing of the manuscript nor in the decision to publish the results.

References

  1. Madrigano, J.; Mittleman, M.A.; Baccarelli, A.; Goldberg, R.; Melly, S.; Von Klot, S.; Schwartz, J. Temperature, Myocardial Infarction, and Mortality: Effect Modification by Individual-and Area-Level Characteristics. Epidemiology 2013, 24, 439. [Google Scholar] [CrossRef] [PubMed]
  2. Nastos, P.T.; Matzarakis, A. The Effect of Air Temperature and Human Thermal Indices on Mortality in Athens, Greece. Theor. Appl. Climatol. 2012, 108, 591–599. [Google Scholar] [CrossRef]
  3. Guo, Y.; Li, S.; Liu, D.L.; Chen, D.; Williams, G.; Tong, S. Projecting Future Temperature-Related Mortality in Three Largest Australian Cities. Environ. Pollut. 2016, 208, 66–73. [Google Scholar] [CrossRef] [PubMed]
  4. Guo, Y.; Gasparrini, A.; Armstrong, B.G.; Tawatsupa, B.; Tobias, A.; Lavigne, E.; De Sousa Zanotti Stagliorio Coelho, M.; Pan, X.; Kim, H.; Hashizume, M.; et al. Heat Wave and Mortality: A Multicountry, Multicommunity Study. Environ. Health Perspect. 2017, 125, 087006. [Google Scholar] [CrossRef] [Green Version]
  5. Hanna, E.G.; Tait, P.W. Limitations to Thermoregulation and Acclimatization Challenge Human Adaptation to Global Warming. Int. J. Environ. Res. Public Health 2015, 12, 8034–8074. [Google Scholar] [CrossRef]
  6. Urban, A.; Di Napoli, C.; Cloke, H.L.; Kyselý, J.; Pappenberger, F.; Sera, F.; Schneider, R.; Vicedo-Cabrera, A.M.; Acquaotta, F.; Ragettli, M.S.; et al. Evaluation of the ERA5 Reanalysis-Based Universal Thermal Climate Index on Mortality Data in Europe. Environ. Res. 2021, 198, 111227. [Google Scholar] [CrossRef]
  7. Wilson, L.A.; Gerard Morgan, G.; Hanigan, I.C.; Johnston, F.H.; Abu-Rayya, H.; Broome, R.; Gaskin, C.; Jalaludin, B. The Impact of Heat on Mortality and Morbidity in the Greater Metropolitan Sydney Region: A Case Crossover Analysis. Environ. Health A Glob. Access Sci. Source 2013, 12, 98. [Google Scholar] [CrossRef] [Green Version]
  8. Wang, X.Y.; Guo, Y.; FitzGerald, G.; Aitken, P.; Tippett, V.; Chen, D.; Wang, X.; Tong, S. The Impacts of Heatwaves on Mortality Differ with Different Study Periods: A Multi-City Time Series Investigation. PLoS ONE 2015, 10, e0134233. [Google Scholar] [CrossRef] [Green Version]
  9. Guo, Y.; Barnett, A.G.; Tong, S. High Temperatures-Related Elderly Mortality Varied Greatly from Year to Year: Important Information for Heat-Warning Systems. Sci. Rep. 2012, 2, 830. [Google Scholar] [CrossRef] [Green Version]
  10. Cheng, J.; Xu, Z.; Bambrick, H.; Su, H.; Tong, S.; Hu, W. Impacts of Exposure to Ambient Temperature on Burden of Disease: A Systematic Review of Epidemiological Evidence. Int. J. Biometeorol. 2019, 63, 1099–1115. [Google Scholar] [CrossRef]
  11. Huang, C.; Barnett, A.G.; Xu, Z.; Chu, C.; Wang, X.; Turner, L.R.; Tong, S. Managing the Health Effects of Temperature in Response to Climate Change: Challenges Ahead. Environ. Health Perspect. 2013, 121, 415–419. [Google Scholar] [CrossRef] [Green Version]
  12. Nicholls, N.; Skinner, C.; Loughnan, M.; Tapper, N. A Simple Heat Alert System for Melbourne, Australia. Int. J. Biometeorol. 2008, 52, 375–384. [Google Scholar] [CrossRef] [PubMed]
  13. Haddad, S.; Paolini, R.; Ulpiani, G.; Synnefa, A.; Hatvani-Kovacs, G.; Garshasbi, S.; Fox, J.; Vasilakopoulou, K.; Nield, L.; Santamouris, M. Holistic Approach to Assess Co-Benefits of Local Climate Mitigation in a Hot Humid Region of Australia. Sci. Rep. 2020, 10, 14216. [Google Scholar] [CrossRef] [PubMed]
  14. Chen, D.; Wang, X.; Thatcher, M.; Barnett, G.; Kachenko, A.; Prince, R. Urban Vegetation for Reducing Heat Related Mortality. Environ. Pollut. 2014, 192, 275–284. [Google Scholar] [CrossRef] [PubMed]
  15. Sidiqui, P.; Huete, A.; Devadas, R. Spatio-Temporal Mapping and Monitoring of Urban Heat Island Patterns over Sydney, Australia Using MODIS and Landsat-8. In Proceedings of the 2016 4th International Workshop on Earth Observation and Remote Sensing Applications (EORSA), Guangzhou, China, 4–6 July 2016; pp. 217–221. [Google Scholar] [CrossRef]
  16. Deilami, K.; Kamruzzaman, M.; Hayes, J.F. Correlation or Causality between Land Cover Patterns and the Urban Heat Island Effect? Evidence from Brisbane, Australia. Remote Sens. 2016, 8, 716. [Google Scholar] [CrossRef] [Green Version]
  17. Imran, H.M.; Kala, J.; Ng, A.W.M.; Muthukumaran, S. Effectiveness of Green and Cool Roofs in Mitigating Urban Heat Island Effects during a Heatwave Event in the City of Melbourne in Southeast Australia. J. Clean. Prod. 2018, 197, 393–405. [Google Scholar] [CrossRef]
  18. Filho, W.L.; Echevarria Icaza, L.; Emanche, V.O.; Al-Amin, A.Q. An Evidence-Based Review of Impacts, Strategies and Tools to Mitigate Urban Heat Islands. Int. J. Environ. Res. Public Health 2017, 14, 1600. [Google Scholar] [CrossRef] [Green Version]
  19. van Vuuren, D.P.; Edmonds, J.; Kainuma, M.; Riahi, K.; Thomson, A.; Hibbard, K.; Hurtt, G.C.; Kram, T.; Krey, V.; Lamarque, J.F.; et al. The Representative Concentration Pathways: An Overview. Clim. Change 2011, 109, 5–31. [Google Scholar] [CrossRef]
  20. Rahman, M.A.; Stratopoulos, L.M.F.; Moser-Reischl, A.; Zölch, T.; Häberle, K.H.; Rötzer, T.; Pretzsch, H.; Pauleit, S. Traits of Trees for Cooling Urban Heat Islands: A Meta-Analysis. Build. Environ. 2020, 170, 106606. [Google Scholar] [CrossRef]
  21. Edmondson, J.L.; Stott, I.; Davies, Z.G.; Gaston, K.J.; Leake, J.R. Soil Surface Temperatures Reveal Moderation of the Urban Heat Island Effect by Trees and Shrubs. Sci. Rep. 2016, 6, 33708. [Google Scholar] [CrossRef] [Green Version]
  22. Gasparrini, A.; Guo, Y.; Sera, F.; Vicedo-Cabrera, A.M.; Huber, V.; Tong, S.; de Sousa Zanotti Stagliorio Coelho, M.; Nascimento Saldiva, P.H.; Lavigne, E.; Matus Correa, P.; et al. Projections of Temperature-Related Excess Mortality under Climate Change Scenarios. Lancet Planet. Health 2017, 1, e360–e367. [Google Scholar] [CrossRef]
  23. Heaviside, C.; Vardoulakis, S.; Cai, X.M. Attribution of Mortality to the Urban Heat Island during Heatwaves in the West Midlands, UK. Environ. Health A Glob. Access Sci. Source 2016, 15, 49–59. [Google Scholar] [CrossRef] [PubMed] [Green Version]
  24. Macintyre, H.L.; Heaviside, C. Potential Benefits of Cool Roofs in Reducing Heat-Related Mortality during Heatwaves in a European City. Environ. Int. 2019, 127, 430–441. [Google Scholar] [CrossRef] [PubMed]
  25. Khalaj, B.; Lloyd, G.; Sheppeard, V.; Dear, K. The Health Impacts of Heat Waves in Five Regions of New South Wales, Australia: A Case-Only Analysis. Int. Arch. Occup. Environ. Health 2010, 83, 833–842. [Google Scholar] [CrossRef]
  26. Jones, D.A.; Wang, W.; Fawcett, R. High-Quality Spatial Climate Data-Sets for Australia. Aust. Meteorol. Oceanogr. J. 2009, 58, 233. [Google Scholar] [CrossRef]
  27. Hanigan, I.C.; Dear, K.B.G.; Woodward, A. Increased Ratio of Summer to Winter Deaths Due to Climate Warming in Australia, 1968–2018. Aust. New Zealand J. Public Health 2021, 45, 504–505. [Google Scholar] [CrossRef]
  28. Evans, J.P.; Ji, F.; Lee, C.; Smith, P.; Argueso, D.; Fita, L. A Regional Climate Modelling Projection Ensemble Experiment–NARCliM. Geosci. Model Dev. Discuss. 2013, 6, 5117–5139. [Google Scholar] [CrossRef] [Green Version]
  29. Nishant, N.; Evans, J.P.; Virgilio, G.; Downes, S.M.; Ji, F.; Cheung, K.K.W.; Tam, E.; Miller, J.; Beyer, K.; Riley, M.L. Introducing NARCliM1.5: Evaluating the Performance of Regional Climate Projections for Southeast Australia for 1950–2100. Earth’s Futur. 2021, 9, e2020EF001833. [Google Scholar] [CrossRef]
  30. Taylor, K.E.; Stouffer, R.J.; Meehl, G.A. An Overview of CMIP5 and the Experiment Design. Bull. Am. Meteorol. Soc. 2012, 93, 485–498. [Google Scholar] [CrossRef] [Green Version]
  31. Good, E.J.; Ghent, D.J.; Bulgin, C.E.; Remedios, J.J. A spatiotemporal analysis of the relationship between near-surface air temperature and satellite land surface temperatures using 17 years of data from the ATSR series. J. Geophys. Res. Atmos. 2017, 122, 9185–9210. [Google Scholar]
  32. Vicedo-Cabrera, A.M.; Sera, F.; Gasparrini, A. Hands-on Tutorial on a Modeling Framework for Projections of Climate Change Impacts on Health. Epidemiology 2019, 30, 321. [Google Scholar] [CrossRef] [PubMed] [Green Version]
  33. Gronlund, C.J.; Berrocal, V.J.; White-Newsome, J.L.; Conlon, K.C.; O’Neill, M.S. Vulnerability to Extreme Heat by Socio-Demographic Characteristics and Area Green Space among the Elderly in Michigan, 1990–2007. Environ. Res. 2015, 136, 449–461. [Google Scholar] [CrossRef] [PubMed] [Green Version]
  34. Burkart, K.; Meier, F.; Schneider, A.; Breitner, S.; Canário, P.; Alcoforado, M.J.; Scherer, D.; Endlicher, W. Modification of Heat-Related Mortality in an Elderly Urban Population by Vegetation (Urban Green) and Proximity to Water (Urban Blue): Evidence from Lisbon, Portugal. Environ. Health Perspect. 2016, 124, 927–934. [Google Scholar] [CrossRef] [PubMed] [Green Version]
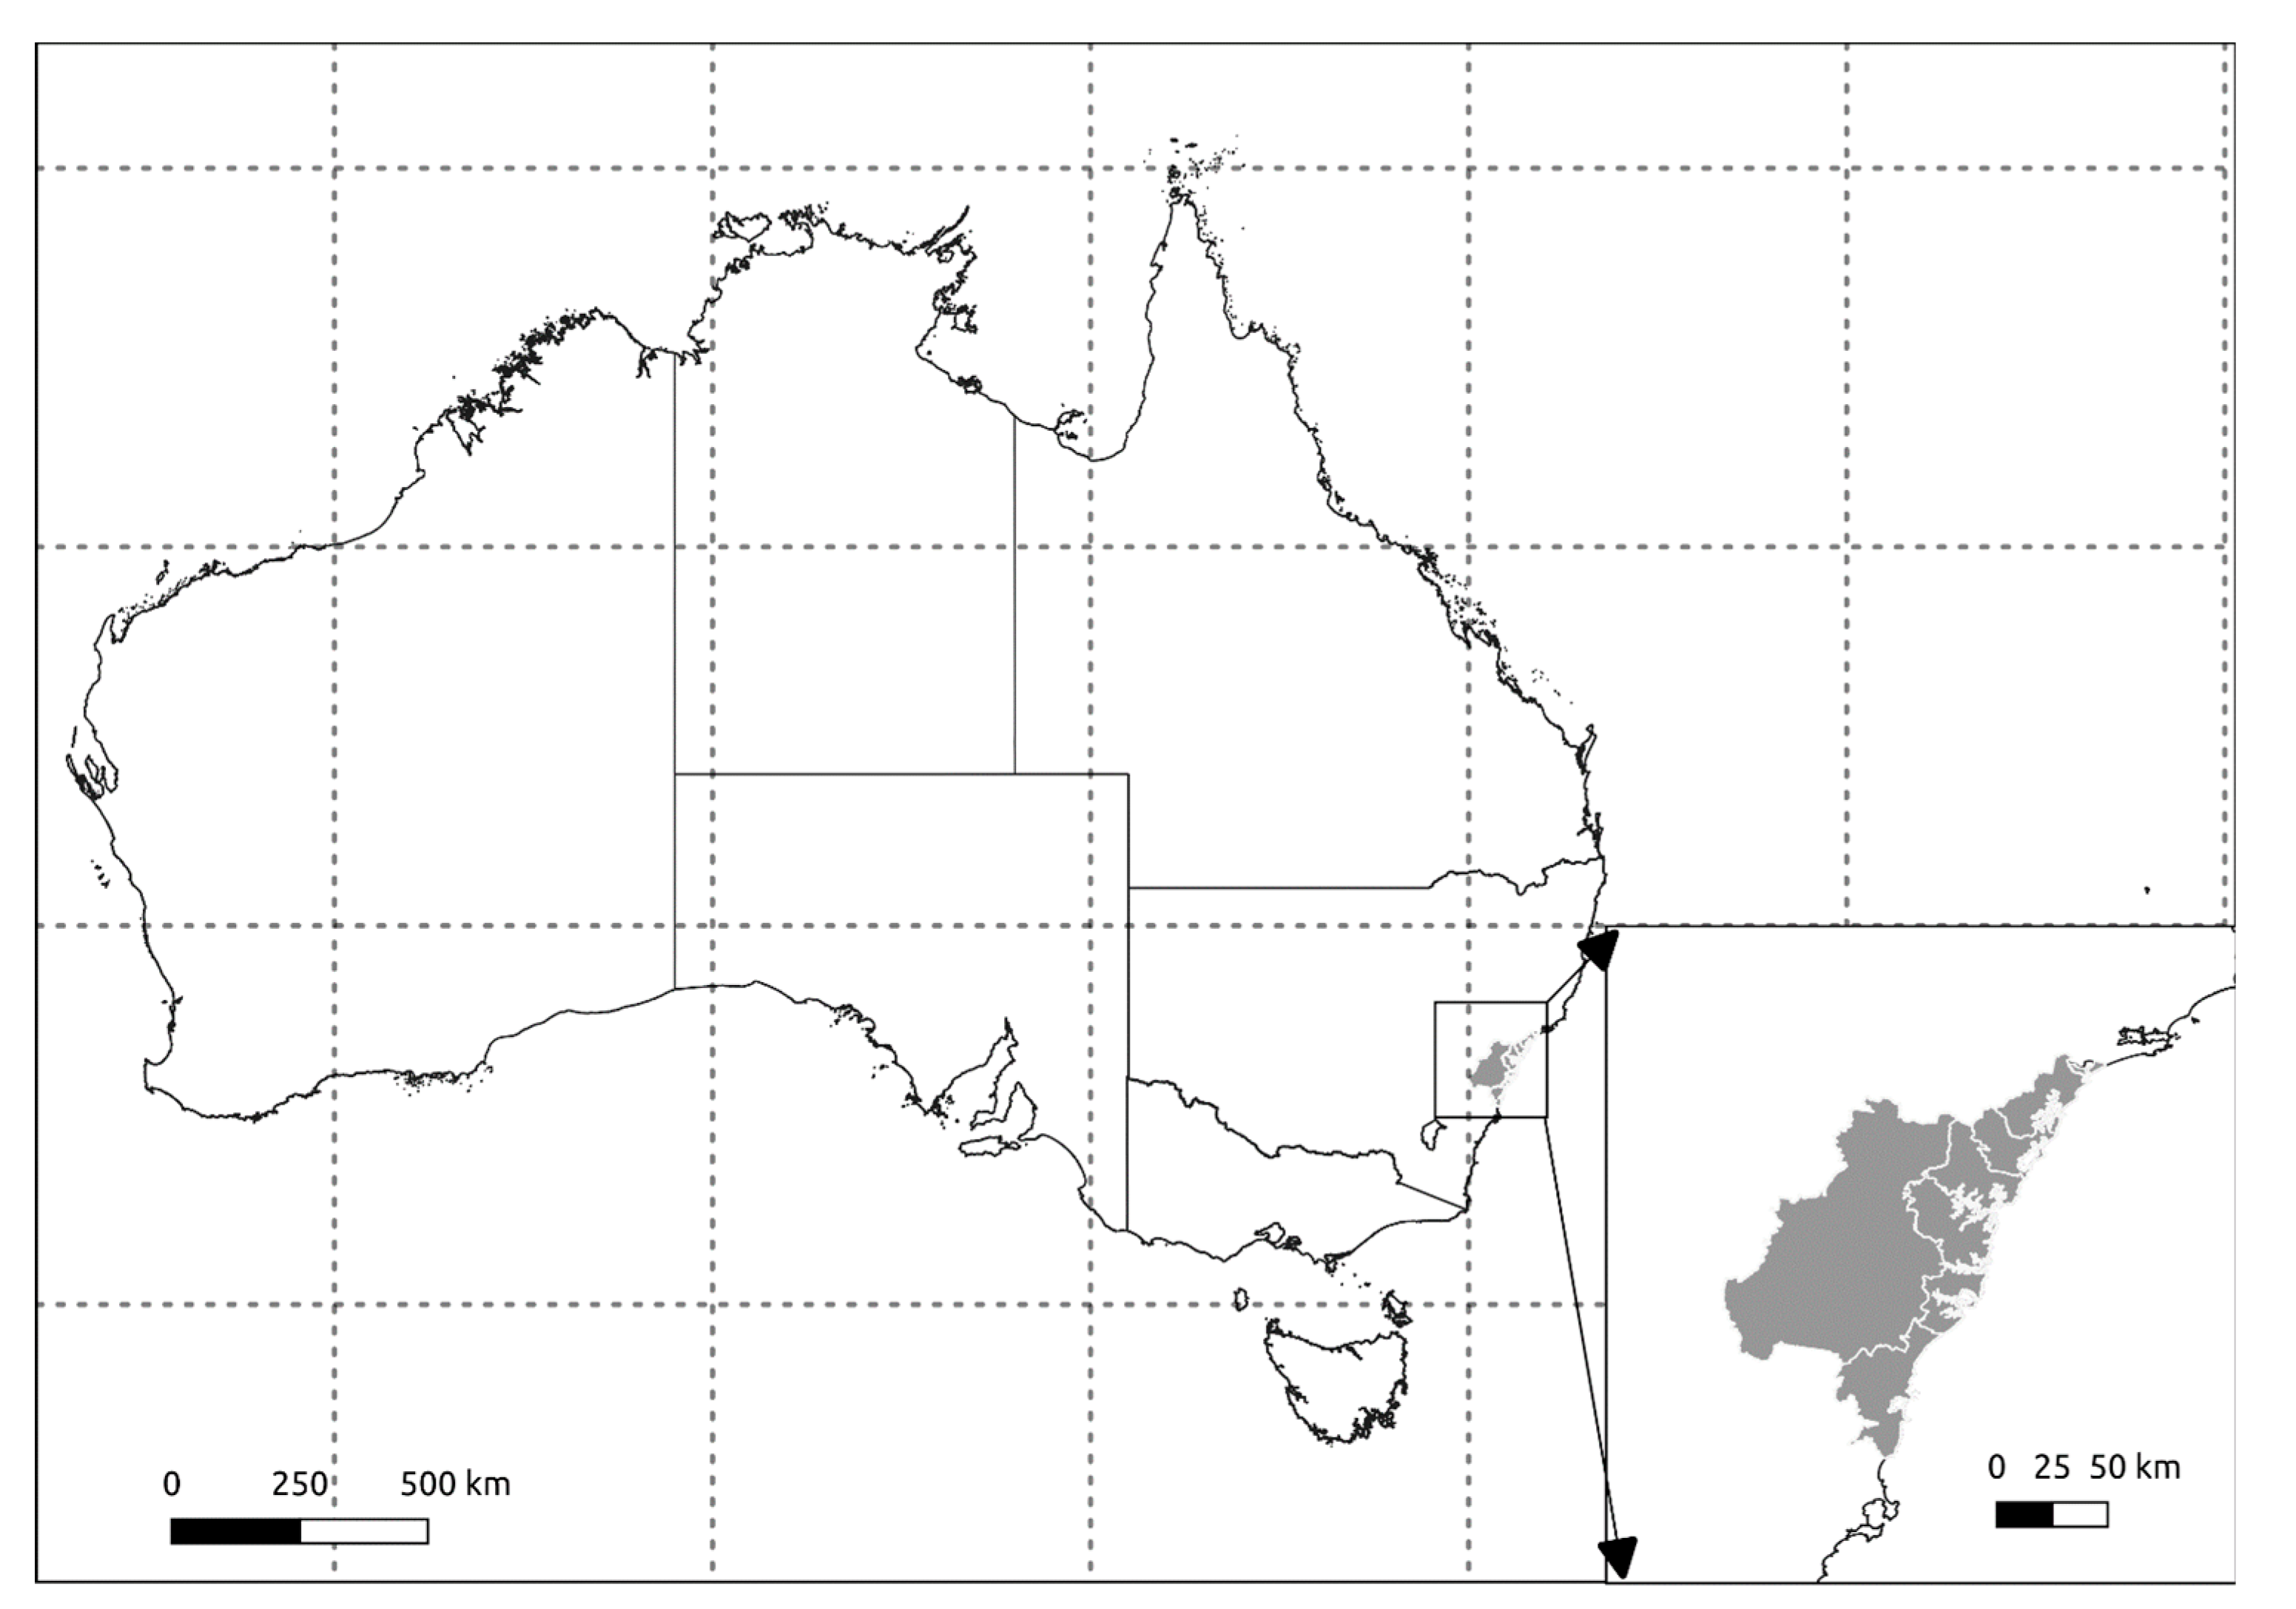
Figure 1. The location and Climate Zone partitions of the study region of Sydney, NSW, Australia (longitude 151.21° E, latitude 33.87° S).
Atmosphere 13 00714 g001
Figure 2. Urban heat island temperature anomaly (A) and % vegetation cover (B).
Atmosphere 13 00714 g002
Figure 3. (A) Time-series of heat-attributable numbers (AN) of deaths in Sydney GMR with (grey) and without (red) the urban heat island (UHI) effect. Heat ANs in the absence of the UHI effect were calculated for all years using the UHI anomalies from the summer of 2015/2016. The total population of the Sydney GMR was 5.6 million in 2018. (B) Urban heat island (UHI) air temperature (T2m) anomaly by percentage tree cover; each data point represents a mesh block.
Atmosphere 13 00714 g003
Figure 4. Future annual numbers of heatwave days exceeding the 99th percentile 24 h temperature threshold for at least two consecutive days from the period 1986–2005; heatwave days were flagged for the global climate model (GCM) ensembles CSIRO-BOM ACCESS1.0, CSIRO-BOM ACCESS1.3 and CanESM2 based on the physical configurations of the weather research and forecasting (WRF) models R1 and R2. The ensemble mean is shown as a black line.
Atmosphere 13 00714 g004
Table 1. Stratified relative risks (RRs) of heat deaths in Sydney.
Under 75 Years Over 75 Years
24 h temperature percentile90th95th98th99th90th95th98th99th
RR estimate1.031.021.031.121.031.041.081.12
RR lower confidence interval1.011.000.971.021.011.021.031.04
RR upper confidence interval1.051.051.081.231.041.071.121.21
Table 2. Percentile temperature thresholds and numbers of heatwave days from observations and NSW and ACT Regional Climate Modelling projections.
24 h Temperature Percentile90th95th98th99th
Observed AWAP temperature thresholds °C 1997–201623.5 °C24.7 °C26.1 °C27.1 °C
Annual heatwave days (AWAP observations) 2006–201820.3411.383.063.23
NARCliM ensemble mean thresholds °C 1997–2016 22.6 °C24.0 °C25.5 °C26.6 °C
Annual heatwave days (NARCliM ensemble) 2006–201820.1111.993.864.53
Annual heatwave days (NARCliM ensemble) 2030–204929.1819.116.936.46
Annual heatwave days (NARCliM ensemble) 2080–209940.4639.0719.7424.55
Table 3. Average annual observed (Australian Water Availability Project) and projected (NSW and ACT Regional Climate Modelling) heatwave (HW) days with no urban heat island (UHI) effect, and numbers of heatwave-attributable deaths (AN) in Sydney Greater Metropolitan Region (GMR) with and without the UHI effect.
Average of Years HW Days 90th—No UHIHW Days 95th—No UHIHW Days 98th—No UHIHW Days 99th—No UHIANheat/100kANheat/100k—No UHIANAN—No UHI
Observed 2006–20183.20.00.30.02.2 (0.7, 3.5)0.2 (0.1, 0.2)117.3 (37.2, 189.8)9.3 (2.9, 13.7)
Modelled 2006–20183.92.20.80.52.4 (0.8, 3.9)0.4 (0.1, 0.6)141.2 (58.0, 229.6)22.4 (7.0, 36.2)
Modelled 2030–20496.73.00.90.63.7 (1.1, 6.0)0.6 (0.2, 0.9)217.6 (88.9, 354.9)33.1 (10.6, 53.0)
Modelled 2080–209919.811.03.73.49.3 (2.7, 15.3)2.2 (0.7, 3.5)543.1 (215.5, 898.4)127.6 (39.9, 206.5)
Publisher’s Note: MDPI stays neutral with regard to jurisdictional claims in published maps and institutional affiliations.