Article

Detailed Carbon Isotope Study of PM2.5 Aerosols at Urban Background, Suburban Background and Regional Background Sites in Hungary

1
INTERACT Centre, Institute for Nuclear Research, H-4001 Debrecen, Hungary
2
Air Quality Reference Center, Hungarian Meteorological Service, H-1181 Budapest, Hungary
3
Institute of Chemistry, Eötvös Lóránd University, H-1518 Budapest, Hungary
4
Doctoral School of Physics, University of Debrecen, H-4032 Debrecen, Hungary
*
Authors to whom correspondence should be addressed.
Atmosphere 2022, 13(5), 716; https://doi.org/10.3390/atmos13050716
Submission received: 7 March 2022 / Revised: 24 April 2022 / Accepted: 28 April 2022 / Published: 30 April 2022
(This article belongs to the Special Issue Air Quality in Hungary)

Abstract

:
The aim of this study was to estimate and refine the potential sources of carbon in the atmospheric PM2.5 fraction aerosol at three sampling sites in Hungary. Quantification of total, organic and elemental carbon (TC, OC and EC, respectively), as well as radiocarbon (14C) and stable carbon isotope analyses were performed on exposed filters collected at an urban background site, a suburban background site of the capital of Hungary, Budapest from October 2017 to July 2018. Results were also collected from the rural regional background site of K-puszta. Compared to TC concentrations from other regions of Europe, the ratio of the lowest and highest values at all sites in Hungary are lower than these European locations, probably due to the specific meteorological conditions prevailing in the Carpathian Basin over the observation period. The concentration of OC was constantly higher than that of EC and a seasonal variation with higher values in the heating period (October–March) and lower values in the non-heating vegetation period (April–September) could be observed for both EC and OC fractions. Using 14C, the seasonal mean fraction of contemporary carbon (fC) within the TC varied between 0.50 and 0.78 at the sites, suggesting that modern sources were remarkable during the year, regardless of the heating or vegetation period. At the two urban sites, assuming constant industrial emission during the year, the fossil fuel combustion sources were responsible for the seasonal variation of EC, while modern carbon emissions from biomass-burning and biogenic sources influenced the OC concentration. The higher EC/TC ratios at these sites were associated with lower fC and δ13C values, which can be explained by soot emission from transportation. The notably high EC/TC ratios in the spring were likely caused by the reduced concentration of OC instead of increased EC concentrations. This could probably be caused by the ending of winter biomass burning, which emits a huge amount of OC into the atmosphere. On the contrary, the rural K-puszta site showed some differences relative to the sites in Budapest. No correlation could be revealed between the EC/TC ratio, fC and δ13C results, suggesting that the structure of sources was very stagnant and balanced in each season. In autumn, however, some less depleted values were observed, and agricultural corn-stalk burning after harvesting in the southern and eastern directions from Hungary can be suggested as the main source.

1. Introduction

Atmospheric aerosols have long been the focus of numerous physical and chemical studies, due to their role in climate change and affecting the ambient environment, and as a potential risk to human health [1,2]. In addition to the inorganic and mineral fractions, carbonaceous material constitutes a major part, up to 80–90% at tropical sites, of the total particulate matter [3,4]. Aerosols may contain a huge variety of organic compounds and polymeric light-absorptive carbon, mineral carbonate is conventionally excluded from this classification and its amount is negligible for many applications in mid-latitudes. Traditionally, the total carbon content of carbonaceous particulate matter is denoted as TC, which is divided into organic carbon (OC) and elemental carbon (EC) sub-fractions [5,6]. OC comprises carbon from organic materials (OM) and compounds of low to medium molecular weight, while EC is a complex mix of organic polymers with graphitic structures. Regarding carbonaceous aerosol sources, contributors of OC need to be considered separately as primary (POC: directly emitted into the atmosphere) and secondary (SOC: generated in the atmosphere by nucleation and condensation processes from gaseous precursors) organic aerosols. POC sources include biogenic emissions, biomass burning (land clearance, waste burning, residential heating and cooking), fossil-fuel combustion (traffic emissions mainly from diesel engines, and coal combustion), anthropogenic non-combustion contributors, soil re-suspension, and sea-spray emissions. SOC is usually formed from biogenic, fossil, and biomass burning-related precursor gases during favourable meteorological conditions [4,7,8]. The graphite-like EC is produced via incomplete combustion processes of biomass and fossil fuels.
To distinguish fossil and contemporary (e.g., biomass burning and biogenic) sources of carbonaceous aerosols, radiocarbon (14C, a radioactive carbon isotope with a half-life of 5700 ± 30 years.) has long been proven to be an essential tracer [9,10,11]. Its application is based on the fact that fossil fuels do not contain 14C due to their long geological age, while the 14C signal of biological material and biomass-derived fuels approximately equals that of the ambient atmospheric CO2. There are many publications using this unique tracer and it is critical to refined source apportionment studies [12,13,14,15,16,17]. In addition to radiocarbon, stable carbon isotope ratio results (expressed in δ13C) of TC may also provide useful information for source identification. Since most relevant sources such as natural biological emissions, anthropogenic biomass burning, or fossil-fuel combustion have relatively well-defined δ13C ranges, it is possible in some special cases not just to identify single sources but their approximate contributions, as well [18,19,20].
The Carpathian Basin is a special sampling area from several perspectives. This is the largest orogenic basin in Europe and due to its central position on the continent; regions surrounding it have different emission characteristics, which may significantly influence the air quality in this basin. Among the most relevant atmospheric research in the region, Gelencsér et al. (2007) initially quantified the effects of biomass burning at the rural sampling site K-puszta, using the 14C technique [21]. Current air pollutant investigations are increasingly using simultaneous and coupled analyses of some beneficial chemical compounds [22,23,24,25] and similar techniques have also been applied in Hungary. For example, Salma et al. (2017) used a coupled radiocarbon + levoglucosan tracer method to determine that 40% of TC, collected in Budapest in 2014, derived from biomass burning, but the biological sources still accounted for 24% of TC [26]. Later, Major et al. (2021), using a combined radiocarbon + stable carbon isotope method, showed a definite seasonality for modern carbon fraction in PM2.5 in Debrecen, with increased and decreased contributions in the heating and vegetation periods, respectively. In addition, this study first applied successfully the combination of HYSPLIT trajectory modelling and FIRMS satellite observations for Hungary, showing the effect of long-transported particles on the most enriched δ13C values during autumn [27].
Our main goal was to analyse the components of carbonaceous aerosol samples and reveal the possible sources at three sites in Hungary, using thermal-optical and carbon isotopic results of TC. For this, we carried out seasonal campaigns at an urban background (BpART Lab) and suburban background (Gilice tér) site of Budapest, in addition, at the rural site of K-puszta. This study complements an earlier paper by Salma et al. (2020), where the carbon results were only used for source apportionment calculations, but the seasonal variations had not been analysed [28]. Here, we present seasonal means of the more detailed carbon isotope results (with daily resolution), combining the δ13C and 14C data with HYSPLIT back-trajectory modelling and FIRMS satellite observations to gain better insight into fossil and contemporary carbon sources at this rural site. These results can provide valuable information to decision-makers in identification of the most relevant emitters and in establishment of effective mitigation strategies.

2. Materials and Methods

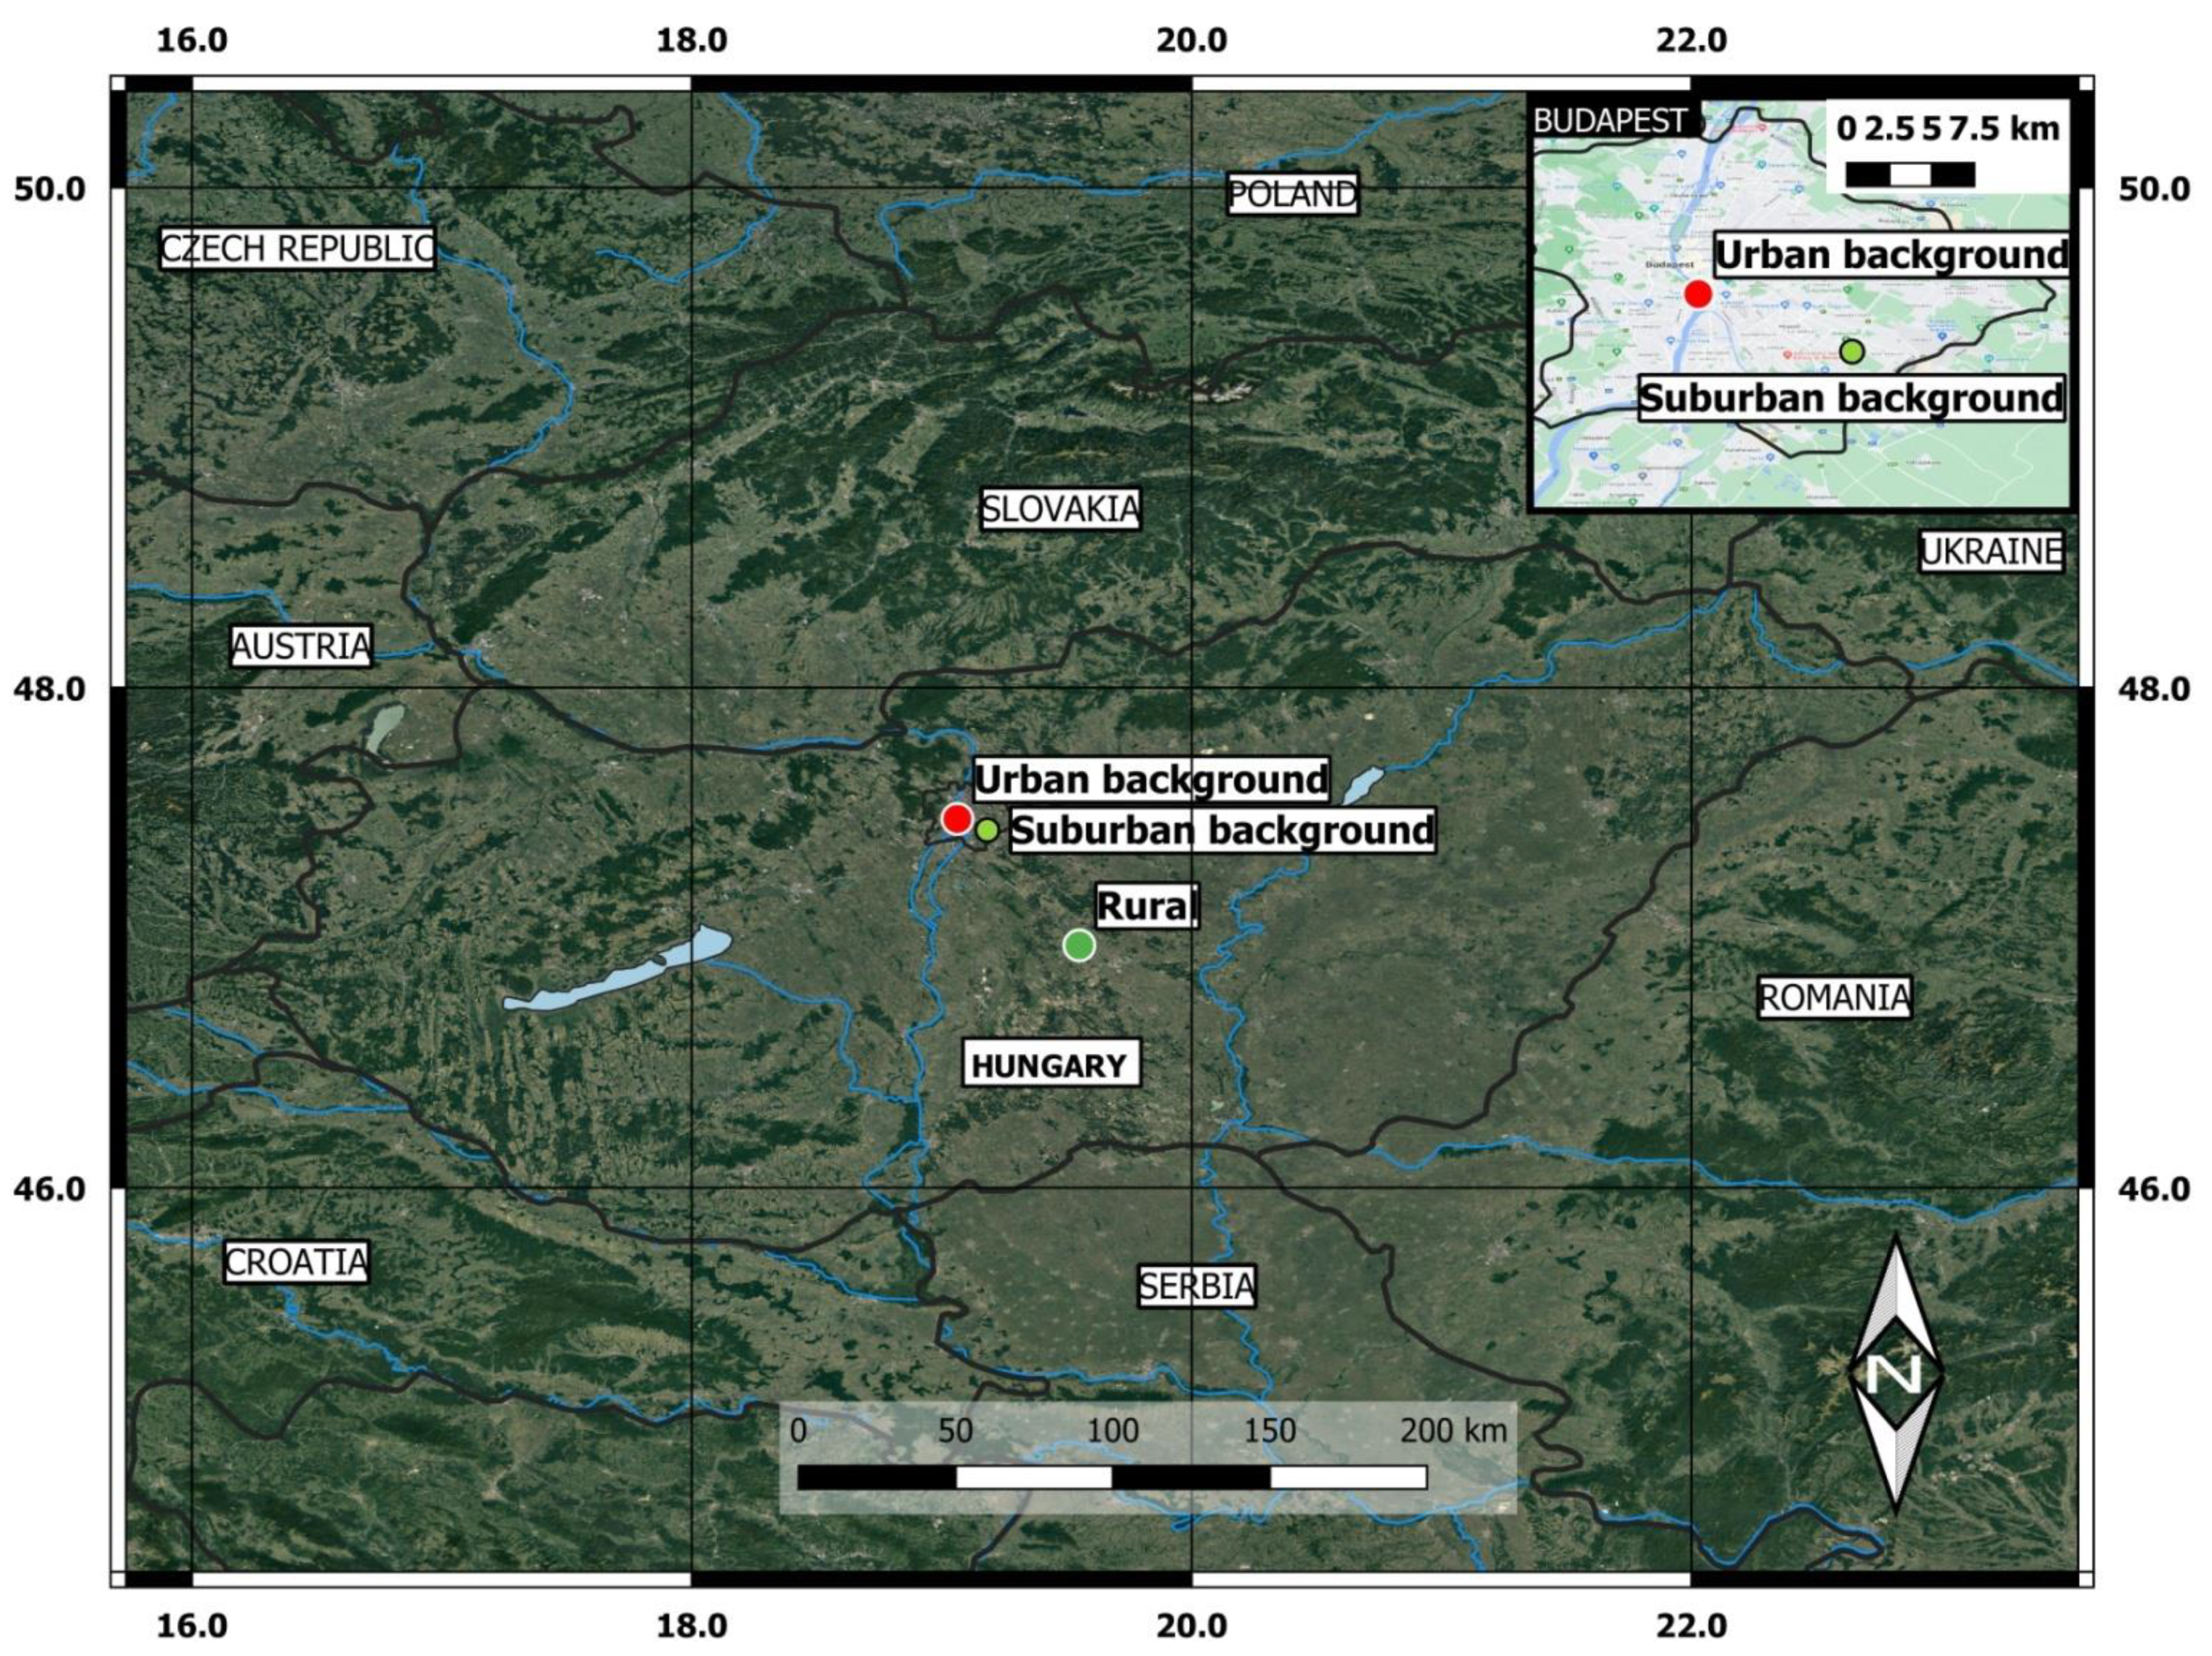
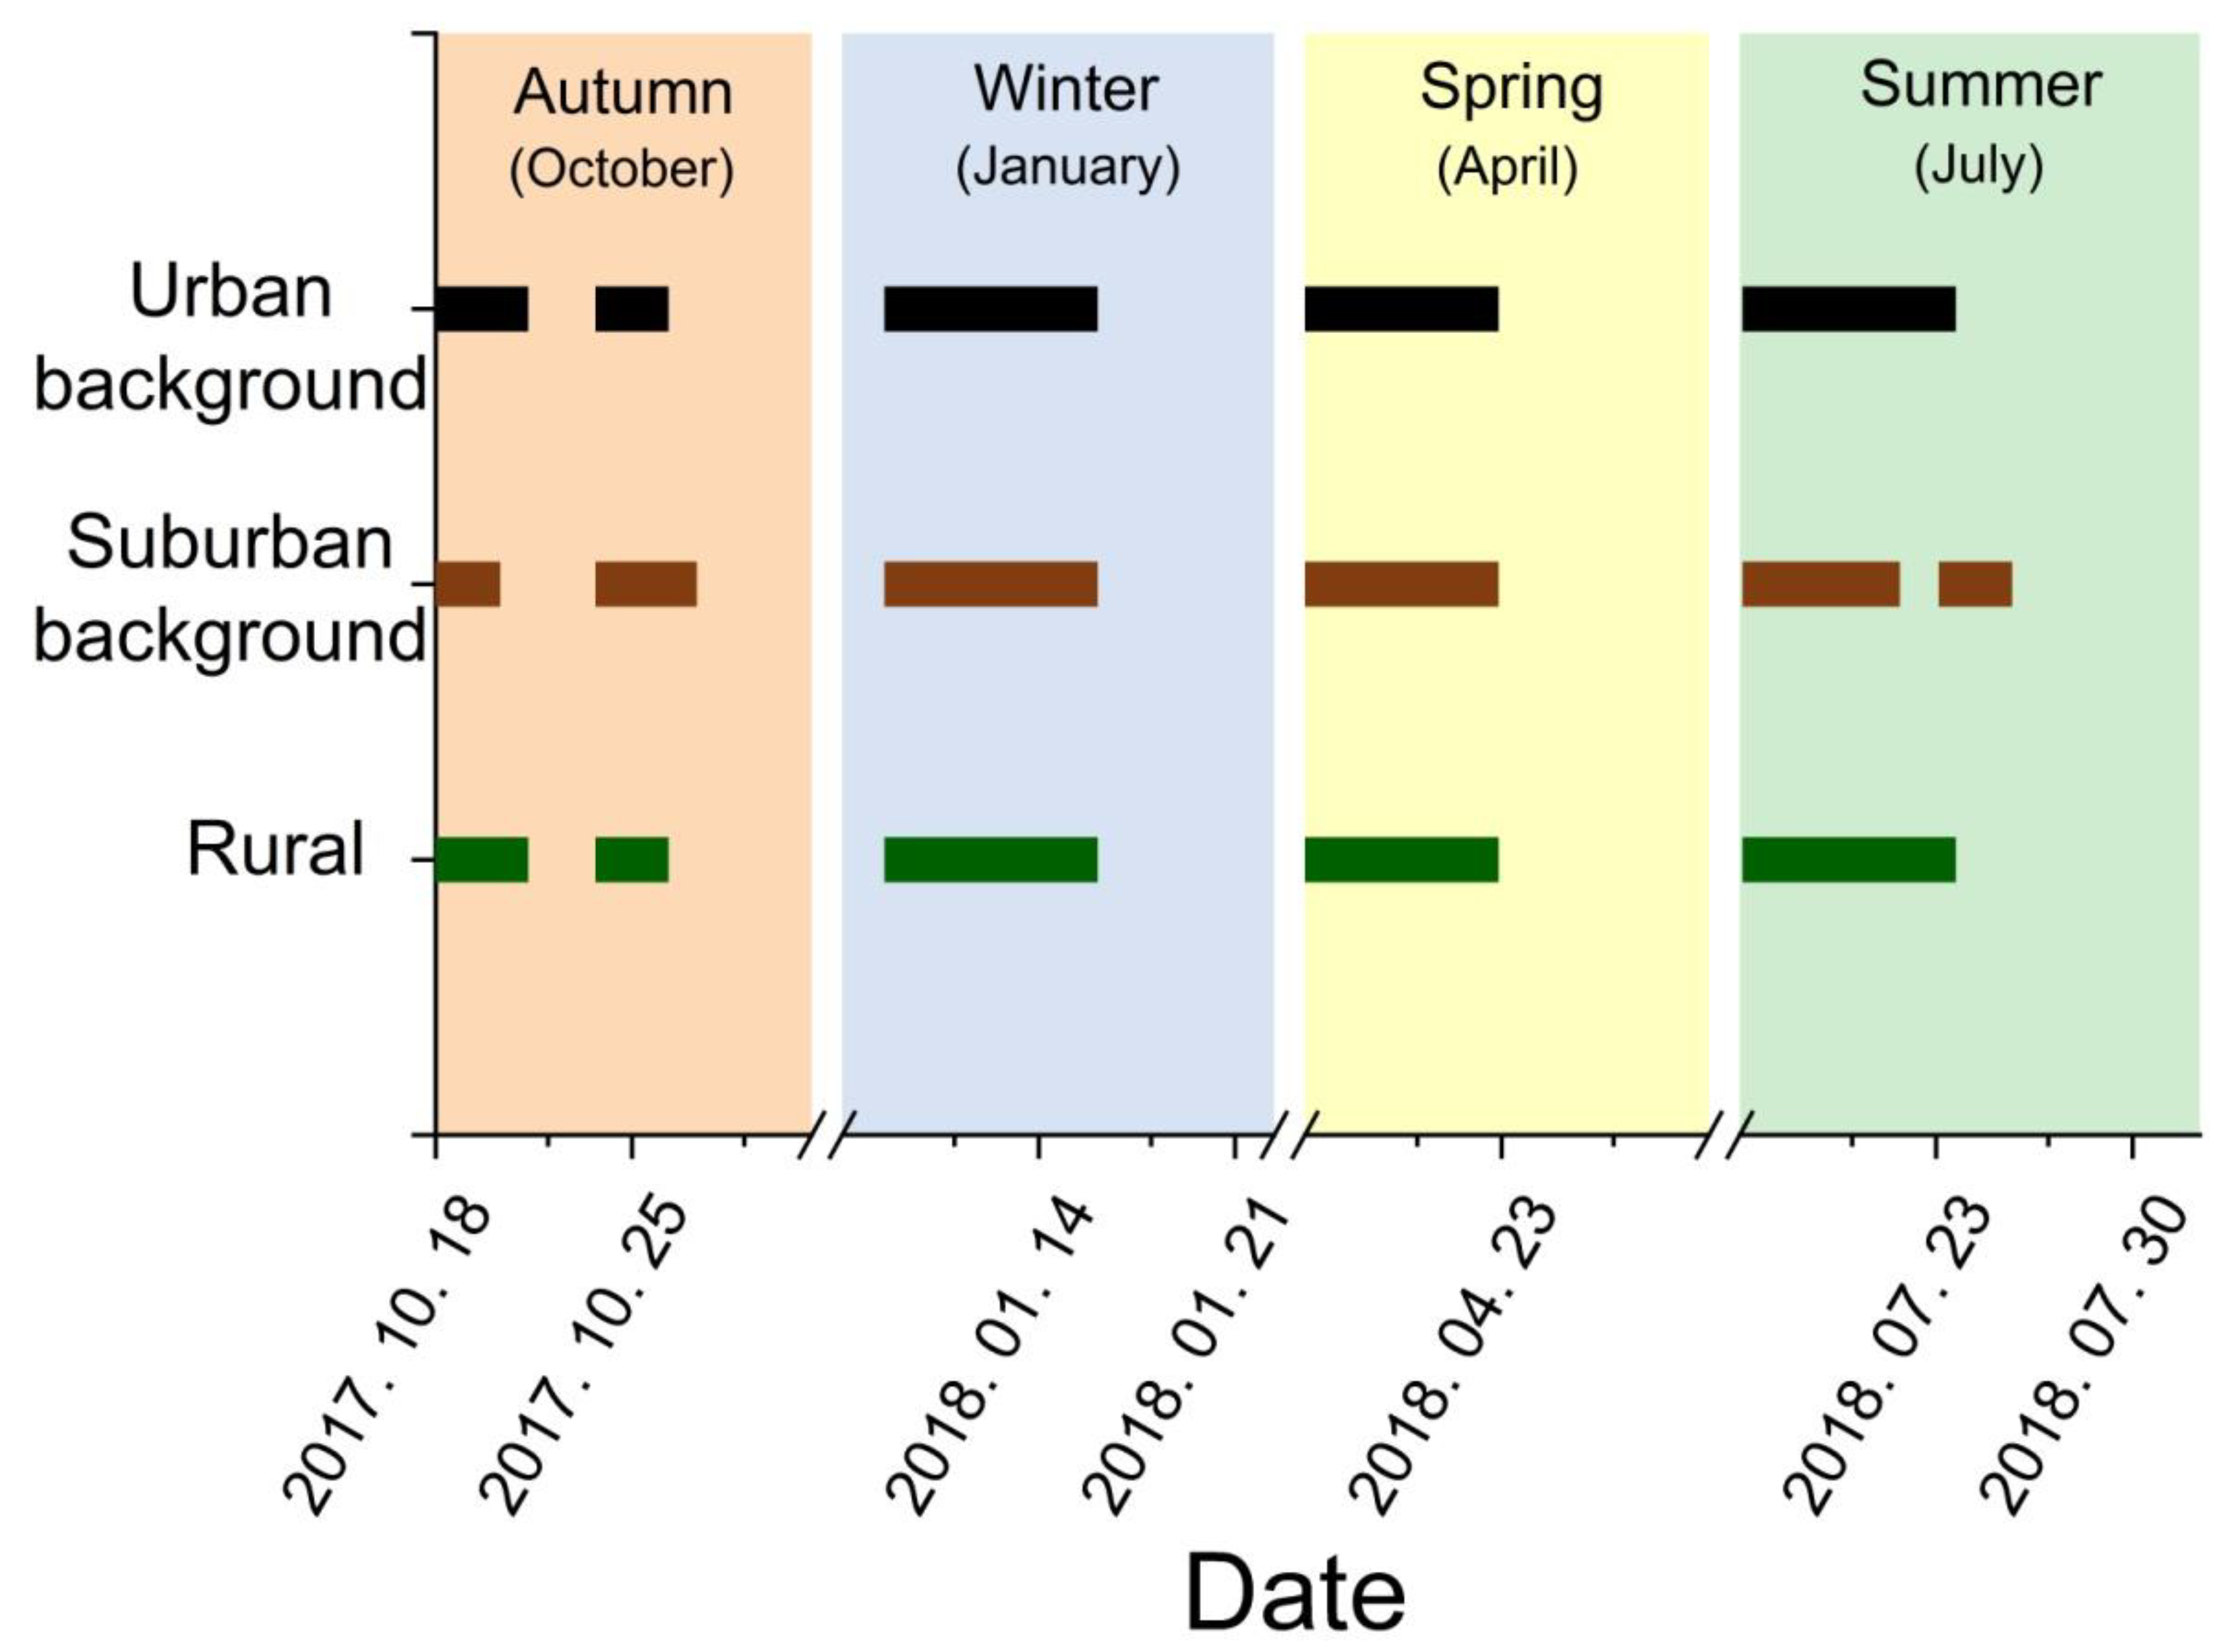
2.1. Description of the Sampling Locations and Collection of the Aerosol Samples

Detailed descriptions on the sampling sites and measurement techniques can be found in Salma et al. (2020). Briefly, PM2.5 aerosol samples were collected at three different sites in Hungary between October 2017 and July 2018: in the urban centre of Budapest, in a suburban area of Budapest and at the rural sampling site of K-puszta, in the central region of Hungary. The urban site is situated at the Budapest platform for Aerosol Research and Training (BpART) Laboratory of the Eötvös Loránd University (ELTE, N 47.2803, E 19.0305, 115 m a.s.l.), on the bank of the River Danube, which represents a well-mixed average atmosphere of the city centre [29]. The suburban sampling site is located in a residential area of Budapest (Gilice tér, Marczell György Main Observatory of the Hungarian Meteorological Service, N 47.2505, E 19.1005, 138 m a.s.l) in the southern part of the capital. Regional background samples were collected at the rural location of K-puszta (N 46.5706, E 19.3204, 125 m a.s.l.), which is representative for the Great Hungarian Plain of the Carpathian Basin. This site is part of the European Monitoring and Evaluation Programme (EMEP network). The K-puszta station is surrounded by a mixed forest of coniferous (60%) and deciduous trees (30%), some tillage and grassland [29]. The nearest city is Kecskemét (110,000 inhabitants), located about 15 km to the south-east of K-puszta.
The aerosol samples were collected by high-volume devices equipped with PM2.5 inlets (DHA-80, Digitel, Switzerland) onto quartz fibre filters (Ø: 150 mm, QR-100, Advantech, Japan). The sampling procedure was performed following the EN12341:2014 standard. Daily sampling started at 00:00 local time (UTC + 1 or daylight-saving time UTC + 2) for each day and the sampled air volume was ca. 720 m3. Before exposure, all filters were pre-heated at 500 °C for 24 h and were stored in a freezer after exposure. The quartz filters were conditioned at a temperature of 20 ± 1 °C and relative humidity (RH) of 45−50% for three days and were weighed in an isolated weighing room before and after the aerosol samplings according to the standard mentioned above. For blank correction of the actual samples, one field blank filter was taken for each site and campaign. The location of the sites and the sampling periods are shown in Figure 1 and Figure 2, respectively. At least seven exposed filters were collected in each season during the campaign. In the autumn season, there was a short break (2–3 days) at each site due to some technical problems; otherwise, the week-long sampling periods were continuous and well-synchronised at the three sites.

2.2. Organic and Elemental Carbon Analyses of the TC Fraction

From each filter, an area of 1.5 cm2 was directly analysed using the thermal–optical transmission (TOT) method-based [30] laboratory OC-EC analyser (Sunset Laboratory, Portland, OR, USA) adopting the EUSAAR2 thermal protocol [31]. These measurements were performed according to the European standard (MSZEN 16909:2017). The measured OC data for the exposed filters were corrected for the field blank values, while the EC on the blanks was negligible. All measured OC and EC data were above the limit values of detection, which were 0.38 and 0.04 μg m−3, respectively [28].

2.3. Radiocarbon Analysis of the TC Fraction

Before measurement, filters were conditioned for 24 h in the balance room, where constant humidity and temperature (~24 °C and ~50–60%) were kept during preparation. Radiocarbon analysis was performed on the TC content of the carbonaceous aerosol samples. TC was converted to CO2 by an off-line combustion method using sealed tubes and manganese-oxide reagent. After combustion at 550 °C for 3 days, the produced CO2 was purified and graphitized [32]. The 14C/12C ratios were measured by a MICADAS type accelerator mass spectrometer, at the Hertelendi Laboratory of Environmental Studies (HEKAL), Institute for Nuclear Research in Debrecen, Hungary. The 14C/12C isotope ratios were corrected for isotope fractionation using the simultaneously measured 13C/12C ratio and were normalised to that of the oxalic acid II (SRM-4990C) reference material (NIST, Gaithersburg, MD, USA). The measured result for the filters was corrected for the blank values. The final results were expressed as fraction modern carbon (fm), which means the 14C/12C ratio of the measured samples relative to that of the unperturbed atmosphere in the reference year of 1950. Since most of the recently combusted wood was growing after the atmospheric nuclear bomb tests in the late 1950s and early 1960s, the samples were corrected by a mean factor of 1.08, which is an estimated average for recent wood in the Northern Hemisphere [33,34]. From this factor, the fraction of contemporary carbon (fc) was calculated as:
f c = f m 1.08
The fraction of fossil carbon (ff) was calculated as:
f f = 1 f c
By definition, fc must be between 0 and 1, where 0 means that the entire amount of aerosol is fossil-derived without any modern carbon and it is 1, when the whole TC is entirely modern. The same correction factor was used for the TC from biogenic sources.

2.4. Stable Isotope Analysis of the TC Fraction

For stable carbon isotopic measurements, duplicated small discs (Ø: 5.5 mm) were cut out of each aerosol filter, which, after mass determination using a Sartorius® analytical balance with a mass resolution of 2 µg, were independently folded into an aluminium capsule (IVA Analysentechnike.K. Part No.: 76.9807.16) already containing some vanadium-pentoxide reagent (Elemental Microanalysis, EC No.: 215-239-8). In addition to the actual aerosol samples, sulfanilamide (CE Instruments, Cod. 338 25,100) and organic sediment (IVA 33,802,151 High organic sediment OAS) reference materials were also prepared in the same manner for the measurements. These two references are widely applied in the EA-IRMS technique, since its composing elements, such as carbon, nitrogen and sulphur, can also be found in the ambient aerosol. The stable carbon isotope ratio (13C/12C) analysis was performed by an isotope ratio mass spectrometer (Thermo Finnigan Delta PLUS XP IRMS) interfaced to an elemental analyser (Thermo Scientific™, EA IsoLinkCNSOH) at HEKAL [32].
Stable carbon isotope ratio results of ambient aerosol samples were compared to 13C/12C results of the reference materials to avoid systematic error and distortion in the measurements. The δ13C values were calculated using the following equation:
δ 13 C ( ) = 1000 R s a m p l e R r e f e r e n c e R r e f e r e n c e
where Rsample and Rreference mean the measured isotope ratio of ambient aerosol samples and reference materials, respectively. δ13C values are expressed against Vienna Pee Dee Belemnite (VPDB) in per mill (%) unit.

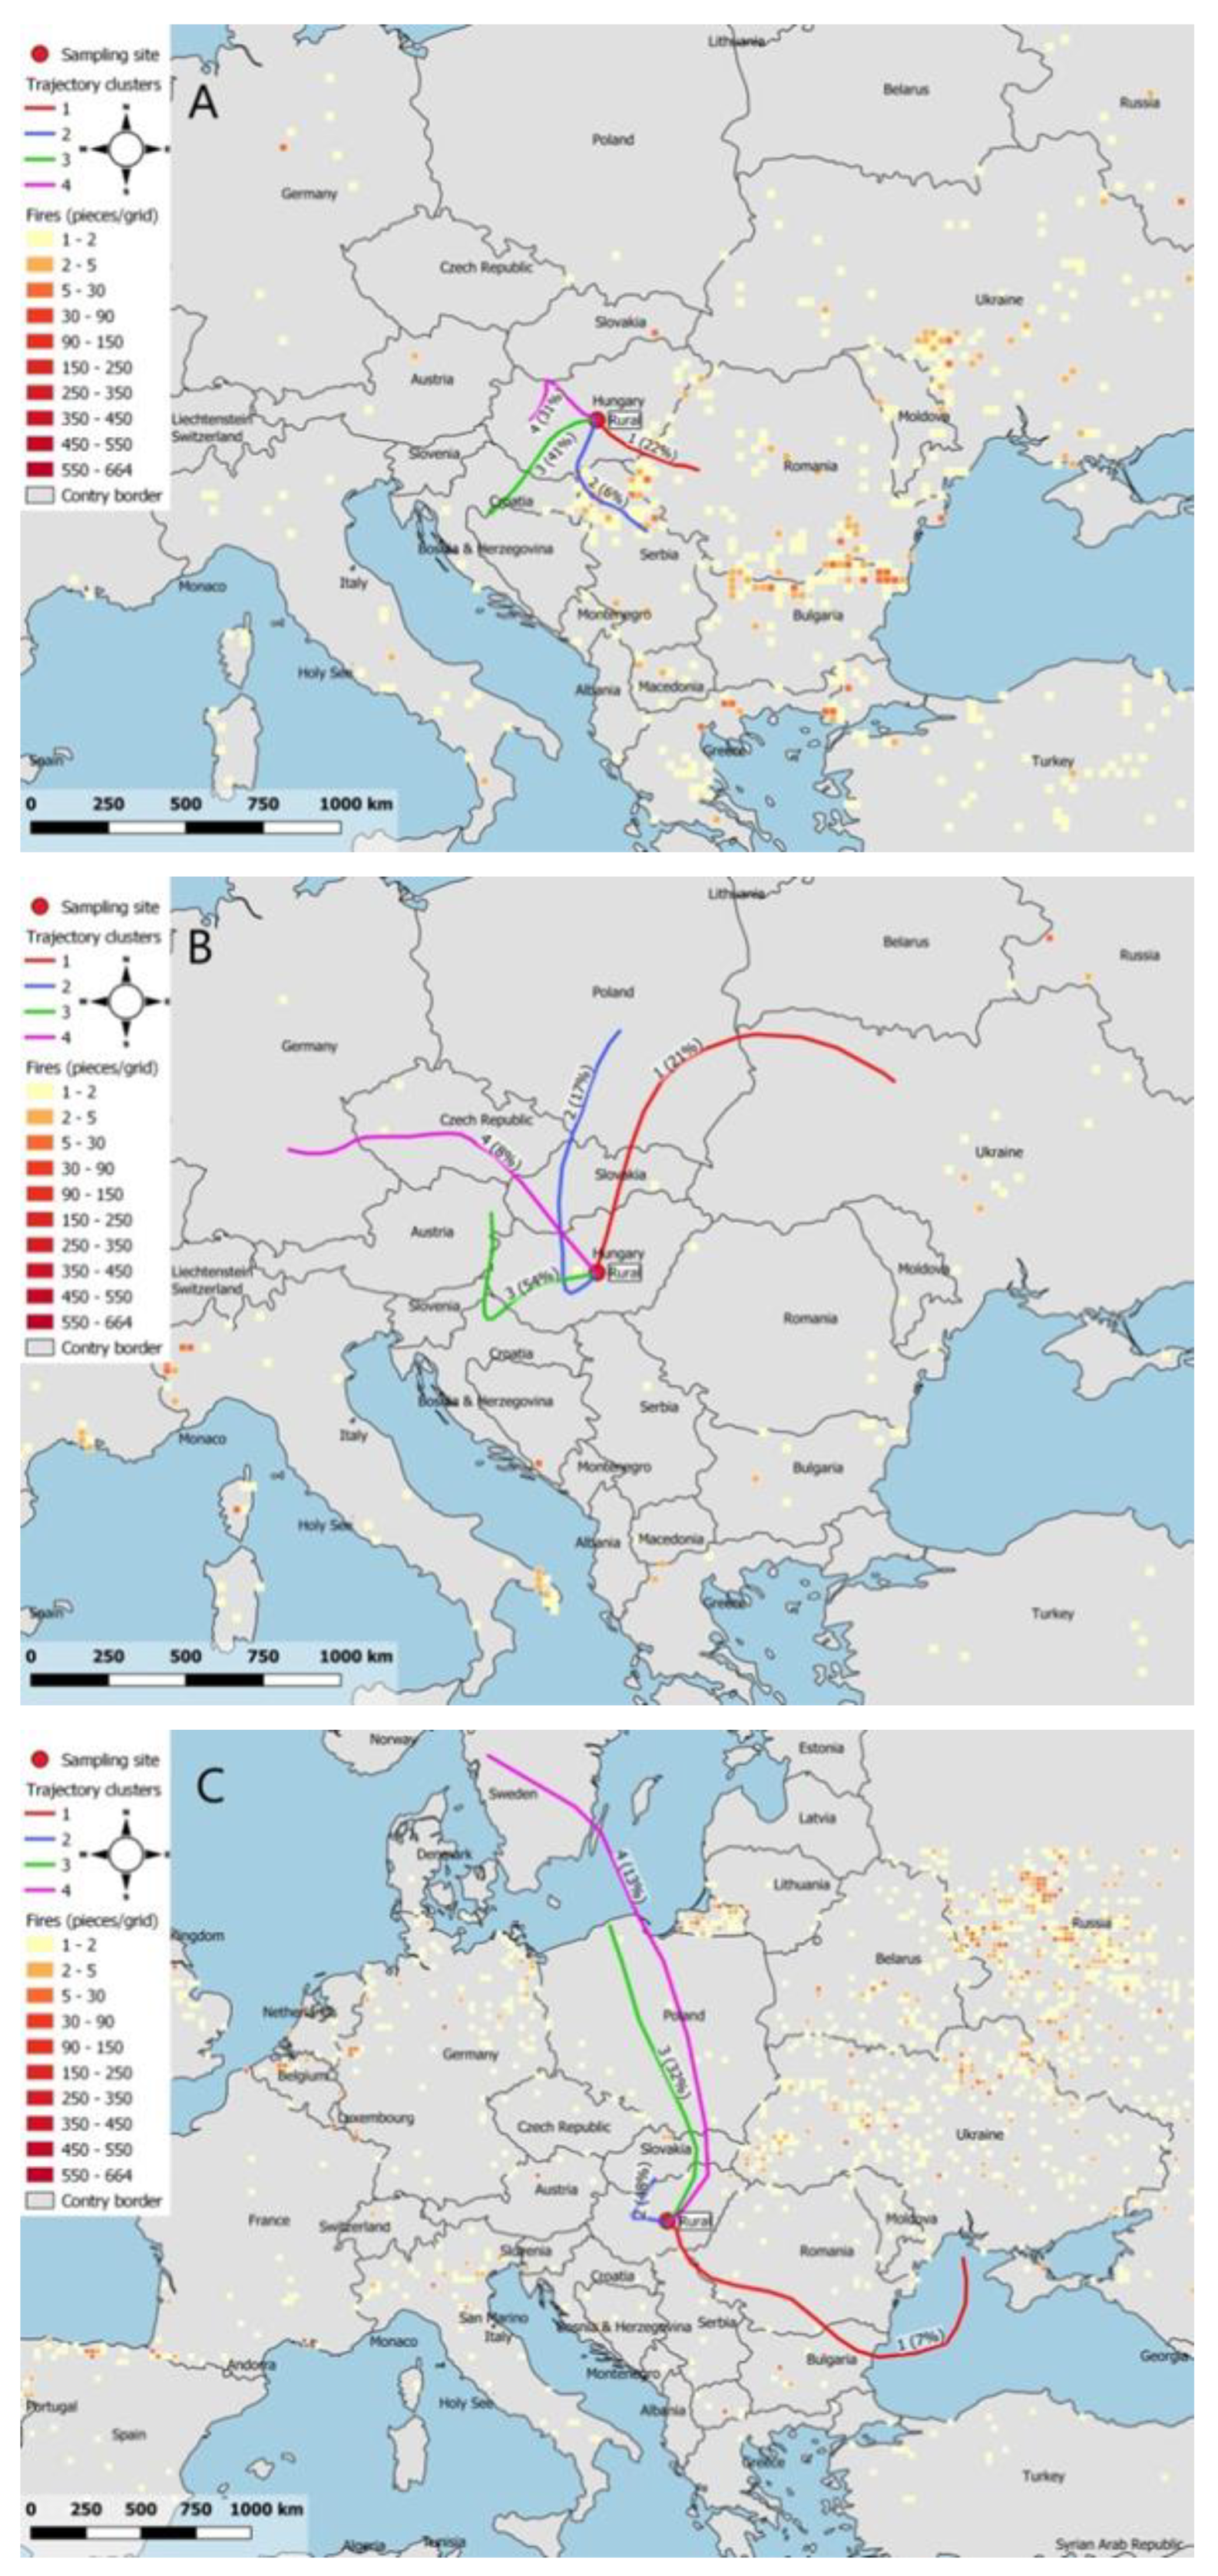
2.5. HYSPLIT Modelling and FIRMS Satellite Observations

In some special cases, samples with unusual δ13C values were studied by combined application of the HYSPLIT backward trajectory model and the NASA’s FIRMS satellite observations. Hybrid Single Particle Lagrangian Integrated Trajectory (HYSPLIT) backward model was used to simulate the trajectory histories of air masses. The meteorological dataset (GDAS0P5, 0.5° horizontal resolution) of Archive Global Data Assimilation System (GDAS) was used to run the trajectory models [35]. Forty-eight-hr-long backward trajectories were run eight times every day (starting time: 00UTC, 03UTC, 06UTC, 09UTC, 12UTC, 15UTC, 18UTC and 21UTC) during the selected time periods. We used the clustering and frequency analysis tool of the HYSPLIT model to make clusters and frequency maps from individual trajectories. Generally, we forced the model to generate four different typical clusters from the individual trajectories for easier separation of source regions [36,37]. For visualisation of open-air fire spots, the FIRMS software of NASA (https://firms.modaps.eosdis.nasa.gov, 17 November 2021) and the QGIS visualisation software were used. Closed fires like residential cooking or heating were not detectable by this technique.

3. Results

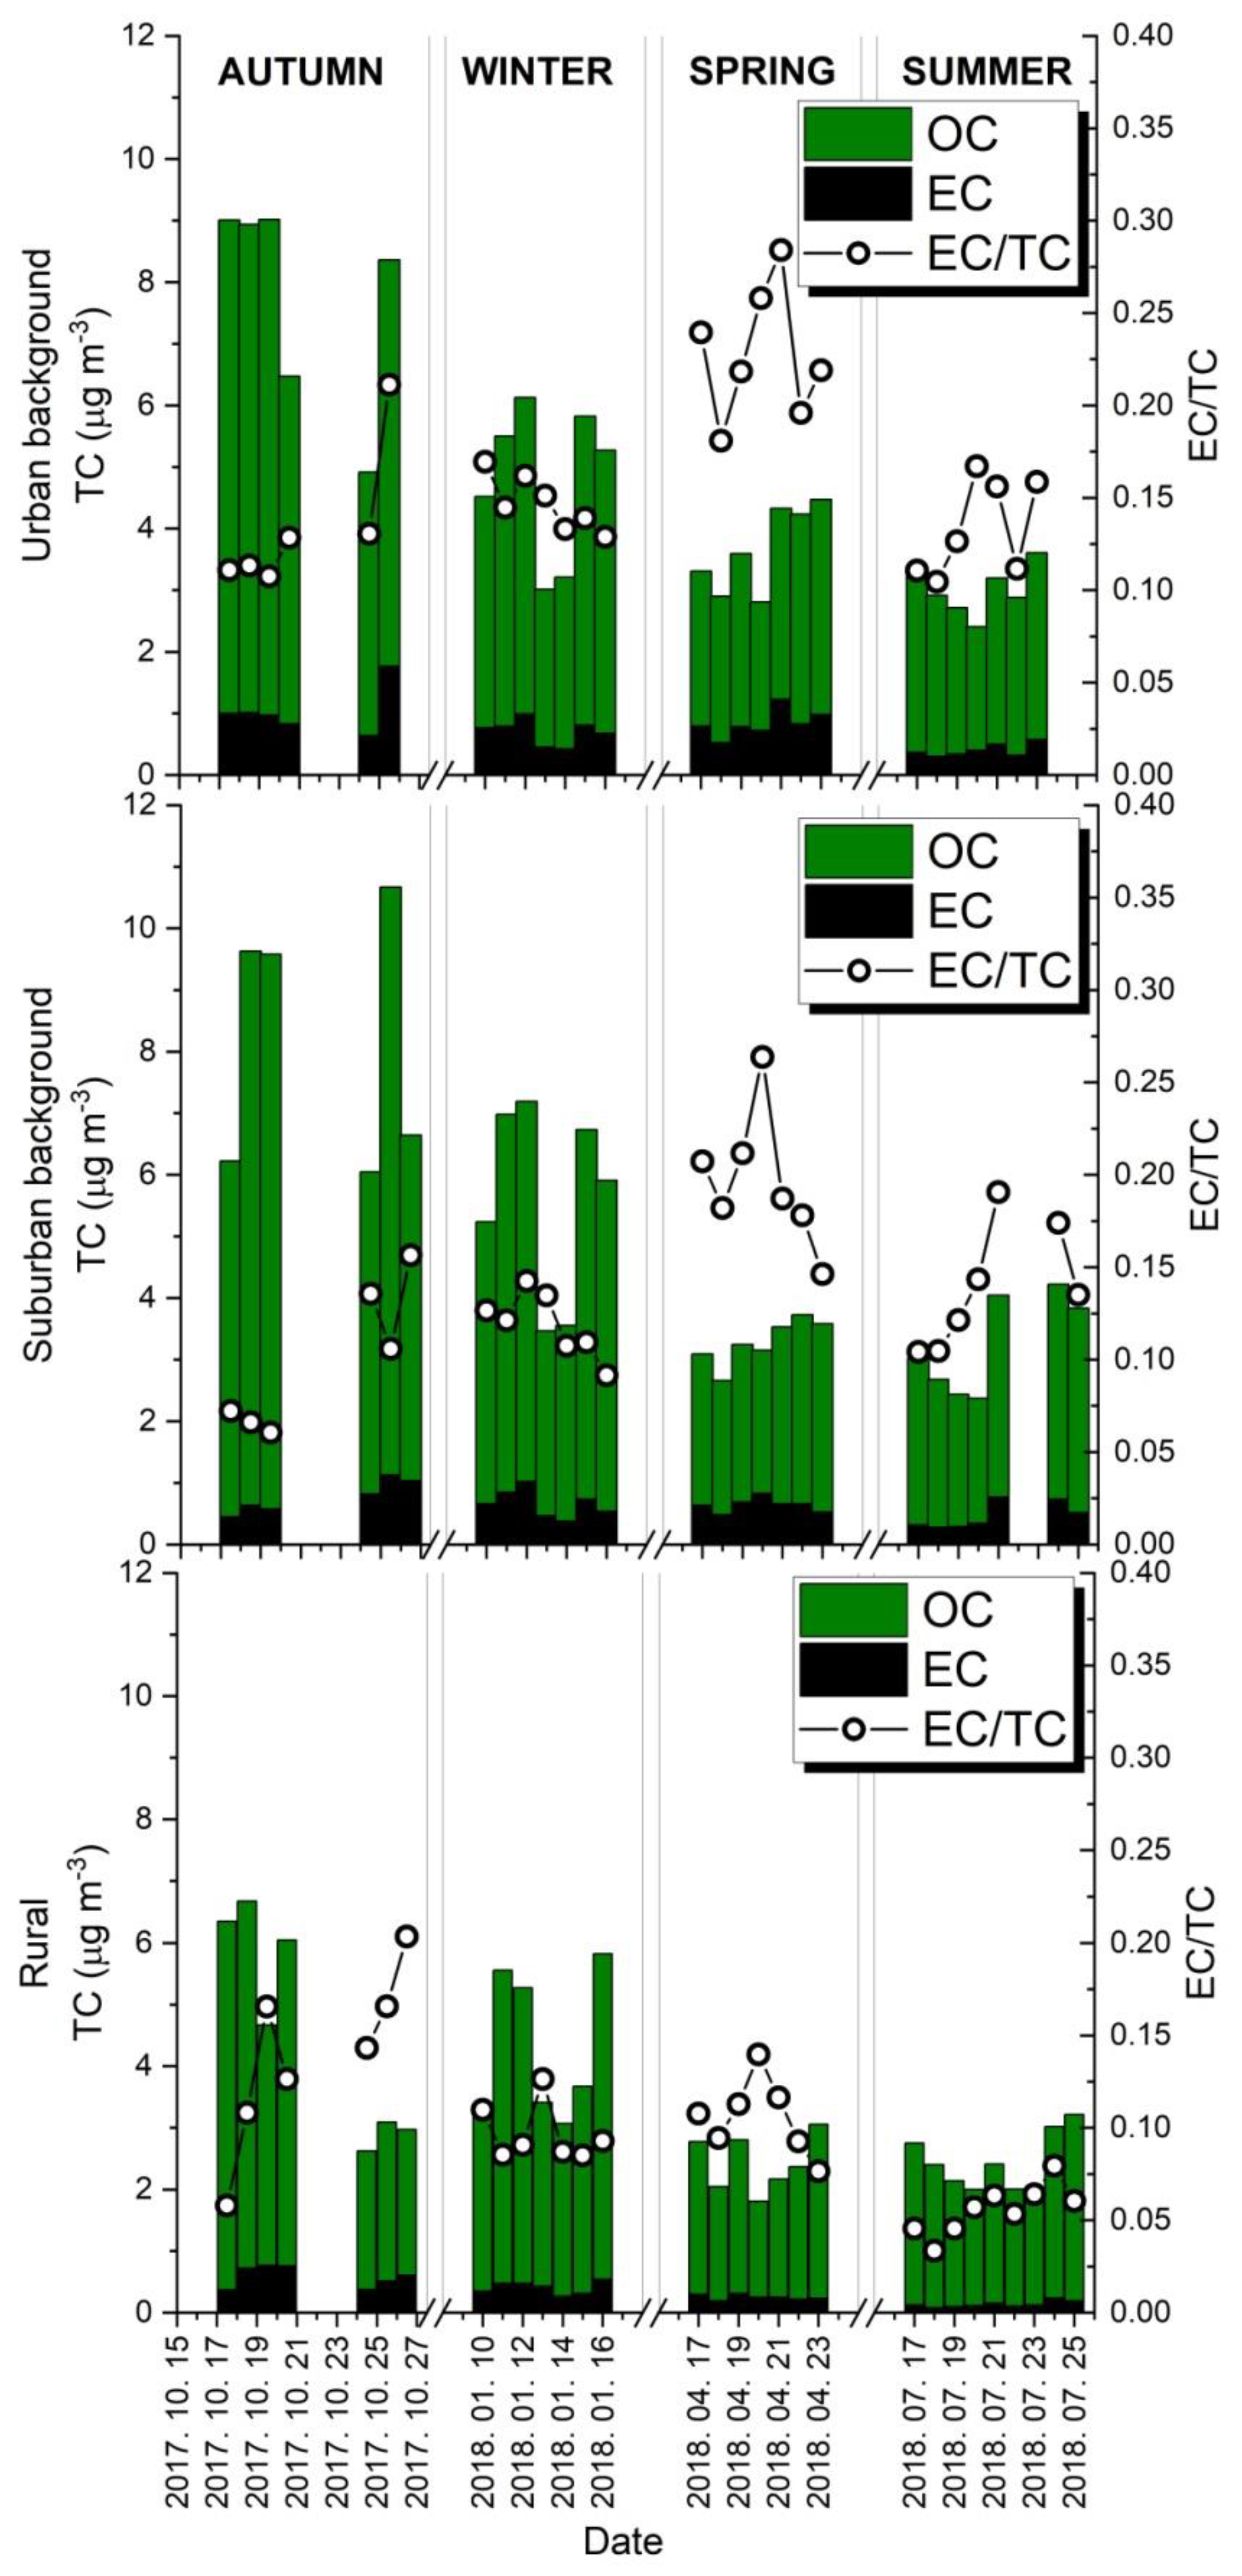
3.1. Seasonal Variation of TC, OC and EC Mass Concentrations and EC/TC Ratios

The temporal variation of TC, OC and EC mass concentrations and the EC/TC ratios obtained for the sites during the studied seasons are shown in Figure 3. As expected, K-puszta showed the lowest TC concentrations for the period, between 2.3 and 4.6 μg m−3. Based on our results, OC comprised the larger fraction of TC. The seasonal means of OC concentration at the urban background, suburban background and rural sampling sites ranged between 2.6 and 6.8 μg m−3; 2.6 and 7.4 μg m−3; and 2.2 and 4.0 μg m−3, respectively. The EC mass concentration remained substantially below that of the OC. The seasonal means of EC for the sites varied in the 0.4–1.0 μg m−3, 0.5–0.8 μg m−3 and 0.1–0.6 μg m−3 ranges, respectively. The rural site was characterised by lower mean values relative to the two urban background sites. Studying the annual variation of the three major carbonaceous species, similar fluctuations can be observed at all sampling sites. The annual maxima characterised the autumn period. In winter, slightly lower values could be observed, while the lowest values were obtained in the spring and summer periods. Considering the ratio of the seasonal mean concentrations of OC and EC, a similar factor of ~2.6 occurred between the highest (autumn) and the lowest (summer) means of the urban site. This ratio for the OC at the suburban background and the K-puszta sites was 2.7 and 0.8, respectively. However, this ratio for the seasonal mean EC values was as high as 4.3 at the rural site. Considering the whole period, seasonal OC fractions and their standard deviation (SD) values at the urban background, suburban background and rural sites constituted on average 83.8 ± 4.9%, 86.0 ± 4.8% and 90.4 ± 4.0% of the TC, respectively, showing an increasing trend from the urban site to the rural-type location. Supplementing the OC fractions to give 100%, the EC fraction exhibited the reverse trend namely 16.2 ± 4.9%, 14.0 ± 4.8% and 9.6 ± 4.0%, respectively, with the lowest value at K-puszta. From the aspects of source identification, the EC/TC ratios were also calculated. The mean EC/TC ratio and SD for the urban background site was 0.16 ± 0.05, while the seasonal values ranged from 0.13 to 0.23. For the suburban background site, a slightly lower mean value of 0.14 ± 0.05 was obtained and the seasonal means varied in the range of 0.10–0.20. The lowest mean value of 0.10 ± 0.04 was found at the rural site of K-puszta, ranging in the respective seasons from 0.06 to 0.14.

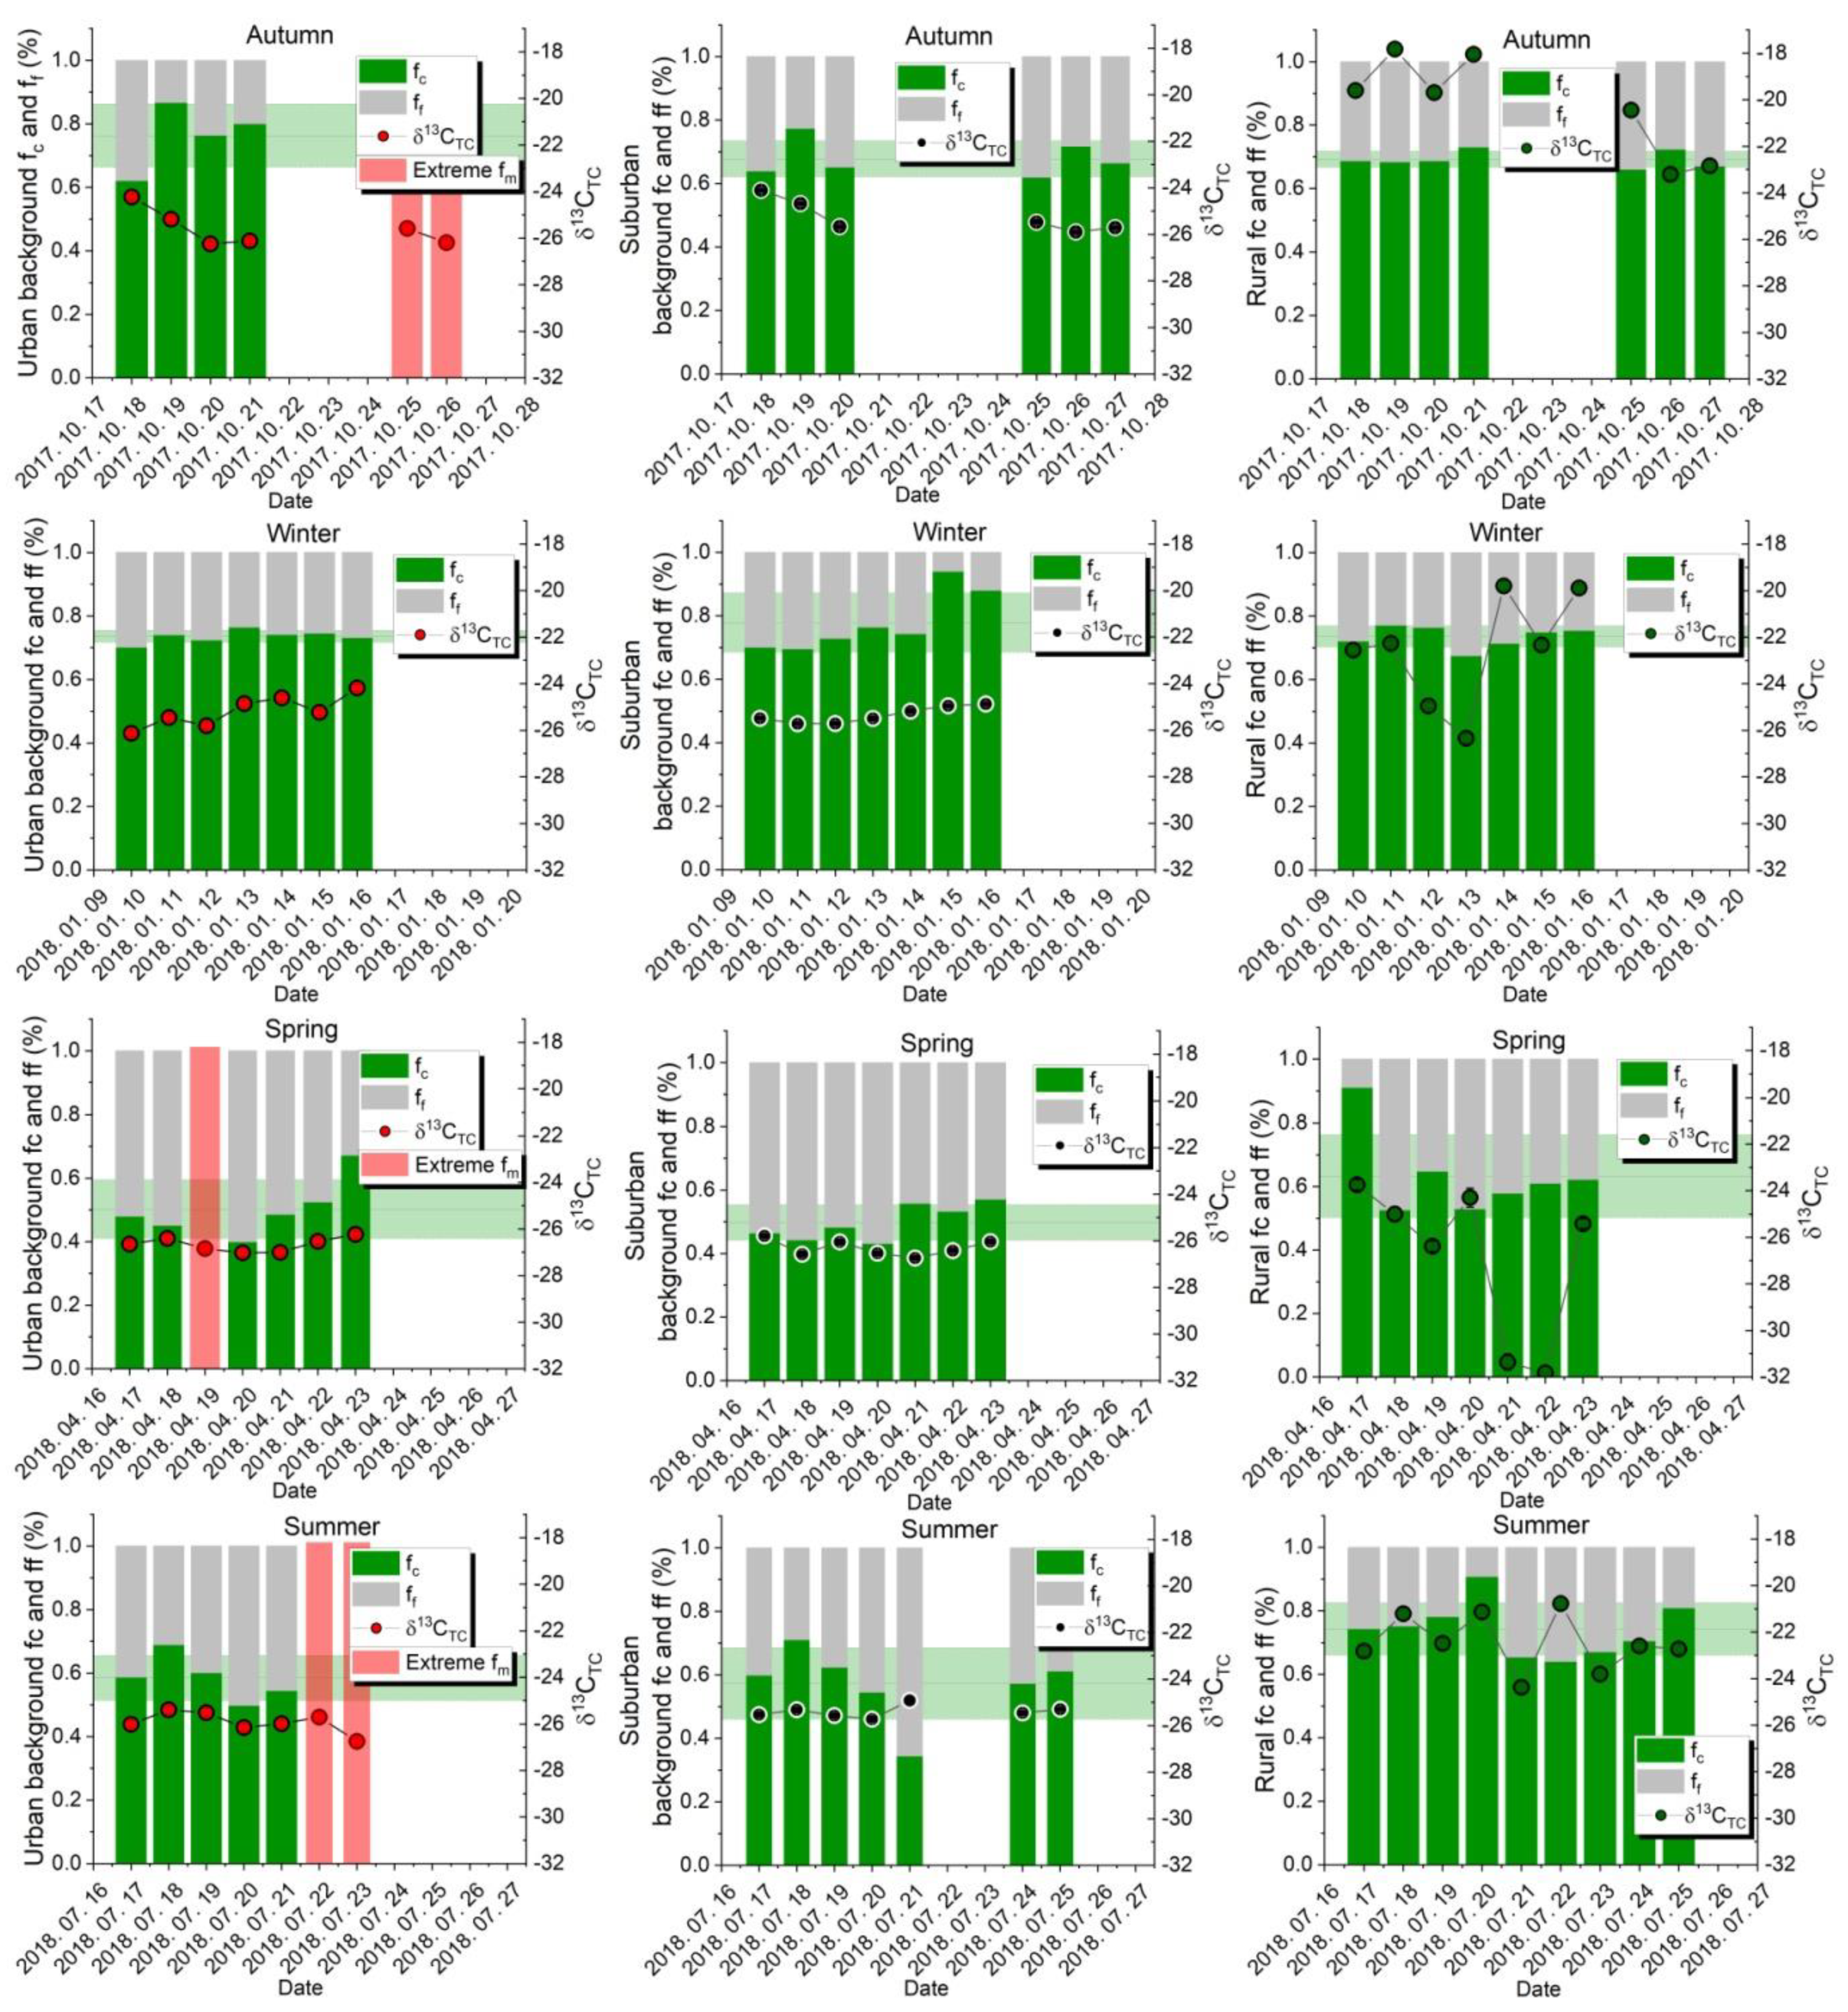
3.2. Seasonal Variation of the fC and δ13C Values in the TC Fraction
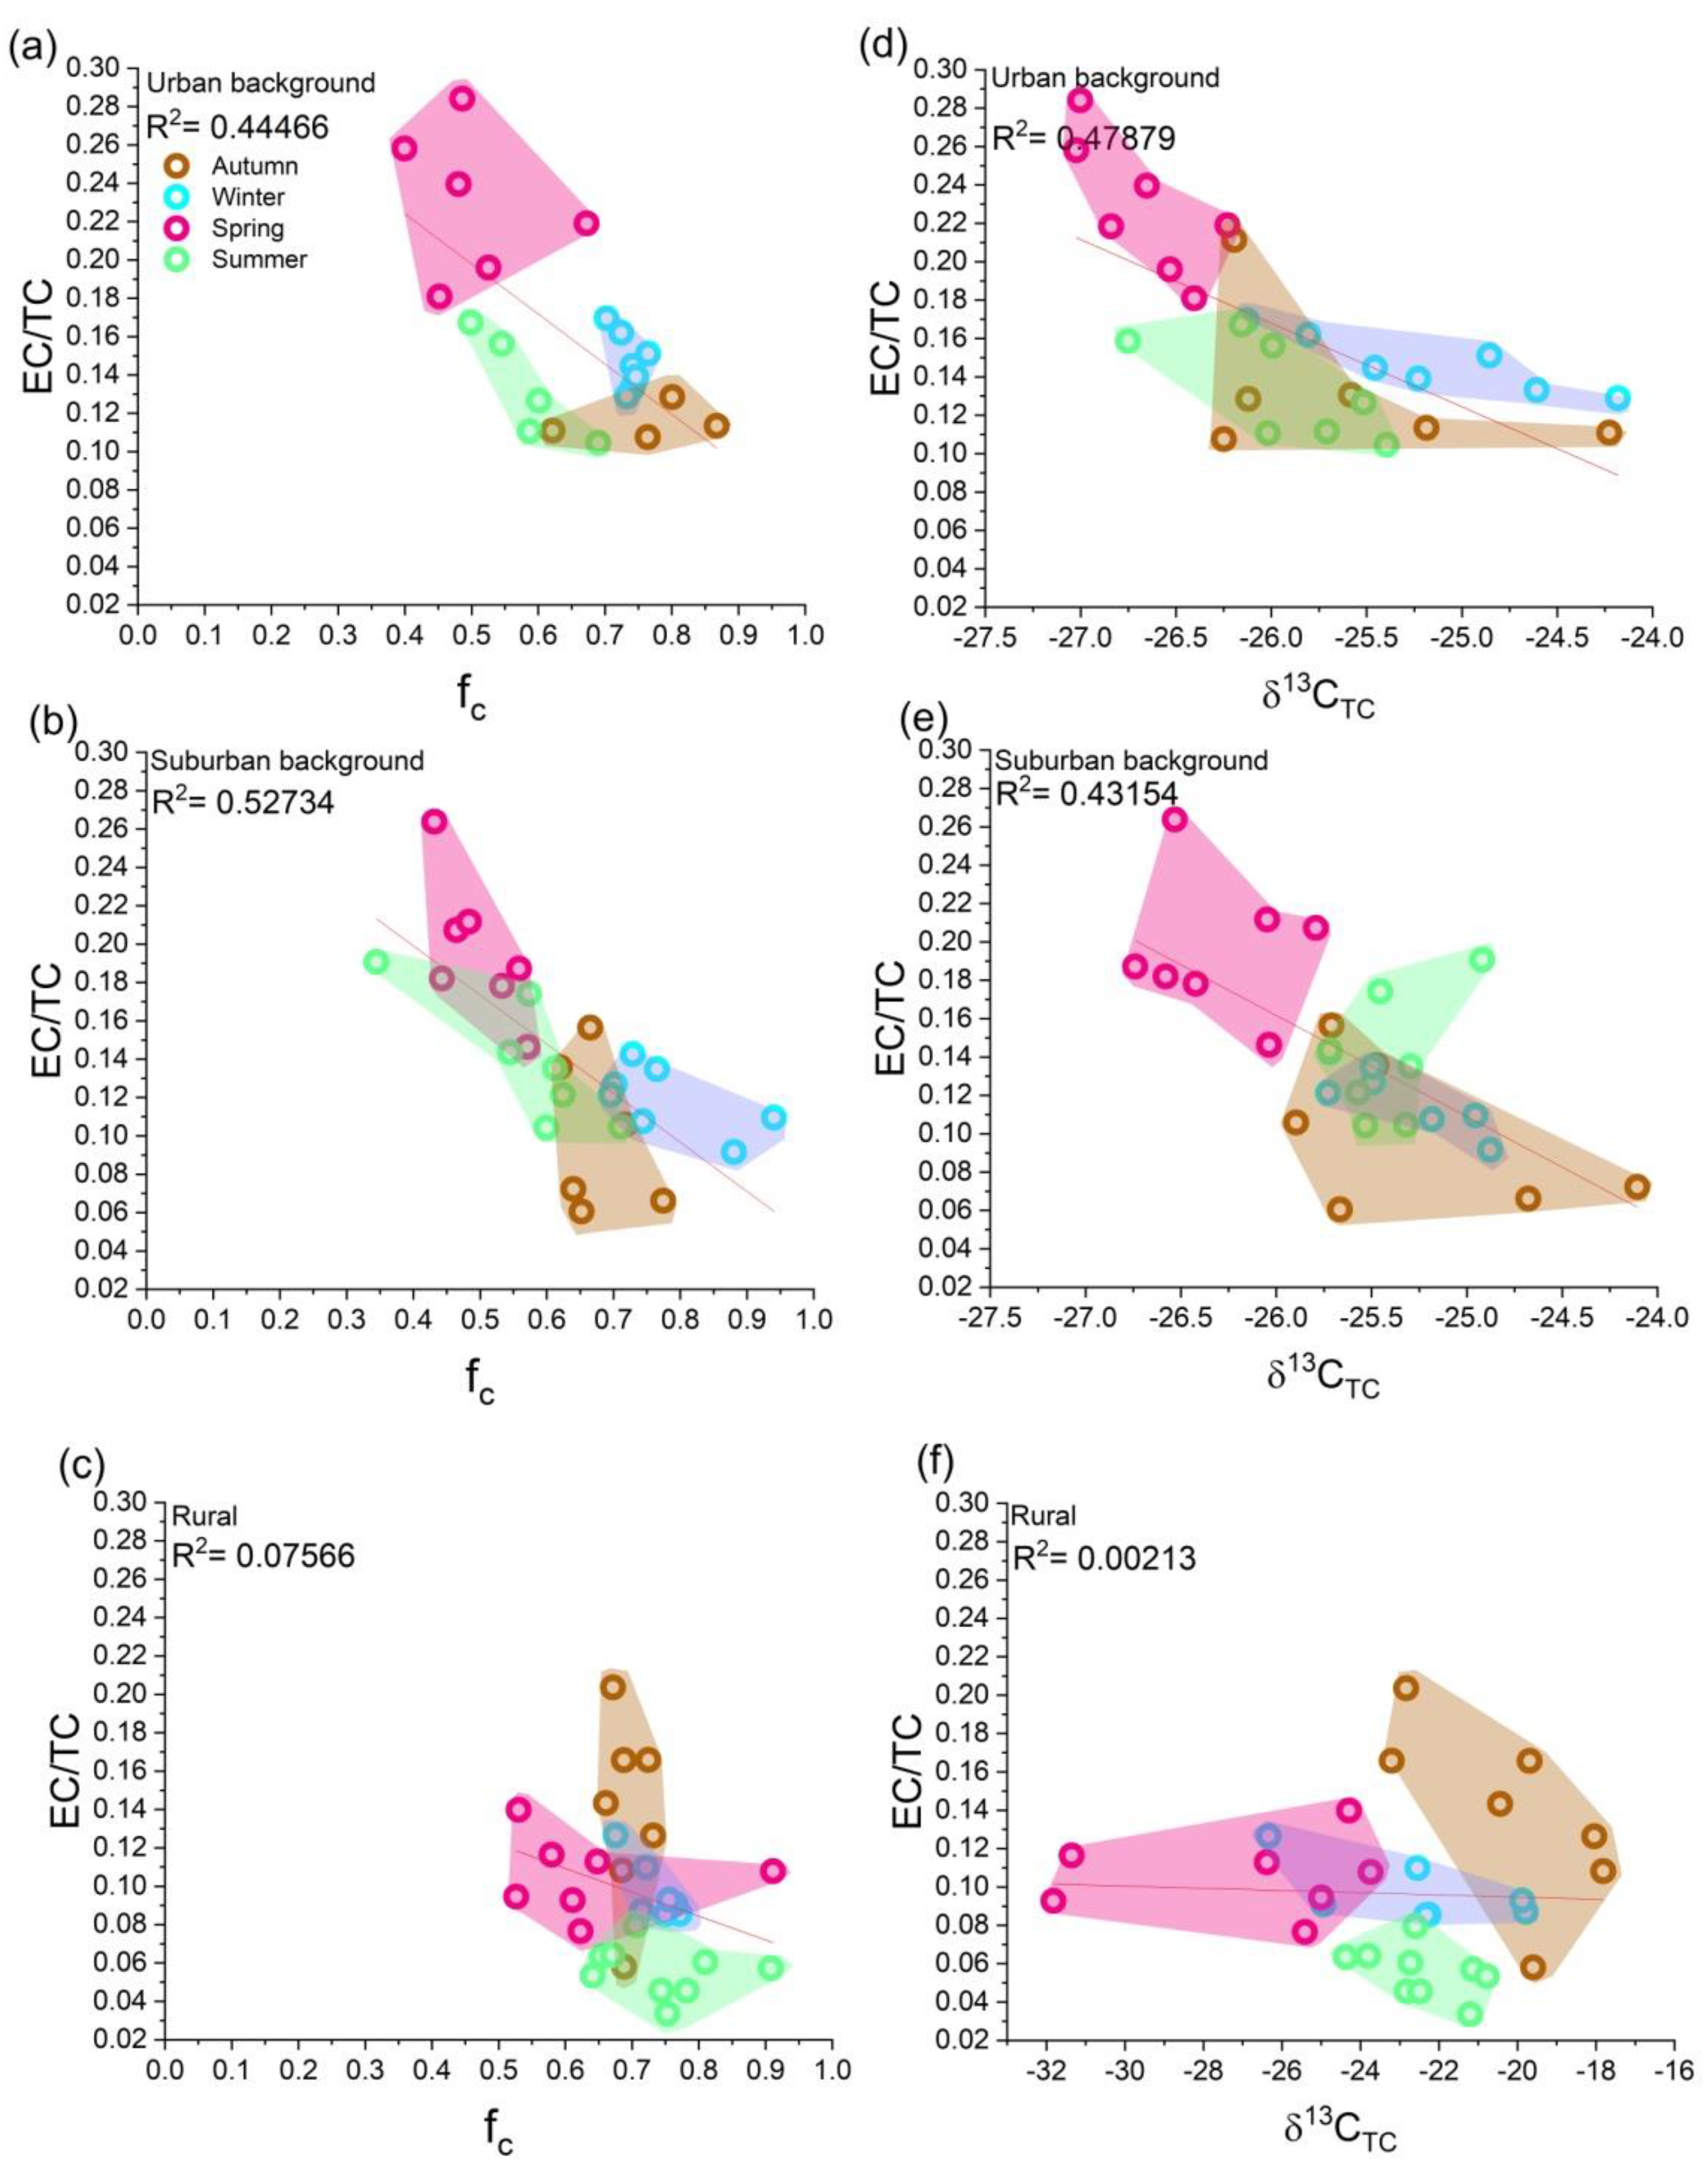
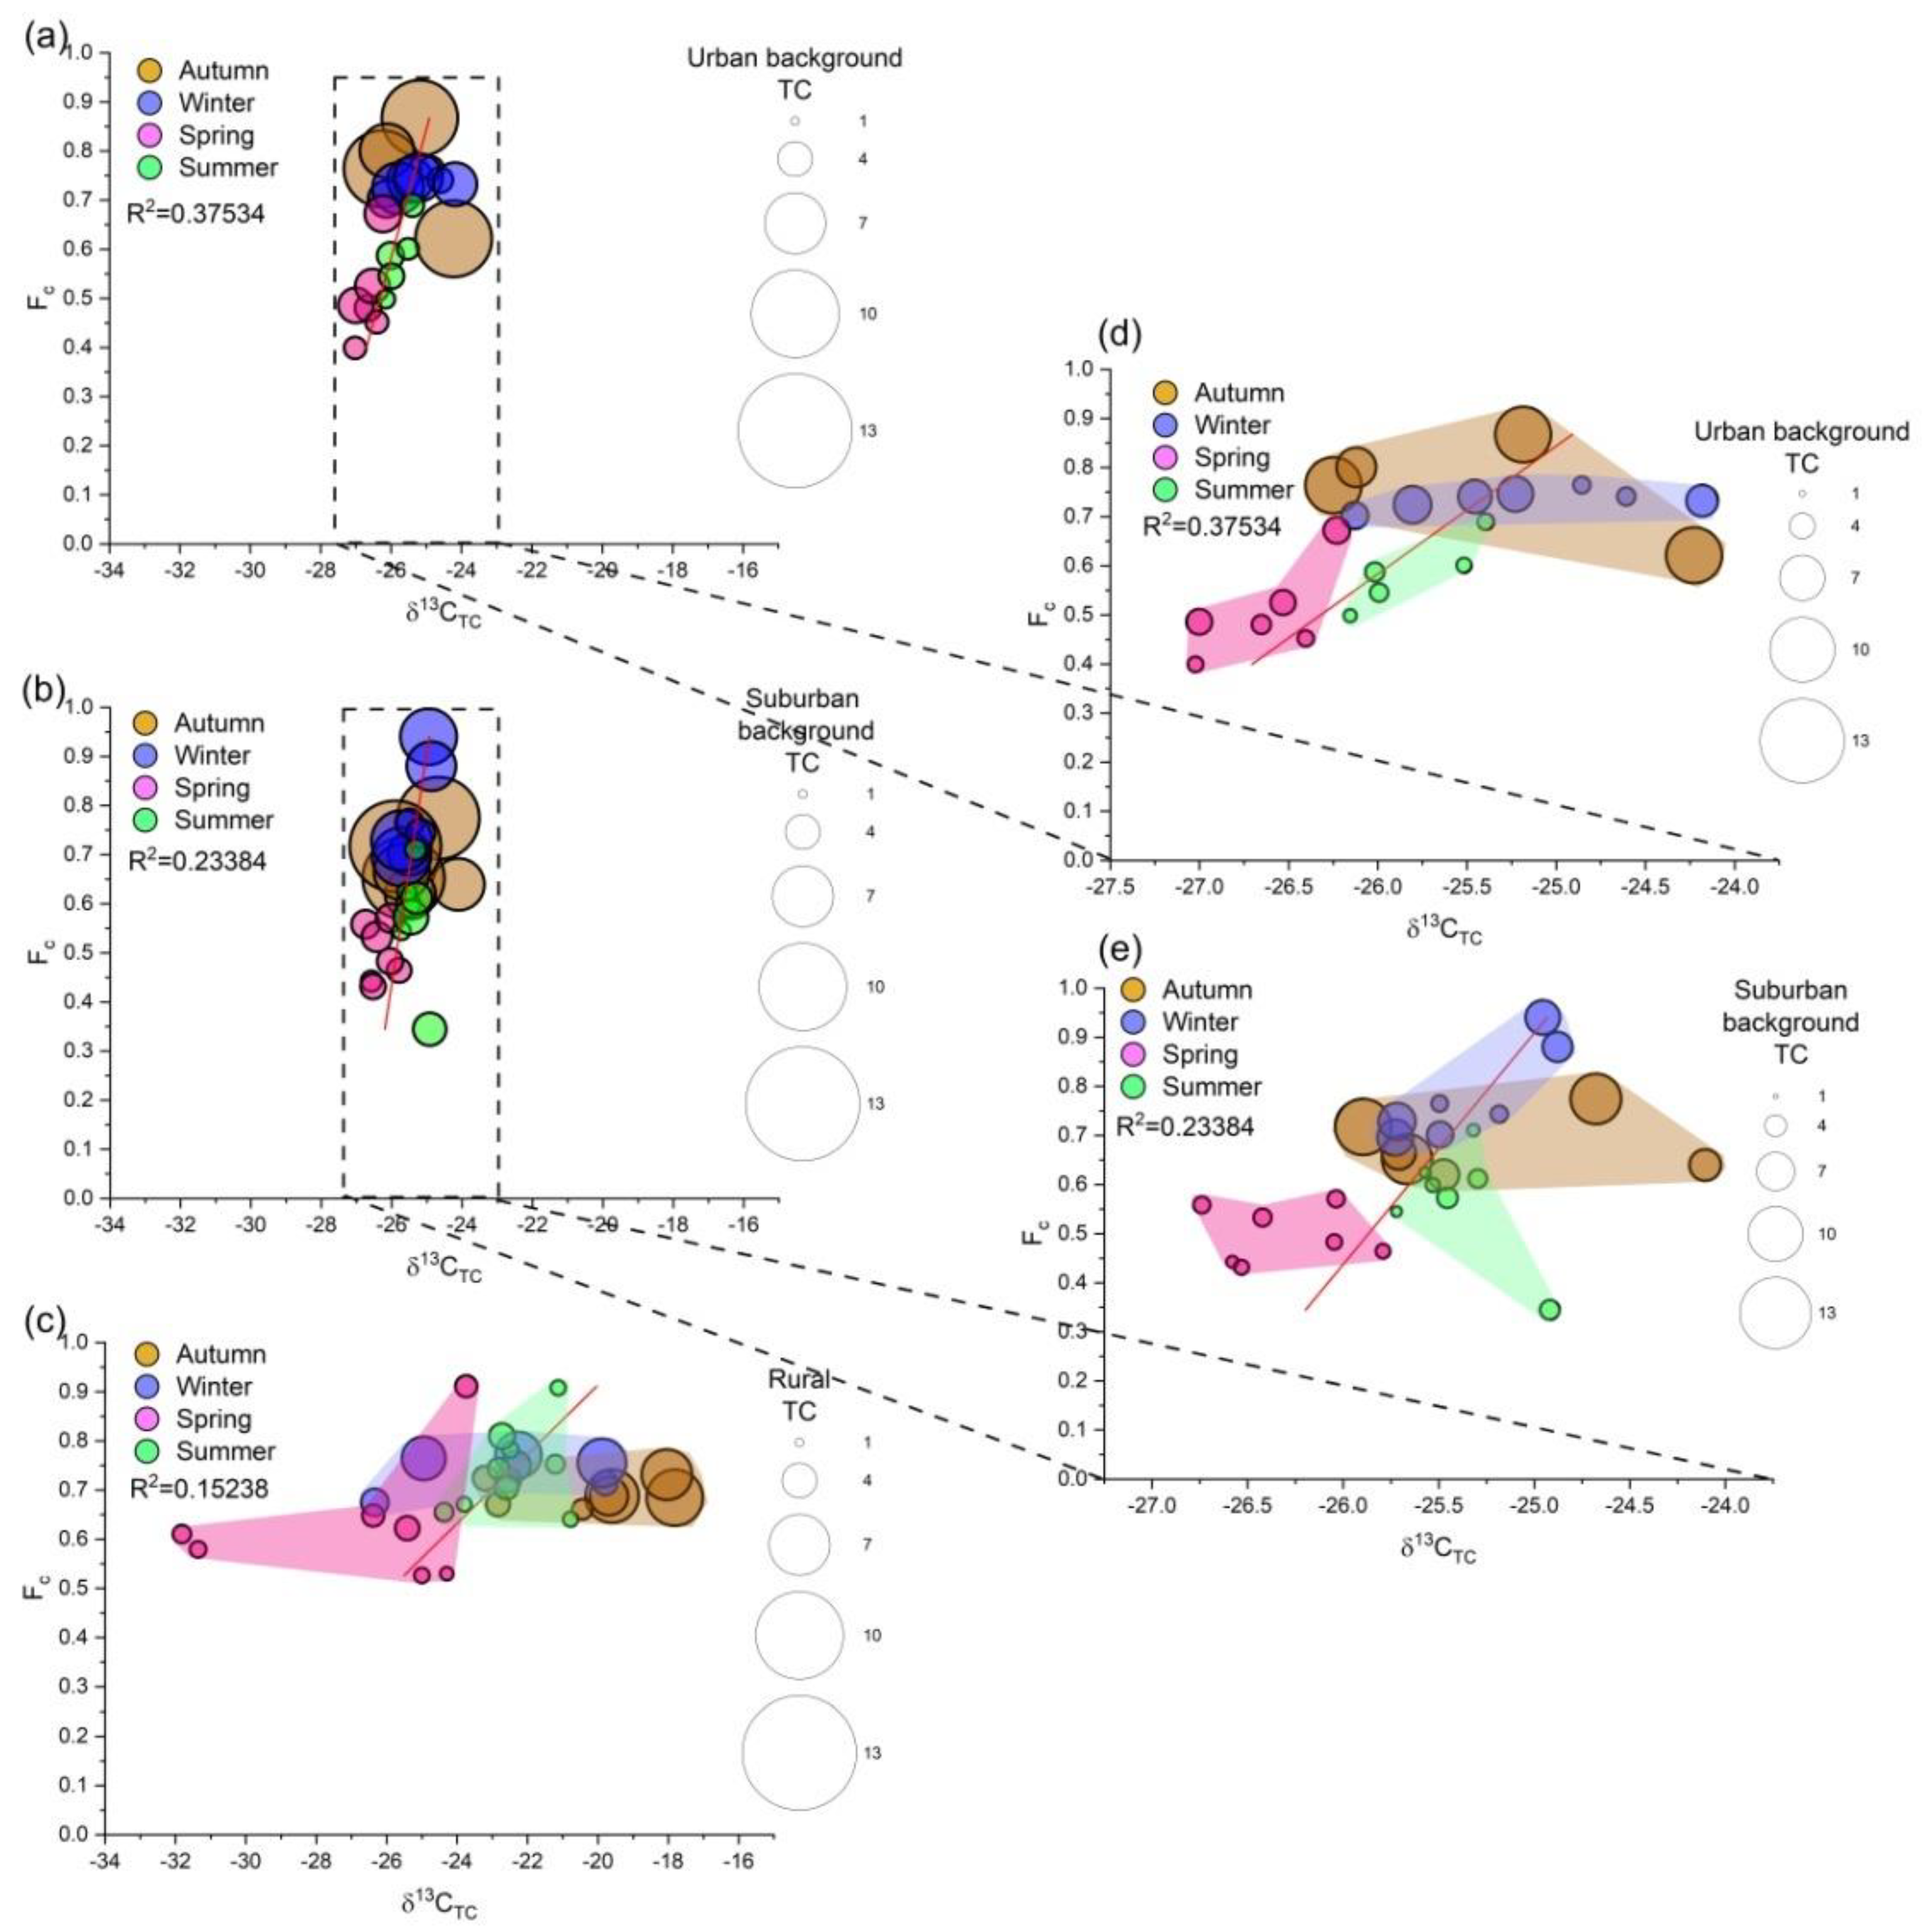
During the seasons studied, the daily variation of the fraction contemporary (fC) and the stable carbon isotope δ13C values (vs. VPDB) for the three sampling sites are shown in Figure 4.
The seasonal mean fC values at the urban background site in Budapest ranged from 0.50 to 0.76 resulting in a mean of 0.64 for the whole observation period. While higher values between 0.76 and 0.74 are representative for the autumn and winter seasons (i.e., mainly the heating period), respectively, the lower ones (0.50 and 0.58) were obtained during the non-heating spring and summer campaigns. For some days at this site, extreme high14C results were obtained, well above the natural 14C level (~1 fC). This location is inside the campus of the ELTE University, where occasionally14C labelled material might be manipulated at different scientific departments. It is likely, that during those five special days of our sampling campaigns, some short 14C releases into the air of the campus occurred, detected by our sampling and sensitive 14C measurement technique. The mean fossil contribution i.e., the ff value was 0.36 for the same period. The suburban background site of Gilice tér showed a mean annual fC value of 0.63, similar to that of the city centre. The seasonal variation is also comparable, ranging from 0.50 to 0.78 but, in contrast to the urban site, the maximum value here occurred in January and not in October. For this site, a mean fossil value of 0.37 was obtained. At the rural site of K-puszta, a slightly higher annual mean fC value of 0.70 could be observed, varying within a smaller range of 0.63 and 0.74. For example, both in January and July, the same value of 0.74 was obtained. The annual mean ff value was 0.30, implying that the fossil contributions were the lowest at this location.
In addition to 14C measurements, the δ13C values of the samples were also determined. The urban background site showed a mean δ13C value of −26.1‰ for the whole period. The seasonal values varied from −26.8‰ to −25.5‰ with higher values in the heating season and lower ones during the vegetation period. For the suburban background site, a similar annual value (−25.6‰) was calculated, ranging from −26.3‰ to −25.2‰ in the different seasons. The seasonal mean values at the K-puszta site are significantly different, varying from −26.9‰ to −20.2‰, resulting in an annual mean of −23.0‰. Interestingly, at this site some extremely negative (under −31‰) or positive (over −18‰) values were also observed depending on the sampling season, suggesting unusual carbon sources or transportation processes in the region.

4. Discussion

The mass concentrations of carbon sub-fractions, 14C and stable carbon isotope results (Appendix A) were estimated together to gain more information about the possible carbonaceous aerosol sources at the two urban sites in Budapest and at the rural sampling site of K-puszta. Regarding the seasonal mass concentrations of TC, the highest values, that had significant daily fluctuations, occurred in the autumn period at all sampling sites. The urban background and suburban background sites showed very similar mean values within uncertainty in autumn, and the values were approximately one third higher than at the rural site. In winter, the concentration slightly decreased, then it reduced further by spring and the lowest values occurred in the summer. The mean concentrations in the city were higher only by a factor of 1/5. The concentration of these atmospheric species is rather associated to the actual meteorological conditions of the atmosphere than the contributions from potential sources. The higher concentrations observed in the heating period can mostly be associated with weak mixing processes in the atmosphere connected to low wind speed and temperature values [38]. Considering all sites, the ratio of the lowest and highest TC concentration varied between 1.9 and 2.6. Reviewing seasonal TC concentrations from other regions, our ratio data are in the lower range of the available datasets. For example, at the urban site of Shijiazhuang, the capital of Hebei province, China, the TC concentration of 58.6 μg m−3 in the winter period was ~3.5 times higher than in the summer. At the related Shangdianzi regional background station located 100 km northeast of the urban area of Beijing, China, this ratio was only around 2.1, giving a wintertime concentration of 21.2 μg m−3 [39]. Regarding European sites, at the Prague-Suchdol urban background site in the Czech Republic, the winter TC concentration was measured to be around 14.3 μg m−3, almost four times higher than the summer value [40].
Considering these other locations, the mass concentration of OC was constantly higher than that of EC at all sites but a seasonal variation with higher values in the heating period and lower ones in the heating-free period. Their seasonal ratios (OC/EC) depended on the sampling periods, varying in a wide range of 3.5–17.9 at the sites, meaning that the concentration of OC was occasionally ~18 times higher than EC at K-puszta in summer. For example, at the Košetice rural site in the Czech Republic, both OC and EC concentrations varied depending on the seasons and EC concentration in winter was just twice as much as in the summer [40]. As the cold seasons in Hungary are generally characterised by higher OC and EC concentrations, the OC concentration must have been significantly higher in those periods, relative to EC. The large difference obtained in springtime might be the result of alterations of OC and SOC sources such as biomass and fossil fuel combustion or biogenic emissions. The rural site of K-puszta is surrounded by artificial forested and tillage areas emitting a large amount of OC, while, by contrast, in the centre of Budapest, there are numerous EC emitters such as road vehicles, industrial and residential sources, as well. Nevertheless, in the heating period, which starts and ends in the middle of October and April, respectively, the EC mass concentrations are significantly higher than in summer. According to Zhao et al. (2013), the fluctuations in the EC level may reflect different combustion processes, which result in more EC aerosol emission during winter or “cold seasons” [39]. This may also be valid for our sites, since biomass burning activity should be minimal in summertime, in addition, the most intense residential heating activity using fuel wood is likely for the transition periods of autumn and spring, when widespread use of natural gas for heating is not yet necessary. The EC/TC ratio obtained for the daily samples are also presented in Figure 3. This ratio at the rural site corresponded to our expectations with higher values in winter, gradually decreasing by the summer. However, in Budapest, while springtime EC concentrations remained in a range characteristic of the autumn–winter period, the fraction of the EC within the TC significantly increased (0.15 and 0.23 at the urban site for winter and spring, respectively). It appears that this has been due to the decreased OC concentration, which could be a consequence of some special circumstances of transition of biomass and fossil fuel combustion-related sources.
Regarding 14C analyses, the diverse OC and EC species constituting to the TC may derive from contemporary (modern) or fossil sources. The seasonal mean fC values between 0.50 and 0.78 at the urban background, suburban background and rural sites suggest that modern sources were significant during the observation year, regardless of the heating or vegetation periods (means are represented by the horizontal green lines in Figure 4). Higher contemporary fractions within Budapest occurred in the heating period, implying that the contributions from biogenic activity or biomass burning was higher in these seasons. At K-puszta, the winter and summer sampling campaigns showed the same modern contribution percentages. Thus, it can be assumed that both OC and EC at the rural site were derived mainly from the fore mentioned modern sources. To find out more about the relation between the concentration of carbonaceous fractions, fC and δ13C values, linear regression analyses were performed, which may help us in identification of some potential sources at the sampling sites (Figure 5). Since atmospheric concentration data are meteorologically dependent, annual EC to TC ratios were applied as an indicator of combustion sources. For the urban sites, surprisingly high determination coefficients (R2: 0.4446 for the urban background site, while 0.5273 for the suburban background site) were obtained for the fC and EC/TC values considering the whole year. The higher EC contributions in spring coincided with lower contemporary fraction results, while the lower EC results in summer were associated with higher fC values. Assuming constant industrial emission, the fossil fuel combustion sources can be identified as responsible for the seasonal variation of EC, as Kontul et al. (2020) has recently shown for Bratislava, Slovakia [41], while modern carbon emissions of biomass-burning and biological activity dominated among OC sources. For Naples, Italy, higher 14C content of OC fractions (fm: 0.63–0.93) has been observed, suggesting the predominance of contemporary sources, while EC emission was mainly attributed to fossil sources (fm: 0.23–0.51) in a wintertime campaign [38]. In our related publication, Salma et al. (2020) have shown that the main fraction of carbonaceous aerosol in winter for Budapest derived from residential wood-burning activities [28]. This is conceivable, since old residential furnaces with low energy-conversion efficiency are still widely in use in Hungary and chimneys are rarely equipped with proper aerosol filter systems. Consequently, large amounts of particles from biomass burning are emitted into the atmosphere every winter. Similar observations have also been reported from other Central European regions [42]. At K-puszta, we could not find strong correlation between these metrics, seeing no dominant direction of the cluster. As this rural site shows generally higher fC values, we assume that both OC and EC derived mainly from modern sources, such as biogenic emission in summer and preferably biomass burning in the winter.
According to comprehensive experiments by Szidat et al. (2004) in Zürich, Switzerland, the fC value of TC in the PM10 fraction was relatively steady (0.60–0.67) during the sampling campaign between 12 and 29 August 2002, while that of the OC varied in a wider range of 0.67–0.84 [11]. In another study, both for the urban site of Vilnius and rural site of Vaiksteinai, Lithuania, fC values ranged between 0.54 and 0.81 in the PM10 fraction. Thus, independently from the cold or warm seasons, modern sources were dominant over the fossil sources in the northern part of Europe [43]. These values are very close to the seasonal means observed at our three sampling sites in Hungary and suggest similarities in the structure of sources. In contrast to high fC values showing the dominance of contemporary sources in Europe, investigations in Asia (China, Japan) have provided relatively low values (fC of 0.3–0.44 and ~0.31–0.42 for the Yufa site, China and Tokyo, Japan, respectively) due to the significant use of fossil sources such as coal [44,45].
In estimating seasonal δ13C data, the respective fC and EC/TC ratio values were also considered to narrow the circle of possible sources. The EC/TC ratio results of TC in the PM2.5 samples are depicted as a function of the respective fC and δ13C values in Figure 6. Studying the potential sources of atmospheric carbonaceous aerosol at a site, numerous candidates need to be considered. Between the δ13C values characteristic for plants using the C3 or C4 photosynthesis pathways, there may be significant differences [46]. The C3 plants have a δ13C range between −34‰ and −23‰, while C4 plants are represented by the range between −16‰ and −8‰ [47,48,49]. In the Central and Eastern European region including Hungary, C3 type plants (e.g., trees and other indigenous herbaceous species) are more widespread; however, maize (a C4 plant) is frequently planted with food production aims on large agricultural areas. Previous measurements in case of Debrecen have shown that the mean δ13C values of sources such as biomass burning of the most commonly-sold fuel wood or C3 type biological emissions should be set to −24.5 ± 0.2‰ and -27.6 ± 2.3‰, respectively [27]. Regarding transportation, δ13C mean values given by Widory et al. (2006) for gasoline and diesel fuels range between −29‰ and −27‰ [50]. Among other combustion sources, δ13C of coal has been determined to be −23.4 ± 1.2‰ in China, while it ranged from −24.4 to −23.4 ‰ in Paris [51].
Regarding the correlation between the EC/TC and δ13C values in this study, the highest correlation coefficient of 0.4788 was obtained for the urban background site in Budapest. The higher EC/TC ratios of around 0.25 were associated with lower δ13C of around -27%, which can be explained by the soot emission of transportation. The δ13C value of this source is around −29‰, thus its effect to the atmospheric aerosol can be significant. This assumption is also supported by the lower fC values. By this period, the residential biomass burning was probably close to its end, but the biological emission of plants is assumed to be still moderated. The δ13C values in summer show another cluster in the lower EC/TC section. The fC values in this case were slightly higher than in spring, related to the mixed effect of sources such as transportation and biological emission. The most enriched δ13C values in autumn and winter can be associated to relatively lower EC/TC values, but this was caused by an increased concentration of OC rather than reduced EC. This could probably be caused by the increase in the biomass burning source, emitting a very large amount of OC into the atmosphere [52,53]. The relatively higher fC values (between 0.7 and 0.9) also support our interpretation.
The situation at the suburban background site is very similar to that at the urban background site, showing an R2 value of 0.4315. The distribution of the seasonal clusters is similar, implying that the sources and the atmospheric transport processes of aerosol were also similar. The transition period particularly between emissions from residential heating and the biogenic contributions in spring could be recognised in the same way as the predominantly biological source in summer and emerging effects of wood burning in autumn and winter.
The K-puszta rural site, however, shows some differences relative to the other two Budapest sites. No correlation could be observed between the EC/TC ratio and δ13C results, showing that there was a wide diversity of sources, but at the same time, balanced in each season. In spring, higher EC/TC ratio and fC and some extremely depleted δ13C values were obtained. This more diverse cluster can easily be associated with agricultural fieldwork in the areas around the sampling site. Tractors performing tilling could release diesel-derived fossil aerosol and might also re-suspended a lot of organic particles from the surface of the soil, moreover, fertilisation using organic manure can also result in very low δ13C values [54]. In summer, the very low EC/TC and high fC values are mainly characteristic for biological emission. The values in the winter are located in the centre of the data range, suggesting the balanced contributions of different sources.
In autumn, however, some less depleted δ13C values were measured at the rural site. On the one hand, these particulates might derive from the nearby agricultural areas, on the other hand, they could be transported from distant regions. The reasons were tried to be revealed by combined application of the HYSPLIT back-trajectory modelling software and the satellite observations of NASA’s FIRMS software. Major et al. (2021) has reported that some δ13C values of PM2.5 aerosol collected in Debrecen, Hungary during autumn were noticeably enriched [27]. Using HYSPLIT, the long-distance transported particles produced in combustion processes of corn waste materials in agricultural areas were suggested as an important source, close to the southern and eastern borders of Hungary. In this study, two periods in autumn (18–21 and 25–27 October 2017 in Figure 7A,B, respectively) and one in spring (17–23 April 2018, Figure 7C) were selected and used to estimate and refine the possible connections between free fire events and the less depleted δ13C values. In the period between 18 and 21 October, in total, ~28 % of air masses arrived from the southern and east-southern directions to the sampling site. In this case, based on FIRMS data, approximately 50 distinct free fire events might be detected along the trajectories in the northern part of Serbia and western part of Romania, coinciding with the occurrence of the less-depleted mean δ13C value of −18.6‰. Only four days later, the number of fire events drastically decreased to less than 5, while a more depleted δ13C value of −22.2‰ was observed. The result is similar to that described in Major et al. (2021), and lacking other sources having this high stable carbon value, the most probable source in the region is the agricultural corn stalk burning activity after harvesting [27].
For comparison, the sampling period in spring is also presented. Moreover, at this time, a relatively depleted value of −26.9‰ was obtained at K-puszta, even though numerous fire events (>100) can be identified over the north-eastern border of Hungary in Ukraine and eastern Russia. However, that time the dominant air masses, by-passing those critical areas, arrived from the northern and south-eastern directions, where minimal number fire events could be detected.

5. Conclusions

The aim of this study was to estimate and refine the potential sources of carbon in the atmospheric PM2.5 fraction at three sampling site in Hungary. TC, OC and EC, radiocarbon and stable carbon isotope analyses were performed on exposed filters collected at an urban background and suburban background site of Budapest (BpART Lab and Gilice tér), in addition, at the rural site of K-puszta, located in the centre of Hungary, for a year in 2017–2018. Comparing TC concentrations to the ones of other regions, the values at our sites are located in the lower range of the summarised data, which we attributed to the dominant meteorological conditions. The concentration of OC was constantly higher than that of EC at all sites and a seasonal variation, with higher values in the heating period and lower ones in the vegetation period, could be observed.
The relatively high seasonal mean fC values at all sites suggest that modern sources were constantly dominant during the observation year, regardless of the heating or vegetation periods. For the urban and suburban background sites, fossil fuel combustion sources were mainly responsible for the seasonal variation of EC, and modern carbon emission of biomass-burning and biogenic sources dominated among the OC sources. The higher EC/TC ratios here were associated with lower δ13C values, which can be explained by diesel soot emissions from transportation. The higher EC/TC values were likely caused by a reduced OC concentration instead of increased EC concentrations. This could probably be caused by a decreased contribution from the biomass burning source, which generally emit a large amount of OC into the atmosphere. The K-puszta rural site, however, shows some difference relative to the urban sites. No correlation could be revealed between the EC/TC ratio, fC and δ13C results, representing that the structure of sources was very balanced in each season. In autumn, however, some less depleted δ13C values were observed and agricultural corn stalk burning activity after harvesting in the southern and eastern directions from Hungary is a suggested source.

Author Contributions

Conceptualization, M.M. and I.S.; Data curation, M.M., A.M. and I.S.; Formal analysis, I.M., M.M., I.F., V.G., S.B., A.M., I.S. and T.V.; Funding acquisition, M.M. and I.S.; Project administration, M.M. and I.S.; Visualization, T.V.; Writing—original draft, I.M.; Writing—review & editing, I.M., M.M, V.G., S.B., A.M., I.S. and T.V. All authors have read and agreed to the published version of the manuscript.

Funding

The research was supported by the European Union and the State of Hungary, co-financed by the European Regional Development Fund in the project of GINOP-2.3.4-15-2020-00007 “INTERACT” and by the Hungarian Research, Development and Innovation Office (K132254).

Institutional Review Board Statement

Not applicable.

Informed Consent Statement

Not applicable.

Data Availability Statement

All the used result can be found in Appendix A.

Acknowledgments

We would like to say thank you to Timothy Jull for his valuable comments and proof-reading, and to the three anonymous reviewer.

Conflicts of Interest

The authors declare no conflict of interest.

Appendix A

Here we present the daily atmospheric PM2.5 aerosol samples’s carbon content and its measured isotop analytical data from the urban background (U), suburban background (SB) and rural (R) sites. All data are background corrected using the measured blank values of the corresponding field blank quartz filters.
Table A1. Measured carbon concentration and isotope data.
Site CodeDate of SamplingEC OC TC
(μg/m3)
δ13C
(vPDB) (‰)
fM
(14C) (±1s)
fC
(±1s)
UB18/10/20171.008.019.01−24.23±0.110.67±0.010.62±0.01
UB19/10/20171.017.938.94−25.19±0.110.94±0.010.87±0.01
UB20/10/20170.978.059.02−26.25±0.110.83±0.010.76±0.01
UB21/10/20170.835.646.47−26.12±0.120.86±0.010.80±0.01
UB25/10/20170.644.274.92−25.58±0.131.12±0.01n.a.
UB26/10/20171.776.608.36−26.19±0.111.33±0.01 n.a.
UB10/01/20180.773.764.52−26.13±0.130.76±0.010.70±0.01
UB11/01/20180.804.715.50−25.46±0.120.80±0.010.74±0.01
UB12/01/20180.995.146.13−25.81±0.120.78±0.010.72±0.01
UB13/01/20180.462.563.02−24.86±0.140.83±0.010.76±0.01
UB14/01/20180.432.783.21−24.61±0.140.80±0.010.74±0.01
UB15/01/20180.815.025.83−25.23±0.120.81±0.010.75±0.01
UB16/01/20180.684.595.27−24.18±0.120.79±0.010.73±0.01
UB17/04/20180.792.523.31−26.65±0.140.52±0.040.48±0.04
UB18/04/20180.532.382.90−26.40±0.150.49±0.050.45±0.05
UB19/04/20180.782.813.59−26.84±0.141.80±0.07n.a.
UB20/04/20180.732.082.81−27.02±0.150.43±0.060.40±0.06
UB21/04/20181.233.104.33−27.00±0.130.52±0.030.49±0.03
UB22/04/20180.833.414.24−26.53±0.130.57±0.030.53±0.03
UB23/04/20180.983.494.47−26.23±0.130.73±0.020.67±0.02
UB17/07/20180.372.983.35−26.02±0.150.63±0.030.59±0.03
UB18/07/20180.312.612.92−25.39±0.160.75±0.030.69±0.03
UB19/07/20180.342.372.72−25.52±0.170.65±0.040.60±0.04
UB20/07/20180.402.012.41−26.16±0.170.54±0.050.50±0.05
UB21/07/20180.502.703.20−25.99±0.150.59±0.040.55±0.04
UB22/07/20180.322.562.88−25.71±0.161.10±0.01n.a.
UB23/07/20180.573.043.61−26.75±0.131.18±0.01 n.a.
SB18/10/20170.455.776.22−24.11±0.120.69±0.010.64±0.01
SB19/10/20170.648.999.63−24.68±0.120.84±0.010.77±0.01
SB20/10/20170.589.009.58−25.67±0.120.70±0.010.65±0.01
SB25/10/20170.825.236.05−25.47±0.130.67±0.010.62±0.01
SB26/10/20171.139.5410.67−25.90±0.120.77±0.010.72±0.01
SB27/10/20171.045.616.65−25.71±0.130.72±0.010.67±0.01
SB10/01/20180.664.585.24−25.49±0.120.76±0.010.70±0.01
SB11/01/20180.856.146.98−25.73±0.120.75±0.020.70±0.02
SB12/01/20181.036.177.19−25.72±0.120.79±0.010.73±0.01
SB13/01/20180.473.003.47−25.50±0.140.83±0.010.77±0.01
SB14/01/20180.383.173.56−25.18±0.140.80±0.010.74±0.01
SB15/01/20180.746.006.74−24.96±0.121.02±0.010.94±0.01
SB16/01/20180.545.375.91−24.88±0.120.95±0.010.88±0.01
SB17/04/20180.642.453.09−25.79±0.150.50±0.050.46±0.05
SB18/04/20180.492.182.66−26.58±0.160.48±0.060.44±0.05
SB19/04/20180.692.563.25−26.05±0.150.52±0.030.48±0.03
SB20/04/20180.832.323.16−26.53±0.150.47±0.050.43±0.04
SB21/04/20180.662.873.53−26.74±0.140.60±0.030.56±0.03
SB22/04/20180.663.063.73−26.42±0.140.58±0.030.53±0.03
SB23/04/20180.523.063.58−26.04±0.140.62±0.030.57±0.03
SB17/07/20180.322.713.03−25.53±0.160.65±0.040.60±0.04
SB18/07/20180.282.402.68−25.32±0.170.77±0.030.71±0.03
SB19/07/20180.302.142.44−25.57±0.180.67±0.050.62±0.04
SB20/07/20180.342.042.38−25.72±0.170.59±0.070.55±0.06
SB21/07/20180.773.274.04−24.92±0.290.37±0.240.34±0.22
SB24/07/20180.743.494.23−25.45±0.140.62±0.030.57±0.03
SB25/07/20180.523.323.83−25.30±0.140.66±0.030.61±0.03
R18/10/20170.375.996.36−19.60±0.130.74±0.010.69±0.01
R19/10/20170.725.966.68−17.82±0.150.74±0.010.68±0.01
R20/10/20170.773.904.67−19.69±0.170.74±0.010.69±0.01
R21/10/20170.775.296.05−18.04±0.140.79±0.010.73±0.01
R25/10/20170.382.252.63−20.44±0.250.71±0.020.66±0.02
R26/10/20170.512.583.09−23.20±0.210.78±0.020.72±0.02
R27/10/20170.612.372.98−22.84±0.210.72±0.020.67±0.02
R10/01/20180.352.843.19−22.55±0.180.78±0.020.72±0.02
R11/01/20180.485.085.56−22.26±0.130.83±0.010.77±0.01
R12/01/20180.484.795.27−24.95±0.150.83±0.010.76±0.01
R13/01/20180.432.983.41−26.34±0.180.73±0.020.68±0.02
R14/01/20180.272.803.07−19.79±0.210.77±0.020.71±0.02
R15/01/20180.313.363.67−22.33±0.190.81±0.010.75±0.01
R16/01/20180.545.285.83−19.88±0.140.82±0.010.76±0.01
R17/04/20180.302.482.78−23.74±0.230.98±0.010.91±0.01
R18/04/20180.191.852.05−25.00±0.330.57±0.070.53±0.06
R19/04/20180.322.492.81−26.38±0.240.70±0.030.65±0.03
R20/04/20180.251.561.81−24.29±0.410.57±0.070.53±0.07
R21/04/20180.251.912.17−31.36±0.350.63±0.050.58±0.05
R22/04/20180.222.152.37−31.82±0.320.66±0.050.61±0.05
R23/04/20180.232.823.06−25.42±0.210.67±0.040.62±0.03
R17/07/20180.132.632.76−22.82±0.200.80±0.020.74±0.02
R18/07/20180.082.322.40−21.21±0.240.81±0.020.75±0.02
R19/07/20180.102.052.14−22.49±0.230.84±0.030.78±0.03
R20/07/20180.111.892.00−21.13±0.250.98±0.000.91±0.01
R21/07/20180.152.262.41−24.37±0.220.71±0.040.66±0.04
R22/07/20180.111.902.00−20.78±0.250.69±0.050.64±0.04
R23/07/20180.131.861.98−23.80±0.280.72±0.040.67±0.04
R24/07/20180.242.783.02−22.60±0.160.76±0.030.71±0.02
R25/07/20180.193.023.22−22.73±0.180.87±0.010.81±0.01

References

  1. Butt, E.W.; Rap, A.; Schmidt, A.; Scott, C.E.; Pringle, K.J.; Reddington, C.L.; Richards, N.A.D.; Woodhouse, M.T.; Ramirez-Villegas, J.; Yang, H.; et al. The impact of residential combustion emissions on atmospheric aerosol, human health, and climate. Atmos. Chem. Phys. 2016, 16, 873–905. [Google Scholar] [CrossRef] [Green Version]
  2. Tie, X.; Wu, D.; Brasseur, G. Lung cancer mortality and exposure to atmospheric aerosol particles in Guangzhou, China. Atmos. Environ. 2009, 43, 2375–2377. [Google Scholar] [CrossRef]
  3. Fuzzi, S.; Andreae, M.O.; Huebert, B.J.; Kulmala, M.; Bond, T.C.; Boy, M.; Doherty, S.J.; Guenther, A.; Kanakidou, M.; Kawamura, K.; et al. Critical assessment of the current state of scientific knowledge, terminology, and research needs concerning the role of organic aerosols in the atmosphere, climate, and global change. Atmos. Chem. Phys. 2006, 6, 2017–2038. [Google Scholar] [CrossRef] [Green Version]
  4. Pöschl, U. Atmospheric aerosols: Composition, transformation, climate and health effects. Angew. Chem. Int. Ed. 2005, 44, 7520–7540. [Google Scholar] [CrossRef] [PubMed]
  5. Chow, J.C.; Watson, J.G.; Edgerton, S.A.; Vega, E.; Ortiz, E. Spatial differences in outdoor PM10 mass and aerosol composition in Mexico City. J. Air Waste Manag. Assoc. 2002, 52, 423–434. [Google Scholar] [CrossRef] [PubMed]
  6. Schwarz, J.; Chi, X.; Maenhaut, W.; Civiš, M.; Hovorka, J.; Smolík, J. Elemental and organic carbon in atmospheric aerosols at downtown and suburban sites in Prague. Atmos. Res. 2008, 90, 287–302. [Google Scholar] [CrossRef]
  7. Hallquist, M.; Wenger, J.C.; Baltensperger, U.; Rudich, Y.; Simpson, D.; Claeys, M.; Dommen, J.; Donahue, N.M.; George, C.; Goldstein, A.H.; et al. The formation, properties and impact of secondary organic aerosol: Current and emerging issues. Atmos. Chem. Phys. 2009, 9, 5155–5236. [Google Scholar] [CrossRef] [Green Version]
  8. Jacobson, M.C.; Hansson, H. Organic Atmospheric Aerosols: Review and State of the Science. Rev. Geophys. 2000, 38, 267–294. [Google Scholar] [CrossRef] [Green Version]
  9. Currie, L.A.; Klouda, G.A.; Klinedinst, D.B.; Sheffield, A.E.; Jull, A.J.T.; Donahue, D.J.; Connolly, M.V. Fossil- and bio-mass combustion: C-14 for source identification, chemical tracer development, and model validation. Nucl. Inst. Methods Phys. Res. B 1994, 92, 404–409. [Google Scholar] [CrossRef]
  10. Klouda, G.A.; Connolly, M.V. Radiocarbon (14C) measurements to quantify sources of atmospheric carbon monoxide in urban air. Atmos. Environ. 1995, 29, 3309–3318. [Google Scholar] [CrossRef]
  11. Szidat, S.; Jenk, T.M.; Gäggeler, H.W.; Synal, H.A.; Fisseha, R.; Baltensperger, U.; Kalberer, M.; Samburova, V.; Reimann, S.; Kasper-Giebl, A.; et al. Radiocarbon (14C)-deduced biogenic and anthropogenic contributions to organic carbon (OC) of urban aerosols from Zürich, Switzerland. Atmos. Environ. 2004, 38, 4035–4044. [Google Scholar] [CrossRef]
  12. Lewis, C.W.; Klouda, G.A.; Ellenson, W.D. Radiocarbon measurement of the biogenic contribution to summertime PM-2.5 ambient aerosol in Nashville, TN. Atmos. Environ. 2004, 38, 6053–6061. [Google Scholar] [CrossRef]
  13. Barrett, T.E.; Robinson, E.M.; Usenko, S.; Sheesley, R.J. Source Contributions to Wintertime Elemental and Organic Carbon in the Western Arctic Based on Radiocarbon and Tracer Apportionment. Environ. Sci. Technol. 2015, 49, 11631–11639. [Google Scholar] [CrossRef] [PubMed]
  14. Gustafsson, Ö.; Kruså, M.; Zencak, Z.; Sheesley, R.J.; Granat, L.; Engström, E.; Praveen, P.S.; Rao, P.S.P.; Leck, C.; Rodhe, H. Brown clouds over South Asia: Biomass or fossil fuel combustion? Science 2009, 323, 495–498. [Google Scholar] [CrossRef] [PubMed]
  15. Dusek, U.; Hitzenberger, R.; Kasper-Giebl, A.; Kistler, M.; Meijer, H.A.J.; Szidat, S.; Wacker, L.; Holzinger, R.; Röckmann, T. Sources and formation mechanisms of carbonaceous aerosol at a regional background site in the Netherlands: Insights from a year-long radiocarbon study. Atmos. Chem. Phys. 2017, 17, 3233–3251. [Google Scholar] [CrossRef] [Green Version]
  16. Ni, H.; Huang, R.-J.; Cao, J.; Zhang, T.; Wang, M.; Meijer, H.A.J.; Dusek, U. Source apportionment of carbonaceous aerosols in Xi’an, China: Insights from a full year of measurements of radiocarbon and the stable isotope 13 C. Atmos. Chem. Phys. Discuss. 2018, 18, 16363–16383. [Google Scholar] [CrossRef] [Green Version]
  17. Andersson, A.; Kirillova, E.N.; Decesari, S.; Dewitt, L.; Gasore, J.; Potter, K.E.; Prinn, R.G.; Rupakheti, M.; De Dieu Ndikubwimana, J.; Nkusi, J.; et al. Seasonal source variability of carbonaceous aerosols at the Rwanda Climate Observatory. Atmos. Chem. Phys. 2020, 20, 4561–4573. [Google Scholar] [CrossRef] [Green Version]
  18. Kawashima, H.; Haneishi, Y. Effects of combustion emissions from the Eurasian continent in winter on seasonal δ13C of elemental carbon in aerosols in Japan. Atmos. Environ. 2012, 46, 568–579. [Google Scholar] [CrossRef]
  19. Górka, M.; Rybicki, M.; Simoneit, B.R.T.; Marynowski, L. Determination of multiple organic matter sources in aerosol PM10 from Wrocław, Poland using molecular and stable carbon isotope compositions. Atmos. Environ. 2014, 89, 739–748. [Google Scholar] [CrossRef]
  20. Vodička, P.; Kawamura, K.; Schwarz, J.; Ždímal, V. Seasonal changes in stable carbon isotopic composition in the bulk aerosol and gas phases at a suburban site in Prague. Sci. Total Environ. 2022, 803, 149767. [Google Scholar] [CrossRef]
  21. Gelencsér, A.; May, B.; Simpson, D.; Sánchez-Ochoa, A.; Kasper-Giebl, A.; Puxbaum, H.; Caseiro, A.; Pio, C.A.; Legrand, M. Source apportionment of PM2.5 organic aerosol over Europe: Primary/secondary, natural/anthropogenic, and fossil/biogenic origin. J. Geophys. Res. Atmos. 2007, 112, 1–12. [Google Scholar] [CrossRef] [Green Version]
  22. Major, I.; Furu, E.; Haszpra, L.; Kertész, Z.; Molnár, M. One-Year-Long Continuous and Synchronous Data Set of Fossil Carbon in Atmospheric PM 2.5 and Carbon Dioxide in Debrecen, Hungary. Radiocarbon 2015, 57, 991–1002. [Google Scholar] [CrossRef] [Green Version]
  23. Cao, F.; Zhang, S.C.; Kawamura, K.; Zhang, Y.L. Inorganic markers, carbonaceous components and stable carbon isotope from biomass burning aerosols in Northeast China. Sci. Total Environ. 2016, 572, 1244–1251. [Google Scholar] [CrossRef] [PubMed]
  24. Górka, M.; Zwolińska, E.; Malkiewicz, M.; Lewicka-Szczebak, D.; Jȩdrysek, M.O. Carbon and nitrogen isotope analyses coupled with palynological data of PM10 in Wroclaw city (SW Poland) -assessment of anthropogenic impact. Isotopes Environ. Health Stud. 2012, 48, 327–344. [Google Scholar] [CrossRef] [PubMed]
  25. Souto-Oliveira, C.E.; Babinski, M.; Araújo, D.F.; Andrade, M.F. Multi-isotopic fingerprints (Pb, Zn, Cu) applied for urban aerosol source apportionment and discrimination. Sci. Total Environ. 2018, 626, 1350–1366. [Google Scholar] [CrossRef]
  26. Salma, I.; Németh, Z.; Weidinger, T.; Maenhaut, W.; Claeys, M.; Molnár, M.; Major, I.; Ajtai, T.; Utry, N.; Bozóki, Z. Source apportionment of carbonaceous chemical species to fossil fuel combustion, biomass burning and biogenic emissions by a coupled radiocarbon-levoglucosan marker method. Atmos. Chem. Phys. 2017, 17, 13767–13781. [Google Scholar] [CrossRef] [Green Version]
  27. Major, I.; Furu, E.; Varga, T.; Horváth, A.; Futó, I.; Gyökös, B.; Somodi, G.; Lisztes-Szabó, Z.; Jull, A.J.T.; Kertész, Z.; et al. Source identification of PM2.5 carbonaceous aerosol using combined carbon fraction, radiocarbon and stable carbon isotope analyses in Debrecen, Hungary. Sci. Total Environ. 2021, 782, 146520. [Google Scholar] [CrossRef]
  28. Salma, I.; Vasanits-Zsigrai, A.; Machon, A.; Varga, T.; Major, I.; Gergely, V.; Molnár, M. Fossil fuel combustion, biomass burning and biogenic sources of fine carbonaceous aerosol in the Carpathian Basin. Atmos. Chem. Phys. 2020, 20, 4295–4312. [Google Scholar] [CrossRef] [Green Version]
  29. Salma, I.; Németh, Z.; Kerminen, V.M.; Aalto, P.; Nieminen, T.; Weidinger, T.; Molnár, Á.; Imre, K.; Kulmala, M. Regional effect on urban atmospheric nucleation. Atmos. Chem. Phys. 2016, 16, 8715–8728. [Google Scholar] [CrossRef] [Green Version]
  30. Birch, M.E.; Cary, R.A. Elemental Carbon-Based Method for Monitoring Occupational Exposures to Particulate Diesel Exhaust. Aerosol Sci. Technol. 1996, 25, 221–241. [Google Scholar] [CrossRef]
  31. Cavalli, F.; Putaud, J.P. Toward a standardized thermal-optical protocol for measuring atmospheric organic and elemental carbon: The eusaar protocol. ACS Div. Environ. Chem. Prepr. Ext. Abstr. 2008, 48, 443–446. [Google Scholar] [CrossRef]
  32. Major, I.; Gyökös, B.; Túri, M.; Futó, I.; Filep, Á.; Hoffer, A.; Furu, E.; Timothy Jull, A.J.; Molnár, M. Evaluation of an automated EA-IRMS method for total carbon analysis of atmospheric aerosol at HEKAL. J. Atmos. Chem. 2018, 75, 85–96. [Google Scholar] [CrossRef]
  33. Heal, M.R.; Naysmith, P.; Cook, G.T.; Xu, S.; Duran, T.R.; Harrison, R.M. Application of 14C analyses to source apportionment of carbonaceous PM2.5 in the UK. Atmos. Environ. 2011, 45, 2341–2348. [Google Scholar] [CrossRef] [Green Version]
  34. Szidat, S.; Jenk, T.M.; Synal, H.A.; Kalberer, M.; Wacker, L.; Hajdas, I.; Kasper-Giebl, A.; Baltensperger, U. Contributions of fossil fuel, biomass-burning, and biogenic emissions to carbonaceous aerosols in Zurich as traced by 14C. J. Geophys. Res. Atmos. 2006, 111, 1–12. [Google Scholar] [CrossRef] [Green Version]
  35. Su, L.; Yuan, Z.; Fung, J.C.H.; Lau, A.K.H. A comparison of HYSPLIT backward trajectories generated from two GDAS datasets. Sci. Total Environ. 2015, 506–507, 527–537. [Google Scholar] [CrossRef]
  36. Draxler, R.R. An Overview of the HYSPLIT_4 Modelling System for Trajectories, Dispersion, and Deposition. Aust. Meteorol. Mag. 1998, 47, 295–308. [Google Scholar]
  37. Xu, S.; Cook, G.T.; Cresswell, A.J.; Dunbar, E.; Freeman, S.P.H.T.; Hou, X.; Jacobsson, P.; Kinch, H.R.; Naysmith, P.; Sanderson, D.C.W.; et al. Radiocarbon Releases from the 2011 Fukushima Nuclear Accident. Sci. Rep. 2016, 6, 36947. [Google Scholar] [CrossRef] [Green Version]
  38. Sirignano, C.; Riccio, A.; Chianese, E.; Ni, H.; Zenker, K.; D’Onofrio, A.; Meijer, H.A.J.; Dusek, U. High contribution of biomass combustion to PM2.5 in the City Centre of Naples (Italy). Atmosphere 2019, 10, 451. [Google Scholar] [CrossRef] [Green Version]
  39. Zhao, P.; Dong, F.; Yang, Y.; He, D.; Zhao, X.; Zhang, W.; Yao, Q.; Liu, H. Characteristics of carbonaceous aerosol in the region of Beijing, Tianjin, and Hebei, China. Atmos. Environ. 2013, 71, 389–398. [Google Scholar] [CrossRef]
  40. Vodička, P.; Schwarz, J.; Cusack, M.; Ždímal, V. Detailed comparison of OC/EC aerosol at an urban and a rural Czech background site during summer and winter. Sci. Total Environ. 2015, 518–519, 424–433. [Google Scholar] [CrossRef]
  41. Kontuľ, I.; Kaizer, J.; Ješkovský, M.; Steier, P.; Povinec, P.P. Radiocarbon analysis of carbonaceous aerosols in Bratislava, Slovakia. J. Environ. Radioact. 2020, 218, 106221. [Google Scholar] [CrossRef] [PubMed]
  42. Olszowski, T. Influence of individual household heating on PM2.5 concentration in a rural settlement. Atmosphere 2019, 10, 782. [Google Scholar] [CrossRef] [Green Version]
  43. Garbaras, A.; Šapolaitė, J.; Garbarienė, I.; Ežerinskis, Ž.; Mašalaitė-Nalivaikė, A.; Skipitytė, R.; Plukis, A.; Remeikis, V. Aerosol source (biomass, traffic and coal emission) apportionment in Lithuania using stable carbon and radiocarbon analysis. Isotopes Environ. Health Stud. 2018, 54, 463–474. [Google Scholar] [CrossRef] [PubMed]
  44. Sun, X.; Hu, M.; Guo, S.; Liu, K.; Zhou, L. 14C-Based source assessment of carbonaceous aerosols at a rural site. Atmos. Environ. 2012, 50, 36–40. [Google Scholar] [CrossRef]
  45. Uchida, M.; Kumata, H.; Koike, Y.; Tsuzuki, M.; Uchida, T.; Fujiwara, K.; Shibata, Y. Radiocarbon-based source apportionment of black carbon (BC) in PM10 aerosols from residential area of suburban Tokyo. Nucl. Instrum. Methods Phys. Res. Sect. B Beam Interact. Mater. Atoms 2010, 268, 1120–1124. [Google Scholar] [CrossRef]
  46. Suits, N.S.; Denning, A.S.; Berry, J.A.; Still, C.J.; Kaduk, J.; Miller, J.B.; Baker, I.T. Simulation of carbon isotope discrimination of the terrestrial biosphere. Glob. Biogeochem. Cycles 2005, 19, 1–15. [Google Scholar] [CrossRef]
  47. Das, O.; Wang, Y.; Hsieh, Y.P. Chemical and carbon isotopic characteristics of ash and smoke derived from burning of C3 and C4 grasses. Org. Geochem. 2010, 41, 263–269. [Google Scholar] [CrossRef]
  48. Krull, E.S.; Skjemstad, J.O.; Graetz, D.; Grice, K.; Dunning, W.; Cook, G.; Parr, J.F. 13C-depleted charcoal from C4 grasses and the role of occluded carbon in phytoliths. Org. Geochem. 2003, 34, 1337–1352. [Google Scholar] [CrossRef]
  49. Turekian, V.C.; MacKo, S.; Ballentine, D.; Swap, R.J.; Garstang, M. Causes of bulk carbon and nitrogen isotopic fractionations in the products of vegetation burns: Laboratory studies. Chem. Geol. 1998, 152, 181–192. [Google Scholar] [CrossRef]
  50. Widory, D. Combustibles, fuels and their combustion products: A view through carbon isotopes. Combust. Theory Model. 2006, 10, 831–841. [Google Scholar] [CrossRef]
  51. Widory, D.; Roy, S.; Le Moullec, Y.; Goupil, G.; Cocherie, A.; Guerrot, C. The origin of atmospheric particles in Paris: A view through carbon and lead isotopes. Atmos. Environ. 2004, 38, 953–961. [Google Scholar] [CrossRef]
  52. Liu, W.; Wang, Y.; Russell, A.; Edgerton, E.S. Enhanced source identification of southeast aerosols using temperature-resolved carbon fractions and gas phase components. Atmos. Environ. 2006, 40, 445–466. [Google Scholar] [CrossRef]
  53. Marmur, A.; Liu, W.; Wang, Y.; Russell, A.G.; Edgerton, E.S. Evaluation of model simulated atmospheric constituents with observations in the factor projected space: CMAQ simulations of SEARCH measurements. Atmos. Environ. 2009, 43, 1839–1849. [Google Scholar] [CrossRef] [Green Version]
  54. Agnihotri, R.; Mandal, T.K.; Karapurkar, S.G.; Naja, M.; Gadi, R.; Ahammmed, Y.N.; Kumar, A.; Saud, T.; Saxena, M. Stable carbon and nitrogen isotopic composition of bulk aerosols over India and northern Indian Ocean. Atmos. Environ. 2011, 45, 2828–2835. [Google Scholar] [CrossRef]
Figure 1. Map of the sampling locations. The text in black boxes shows the location of the sampling points. (Rural site at K-puszta station (dark green); suburban background site, Gilice tér (light green) and urban background site at BpART Lab (red).
Atmosphere 13 00716 g001
Figure 2. Sampling campaign intervals of aerosol collection at the different sites in each season.
Atmosphere 13 00716 g002
Figure 3. Bar-plots illustrating the temporal variation of TC, OC and EC mass concentrations, and the calculated EC/TC ratio results at the three sampling sites in all seasons.
Atmosphere 13 00716 g003
Figure 4. Bar-plots illustrating the calculated fC and δ13C values at the three sites in all seasons. The green horizontal bars show the seasonal mean value of fC.
Atmosphere 13 00716 g004
Figure 5. Seasonal clusters of the EC/TC values depicted as a function of fC (ac), and δ13C (df) values at the urban background, suburban background and rural sites.
Atmosphere 13 00716 g005
Figure 6. Seasonal clusters of the fC values depicted as a function of δ13C values at the urban background (a,d), suburban background (b,e) and rural sites (c).
Atmosphere 13 00716 g006
Figure 7. Combined HYSPLIT backward trajectory overlay on the FIRMS satellite images, showing the number of free fire events along the trajectories (18–21 and 25–27 October 2017 in (A,B), respectively, and 17–23 April 2018 in (C).
Atmosphere 13 00716 g007
Publisher’s Note: MDPI stays neutral with regard to jurisdictional claims in published maps and institutional affiliations.

