Abstract
In order to control the spread of the COVID-19 pandemic, the prevention and control measures of public health emergencies were initiated in all provinces of China in early 2020, which had a certain impact on air quality. In this study, taking Jiangsu Province in China as an example, the air pollution levels in different regions under different levels of pandemic prevention and control (PPC) measures are evaluated. The implementation of the prevention and control policies of COVID-19 pandemic directly affected the concentration of air pollutants. No matter what level of PPC measures was implemented, the air quality index (AQI) and pollutant concentrations of NO2, CO, PM10 and PM2.5 were all reduced by varied degrees. The higher the level of PPC measures, the greater the reduction was in air pollutant concentrations. Specifically, NO2 was the most sensitive to PPC policies. The concentrations of CO and atmospheric particulate matter (PM10 and PM2.5) decreased most obviously under the first and second level of PPC. The response speed of air quality to different levels of PPC measures varied greatly among different cities. Southern Jiangsu, which has a higher level of economic development and is dominated by secondary and tertiary industries, had a faster response speed and a stronger responsiveness. The results of this study reflect the economic vitality of different cities in economically advanced regions (i.e., Jiangsu Province) in China. Furthermore, the results can provide references for the formulation of PPC policies and help the government make more scientific and reasonable strategies for air pollution prevention and control.
1. Introduction
In early 2020, a sudden outbreak of the coronavirus disease 2019 (COVID-19) occurred in China. This virus is highly contagious, and has caused a high mortality rate in sensitive groups. So far, the COVID-19 has not yet been completely controlled. In order to curb the spread of COVID-19, the government has implemented a series of interventions since the outbreak, including lockdowns, quarantine, travel restrictions, temporary closures of businesses and public facilities, etc. These control and emergency measures have greatly affected the human activities, economic development, social relations and natural environment [1,2,3,4].
Compared with the temporary control during major events and meetings in recent years, the control of COVID-19 pandemic is the strictest in history in both time and space. Therefore, it is possible to systematically study the impact of strict control measures implemented by the government on air quality. In recent years, some scholars have studied the impact of temporary control measures on urban air quality during major events or conferences, such as the 22nd Asia-Pacific Economic Cooperation Economic Leaders’ Meeting in Beijing [5], the 2013 Asian Youth Games [6] and 2014 Summer Youth Olympic Games in Nanjing [7], and the 2016 G20 Hangzhou summit [8]. The variations of air quality during these events demonstrate that the control measures are highly effective in alleviating air pollution.
The COVID-19 pandemic has had a significant impact on the environment, which has been studied by scholars around the world. Several studies have shown that after the measures taken by the Chinese government against the COVID-19 pandemic, air pollution reduced significantly by 12.0–52.8% [1,9,10,11,12,13,14,15]. Similar situations appeared in other countries. Air pollution in northeastern United States dropped by 30% after pandemic prevention and control (PPC) measures were adopted [16]. The European Environment Agency found that air pollution also decreased significantly after taking PPC measures in European cities [17]. From 16–22 March 2020, NO2 concentration in Bergamo of Italy and Barcelona of Spain respectively decreased by 47% and 55% compared with that during the same period of 2019. During the PPC period of COVID-19, NO2 concentration dropped by 25.5% in the United States [2], while NO2 and particulate matter (PM10 and PM2.5) concentrations dropped by nearly 50% in four Indian metropolises [18]. However, due to the complexity of PPC implementation, it has been found that in many countries, even in lockdown period a few pollutants’ concentrations showed an increasing trend. The O3 concentration in Singapore increased by 18% during the lockdown period [19]. During the lockdown, the SO2 concentration in southern India increased slightly, and the O3 concentration increased in the Indo Gangetic plain [20]. The concentration of O3 increased greatly in Hubei and the Yangtze River Delta [21,22]. Since the start of the COVID-19 lockdown, the concentration of PM2.5 in Beijing was higher than that in the same period in history [23]. And the decline of the concentration of SO2 in Wuhan was weaker than that in history [21]. These studies have confirmed that the change in air pollution is mainly related to the slower economic growth and travel restrictions during the pandemic [1,10].
Social production and operations as well as travel restrictions are closely related to the level of PPC measures released by the government. Although many studies have confirmed that the government’s PPC measures have a significant impact on air quality, however, there is still a lack of specific information on the relationship between different PPC levels and air pollution. Furthermore, the impact of the PPC levels on air quality may vary in different regions under different levels of PPC. In addition, the speed of economic recovery after the slowdown of the pandemic reflects the economic vitality of a city. The changes in air quality in different cities after the implementation of PPC measures also reflect the differences in the economic vitality of different cities, which has rarely been discussed in previous studies. In this study, the variation characteristics of air quality in different response levels to PPC measures in Jiangsu Province is studied, and the impact of PPC measures of different levels on air quality is evaluated, especially the response speed of urban air quality to PPC measures in cities with different economic development levels. By revealing the relationship between government decision-making behavior and air pollution, this study can provide references for the formulation of government PPC policies and can also help the government to develop more scientific and reasonable strategies for air pollution prevention and control.
2. Materials and Methods
2.1. Air Pollutants and Meteorological Elements
In this study, the air quality data are from the national air quality monitoring stations of Jiangsu Environmental Monitoring Center that are located in 13 prefecture-level cities of Jiangsu. The hourly mean of all national stations in each city is taken as the hourly monitoring value of this city, and the arithmetic mean of hourly monitoring values of 13 cities is taken as the hourly monitoring value of Jiangsu. The data mainly include hourly data of SO2, NO2, CO, O3, PM10 and PM2.5 pollutants. According to the Technical Regulation on Ambient Air Quality (HJ 633—2012), we calculated the individual air quality index (IAQI) based on the arithmetic mean of each pollutant in the whole province each day, and furthermore, the daily AQI of the province was calculated. The meteorological data come from 71 national standard meteorological stations covering the whole Jiangsu Province, including hourly temperature, wind speed, precipitation, relative humidity and visibility from 2018 to 2020. The hourly means of the 71 stations were taken as the hourly monitoring values of the province. The administrative division of the study area is shown in Figure 1.
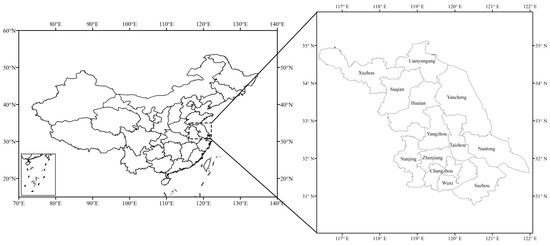
Figure 1.
Administrative division of the study area.
2.2. Situations of Pandemic Prevention and Control
On 22 January 2020, the National Health Commission of the People’s Republic of China confirmed a positive case of COVID-19 in Suzhou, which was the first case in Jiangsu Province. In order to control the spread of COVID-19, Jiangsu activated the first-level public health emergency response at 0000 CST (China Standard Time, the same below) on 25 January 2020. The interventions included travel restrictions, restrictions on public gatherings, and temporary closures of businesses and facilities. At 0000 CST on 25 February 2020, the response level was adjusted to the second level, which meant that all businesses could reopen scientifically and reasonably. That is, it was suggested that production and life could be recovered, while gathering and group activities were still restricted. As of 27 March 2020, there had been no newly confirmed local patients for 38 consecutive days. Therefore, since 0000 CST on 28 March, the level of PPC measures was adjusted to the third level, and the normal production and living of people gradually recovered, entering the stage of regular PPC. The same emergency response was implemented to the whole province at the same time by the Jiangsu provincial government, making it possible to study the impact of PPC measures of different levels on air pollution in the whole province, which is what this paper concerns.
2.3. Economic Development Data of Jiangsu Province
In this study, 13 prefecture-level cities in Jiangsu Province are taken as the research units. Data from the Jiangsu Statistical Yearbook 2019 and 2020 (http://tj.jiangsu.gov.cn/col/col80733/index.html, accessed on 1 March 2022) and the website of the National Bureau of Statistics (http://www.stats.gov.cn/, accessed on 1 March 2022), and the statistical bulletins of national economic and social developments of cities in Jiangsu (http://www.tjcn.org/tjgb/10js/, accessed on 5 March 2022) are used in the study. The 13 prefecture-level cities in Jiangsu are divided into three parts: southern Jiangsu (including Nanjing, Wuxi, Changzhou, Suzhou and Zhenjiang), central Jiangsu (Nantong, Yangzhou and Taizhou) and northern Jiangsu (Xuzhou, Lianyungang, Huai’an, Yancheng and Suqian).
2.4. Method of Analysis and Validation
The data collected were divided into two groups. One is the data in 2020 representing the pandemic period, and the other is data in 2018 and 2019 representing the historical period. Each group was divided into four subgroups according to the PPC level, that is, no PPC period, first-level PPC period, second-level PPC period and third-level PPC period. No PPC period is 1–21 January 2020. In order to reduce the impact of the first reported case on residents’ lifestyles, the data from 22–24 January were excluded. The end of the statistical date for the third-level response was set to 30 April to ensure that the numbers of days in periods under different response levels are similar, so as to avoid the interference brought by the time length. Table 1 lists the time ranges for different response levels (http://www.nanjing.gov.cn/zt/yqfk/zccs/202001/t20200127_1782811.html, accessed on 1 March 2022).

Table 1.
Time ranges for response levels of pandemic prevention and control of COVID-19 in Jiangsu Province.
The daily average AQI value of the whole province was used to calculate the grade of daily air quality, and the grades I–VI correspond to the air quality of very good, good, slightly polluted, moderately polluted, heavily polluted and severely polluted. The days with air quality of grades I–II are good air days, and the days with air quality of grades III–VI are polluted air days.
Based on the time-series analysis method, the air quality and concentrations of six atmospheric pollutants in different PPC periods in 2020 were compared with those during the same periods in 2018–2019 to explore the variations of air quality under different PPC levels in Jiangsu. The rate of change (CR) in the period without PPC in 2020 over the same period in previous two years was regarded as the natural change rate (NCR) in 2020. During the periods in first-level (L1), second-level (L2) and third-level (L3) responses to PPC, CR minus the NCR was regarded as the change rate under the PPC conditions (PCR). The formulas of CR, NCR and PCR are as follows.
where Xrec is the air quality or concentration of six atmospheric pollutants in 2020, and Xhis is the air quality or concentration of six atmospheric pollutants during the same periods in 2018–2019. The PCR of the mean and extreme values were analyzed separately to study the impact of the implementation of PPC policies on air quality. The analysis of mean values used the daily mean values of AQI, pollutant concentrations and meteorological elements, and the analysis of extreme value used the maximum daily mean values of AQI, pollutant concentrations, the minimum daily mean value of visibility, and the maximum daily mean values of other meteorological elements. In order to verify the significance of the differences in air quality before and after the outbreak of COVID-19 pandemic and among different levels of PPC measures, we first used the F-test to test the variance of samples in two different periods, and then carried out the Student’s t-test of equal variance or heteroscedasticity according to the results of the F-test. If p < 0.05 in the two tailed t-test, it was regarded as a significant difference. The variations of air quality in 13 prefecture-level cities of Jiangsu under different PPC levels were compared, so as to explore the differences in the response of urban air quality variations to the PPC levels under different economic development levels.
3. Results
3.1. Differences in Air Quality in Different Scenarios
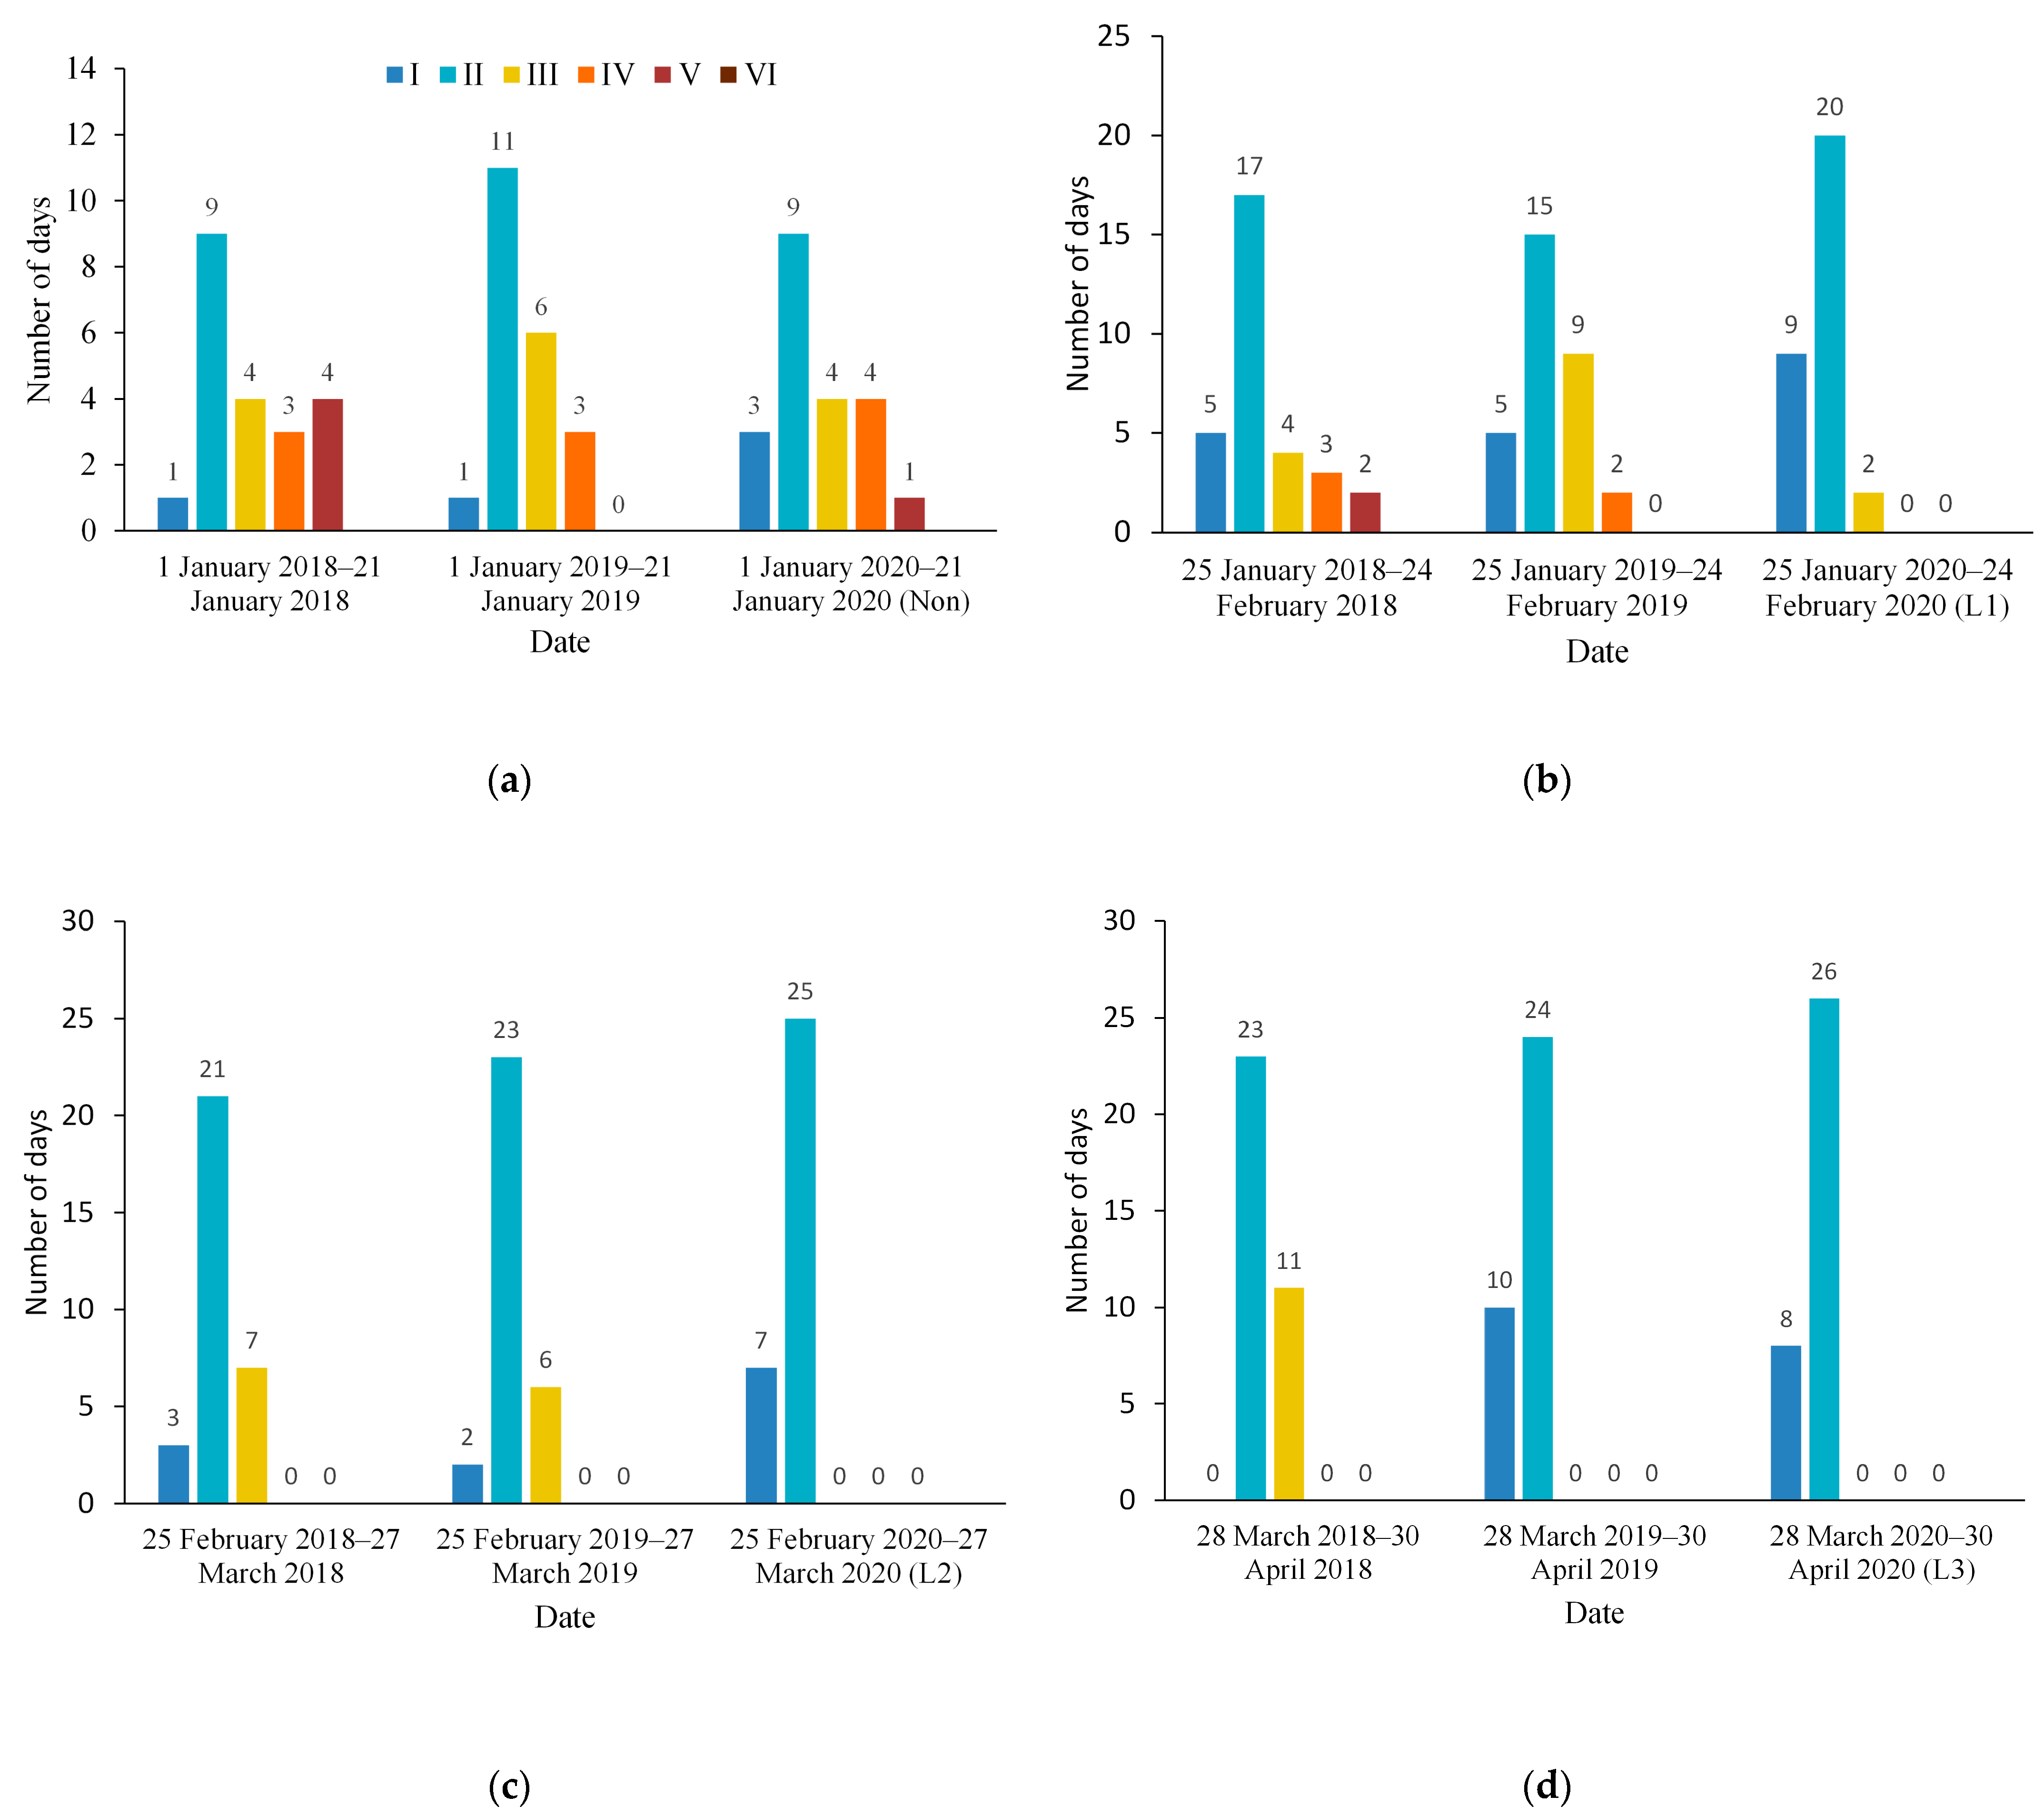
Figure 2 shows the number of days for each grade of air quality at the four PPC stages from 2018 to 2020. It can be seen that on the no PPC stage (Figure 2a), the number of days with air quality of grade I in 2020 increased over previous years, and the number of days with air quality of grade V decreased. Overall, there were few changes in the past 3 years. In the first-level PPC period (Figure 2b), the number of days with air quality of grades I and II in 2020 increased over the same period in the previous 2 years, and the number of days with air quality of grade III were significantly reduced, and there was no moderate or severe pollution. There were 9, 11 and 2 polluted days in 2018, 2019 and 2020, respectively, suggesting that the pollution time was significantly reduced. In the second-level PPC period (Figure 2c), the number of days with air quality of grades I and II in 2020 also increased over the previous 2 years, and there were no polluted days. In the third-level PPC period (Figure 2d), there were still no polluted days in 2020, and the number of good air days was the same as that in 2019. In general, the air quality in 2020 was significantly improved compared with the same period in previous years, which means the implementation of PPC policies had a certain impact on air quality. It is worth noting that whether the epidemic occurred or not, the number of polluted days was decreasing from January to April. This is due to the obvious cooling of ground radiation at night in winter, and the “temperature inversion layer” is easy to appear in the low altitude of the atmosphere, resulting in the accumulation of pollutants and thus the poor air quality. With the increase of temperature in spring, the atmospheric stability decreases and the diffusion conditions become better, so the air quality is improved.
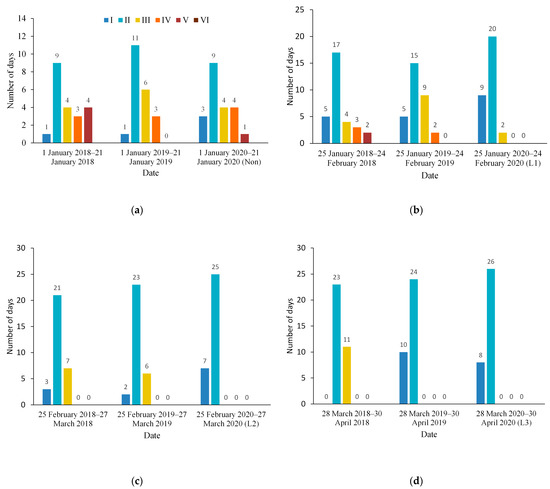
Figure 2.
The number of days for each grade of air quality under different pandemic prevention and control levels in Jiangsu Province ((a), Non; (b), L1; (c), L2; (d), L3).
Statistics of atmospheric pollutant data in 13 cities show that except for SO2, the levels of pollutants and air quality indexes are significantly different during the periods before and after the implementation of PPC policies (p < 0.05, Table 2), indicating that the social restrictions implemented in the PPC period had a direct impact on atmospheric pollutants. As long as PPC measures are taken, the concentration of pollutants could be affected regardless of the level of PPC. From the perspective of the PPC levels, the concentrations of SO2, NO2 and CO were significantly different between the periods with the first- and second-level PPC measures, and the concentrations of SO2, NO2, CO and O3 were significantly different between the periods with the first- and third-level PPC measures, while there was little difference in pollutant concentrations between the periods with the second- and third-level PPC measures.
Table 2.
Significance levels for periods with different levels of PPC measures by Student’s t-test (α = 0.05).
3.2. Impacts of COVID-19 on Air Quality
Compared with the same period in 2018 and 2019, the values of AQI, SO2, NO2, CO, PM10 and PM2.5 in 1–21 January of 2020 decreased by 9.75%, 45.36%, 21.01%, 13.00%, 19.29% and 9.33%, respectively (Table 3), which are the NCRs in air quality in 2020 as defined above. This indicates that without the influence of PPC, the concentrations of air pollutants were also gradually decreasing, which is consistent with the results in other parts of China. The change in air quality is mainly attributed to the “Three-Year Action Plan for Cleaner Air” to win the battle for a blue sky released by the State Council of China in 2018. This action plan aims at significantly reducing the total emissions of major air pollutants and greenhouse gases, further lowering the concentrations of fine particulate matter (PM2.5), significantly reducing the number of heavily polluted days and thus improving the air quality.
Table 3.
Variations of AQI, atmospheric pollutants and meteorological conditions during the pandemic period and the same period of previous years.
After the outbreak of COVID-19, the AQI and concentrations of NO2, CO, PM10 and PM2.5 decreased with a magnitude larger than those before the outbreak, displaying the characteristics of varied degrees of declines under different levels of PPC measures. Specifically, the AQI and pollutant concentrations decreased the most under the first- and second-level PPC, and decreased slightly under the third-level PPC. The NCR of SO2 concentration in 2020 was −45.36%, which was significantly lower than the value in the same period in historical years, indicating that the control effect of SO2 in Jiangsu Province is obvious. But the decreasing trend of SO2 weakened after the outbreak of COVID-19, and similar results have been obtained in other parts of China [21]. We speculate that on one hand, it is related to the industrial production activities that have not been interrupted during the epidemic period, such as increasing the emission of coal-fired pollution from coal-fired power plants and coal-fired heating boilers. To some extent, epidemic control has increased the demand for household electricity, heating and cooking. From the perspective of provincial distribution, cities with a high proportion of secondary industry have a relatively high SO2 PCR, such as Changzhou, Zhenjiang and Taizhou (data omitted). On the other hand, sulfur dioxide is easily soluble in water, and the reduction of precipitation during the epidemic increased the content of sulfur dioxide in the atmosphere. The O3 concentration in 2020 increased. In particular, the O3 concentration increased by 20.8% under the first-level PPC measures compared with that during the same period in previous years. This result is similar to the results of studies focusing on the Chinese mainland, the Guangdong–Hong Kong–Macao Greater Bay Area [9,24], Europe [25] and India [18]. This phenomenon is mainly due to the particularity and complexity of ozone formation and depletion mechanisms. Ozone is formed by photochemical reactions between nitrogen oxides and volatile organic compounds emitted from natural sources and human activities [26]. Air pollution is also somewhat related to meteorological conditions [27,28]. Generally speaking, high temperature, low relative humidity and high solar radiation are conducive to the formation of ozone [29,30,31]. During the period with first-level PPC measures, the daily average temperature in Jiangsu was 3.43 °C higher than that in the same period of historical years, with an increase of 129.07%, while precipitation decreased by 29.88%. Brighter weather and lower concentrations of particulate matters allow more sunlight to pass through. Higher temperatures and stronger light, along with increased photochemical activity, lead to higher ozone concentrations. Changes in visibility also reflect changes in air quality to some extent [32]. During the periods in the first-, second- and third-level responses to PPC, the average values of atmospheric visibility respectively increased by 24.25%, 45.80% and 48.60% compared with those in the same period of previous years, and the daily minimum value of visibility also increased. This indicates that after the outbreak of COVID-19, the concentrations of atmospheric particulate matters decreased and thus the atmospheric transparency gradually increased.
3.3. Impact of Pandemic Prevention and Control on Air Quality
The reduction in air pollution is closely related to the PPC policy. During the period with first-level PPC measures, the PCRs of AQI and the concentrations of six air pollutants (SO2, NO2, CO, O3, PM10 and PM2.5) were −21.97%, 0.26%, −28.95%, −12.00%, 8.30%, −20.01% and −23.01%, respectively. During the period with second-level PPC measures, the PCRs were −17.97%, 7.55%, −11.82%, −12.30%, −9.84%, −10.71% and −25.55%, respectively. During the period with third-level PPC measures, the PCRs were −10.29%, 13.02%, 5.09%, −1.70%, −4.96%, −6.92% and −14.99%, respectively (Table 3). It can be seen that, except for SO2 and O3, the AQI and concentrations of other pollutants were significantly reduced under the PPC measures. In turn, the improvement of air quality could help reduce the spread of COVID-19 and play a positive role in PPC [33,34].
The first-level response was ordered by the State Council of the People’s Republic of China, and the provincial government organized and coordinated the provincial emergency response under the unified leadership and command. The second-level response was deployed by the provincial government, and the third-level emergency plan in response was formulated by the municipal and county governments. Therefore, the control force and restriction policies in different provinces may be different, resulting in different impacts of emergency responses on air quality in different provinces. Some studies have shown that due to travel restrictions during the pandemic, AQI and concentrations of NO2, CO, PM10 and PM2.5 in cities of northern China decreased by 7.80%, 24.7%, 4.58%, 13.7% and 5.93%, respectively [1]. For cities in the Guangdong–Hong Kong–Macao Greater Bay Area, the AQI and concentrations of the above four pollutants were reduced by 37.4%, 47.0%, 24.1%, 44.8% and 40.5% during the period with first-level PPC measures and by 24.4%, 25.5%, 23.2%, 25.6% and 32.5% during the period with second-level PPC measures, which were 27.1%, 12.1%, 9.86%, 24.1% and 31.0% during the period with third-level PPC measures [24]. Therefore, the air quality in Jiangsu was more likely to be affected by the PPC policies compared with that in cities of northern China, but the sensitivity of air quality to restrictive policies was slightly lower than that in the Pearl River Delta.
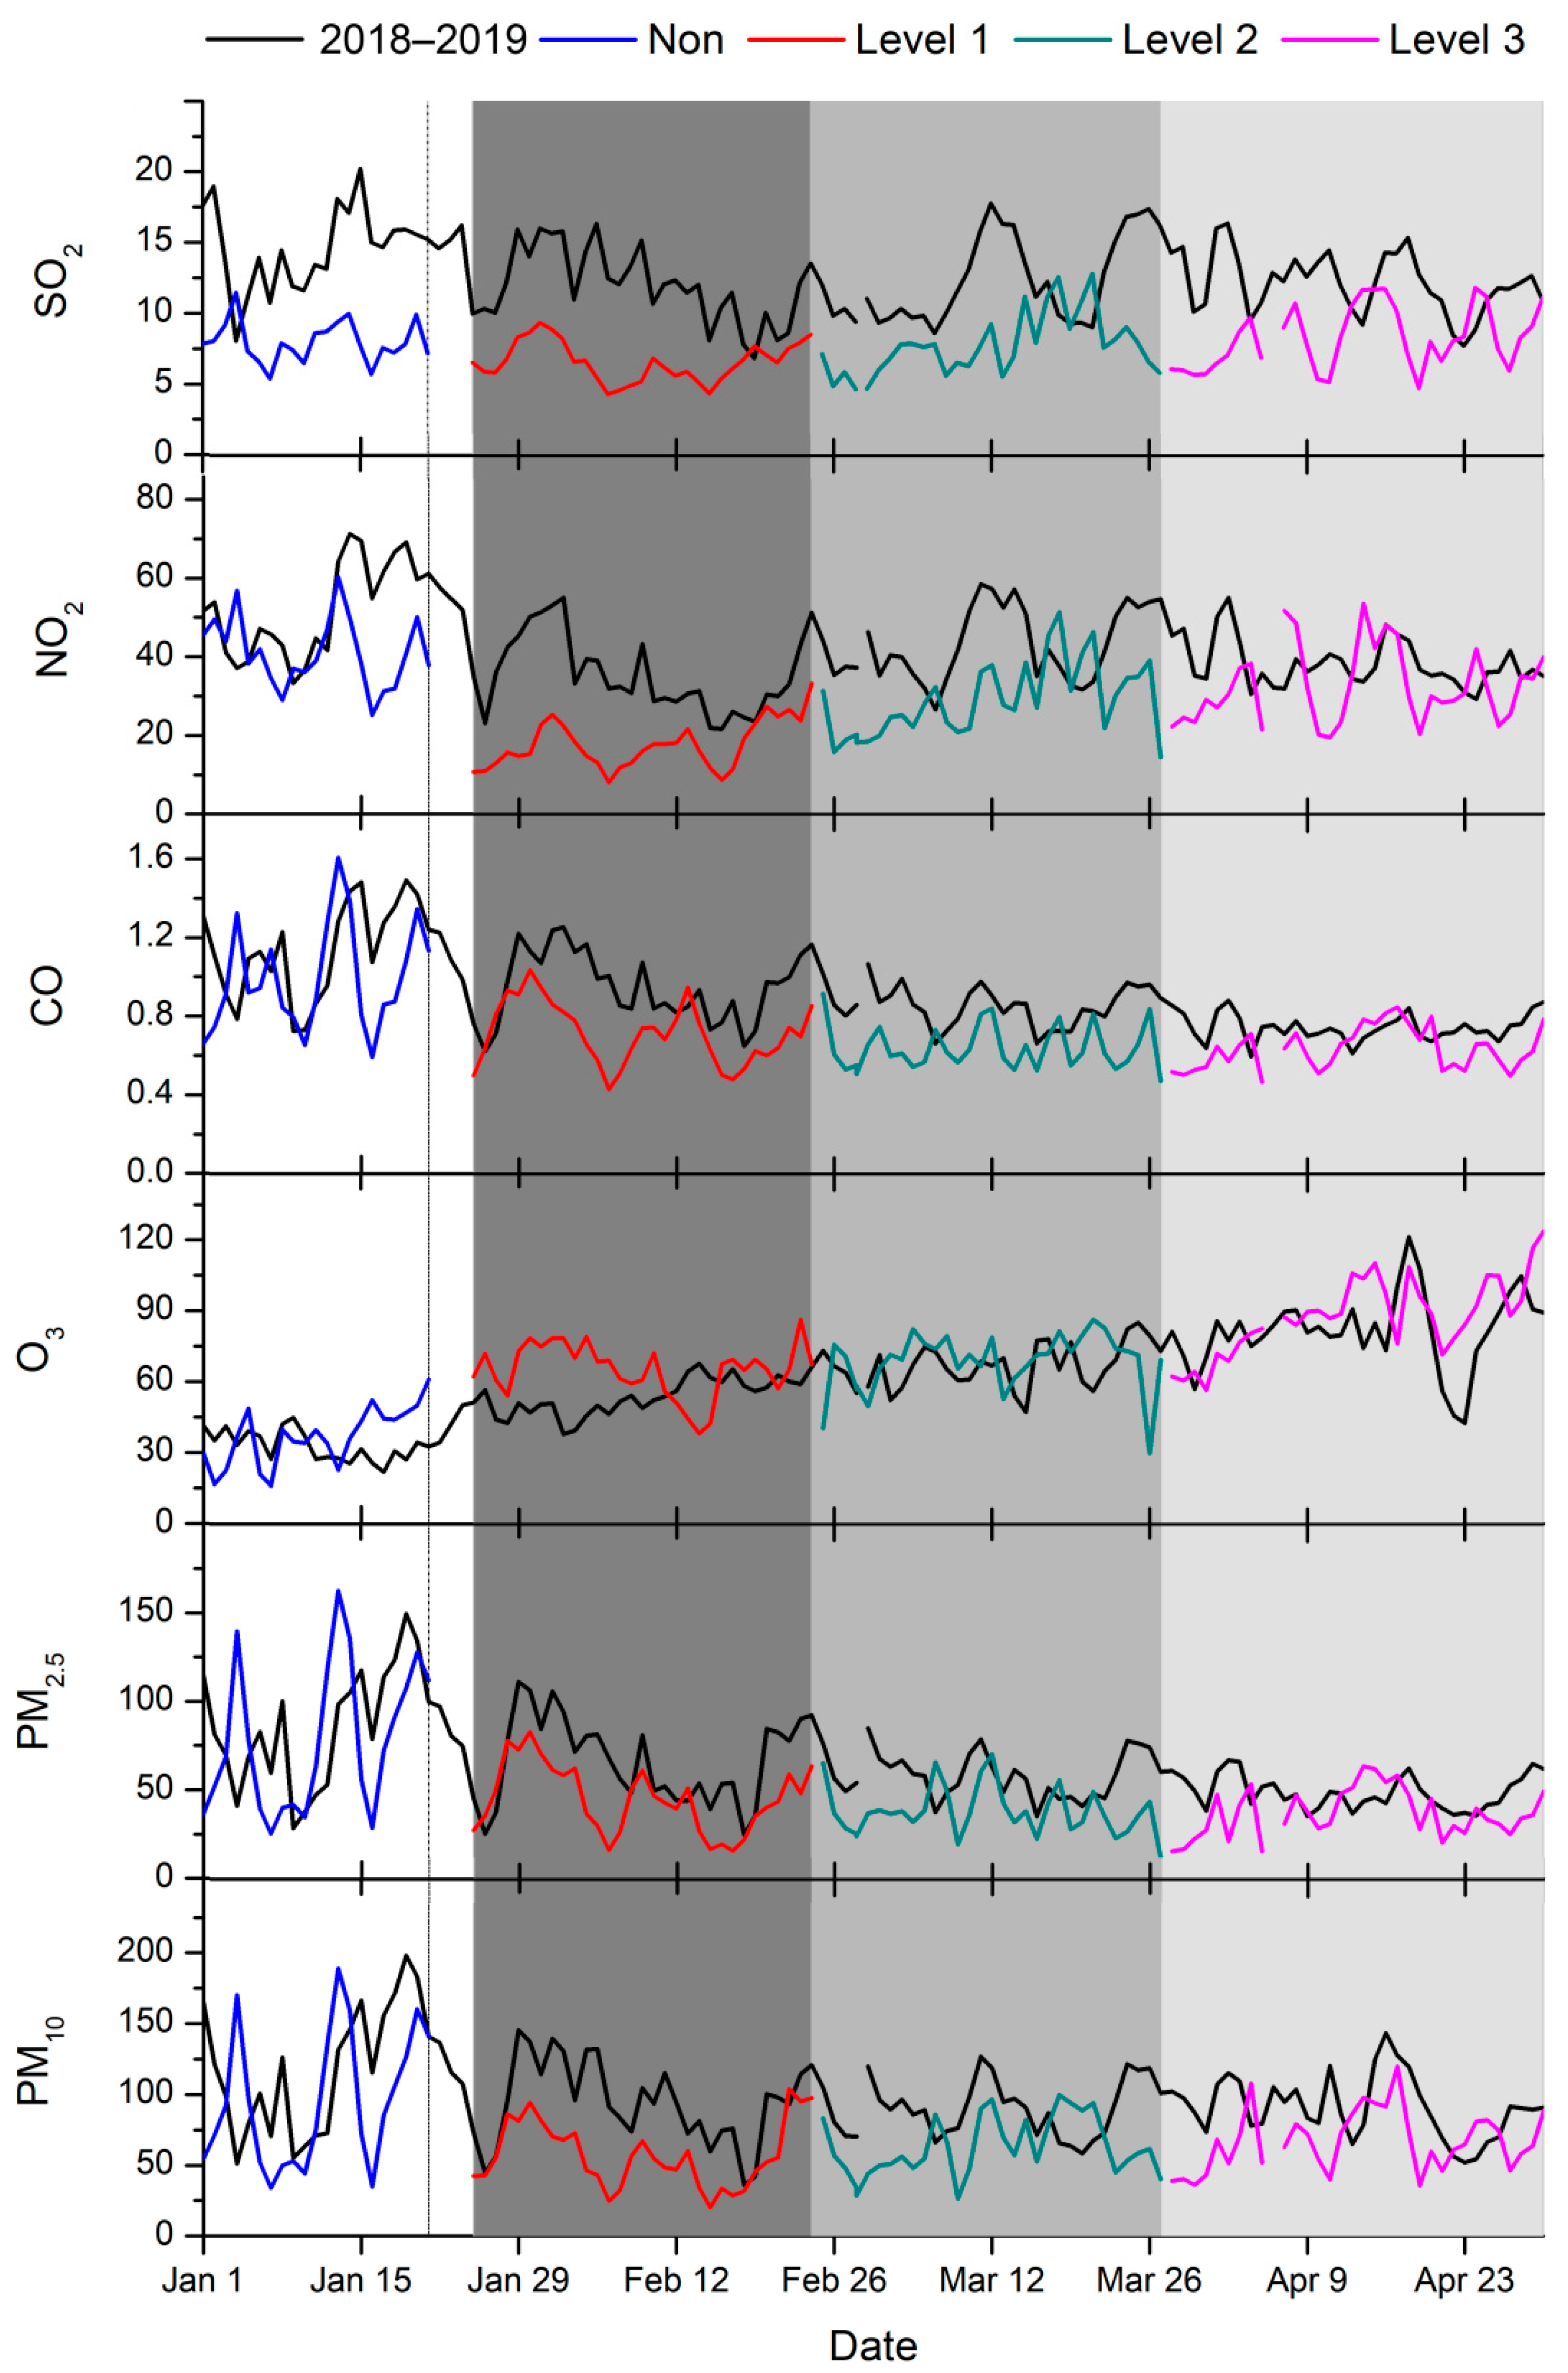
NO2 was the pollutant most sensitive to the PPC policies (Figure 3). The higher the PPC level, the higher was the reduction of NO2. The PCRs of NO2 concentration under the first-, second- and third-level responses decreased by 28.95%, 11.82% and 5.09%, respectively. As the NO2 in the atmosphere is mainly from fossil fuel combustion, vehicle exhaust and industrial production emissions, with the relaxation of PPC and the recovery of normal production and living, the concentration of NO2 rose again.
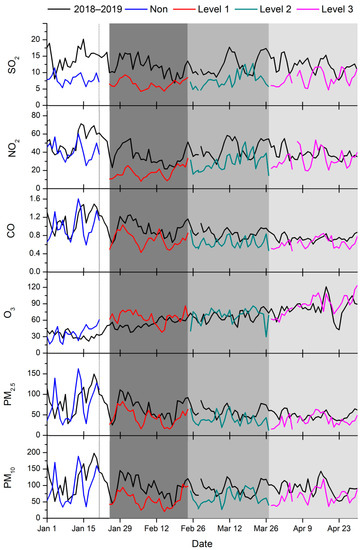
Figure 3.
Daily variations of pollutant concentrations under different PPC levels.The shadows of dark grey, medium grey and light grey represent the L1, L2 and L3 period respectively.
The CO in the atmosphere is mainly from the incomplete combustion of fossil fuels and biofuels [11]. During the period in response to PPC measures, CO emissions from domestic boilers and power stations were significantly affected. The PCRs of CO concentrations in the first-, second- and third-level responses decreased by 12.00%, 12.30% and 1.70%, respectively. In the first- and second-level responses to PPC policies, CO was well-controlled. After the implementation of the third-level PPC policy, industrial production activities gradually recovered, and the CO concentration rebounded. For historical average (2018–2019), the CO concentration showed a declining trend from February to April, while there was no such obvious downward trend from February to April of 2020 due to the implementation of the PPC policy (Figure 3).
In addition, the concentration of atmospheric particulate matters (PM10 and PM2.5) also decreased significantly during the period in response to PPC measures. The main sources of PM2.5 are the residues emitted from combustion in the process of daily power generation, industrial production and vehicle exhaust emissions. PM10 comes from direct emissions from pollution sources, such as coal-burning flue gas, construction and transportation dust, smelting dust, building material dust and traffic powder. The PCRs of PM10 concentration in the first-, second- and third-level responses were reduced by 20.01%, 10.71% and 6.92%, respectively, while the reductions were 23.01%, 25.99% and 14.99% for PM2.5, respectively. Thus, the concentrations of atmospheric particulate matters decreased most obviously under the first- and second-level responses. With the recovery of production and living activities, the concentrations of particulate matters gradually approached the average value in the same period of previous years (Figure 3).
3.4. Variations of Urban Air Quality in Response to Pandemic Protection and Control Measures under Different Economic Development Levels
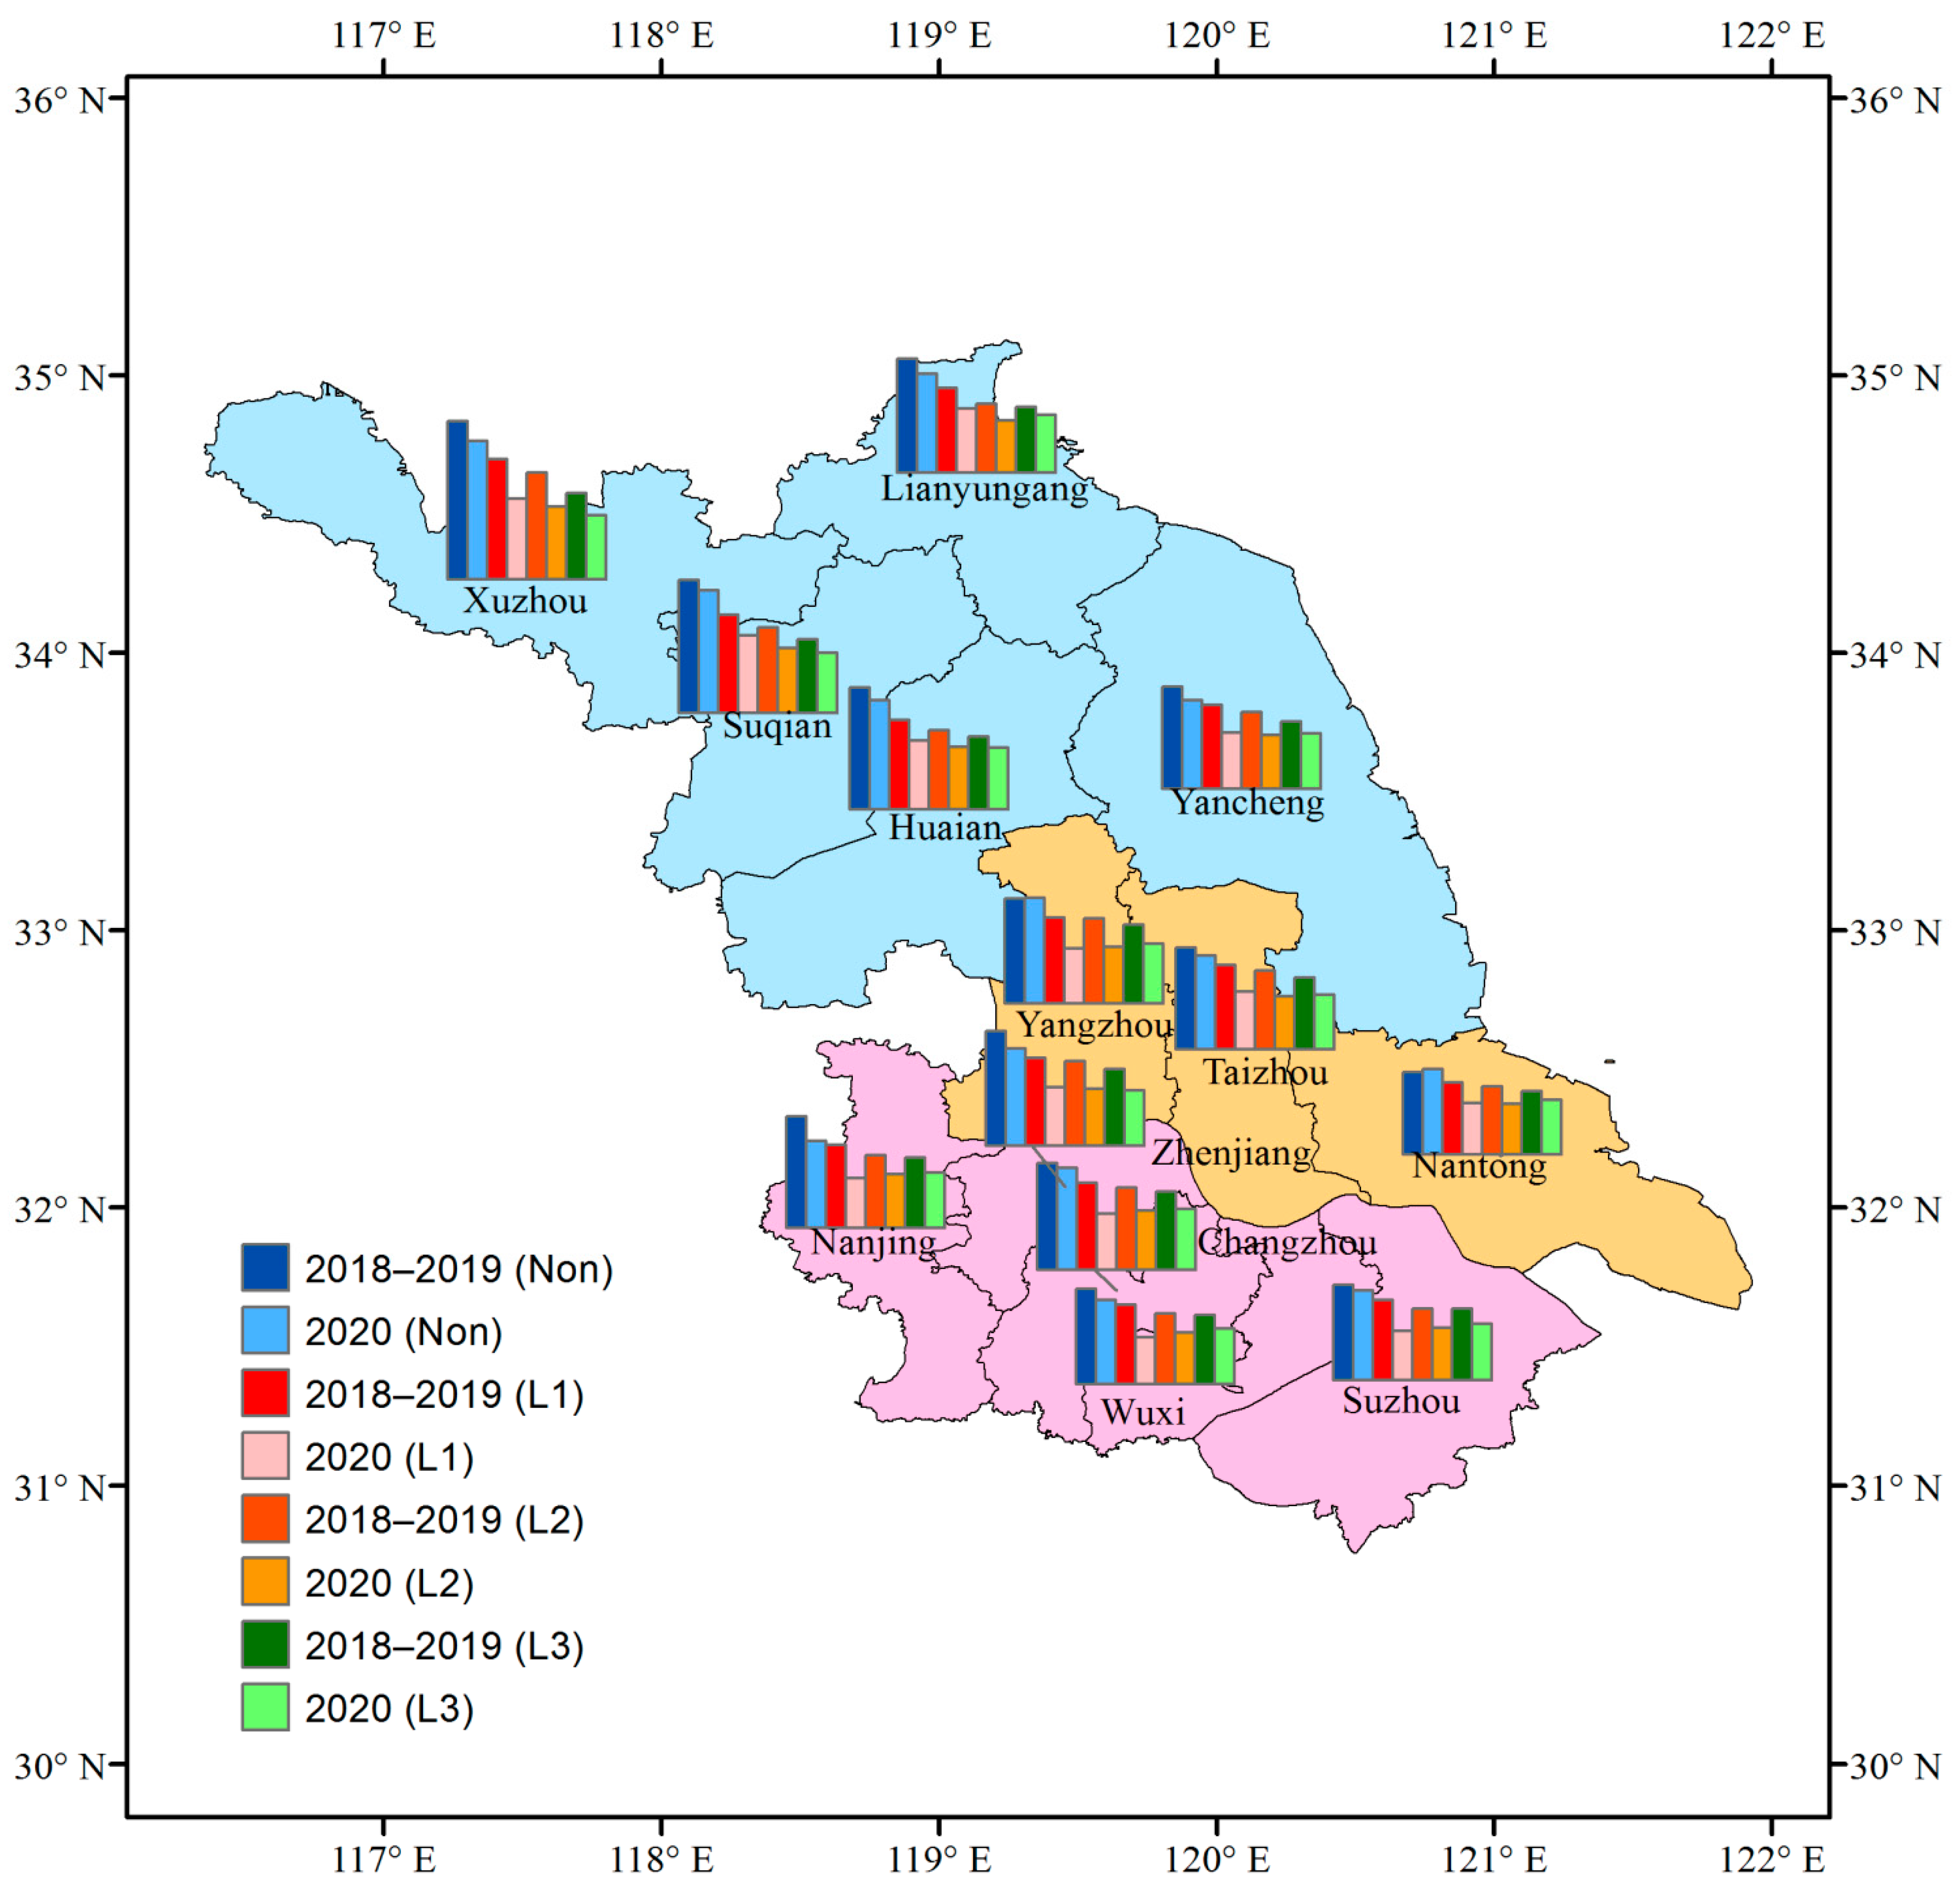
Table 4 and Figure 4 show the year-on-year variations of AQI in 13 cities of Jiangsu under different levels of PPC measures. It can be seen that in 2018 and 2019, there were significant differences in air quality among 13 cities. Among them, the air quality in Xuzhou that has a large proportion of heavy industry was the worst. After the outbreak of COVID-19, the gaps in air quality among 13 cities decreased. During the period with no PPC measures, except for Nantong and Yangzhou, the AQI values in other cities all declined, which means that the air quality generally improved in 2020. During the period with first-level PPC measures, the AQI values in all cities showed a larger magnitude of decline. Among them, Wuxi, Nanjing and Suzhou have the largest magnitudes of 40.4%, 39.7% and 38.3%, respectively, while Suqian, Huai’an and Lianyungang have the smallest magnitudes of 21.1%, 23.1% and 24.2%, respectively. During the period with second-level PPC measures, the magnitude of the AQI decline in each city was smaller than that during the period in first-level response. Among them, Yangzhou, Taizhou and Zhenjiang had the largest magnitudes of 34.3%, 32.8% and 32.4%, respectively, while Huai’an, Suqian and Lianyungang had the smallest magnitudes of 20.6%, 23.7% and 24.4%, respectively. During the period with third-level PPC measures, the decline of the AQI in each city was smaller than that during the period in second-level response. Specifically, Zhenjiang, Xuzhou, Yangzhou and Taizhou had larger magnitudes of 27.8%, 26.2%, 24.2% and 23.7%, respectively, while Lianyungang, Nantong, Huai’an and Suqian had smaller magnitudes of 11.9%, 14.0%, 15.2% and 17.8%, respectively.
Table 4.
Variations of AQI in 13 prefecture-level cities of Jiangsu under different levels of pandemic prevention and control measures, and those in the same period of historical years (the data are consistent with Figure 4).
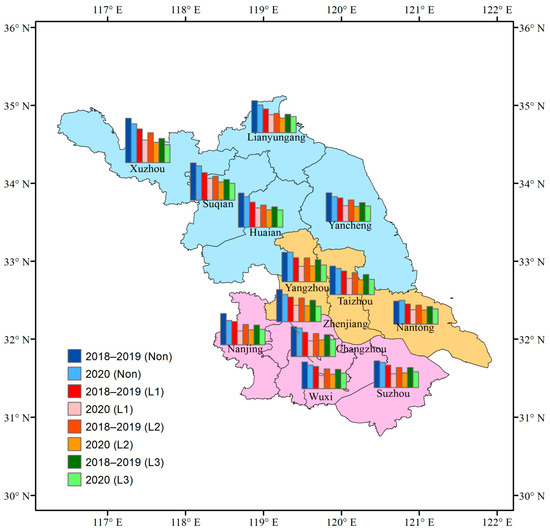
Figure 4.
Variations of AQI in 13 prefecture-level cities of Jiangsu under different levels of pandemic prevention and control measures, and those in the same period of historical years (the data are consistent with Table 4). Three colors in the map: blue, northern Jiangsu region; orange, central Jiangsu region; pink, southern Jiangsu region.
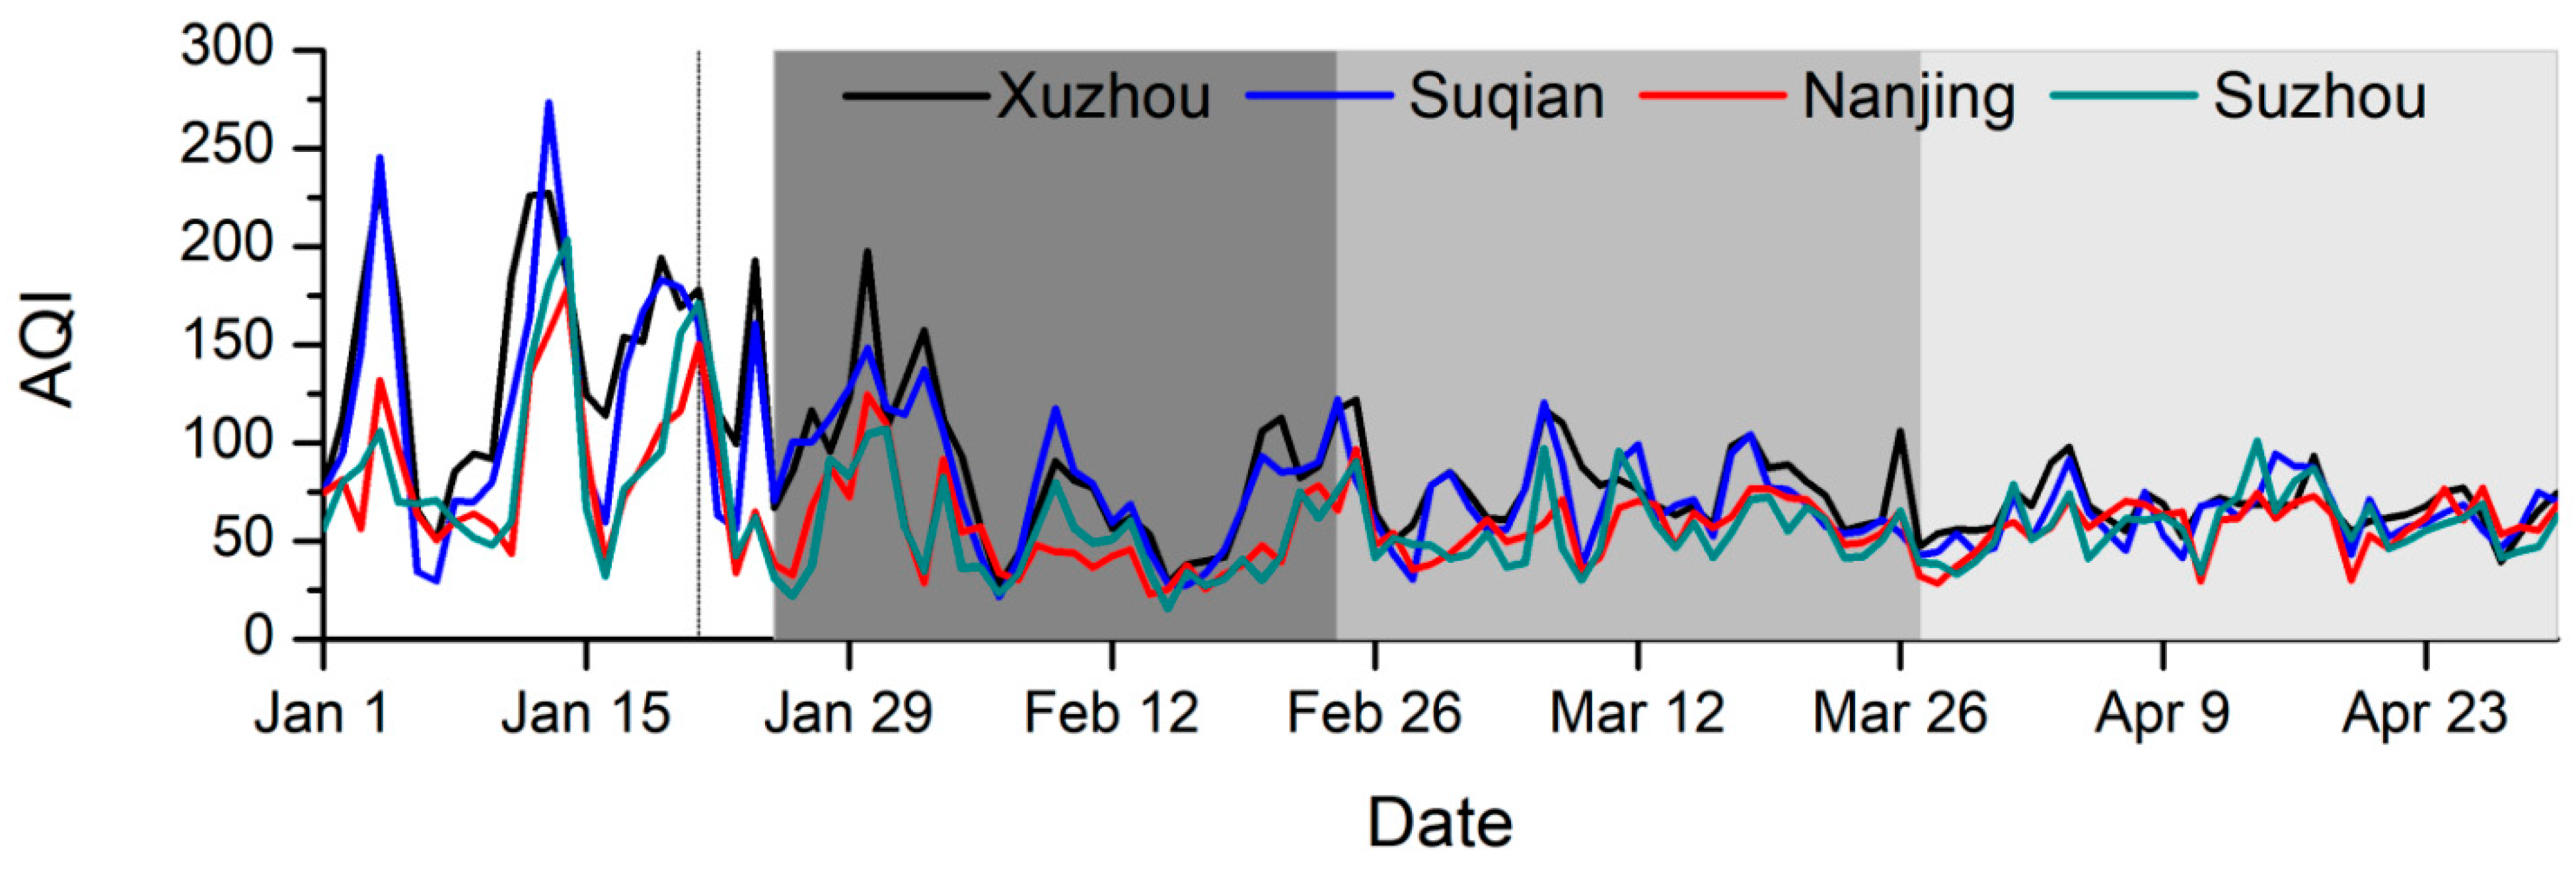
The daily variations of AQI in Xuzhou, Suqian, Nanjing and Suzhou in 2020 are presented in Figure 5. It can be seen that before the outbreak of COVID-19, the air quality in southern Jiangsu (Nanjing and Suzhou) was relatively good, while the air quality in northern Jiangsu (Xuzhou and Suqian) was poor. After the implementation of the first-level PPC measures, the air quality improved significantly. After the resumption of production, the pollutant concentrations rebounded, and the differences in the air quality among different cities shrank. The cities in southern Jiangsu returned to the pre-pandemic situation more quickly.
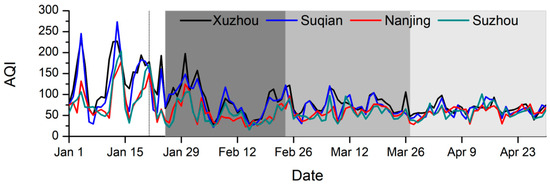
Figure 5.
Daily variations of AQI in Xuzhou, Suqian, Nanjing and Suzhou in 2020. The shadows of dark grey, medium grey and light grey represent the L1, L2 and L3 period respectively.
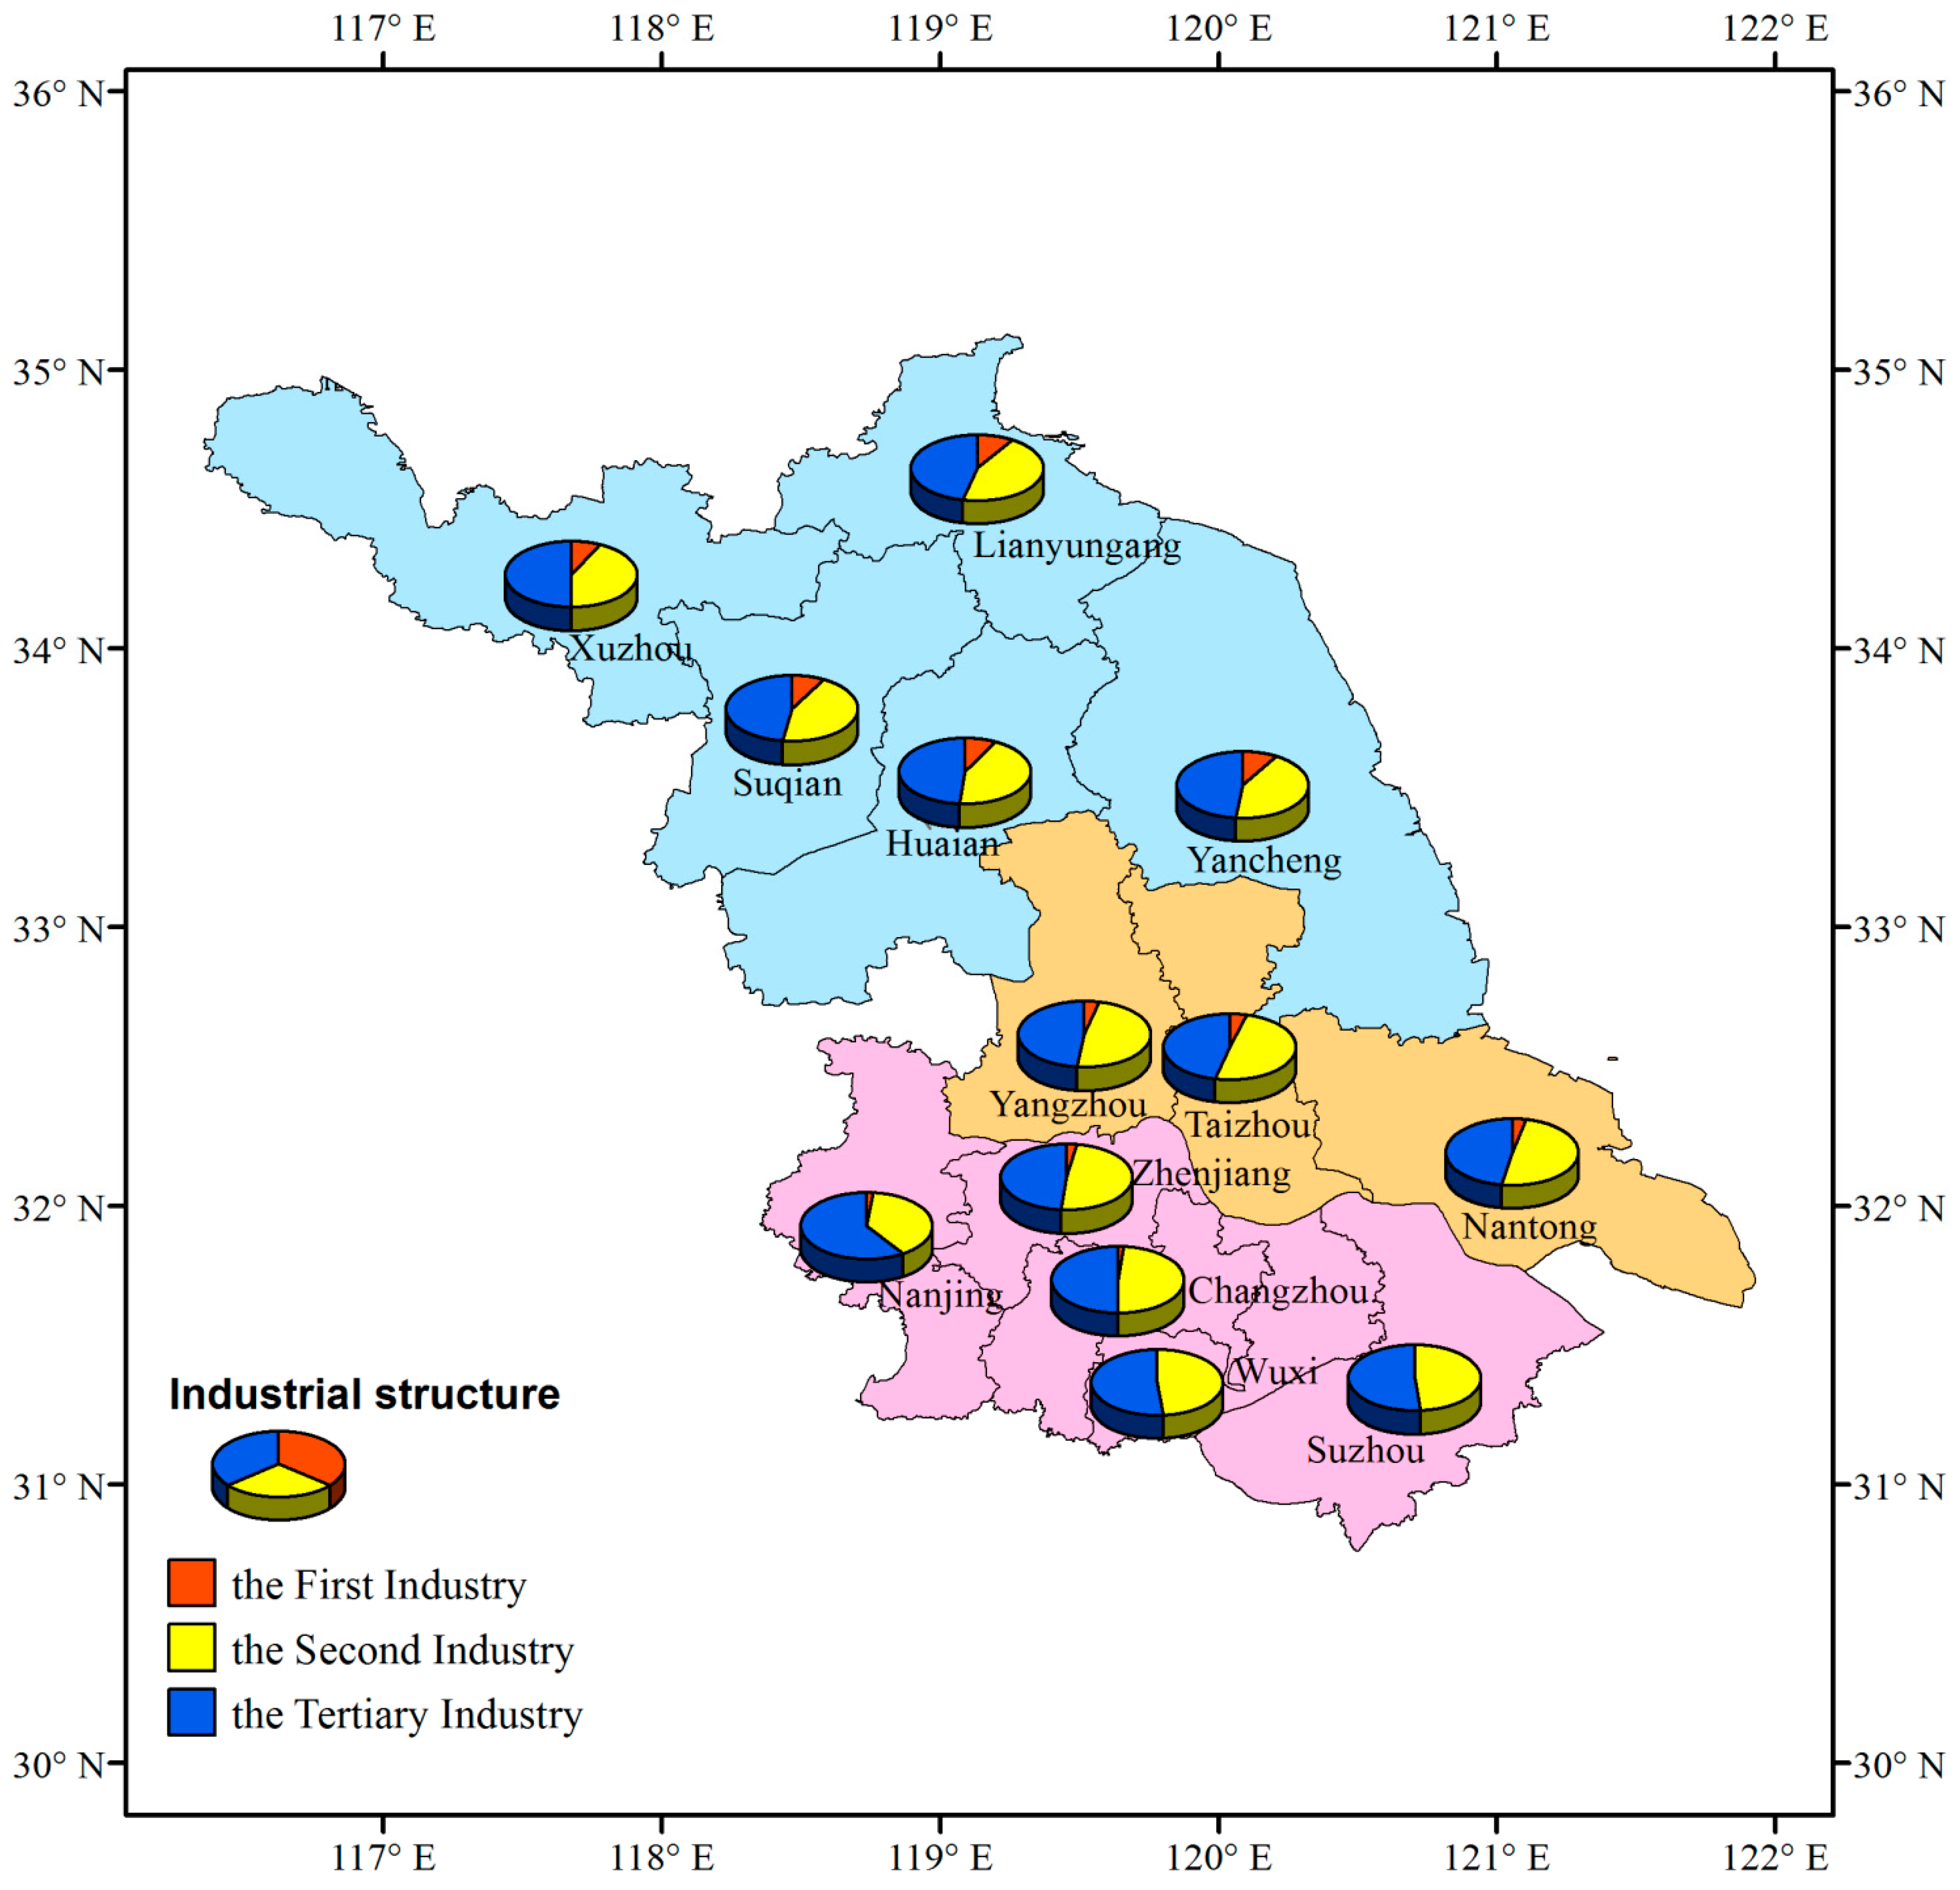
The GDP of 13 cities from 2019 to 2020 is shown in Table 5. The GDP of cities in southern Jiangsu is relatively higher. For example, the GDPs of Suzhou and Nanjing in 2020 reached CNY 2017.05 billion and CNY 1481.795 billion, respectively, while the GDPs of cities in northern Jiangsu were relatively lower. Suqian, the city with the lowest GDP in the province, had a GDP of CNY 326.24 billion in 2020. From the perspective of industrial structure (Figure 6), the proportion of primary industry in northern Jiangsu is higher than the average level of the whole province, while the proportions of secondary and tertiary industry are lower. The situation is the opposite in southern Jiangsu [35]. Under the epidemic prevention and control measures, the industrial and vehicle emissions were limited, so the secondary industry represented by industry and the tertiary industry represented by service industry were greatly affected. Therefore, the southern Jiangsu, dominated by the secondary and tertiary industries, was more sensitive to the PPC measures.
Table 5.
GDP rankings of 13 prefecture-level cities in Jiangsu Province (data from the National Bureau of Statistics of China, http://www.stats.gov.cn/, accessed on 10 March 2022).

Figure 6.
Industrial structure distribution map of 13 cities in Jiangsu Province. The data are from the Jiangsu Statistical Yearbook 2020, http://tj.jiangsu.gov.cn/2020/nj20/nj2006.htm, accessed on 10 March 2022.
Therefore, the response speed of urban air quality to the PPC level varied greatly under different economic development levels and industrial structure. The southern Jiangsu, which has a higher level of economic development and is dominated by secondary and tertiary industries, had a faster response speed and a stronger responsiveness. The pollutant concentration dropped rapidly during the period under first-level PPC, the economic production recovered quickly and the economic vitality was high during the periods under second- and third-level PPC. On the contrary, the northern Jiangsu, where the level of economic development is relatively backward and the proportion of primary industry is relatively high, had a slower response speed and a weaker responsiveness. The pollutant concentrations decreased slowly during the period under first-level PPC. After the relaxation of PPC measures, it takes a longer time for the economy to recover, and thus the economic vitality will be relatively weaker.
4. Conclusions
In early 2020, the outbreak of the COVID-19 pandemic occurred. In order to control the spread of the pandemic, the Jiangsu provincial government took different levels of public health emergency responses. This paper studies the variations of air quality in response to different levels of PPC measures. In 2018, the Jiangsu provincial government issued the “Implementation Plan of Jiangsu Province’s Three-Year Action Plan for Cleaner Air”. Since then, the air quality has improved significantly. Therefore, this study focuses on analyzing the air quality during 2018–2020. By analyzing the relationships of air pollution data with PPC levels and meteorological conditions, the major conclusions are as follows.
The implementation of COVID-19 related PPC policies directly affected the concentrations of air pollutants. For AQI and pollutants of NO2, CO, PM10 and PM2.5, as long as the countermeasures were taken, the AQI and pollutant concentrations were reduced by varied degrees regardless of the levels of PPC. However, there was no significant decrease in SO2 and O3 concentration during the period in response to PPC measures.
The air pollution reduction was closely related to the levels of PPC. In general, the higher the level of PPC measures, the greater was the reduction of air pollutant concentrations. Compared with the cities in northern China, the air quality in Jiangsu was more likely to be affected by restrictive policies, but the sensitivity of air quality to restrictive policies was slightly lower than that in the Guangdong–Hong Kong–Macao Greater Bay Area. This may be related to urban development and industrial structure in different regions.
NO2 was the pollutant most sensitive to PPC policies. The higher the level of PPC, the greater was the reduction of NO2 concentration. The CO and atmospheric particulate matter concentrations were most significantly reduced during the periods with first- and second-level PPC measures. With the recovery of production and living order, the pollutant concentrations gradually approached the average value in the same period of previous years.
There were great differences in the response speeds of urban air quality to the levels of PPC among cities with different levels of economic development and industrial structures. Southern Jiangsu, which has a higher level of economic development and is dominated by secondary and tertiary industries, had a faster response speed and a stronger responsiveness, indicating its high economic vitality.
Due to the complexity of air pollution change, in which many factors may play a key role in this process, this paper still has some limitations, which need to be discovered in further investigation.
Author Contributions
Conceptualization, W.A. and X.Y.; methodology, X.Y.; software, X.Y. and M.Z.; validation, X.Y. and M.Z.; formal analysis, Y.S. and B.W.; investigation, X.Y. and D.L.; resources, W.A. and X.L.; data curation, X.Y.; writing—original draft preparation, X.Y.; writing—review and editing, D.L., X.Y. and W.A.; visualization, X.Y. and M.Z.; supervision, W.A. and X.L.; project administration, W.A.; funding acquisition, W.A. and X.Y. All authors have read and agreed to the published version of the manuscript.
Funding
This research was funded by the General Projects of Jiangsu Meteorological Bureau (KM202204), the Youth Fund of Jiangsu Meteorological Bureau (KQ202005), the Innovation Fund of the Public Meteorological Service Center of China Meteorological Administration (M2021010), the Open Research Fund of China Meteorological Administration Key Laboratory of Transportation Meteorology (BJG202206) and the East China Regional Meteorological Science and Technology Collaborative Innovation Fund Cooperation Project (QYHZ202109).
Institutional Review Board Statement
Not applicable.
Informed Consent Statement
Not applicable.
Data Availability Statement
The data presented in this study are available upon request from the corresponding author.
Acknowledgments
We thank Jiangsu Environmental Monitoring Center for the provision of air quality data. We are also very grateful to Shen Jinyou of Nanjing University of Science and Technology, Zhang Zhiwei of Jiangsu Meteorological Society and Chen Hao of Jiangsu Meteorological Observatory for their guidance and help to this paper.
Conflicts of Interest
The authors declare no conflict of interest.
References
- Bao, R.; Zhang, A. Does lockdown reduce air pollution? Evidence from 44 cities in northern China. Sci. Total Environ. 2020, 731, 139052. [Google Scholar] [CrossRef]
- Berman, J.D.; Ebisu, K. Changes in US air pollution during the COVID-19 pandemic. Sci. Total Environ. 2020, 739, 139864. [Google Scholar] [CrossRef]
- Tian, H.; Liu, Y.; Li, Y.; Wu, C.-H.; Chen, B.; Kraemer, M.U.G.; Li, B.; Cai, J.; Xu, B.; Yang, Q.; et al. An investigation of transmission control measures during the first 50 days of the COVID-19 epidemic in China. Science 2020, 368, 638–642. [Google Scholar] [CrossRef] [PubMed] [Green Version]
- Venter, Z.S.; Aunan, K.; Chowdhury, S.; Lelieveld, J. COVID-19 lockdowns cause global air pollution declines. Proc. Natl. Acad. Sci. USA 2020, 117, 18984–18990. [Google Scholar] [CrossRef]
- Wang, Z.S.; Li, Y.T.; Zhang, D.W.; Chen, T.; Sun, F.; Li, L.J.; Li, J.X.; Sun, N.D.; Chen, C.; Wang, B.Y. Analysis on air quality in Beijing during the 2014 APEC conference. Acta Sci. Circumst. 2016, 36, 675–683. [Google Scholar]
- Li, X.; Kong, S.; Yin, Y.; Li, L.; Yuan, L.; Li, Q.; Xiao, H.; Chen, K. Polycyclic aromatic hydrocarbons (PAHs) in atmospheric PM2. 5 around 2013 Asian Youth Games period in Nanjing. Atmos. Res. 2016, 174, 85–96. [Google Scholar] [CrossRef]
- Huang, Q.; Wang, T.; Chen, P.; Huang, X.; Zhu, J.; Zhuang, B. Impacts of emission reduction and meteorological conditions on air quality improvement during the 2014 Youth Olympic Games in Nanjing, China. Atmos. Chem. Phys. 2017, 17, 13457–13471. [Google Scholar] [CrossRef] [Green Version]
- Zhao, J.; Luo, L.; Zheng, Y.; Liu, H. Analysis on air quality characteristics and meteorological conditions in Hangzhou during the G20 summit. Acta Sci. Circumst. 2017, 37, 3885–3893. [Google Scholar]
- Chen, Q.X.; Huang, C.L.; Yuan, Y.; Tan, H.-P. Influence of COVID-19 event on air quality and their association in Mainland China. Aerosol Air Qual. Res. 2020, 20, 1541–1551. [Google Scholar] [CrossRef]
- Filonchyk, M.; Hurynovich, V.; Yan, H.; Gusev, A.; Shpilevskaya, N. Impact assessment of COVID-19 on variations of SO2, NO2, CO and AOD over East China. Aerosol Air Qual. Res. 2020, 20, 1530–1540. [Google Scholar] [CrossRef]
- Wan, S.; Cui, K.; Wang, Y.F.; Wu, J.-L.; Huang, W.-S.; Xu, K.; Zhang, J. Impact of the COVID-19 event on trip intensity and air quality in southern China. Aerosol Air Qual. Res. 2020, 20, 1727–1747. [Google Scholar] [CrossRef]
- Xu, K.; Cui, K.; Young, L.H.; Wang, Y.-F.; Hsieh, Y.-K.; Wan, S.; Zhang, J. Air quality index, indicatory air pollutants and impact of COVID-19 event on the air quality near central China. Aerosol Air Qual. Res. 2020, 20, 1204–1221. [Google Scholar] [CrossRef] [Green Version]
- Zhang, J.; Cui, K.; Wang, Y.-F.; Wu, J.-L.; Huang, W.-S.; Wan, S.; Xu, K. Temporal variations in the air quality index and the impact of the COVID-19 event on air quality in Western China. Aerosol Air Qual. Res. 2020, 20, 1552–1568. [Google Scholar] [CrossRef]
- Zhang, L.; Yang, L.; Zhou, Q.; Zhang, X.; Xing, W.; Zhang, H.; Toriba, A.; Hayakawa, K.; Tang, N. Impact of the COVID-19 outbreak on the long-range transport of particulate PAHs in East Asia. Aerosol Air Qual. Res. 2020, 20, 2035–2046. [Google Scholar] [CrossRef]
- Jiaxin, C.; Hui, H.; Feifei, W.; Mi, Z.; Ting, Z.; Shicheng, Y.; Ruoqiao, B.; Nan, C.; Ke, X.; Hao, H. Air quality characteristics in Wuhan (China) during the 2020 COVID-19 pandemic. Environ. Res. 2021, 195, 110879. [Google Scholar] [CrossRef] [PubMed]
- Blumberg, S. Data Shows 30 Percent Drop in Air Pollution over Northeast U.S. NASA. 2020. Available online: https://www.nasa.gov/feature/goddard/2020/drop-in-air-pollution-over-northeast (accessed on 4 April 2020).
- EEA. Air Pollution Goes Down as Europe Takes Hard Measures to Combat Coronavirus. 2020. Available online: https://www.eea.europa.eu/highlights/air-pollution-goes-down-as (accessed on 25 March 2020).
- Bedi, J.S.; Dhaka, P.; Vijay, D.; Aulakh, R.S.; Gill, J.P.S. Assessment of air quality changes in the four metropolitan cities of India during COVID-19 pandemic lockdown. Aerosol Air Qual. Res. 2020, 20, 2062–2070. [Google Scholar] [CrossRef]
- Li, J.; Tartarini, F. Changes in air quality during the COVID-19 lockdown in Singapore and associations with human mobility trends. Aerosol Air Qual. Res. 2020, 20, 1748–1758. [Google Scholar] [CrossRef]
- Singh, V.; Singh, S.; Biswal, A.; Kesarkar, A.P.; Mor, S.; Ravindra, K. Diurnal and temporal changes in air pollution during COVID-19 strict lockdown over different regions of India. Environ. Pollut. 2020, 266, 115368. [Google Scholar] [CrossRef] [PubMed]
- Almond, D.; Du, X.; Zhang, S. Ambiguous Pollution Response to COVID-19 in China; National Bureau of Economic Research: Cambridge, MA, USA, 2020. [Google Scholar] [CrossRef]
- Li, L.; Li, Q.; Huang, L.; Wang, Q.; Zhu, A.; Xu, J.; Liu, Z.; Li, H.; Shi, L.; Li, R.; et al. Air quality changes during the COVID-19 lockdown over the Yangtze River Delta Region: An insight into the impact of human activity pattern changes on air pollution variation. Sci. Total Environ. 2020, 732, 139282. [Google Scholar] [CrossRef]
- Pei, Z.; Han, G.; Ma, X.; Su, H.; Gong, W. Response of major air pollutants to COVID-19 lockdowns in China. Sci. Total Environ. 2020, 743, 140879. [Google Scholar] [CrossRef]
- Li, J.; Yang, H.; Zha, S.; Yu, N.; Liu, X.; Sun, R. Effects of COVID-19 emergency response levels on air quality in the Guangdong-Hong Kong-Macao greater bay area, China. Aerosol Air Qual. Res. 2021, 21, 200416. [Google Scholar] [CrossRef]
- Sicard, P.; De Marco, A.; Agathokleous, E.; Feng, Z.; Xu, X.; Paoletti, E.; Rodrigez, J.J.D.; Calatayud, V. Amplified ozone pollution in cities during the COVID-19 lockdown. Sci. Total Environ. 2020, 735, 139542. [Google Scholar] [CrossRef] [PubMed]
- Pyrgou, A.; Hadjinicolaou, P.; Santamouris, M. Enhanced near-surface ozone under heatwave conditions in a Mediterranean island. Sci. Rep. 2018, 8, 1–10. [Google Scholar] [CrossRef] [PubMed] [Green Version]
- Wu, Z.; Liu, D.; Zhao, T.; Su, Y.; Zhou, B. Size Distributions of Water-Soluble Inorganic Ions in Atmospheric Aerosols during the Meiyu Period in the Yangtze River Delta, China. Front. Environ. Sci. 2021, 515. [Google Scholar] [CrossRef]
- Zhou, B.; Liu, D.; Yan, W. A Simple new method for calculating precipitation scavenging effect on particulate matter: Based on five-year data in Eastern China. Atmosphere 2021, 12, 759. [Google Scholar] [CrossRef]
- Lee, Y.C.; Shindell, D.T.; Faluvegi, G.; Wenig, M.; Lam, Y.F.; Ning, Z.; Hao, S.; Lai, C.S. Increase of ozone concentrations, its temperature sensitivity and the precursor factor in South China. Tellus B Chem. Phys. Meteorol. 2014, 66, 23455. [Google Scholar] [CrossRef]
- Li, K.; Jacob, D.J.; Liao, H.; Bates, K.H. Anthropogenic drivers of 2013–2017 trends in summer surface ozone in China. Proc. Natl. Acad. Sci. USA 2019, 116, 422–427. [Google Scholar] [CrossRef] [Green Version]
- Tan, Z.; Hofzumahaus, A.; Lu, K.; Brown, S.S.; Holland, F.; Huey, L.G.; Kiendler-Scharr, A.; Li, X.; Liu, X.; Ma, N.; et al. No evidence for a significant impact of heterogeneous chemistry on radical concentrations in the North China Plain in summer 2014. Environ. Sci. Technol. 2020, 54, 5973–5979. [Google Scholar] [CrossRef]
- Liu, D.; Yan, W.; Qian, J.; Liu, M.; Wang, Z.; Cheng, M.; Peng, H. A Movable Fog-Haze Boundary Layer Conceptual Model Over Jianghuai Area, China. Front. Environ. Sci. 2021, 591. [Google Scholar] [CrossRef]
- Wang, P.; Chen, K.; Zhu, S.; Wang, P.; Zhang, H. Severe air pollution events not avoided by reduced anthropogenic activities during COVID-19 outbreak. Resour. Conserv. Recycl. 2020, 158, 104814. [Google Scholar] [CrossRef]
- Zhu, Y.; Xie, J.; Huang, F.; Cao, L. Association between short-term exposure to air pollution and COVID-19 infection: Evidence from China. Sci. Total Environ. 2020, 727, 138704. [Google Scholar] [CrossRef] [PubMed]
- Lu, Y.; Li, X.; Ni, H.; Chen, X.; Xia, C.; Jiang, D.; Fan, H. Temporal-spatial evolution of the urban ecological footprint based on net primary productivity: A case study of Xuzhou Central Area, China. Sustainability 2019, 11, 199. [Google Scholar] [CrossRef] [Green Version]

Publisher’s Note: MDPI stays neutral with regard to jurisdictional claims in published maps and institutional affiliations. |
© 2022 by the authors. Licensee MDPI, Basel, Switzerland. This article is an open access article distributed under the terms and conditions of the Creative Commons Attribution (CC BY) license (https://creativecommons.org/licenses/by/4.0/).