Article

The Thermal Environment of Housing and Its Implications for the Health of Older People in South Australia: A Mixed-Methods Study

1
School of Public Health, The University of Adelaide, Adelaide 5005, Australia
2
School of Architecture and Built Environment, The University of Adelaide, Adelaide 5005, Australia
3
Faculty of Social Work & Education, The Hague University of Applied Sciences, Johanna Westerdijkplein 75, 2521 EN Den Haag, The Netherlands
4
Institute of Spatial Management, Faculty of Environmental Engineering and Geodesy, Wrocław University of Environmental and Life Sciences, ul. Grunwaldzka 55, 50-357 Wrocław, Poland
5
Adelaide Medical School, The University of Adelaide, Adelaide 5005, Australia
*
Author to whom correspondence should be addressed.
Atmosphere 2022, 13(1), 96; https://doi.org/10.3390/atmos13010096
Submission received: 16 November 2021 / Revised: 28 December 2021 / Accepted: 4 January 2022 / Published: 8 January 2022
(This article belongs to the Special Issue Impacts of Heatwaves on Health)

Abstract

:
Older people are often over-represented in morbidity and mortality statistics associated with hot and cold weather, despite remaining mostly indoors. The study “Improving thermal environment of housing for older Australians” focused on assessing the relationships between the indoor environment, building characteristics, thermal comfort and perceived health/wellbeing of older South Australians over a study period that included the warmest summer on record. Our findings showed that indoor temperatures in some of the houses reached above 35 °C. With concerns about energy costs, occupants often use adaptive behaviours to achieve thermal comfort instead of using cooling (or heating), although feeling less satisfied with the thermal environment and perceiving health/wellbeing to worsen at above 28 °C (and below 15 °C). Symptoms experienced during hot weather included tiredness, shortness of breath, sleeplessness and dizziness, with coughs and colds, painful joints, shortness of breath and influenza experienced during cold weather. To express the influence of temperature and humidity on perceived health/wellbeing, a Temperature Humidity Health Index (THHI) was developed for this cohort. A health/wellbeing perception of “very good” is achieved between an 18.4 °C and 24.3 °C indoor operative temperature and a 55% relative humidity. The evidence from this research is used to inform guidelines about maintaining home environments to be conducive to the health/wellbeing of older people.

1. Introduction

As noted by Dahlgren and Whitehead in their model of the key determinants of health [1], human health is affected by many factors, including environmental conditions and housing. Living conditions play important roles in physical and mental health and wellbeing, as can the indoor temperature of our houses [2]. The causes of illness, injury and death in cold and hot weather extremes are numerous, and often relate to the inability of the body to adequately maintain thermal homeostasis, leading to adverse effects on health [3]. Older people are generally over-represented in morbidity and mortality statistics during hot and cold spells, particularly as chronic medical conditions associated with aging can often increase vulnerability [3,4]. Additionally, potentially disabling ailments that may not necessarily require visits to health practitioners can be triggered or exacerbated by temperature anomalies. These can include headaches, shortness of breath, anxiety and dehydration associated with high temperatures and heatwaves [5,6,7], while arthritis, influenza, pneumonia, coronary events and asthma have been linked to cold conditions [6,8,9,10]. However, ill health due to environmental temperature exposure is largely preventable [11] if exposure can be mitigated. With a changing climate and the likelihood that the adverse impacts of extreme events on a population’s health will likely increase [12,13], it is important that this complex social determinant of health be investigated from a multi-disciplinary perspective.
An abundance of epidemiological studies has shown that morbidity and mortality increase in populations when temperatures are extreme (often defined as a percentile of the temperature), with varying thresholds [14,15,16,17]. A limitation of these climatologically based studies is that, often, they include some misclassification bias, as ambient temperature metrics sourced from central meteorological stations are used as surrogates for personal temperature exposure [18]. Consequently, little is known about the temperature–health associations at the individual level or in indoor thermal environments.
While our homes should offer comfort and protection from aspects of the climate that can cause harm, thermal comfort often comes at a cost. With ever-increasing energy costs, householders may be frugal in the use of electricity and gas for heating and cooling, and this can be detrimental to health as shown in studies of fuel poverty and health [19,20]. This is particularly the case for older people who often use learned behaviours to adapt and may avoid using heaters and coolers even in extreme conditions [5,21]. A randomized control trial involving older people being provided with heat-health information and tips showed a 63% reduction in self-reported heat stress during summer in the intervention group compared with the control group [22]. Notwithstanding, modified behaviours cannot always guarantee health protection in thermally challenging environments.
Older people spend the majority of time indoors, particularly when temperatures are extreme [23,24,25,26], yet relatively little is known about thermal comfort and health in the living environment of older people [27]. To address this issue, a novel collaborative study “Improving thermal environment of housing for older Australians” funded by the Australian Research Council was undertaken, involving researchers in public health, geriatric medicine and architecture, to explore relationships between indoor temperature, thermal comfort, adaptive behaviours and perceived health in older people. While aspects of the three-part study focusing on the thermal behaviours and ‘thermal personalities’ of the study participants have been previously reported [6,28,29], here, we expand the scope and explore the findings through a public health lens.
The aim of this study is to determine links between the indoor thermal environment of housing and self-reported health and wellbeing in older people in metropolitan and regional areas of South Australia. At the nexus of public health and thermal comfort science, this mixed-methods study adds new information to the body of knowledge about housing and the temperature-related health of older people.
The paper is structured such that we firstly briefly recapitulate the relevant methods and results from the initial research to provide a contextual basis for the present study. We discuss the implications for public health in a changing climate, focusing on the determinants of health and housing options that provide a healthy, comfortable environment for occupants, while keeping heating and cooling costs affordable. Finally, we suggest research options needed to move the narrative further.

2. Materials and Methods

This study was based in the Australian state of South Australia (SA), with a population of approximately 1.77 million as in June 2020, 19.1% of which were individuals aged 65 years or over, making the state’s population the second oldest in the nation [30]. Three regions in the state were chosen as study sites. These were: the Greater Adelaide metropolitan area, the state’s capital and surrounding suburban areas; the Iron Triangle (comprising the cities of Whyalla, Port Augusta and Port Pirie—roughly 300 km north of Adelaide) and the Fleurieu Peninsula (incorporating parts of the Adelaide Hills and the city of Victor Harbor and Encounter Bay—84 km south of Adelaide). Details of the climate zones appear elsewhere [6,29], but, in short, the Iron Triangle has a semi-arid climate, Adelaide metropolitan has a warm temperate climate, and the Fleurieu Peninsula and Adelaide Hills has a slightly cooler, mild temperate climate. These climate zones are defined by the Köppen–Geiger climate classification system as BSk (semi-arid), Csa (warm temperate) and Csb (mild temperate), and by the Australian Building Codes Board as climate zones 4, 5 and 6, respectively [31,32]. The study population comprised older people aged 65 years or over living independently in these regions.
The project proceeded in sequential stages of the initial research as shown in Figure 1. A survey questionnaire was administered by telephone, focus groups were held and detailed real-time environmental monitoring of homes, occupants’ thermal comfort and self-reported health and wellbeing was recorded. The analysis of data enabled the formulation of theoretical thermal personas of participants (also named “thermal personalities”). The evidence generated from this research, together with building performance computer simulations, were used to inform targeted thermal design guidelines for new and/or retrofitting of current, residential housing for the growing ageing population in an era of environmental change. The initial research and the present study focusing on the effects of the thermal environment on health and wellbeing are described in Section 2.1 and Section 2.2, respectively.

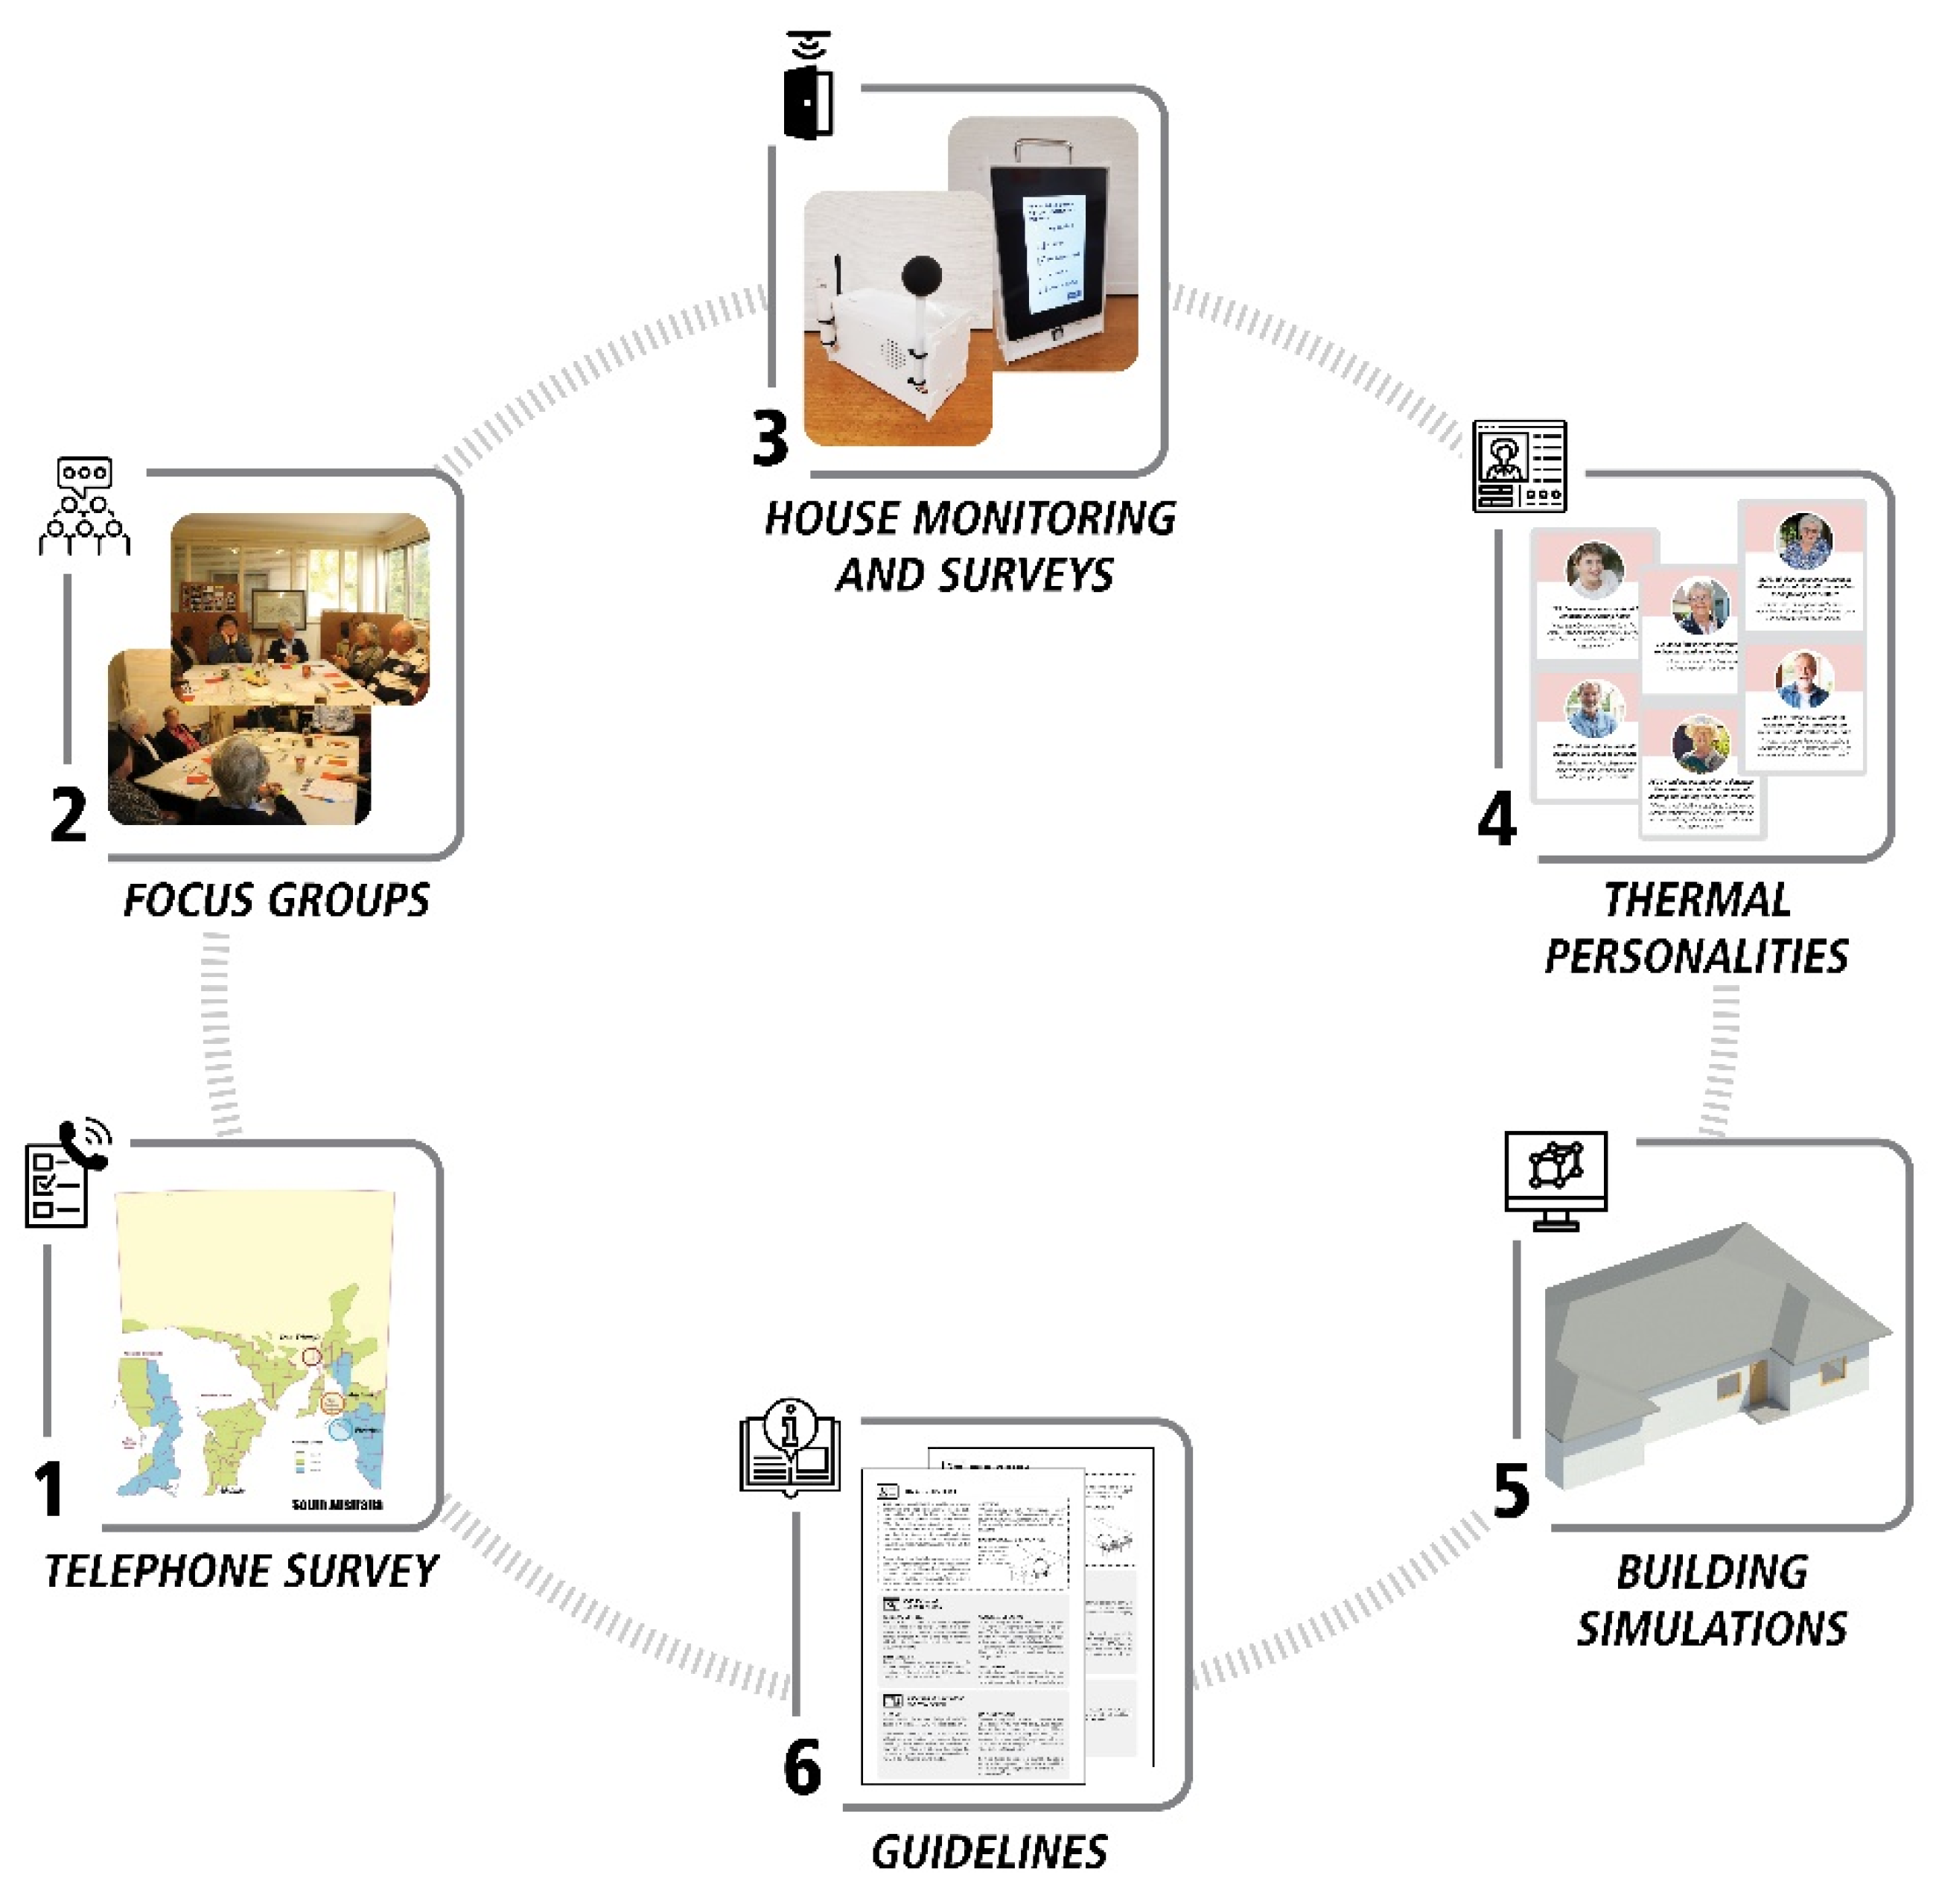
2.1. Initial Research

2.1.1. Telephone Survey

In May 2018, a Computer-Assisted Telephone Interviewing (CATI) method was used to survey people aged 65 years or over who lived in their own home in the three study regions. Households were randomly selected from a public listing of telephone numbers. The number of respondents selected in each region was based on the proportion of older people to the total adult population in that region. The minimum sample size was calculated to be 246, with a confidence level of 95% and a standard error of 5% and assuming (given the homogeneity of the sample) that approximately 80% would answer in a certain way [29]. While a larger sample size would have been preferred, we believe the findings are robust and were not largely influenced by the quantity of the survey.
A section of the survey included questions about respondents’ general health and quality of life (with questions adopted from the EQ-5D-5L questionnaire [33]) and perceptions of the impact of weather on their health and wellbeing. Statistical analysis involving descriptive statistics, cross tabulations, Chi-square tests, correlation analyses and multi-variate regression was conducted using SPSS Version 25 [34]. The level of statistical significance was set at p < 0.05 [29].

2.1.2. Focus Groups

Semi-structured focus groups were held with participants in all three regions recruited through various means. Participants’ views about issues, including age and thermal perception, adaptive behaviours, effects on health and wellbeing, housing and health and energy costs, were garnered. With consent, proceedings were audio-recorded and transcribed verbatim. Using standard qualitative analytical techniques involving data coding [35], transcripts were analysed to identify major themes with the aid of NVivo software v12 (QSR International Pty Ltd., Doncaster, Victoria, Australia). More details can be found in work by Van Hoof et al. [6].

2.1.3. Home Monitoring and Occupant Surveys

To investigate the actual thermal environment of the housing and its relationships with the occupant’s health/wellbeing, house monitoring and occupant surveys were conducted over a nine-month period incorporating summer and winter seasons. The participants were recruited from the previous stages of the study [28,36], while a few others were recruited through a passive snowballing method.
Before the monitoring took place, a questionnaire and short interview were conducted with participants to ascertain details of their demographics, dwelling, financial situation, and health status. For some participants who agreed, a body composition assessment was conducted using a Tanita Inner Scan RD-953 scale [37,38] to enable the calculation of percentage body fat, muscle mass, bone mass and basal metabolic rate [39].
Indoor environmental data loggers (containing sensors for air temperature, globe temperature, relative humidity and air movement), specifically designed and built by the research team for the project, were installed in the main living room of the dwellings. As reported in detail in [40], the data logger consisted of a CCS811 sensor to measure air temperature and relative humidity (RH), a Maxim DS18B20 temperature sensor mounted in a matt-black 38 mm table tennis ball to measure globe temperature [41] and a Modern Device Wind Sensor RevC mounted on the logger box to measure the air speed. The temperature and humidity sensors were tested against a calibrated HOBO®® MX1102 logger, while the wind sensor/anemometer was tested against a TSI 8475 Air Speed omnidirectional probe to develop a calibration curve voltage versus air speed (m/s). At the completion of monitoring, all sensors were again tested and compared with the HOBO®® MX1102 along with an Assmann Aspirated Psychrometer measuring dry and wet bulb temperature (from which RH was calculated), in a controlled environment during a period of 24 h.
Dry bulb temperature, globe temperature and air speed measurements complied with ISO 7726:1998 Class C instrumentation standard. The mean radiant temperature and operative temperature were calculated at each recording interval in accordance with Annex B and Annex G, respectively, of this Standard. Possible discrepancies in the estimation of the mean radiant temperature were checked against a method suggested by d’Ambrosio Alfano et al. [42]. The potential errors in the estimation of the mean radiant temperature showed an average of 0.23 K over all votes (n = 10,813). The corresponding average difference in the estimated operative temperature was 0.17 K. These differences, however, would not invalidate any of the calculations derived from the application of the ISO 7726 methods.
Prior to deployment, all the loggers were placed together in a laboratory room similar to a domestic environment and all sensors were checked for consistency at 30 min recording intervals over a 24 h period. For measurements in houses, the logger, with its integrated sensors, was placed on a table or sideboard at approximately 800–1000 mm above the floor away from any radiation source (e.g., windows) and near where the participant would normally answer the survey. Measurements recorded at 30 min intervals were sent to a web-based server via the 3G network [40]. In bedrooms the air and globe temperatures as well as relative humidity were measured and recorded using data loggers (i.e., Hobo U12-013 with TMC6-HD temperature probe mounted in a matt-black 38 mm table tennis ball). This logger was placed next to the bed in the main bedroom, also away from any heat source.
A specially designed tablet-based integrated data acquisition system was designed to allow participants to respond regularly to a point-in-time survey regarding, for example, their clothing, activity, heating or cooling appliance operation, perceptions of the indoor environment and self-reported health and wellbeing status. For this purpose, an electronic tablet with a 7” touch screen (Nextion by Itead) was used. Each tablet was secured in a sturdy custom-made laser-cut acrylic enclosure with a strong handle to allow the participant to carry it to different rooms (living room or bedroom). The tablet communicated with the data logger while the internal 3G cellular modem transmitted the indoor environmental data and survey responses to an external FTP website once a day. Data from the Hobo loggers, however, had to be downloaded manually every 3 months, and all the data, including the Bureau of Meteorology weather data, were compiled and consolidated into files for analysis. For further details, see [40].
Thermal sensation votes were recorded using the American Society of Heating, Refrigerating and Air-Conditioning Engineers (ASHRAE) 7-point scale of thermal sensation [43], with answers to the question “How do you feel right now” ranging from hot (+3), warm (+2), slightly warm (+1) and neutral (0) to slightly cool (−1), cool (−2) and cold (−3). Thermal comfort questions asked how comfortable participants felt with options ranging from very comfortable to very uncomfortable, while thermal preference was measured on a 3-point scale with answers to the question “Would you prefer to be…?” being warmer, no change or cooler [40].
Using SPSS Version 25 [34] and a level of statistical significance set at p < 0.05, stepwise linear regression was used to regress occupants’ thermal sensation votes against personal parameters. Pearson correlation was undertaken to assess the relationship between outdoor and indoor temperatures when a unique exponential expression was fitted to the data.

2.1.4. Thermal Personalities and Building Performance Simulations

To aid in the development of guidelines, the concept of personas (i.e., fictitious yet specific representations of participant features [44]) was used to develop a set of ‘thermal personalities’ and building performance simulations were used to inform thermal efficiency measures. While we briefly outline the methods for contextual purposes, the details and findings of these studies were previously reported elsewhere and do not form part of the current analysis.
Thermal personalities (personas) were developed using the quantitative and qualitative data from previous stages of the study (see Section 2.1.1, Section 2.1.2 and Section 2.1.3). An agglomerative hierarchical cluster analysis was conducted by grouping the data into clusters, with intra-cluster members having similarities in personal factors, including age, sex, health status, income, housing and thermal behaviours (see Bennetts et al. [28]).
The design and construction of sample houses representing different types of dwellings occupied by study participants were analysed using building performance simulations. A number of design changes or alterations and their possible impacts on indoor thermal comfort and energy use were predicted using thermal performance computer simulations (see Arakawa Martins et al. [45]).

2.2. Effects of the Thermal Environment on Health and Wellbeing

In the present study, relevant qualitative and quantitative data collected previously (as described in Section 2.1) were selectively extracted to investigate whether temperature variations in the home affect the health of older occupants. Of particular interest were participants’ responses to questions about their adaptive behaviours, thermal comfort, thermal sensations and perceived health and wellbeing (which was not specifically defined). Home occupants were asked questions such as “How would you describe your health and wellbeing at the moment”, “Do the conditions in this room influence your health and wellbeing?” and “In this room, are windows and doors: all opened, some opened/closed, all closed??”, with responses provided via the purpose-built tablet (see Section 2.1.3). There were also questions regarding current activity and clothing levels, with responses ranging from very relaxed to active, and very light to very heavy, respectively. The point-in-time nature of the survey allowed us to determine room temperatures and ambient temperatures corresponding to the time when participants provided survey responses. Data analysis included descriptive statistics, Pearson correlations and regression analysis using methods described above.

3. Results

In total, 303 independently living older people aged 61–98 years participated in the different stages of this research. Table 1 shows the number that took part in the three stages of the project. Some participants took part in more than one stage, with 250 responding to the survey, 49 taking part in focus groups and 71 involved in the home monitoring study. In each study and climate zone, the number of female participants exceeded the number of males.

3.1. Telephone Survey

The findings from the telephone survey showed that 75% of respondents considered themselves to be healthy, giving a rating of 70 or more out of 100, with 0 being the worst and 100 being the best health imagined, and 74% had good mobility. The majority (83%) reported no doctor or physician-diagnosed illnesses related to cold or hot weather. The remainder reported respiratory conditions diagnosed during cold weather or heart conditions diagnosed during hot weather.
In cold weather, 36% reported experiencing symptoms, the most frequent being coughs and colds (44%), painful joints (33%), shortness of breath (19%) and influenza (14%). In hot weather, 18% reported symptoms, including fatigue or tiredness (56%), shortness of breath (22%), sleeplessness (17%) and dizziness (17%). Nausea, vomiting, falls and headaches were also reported. The self-rating health scale of respondents was found to have a strong association with health symptoms occurring in hot weather (p < 0.005).
Two-thirds of the survey respondents’ dwellings were more than 20 years old and had no wall insulation, whereas newer housing was better insulated. Of the respondents who were diagnosed with winter illnesses such as asthma, bronchitis, pneumonia, and heart conditions, more lived in houses without wall insulation than in insulated houses (ratio 1.4:1). More than 70% of respondents had concerns about the running costs of heating and cooling, with pensioners in particular being “extremely concerned”. Further details from the study were reported by Soebarto et al.’ [29].

3.2. Focus Groups

The analysis of qualitative data derived from the focus groups provided information regarding how participants dealt with their domestic thermal environment [6]. One of the common themes that emerged in these discussions was characterised as ‘personal factors’ incorporating subthemes of age, sex, health and wellbeing and the financial situation. Participants considered that their thermal perceptions had changed with age and that some health conditions were exacerbated in cold or hot conditions. In agreement with the survey findings, participants related cold weather to experiencing aches and pains, chest problems and aggravation of arthritis symptoms. They too were concerned about the costs associated with using heaters and coolers to achieve thermal comfort.
Another theme identified was ‘doing’, relating to adaptive behaviours and home adaptation. Some participants had installed solar panels to reduce energy costs, whereas examples of passive alternatives included using blankets and rugs or increasing activity to keep warm in cold weather. In very hot weather, some used ceiling fans, kept blinds closed or chose to go to an air-conditioned venue instead of using home cooling [6].

3.3. Home Monitoring and Occupant Surveys

The monitoring period of January to October 2019 comprised most of summer, through autumn (fall), winter and two months of spring. The houses monitored were mostly constructed with external walls of cavity brick or brick veneer and roofs of corrugated steel sheeting or concrete tiles. Older houses generally had suspended timber floors and the newer houses concrete slab-on-ground construction. All dwellings had heaters and all but two had air-conditioners in at least one room and, as is the norm in Australia, very few had central heating and cooling systems. Most were poorly insulated and about half lacked external shading.
Results presented below highlight the links between the indoor thermal environment and self-reported health and wellbeing of the occupants. General results from the monitoring and occupant survey were reported elsewhere [34,40].

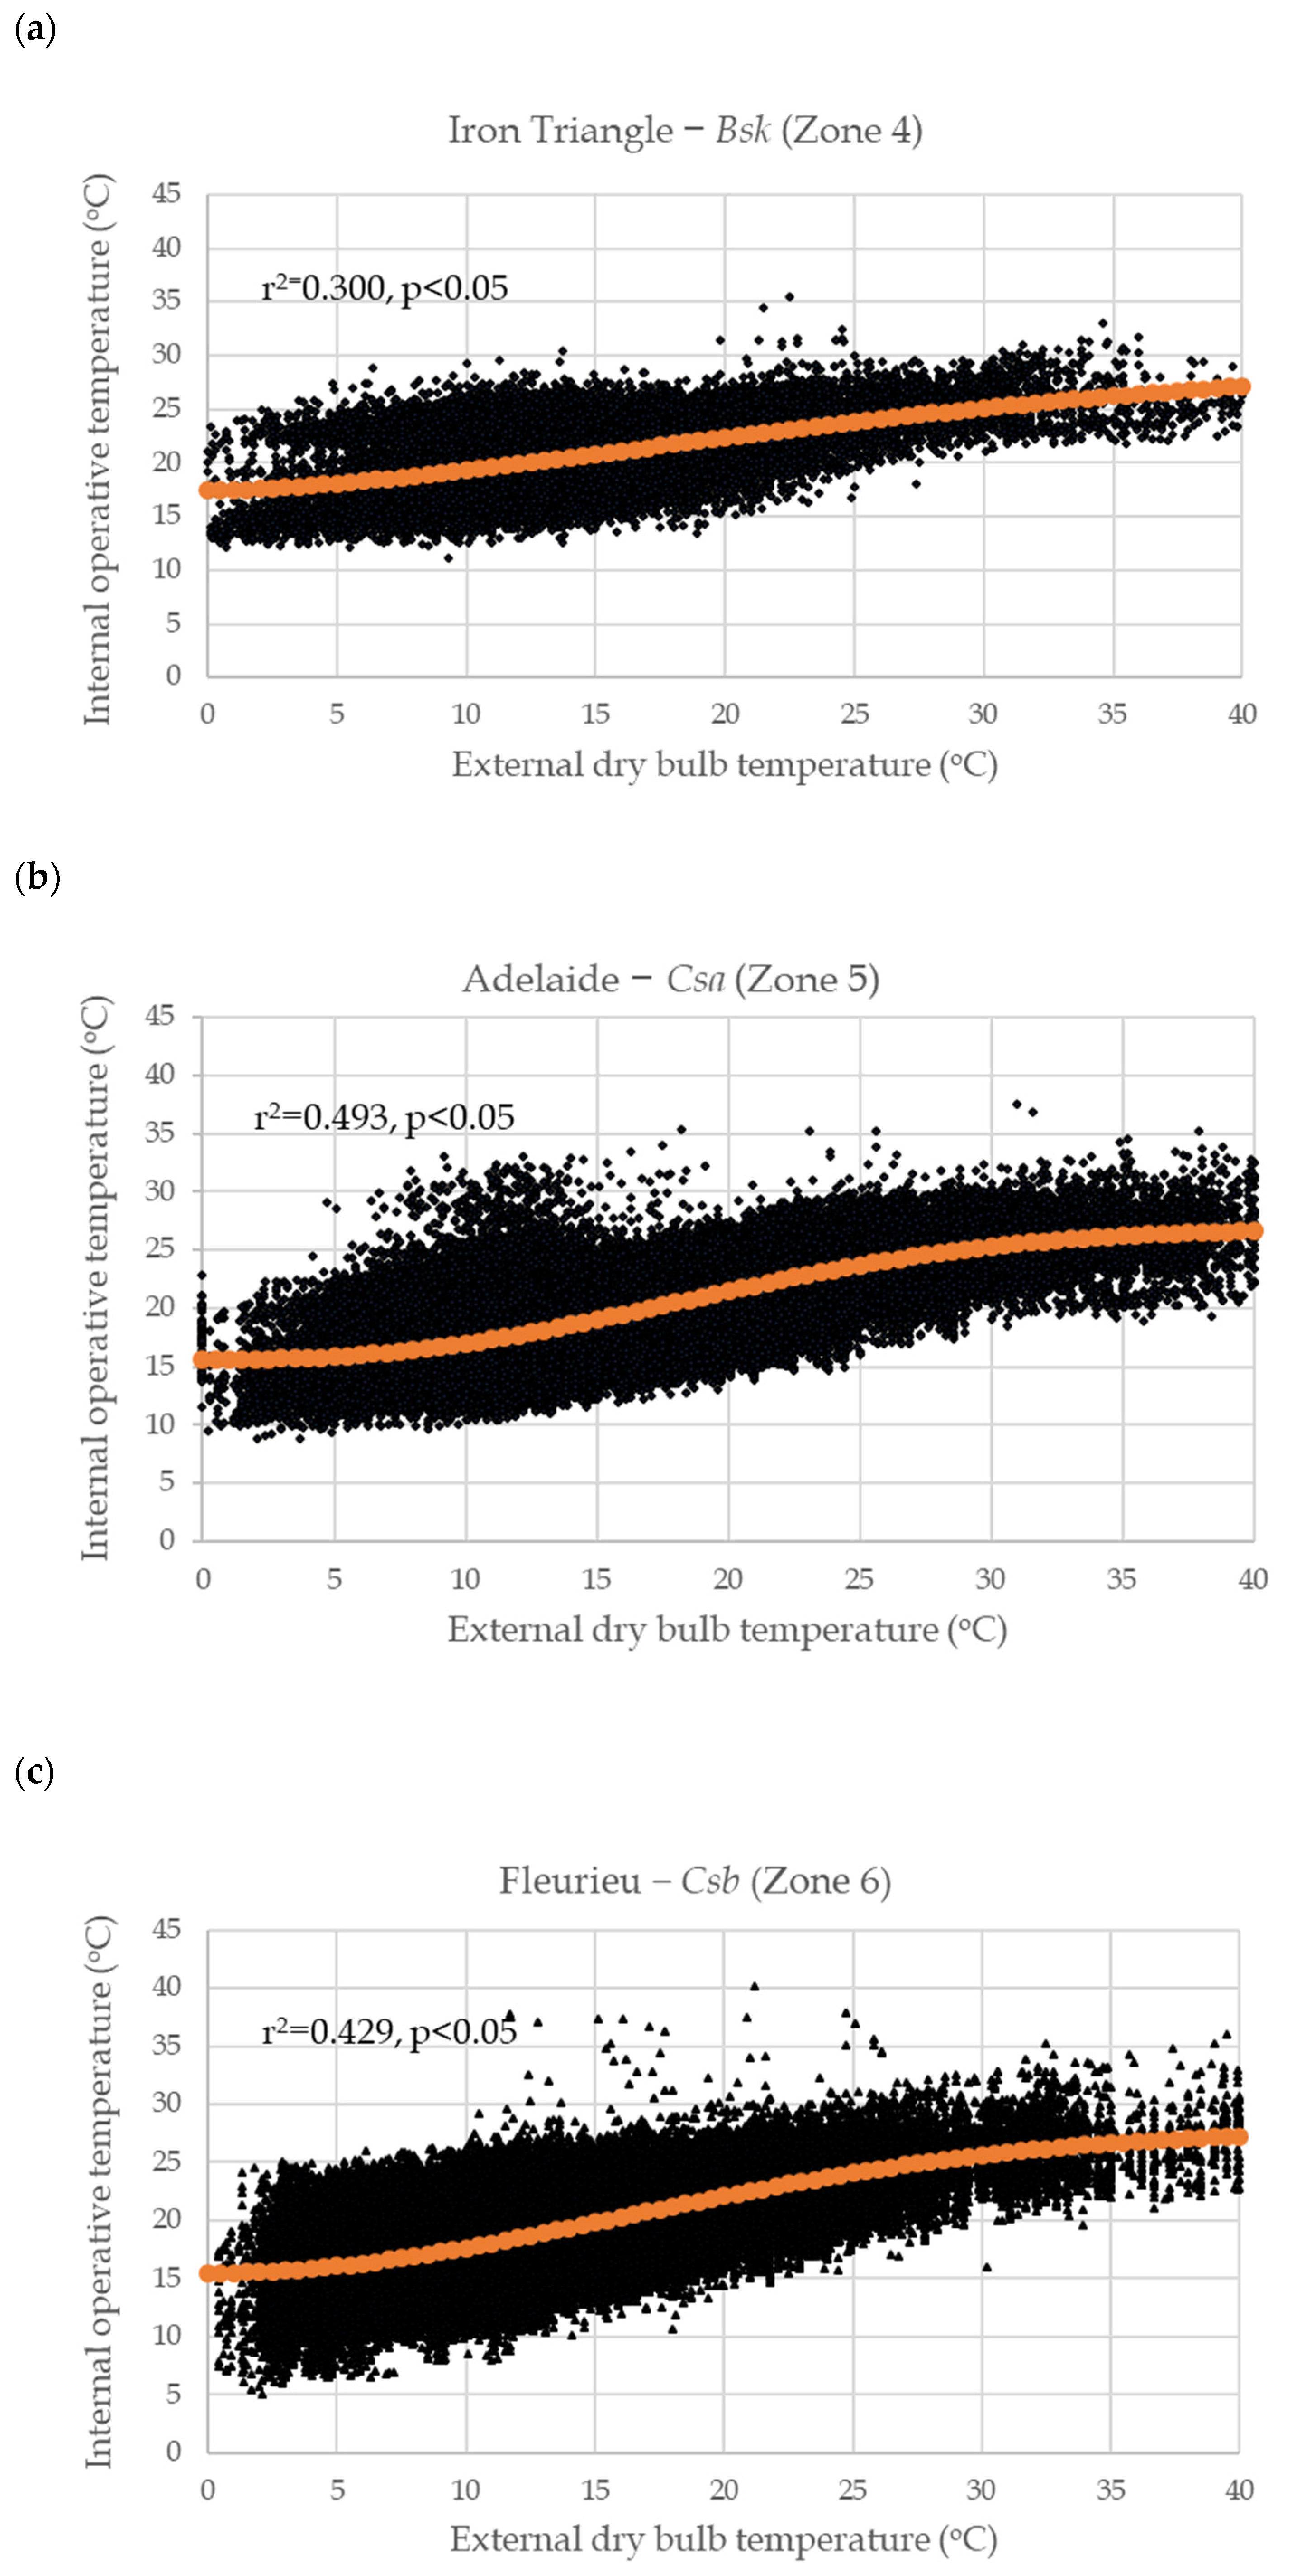
3.3.1. Analysis of Outdoor and Indoor Temperatures and Use of Heating/Cooling

As well as recording indoor temperatures as described above, hourly outdoor temperatures were sourced from the Bureau of Meteorology (BOM) stations identified as being nearest to the monitored houses [46]. In each climate zone, this involved data from a number of stations.
Table 2 shows the extreme outdoor BOM temperatures recorded during the monitoring period. Note, however, that due to the time taken to arrange the installation of the monitoring equipment and the extensive travel involved to the study sites, a number of homes were not monitored when the extreme January temperatures occurred. For example, prior to the logger deployment during the summer period, maximum temperatures were recorded in the Iron Triangle (Bsk or Zone 4) of 48.5 °C, 47.7 °C in Adelaide (Csa or Zone 5) and 46 °C on the Fleurieu Peninsula (Csb or Zone 6).
As shown in Table 2, comfort votes were not usually recorded at the times the extremes of the outdoor temperatures occurred. This was particularly the case during the winter period. Nevertheless, the range of outdoor and indoor conditions covered during voting provided a good basis from which to draw general conclusions, with some extremes included in the data. For example, the maximum indoor operative temperature when occupants responded to the survey was 38.1 °C recorded in an Adelaide home with the outdoor temperature at the time being 46.8 °C.
The lowest indoor operative temperature of 6.8 °C was recorded at the time of a vote in a home on the Fleurieu Peninsula when the outdoor temperature was only 4.8 °C. The analysis showed that there was a prevalence of indoor temperatures normally considered not to be conducive to good health. In each of the three climate zones, measurements in the monitored homes showed significant portions of time when the recorded dry bulb temperature was equal to or below 15 °C—4.7%, 11.4% and 9.7% of the time for living rooms, and 12.5%, 15.0% and 16.2% of the time for bedrooms in the Iron Triangle (Bsk), Adelaide (Csa) and Fleurieu (Csb), respectively. At the time of voting, 73% of all measured air speeds (n = 10,813) were less than 0.2 m/s due to natural convection and 93% were less than 1.0 m/s.
Figure 2 shows indoor operative temperatures plotted with coincident outdoor temperatures. Overall, there was a significant positive correlation between the indoor operative temperature and outdoor temperatures measured at hourly intervals in each location. If occupants had sufficient means to adjust to their environment, for example, by altering clothing or using heating and cooling, then the indoor temperature should have reflected acceptable conditions in terms of thermal sensation and, presumably, their health and wellbeing.
The relationships between the external dry bulb temperature (Tdb) and the internal living room operative temperature (Top) in each climate zone are shown in Figure 2. In each case, the data were also expressed as an exponential sigmoidal function. This form of general association provided a better description of the participants’ actual behaviours, provided more information and, generally, gave a higher correlation coefficient compared with the usual linear description of such relationships. The exponential fit shown in Figure 2 was of the form:
Top = A + B ∗ (1 − exp(−KTdbn))
The constants (A, B, K, n) in this formula varied with location and were derived using the Excel Solver routine that minimized the square of the residuals between the monitored temperature data and the model. The values are shown in Table 3.
The A value in Equation (1) gave the asymptote of the mean minimum temperature of houses during the monitoring period and the value B gave the mean range or span of temperatures experienced in the houses. The sum A + B gave the asymptote of the mean indoor temperatures in the houses at high outdoor temperatures. These values in the three climate zones Bsk, Csa and Csb or zones 4, 5 and 6 were 29.7, 26.8 and 27.7 °C, respectively and for the three climate zones combined, 27.5 °C. Additionally, note that estimates of the average indoor maximum (TopMax) and minimum (TopMin) operative temperatures, as shown in Table 2, could be obtained by the rule of thumb, Equation (2), with the parameter 1.33 derived so that the square of the error was minimized over each climate zone:
TopMax = A + B + 1.33 ∗ SDTop   and   TopMin = A − 1.33 ∗ SDTop
where SDTop was the mean standard deviation of the indoor operative temperatures as shown in Table 2 (note that other exponential growth curves may also have given acceptable fits to the data and, therefore, similar results). Our calculations using the weighted average of A (low) and A + B (high) in Equation (2) showed that, on average, the houses operated in the range from 15.7 °C to 27.5 °C. A comparison of the results obtained in this project with proposed adaptive comfort models was presented elsewhere [46]. For example, the older participants of this study, in general, preferred lower temperatures compared with the ASHRAE 55 Standard neutral temperature, but slightly higher compared to the general population in the temperate regions of Australia. As seen in the telephone survey and focus group discussions, preferred temperatures were influenced by many factors, which included the cost of heating and cooling or health condition. Disaggregating the total cohort, for example, by sex without considering the multitude of other influences was, therefore, problematic. That being stated, females expressed a preference for cooler conditions at lower prevailing external temperatures, while males preferred cooler conditions in hotter weather.
Evidence of personal adaptive behaviours could clearly be seen in Figure 2. The plateauing of indoor temperatures when outdoor temperatures exceeded approximately 28 °C could be explained by the increased use of air conditioning as external temperatures increased. When external temperatures were 28 °C or above at the time of recording responses in Adelaide (Csa or Zone 5), 39% of participants reported using air conditioners, while in the Iron Triangle (Bsk or Zone 4) and Fleurieu (Csb or Zone 6), this figure was 36% and 26%, respectively. When the external temperature rose to 38 °C or above, 63% of all households reported using the air conditioner in the living room. At the lower end, the plateauing of indoor temperatures indicating heater usage was also apparent. When the external temperature fell to 15 °C or below at the time of recording responses in Csa (Zone 5), 38% of participants reported using a heater, while in Bsk and Csb (Zones 4 and 6), this figure was 40% and 27%, respectively. Overall, however, when voting in their living room across the three regions, participants reported to be using heating more frequently (17.8% of the time) than air conditioning (9.1% of the time), as summarised in Table 2. These figures were indicative of the fact that, in each of the climate zones included in this study, within a year, there were significantly more hours when indoor temperatures were below 15 °C than above 28 °C.
Interestingly, participants in the cooler climate zone (Fleurieu, Csb or Zone 6) reported the lowest use of heating. A further analysis showed that there was a much higher percentage of older people in Fleurieu feeling very concerned and extremely concerned about the cost of heating (33%) compared to those expressing such concerns in the other two zones (0% in the Iron Triangle (Bsk or Zone 4) and 12% in the greater metropolitan Adelaide (Csa or Zone 5)). This difference in “concerned about cost of heating” between the three areas was found to be statistically significant (p < 0.05) and may explain the lower use of heating and, therefore, temperatures in houses in Fleurieu. On the other hand, the Iron Triangle area showed the highest portion of time when either heating or cooling was being used. An analysis of questionnaire data showed that no participant from this region was concerned about the cost of heating and cooling, and this may also relate to a higher percentage of participants (or their spouses) in this region with poorer health conditions, requiring them to use the heating or cooling whenever they needed.

3.3.2. Health and Wellbeing

At the initial interview before home monitoring began, almost 70% of the participants perceived their health as being “good” (rating a score between 76 and 100, on a scale from 0 to 100). In the Iron Triangle, 60% of participants scored their health between 0 and 50, compared with 6% in the greater metropolitan Adelaide, and 3% in Fleurieu. This difference between areas was also found to be statistically significant (p < 0.05), although the small sample size in the Iron Triangle should dictate a cautious interpretation of this finding. When voting via the provided tablet, participants were asked to describe their current health and wellbeing. Responses showed that on 61% of occasions, the participants indicated that their health was “very good” or “good”.
Figure 3 summarises 10,813 responses during the monitoring to the question “Do the conditions in this room influence your health and wellbeing?”. Approximately two-thirds of responses reported “definitely yes” or “probably yes”, with a negative influence of temperature on health and wellbeing at room temperatures below about 15 °C and above about 28 °C. This range corresponded approximately to the ‘satisfactory range’ or the range of temperatures at which participants expressed thermal satisfaction, i.e., “very satisfied, “satisfied”, “partially satisfied”, “dissatisfied” and “very dissatisfied” to the question “How satisfied are you with the temperature in this room?”. Overall, respondents were “satisfied” with the temperature in the room on 78% of occasions.
Figure 4 shows responses to the question “How would you describe your health and wellbeing at the moment”, with answers being on a scale of 1–5 (1 = very good, 2 = good, 3 = reasonable, 4 = poor and 5 = very poor). The relationship was significant (R = 0.456, p = 0.001) and the shape of the temperature and health/wellbeing plot indicated that respondents felt their health worsened as temperatures dipped below 15 °C, and particularly when it was higher than 28 °C.
An analysis of the responses showed a strong correlation between the thermal sensation and self-rated health (p = 0.000), with having “very good” health and wellbeing occurring mostly when the thermal environment was perceived to be comfortable. The diseases or symptoms found to affect thermal sensation included asthma and other respiratory illnesses, renal diseases, dehydration, high blood pressure and allergies (p < 0.01), whereas having heart disease did not affect thermal sensation (p > 0.05). There was no evidence that in this cohort of older people, their weight, body fat percentage, muscle mass, bone mass or basal metabolic rate explained thermal sensation (p > 0.05). However, sex and age were statistically significant predictors of thermal sensation (p < 0.01), with the preferred temperature of males overall being slightly higher than that of females, i.e., 24.2 °C and 22.8 °C, respectively, and participants aged above 85 years more often reporting thermal preferences of “wanting to be warmer” or “wanting to be cooler” than those in the youngest age group of 65–69 years. There was a significant difference between the self-rated health and wellbeing of males and females (p < 0.01), with males reporting poorer health/wellbeing states than females.
In summer, there were fewer responses indicating perceptions of good indoor air quality and good self-reported health and wellbeing than in winter. This difference in the perception of air quality and health between the two seasons was found to be statistically significant (p < 0.05 and p < 0.01, respectively). The analysis of thermal sensation votes showed that, despite participants feeling that both the indoor air quality and their health and wellbeing were better during winter months, they felt poorer health in a cool compared to warm environment. Furthermore, those participants reporting poor health or frailty did so more frequently when they felt cold (p < 0.01).
Finally, the thermal satisfaction and perception of wellbeing was significant at the level p < 0.01 with measured indoor absolute humidity (g/kg). As shown in Figure 5, the perception of poorer health/wellbeing increased at both low and high moisture levels. However, while relative humidity (RH) was inversely associated with temperature (data not shown), thermal satisfaction reduced at both very high and very low temperatures (Figure 3), i.e., in dry air with a low moisture content, and humid air with a high moisture content, respectively.

3.3.3. Temperature Humidity Health Index

Based on the analysis of the data shown in Figure 4 and Figure 5 above, we developed an index to express the combined influence of temperature and humidity on perceived health and wellbeing, applicable to the participants of this project. The Temperature Humidity Health Index (THHI), as shown in Equation (3), was based on a multiple regression of health/wellbeing responses, with the monitored data of indoor operative temperature (Top) and humidity (expressed in terms of the wet-bulb temperature (Twb)). The calculation of Top was according to ISO 7726 and, therefore, included the mean radiant temperature and air speed. The relationship between THHI and health responses, binned by Top to form an ordinal variable, was described by a quadratic function that minimized the residuals between the responses and the model. This index showed a significant correlation (R2 = 0.238, p < 0.01) with the health/wellbeing responses.
THHI = 0.45Top + 0.33Twb + 45.2
THHI was expressed in the range from 45 to 75, centred at 60. Between a THHI of 55 and 65, the majority of participants described their health and wellbeing to be very good or good. This correlated with the indoor operative temperature range of approximately 15.1 °C to 27.5 °C as shown in Figure 3, and the average operative temperature range of participants’ houses (i.e., 15.7 °C to 27.5 °C) as calculated from Equation (2). By contrast, at a THHI below 54 or above 67, the self-assessed health and wellbeing would likely be poor to very poor.

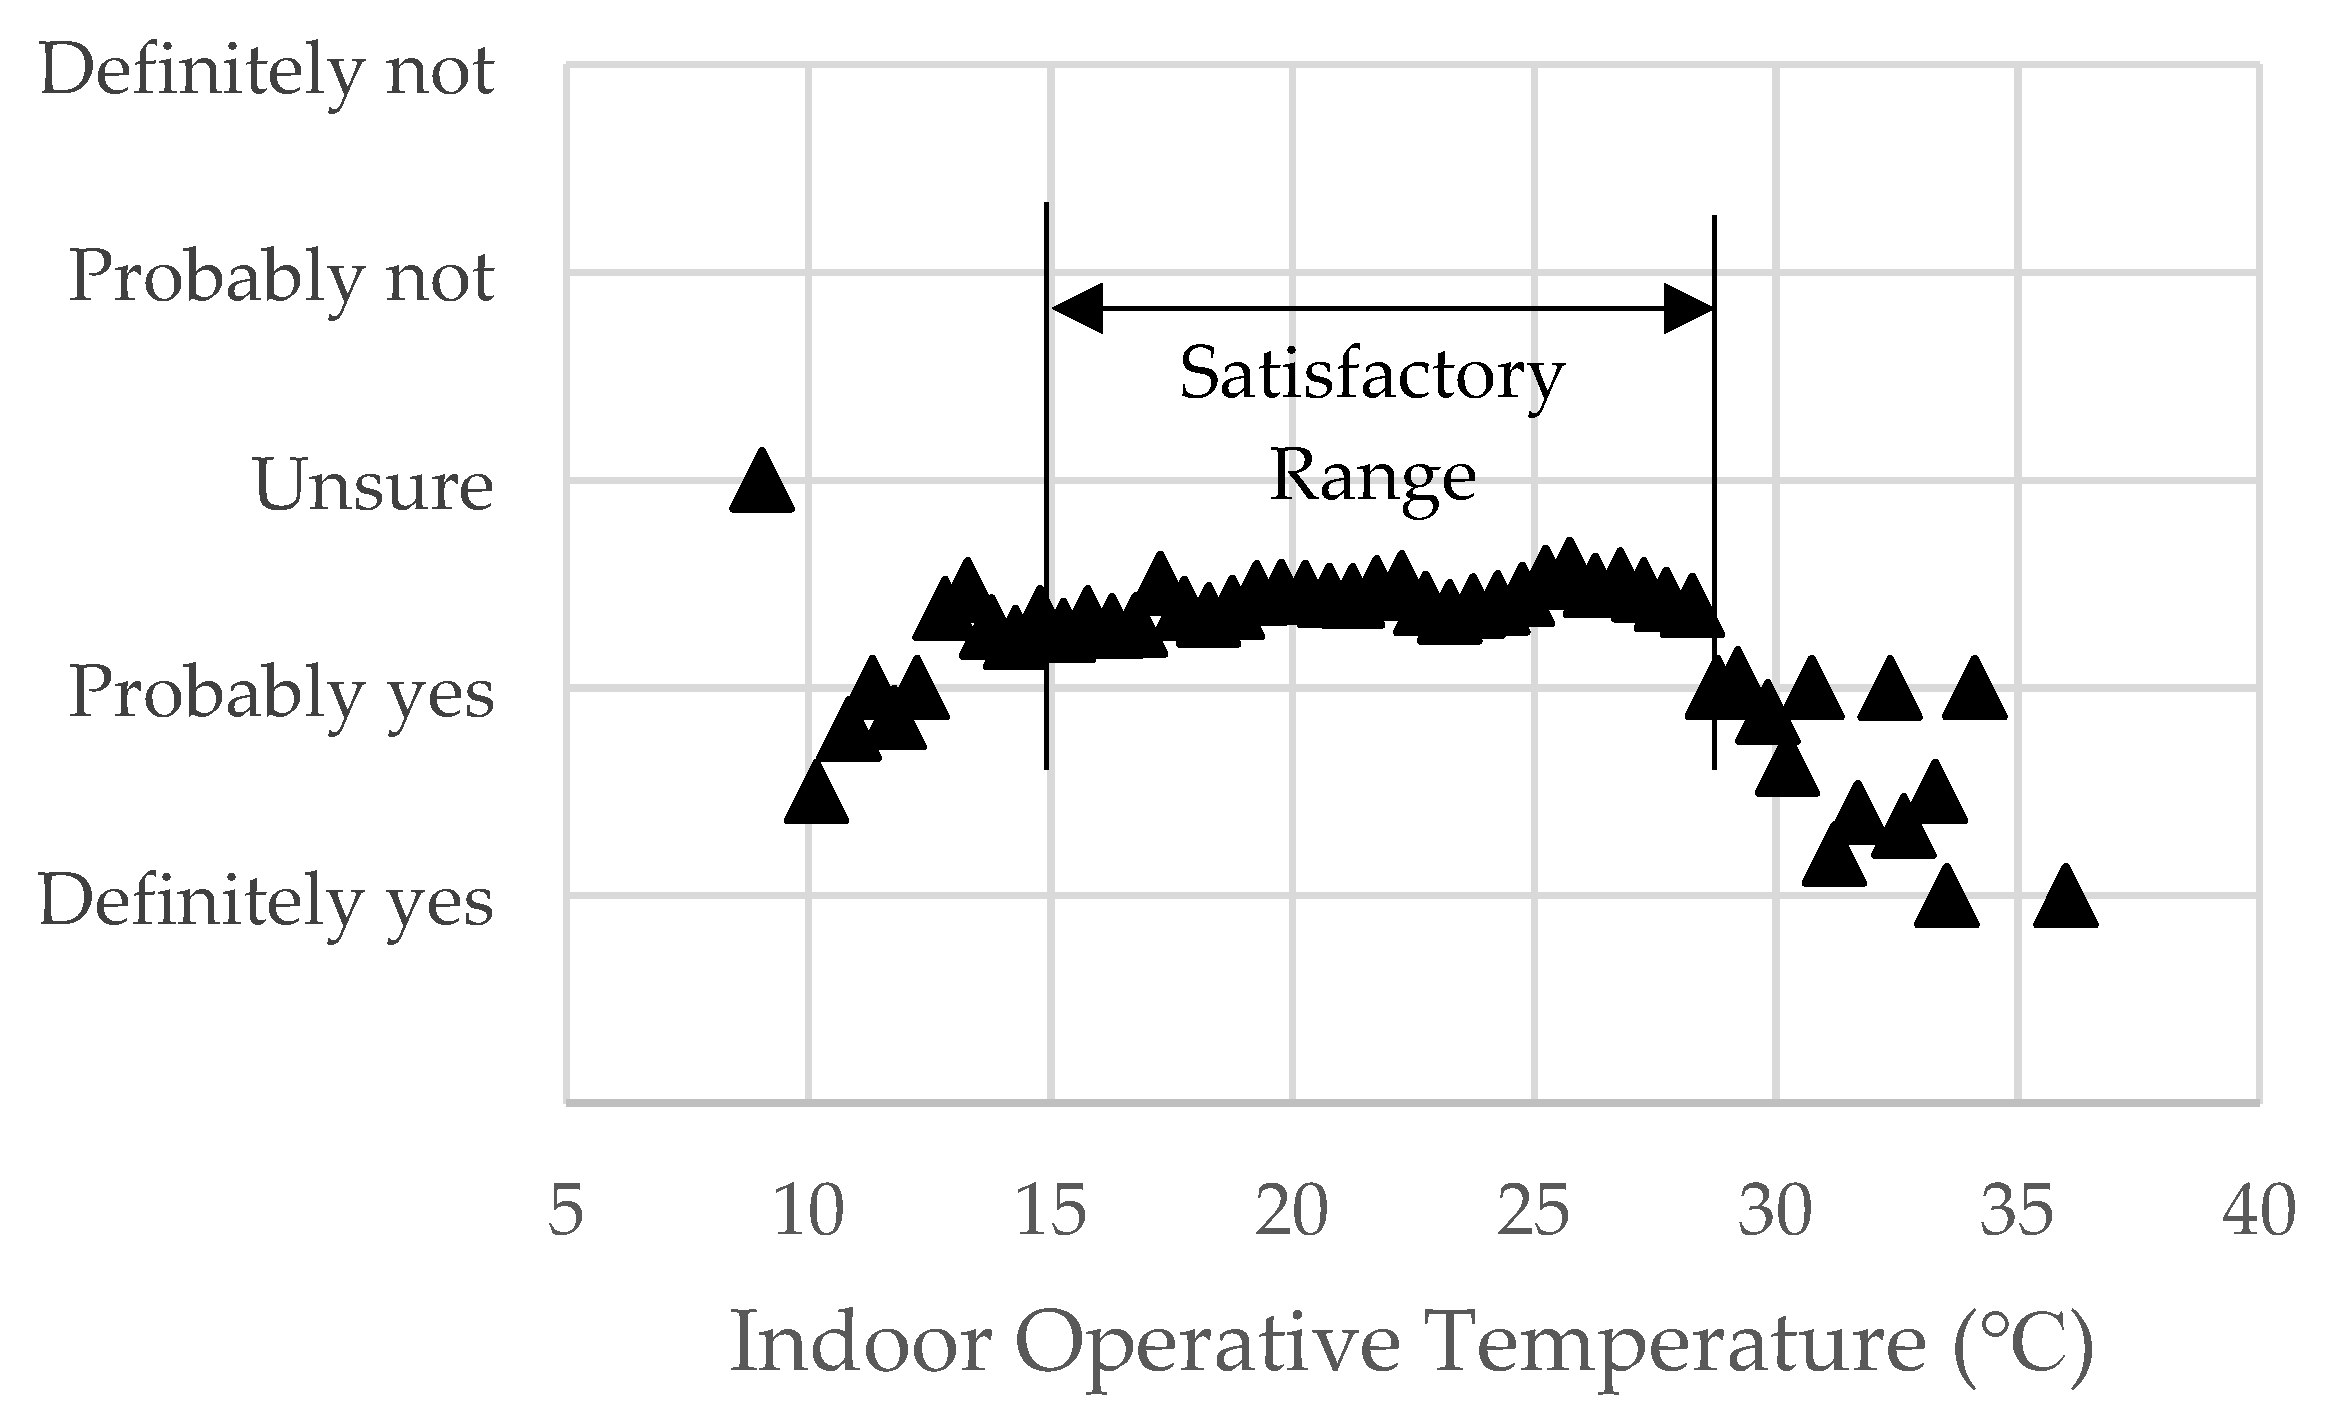
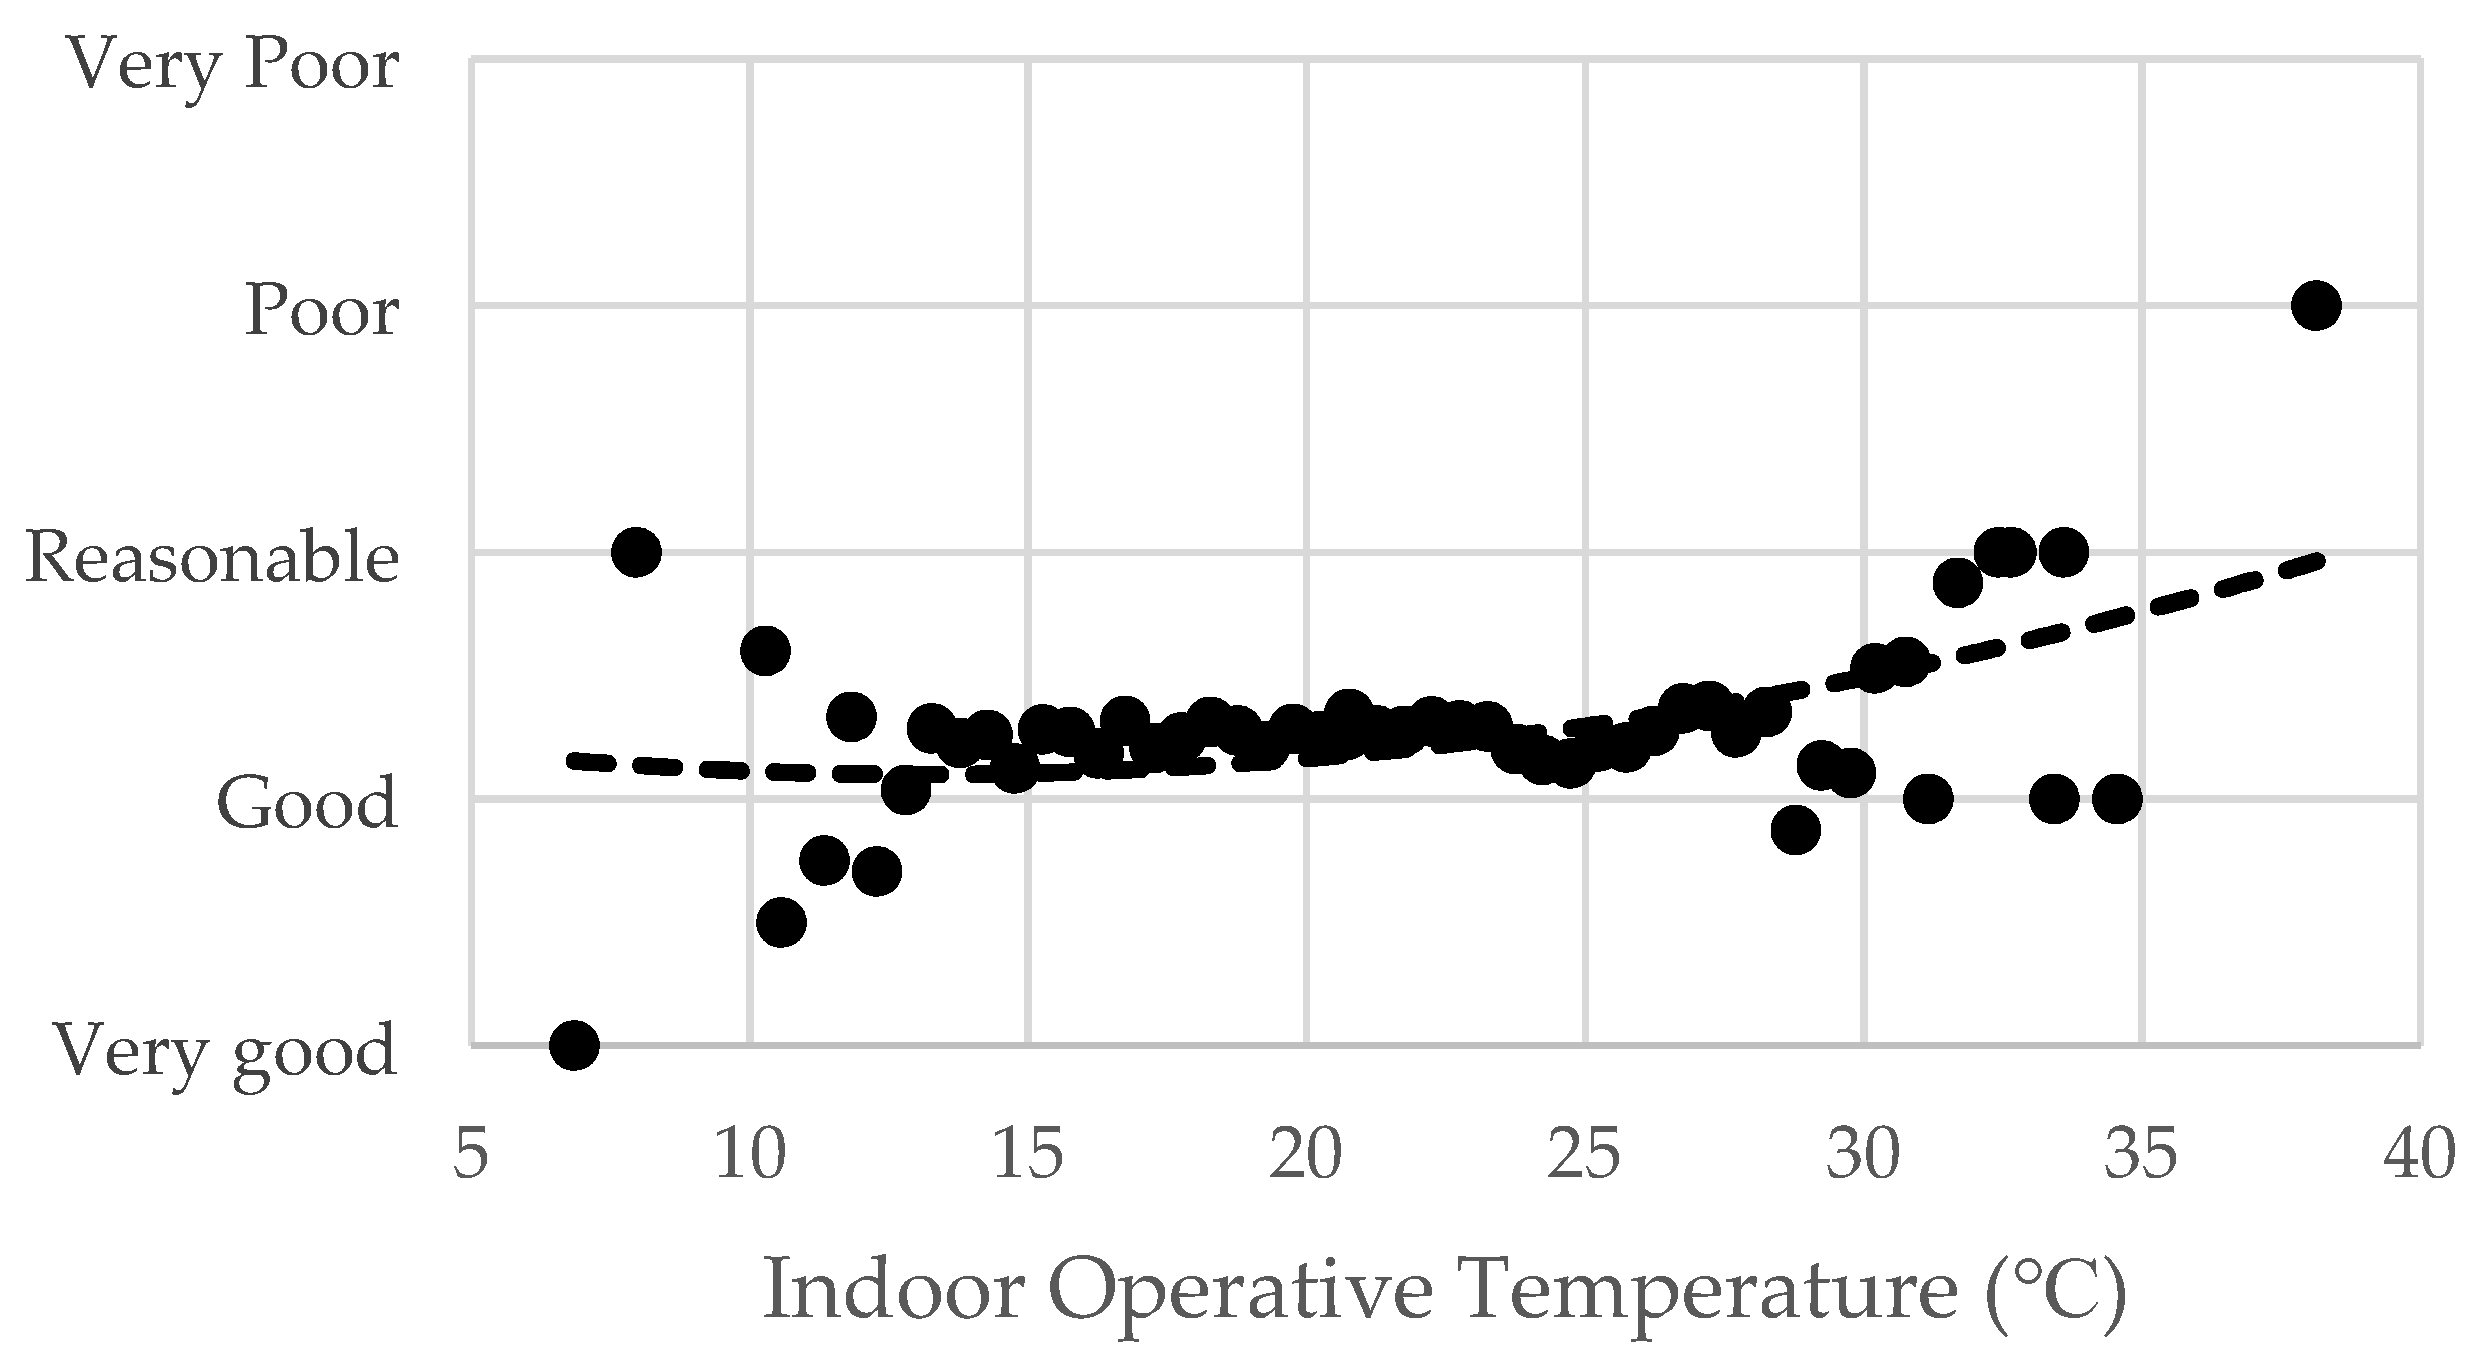
3.3.4. Occupant Behaviours

As seen above, adaptive behaviours were used by the occupants to maintain thermal comfort. One such behaviour was opening and closing windows and doors. Figure 6 shows the responses to the survey question “In this room, are windows and doors: all opened, some opened/closed, all closed?” plotted against the external temperature at the time binned at 0.5K intervals. The data showed that most windows/doors were closed if the external temperature was too cool (below 16.6 °C) or too hot (above 32.8 °C).
Clothing levels were an important alternative to the use of cooling or heating, with participants adjusting their clothing level in response to the internal operative temperature of their house (Figure 7). This was particularly evident during periods of hot weather when the majority indicated wearing “light” clothing, followed by “moderate” and “very light” clothing, whereas during winter, the majority wore “moderate” clothing, with fewer wearing “heavy” clothing. Furthermore, participants’ activity levels reduced as the internal operative temperature of the dwelling increased (Figure 8), a factor also highlighted in the focus groups.

4. Discussion

Sustainability, energy efficiency and healthy ageing communities are growing areas of concern as the world faces a changing climate and an ageing population. These issues have been identified by the United Nations, which has deemed “Sustainable Cities and Communities” to be one of its 17 Sustainable Development Goals [47]. This study helped to address these goals by using a collaborative approach to investigate influences of thermal conditions on the health of older people.

4.1. Thermal Environment, Behaviour and Health

Specifically, in this study, we aimed to investigate if the thermal environment of housing affected the self-reported health and wellbeing of older people in three climate zones of South Australia over a period that included record-high temperatures. The analysis of extracted health-related data from previous stages of the research suggested a non-negligible effect of high and low indoor temperatures on the health of older occupants. Notably, there was a strong correlation between the thermal sensation and self-rated health, with the highest ratings for health and wellbeing occurring in conditions that provided optimal thermal comfort and satisfaction. By contrast, health and wellbeing were perceived to worsen when indoor temperatures were below 15 °C or above 28 °C. Indeed, the non-linear relationships seen between self-reported health and the internal operative temperature (Figure 3 and Figure 4) were somewhat similar to the U- or J- shaped relationships between the ambient temperature and mortality reported in epidemiological studies in populations across the globe [14,48].

4.1.1. Cold Indoor Conditions

Despite Australia being renowned for having a hot climate, our findings showed that, in each of the three climate zones, there was a prevalence of indoor temperatures below those conventionally considered as comfortable. Nevertheless, respondents were satisfied with the temperature in their homes on 78% of occasions, indicating a considerable level of thermal resilience and behavioural adaptation amongst the cohort. The rest of the time, houses were more often cooler than warmer. In particular, there were considerable periods of time when temperatures in rooms (particularly bedrooms) were below 15 °C (and below 10 °C on several occasions). This could be detrimental to health as the WHO Housing and Health Guidelines recommend indoor minimum temperatures of 18 °C for older people during winter [49], but could be higher for the more vulnerable or unacclimatised.
Due to comorbidities, older people are particularly vulnerable to adverse health effects in cold housing [50]. Surprisingly, in South Australia, death rates for hypothermia are comparable to those of Sweden, where, unlike Australia, most deaths occur outdoors [51,52]. Inadequate housing construction, poor or absent home insulation and heating, the absence of weather-stripping and lack of window double glazing have been recognized as contributing factors [53,54].
Knowledge about and the ability to efficiently operate the house and undertake adaptive behaviours in response to changes in temperature are indeed important. We found that respondents used clothing as the main defence mechanism toward temperature changes, which may explain their resilience towards the relatively cold homes. Similarly, a study of thermal comfort requirements and adaptive behaviours of older people in Taiwan also showed that the predominant thermal adaptation strategy in the winter was a clothing adjustment [55]. Concerns over operating costs seemed to have also influenced the decision to use heating more sparingly, particularly among the respondents from Fleurieu, while personal habits of not leaving the heater running all night also resulted in indoor temperatures that were lower than the recommended minimum temperatures.
While studies reporting the explicit health impacts of humidity alone were not common [56], Han et al. [57] reported that, during cold seasons in Hong Kong, a low indoor absolute humidity in the homes of older adults was associated with a higher risk of acute respiratory illnesses. The findings in our study indicated that a higher relative humidity (RH) was associated with lower temperatures, but, counterintuitively, a perception of better health and wellbeing. This finding may be misleading because a changing air temperature can change the relative humidity, even when the absolute humidity remains constant. We, therefore, adopted absolute humidity as a better measure. Figure 4 and Figure 5 taken together indicate the trend of the temperature, humidity and health/wellbeing, showing that there were limits in both measures beyond which respondents felt their health worsened. Our newly developed Temperature Humidity Health Index (THHI) expressed, for this cohort, the combined influence of temperature and humidity on perceived health and wellbeing as discussed below.

4.1.2. Hot Indoor Conditions

Often, those in poor health are most at risk in hot weather, as shown by a previous Australian study, which showed that older people in fair or poor health had twice the odds of reporting health symptoms during heatwaves, compared to those with excellent, very good or good health [5]. Our findings indicated that, in hot weather, the participants appeared to be adept at employing adaptive strategies such as reducing clothing levels and activity. This resonated with our previous work, showing the high uptake of similar adaptive behaviours of older Australians in the heat, partly due to many years of experience with hot summers [5,7]. Air-conditioning was used sparingly by the study participants [46], but was used at high temperatures to cool the indoor environment as indicated in Figure 2.
A recent report suggested that housing could be a contributing factor to adverse health effects in hot weather with residents of Adelaide houses built in the late 20th century (1961–2011) and contemporary housing (2002–2017) having higher risks of mortality during heatwaves [58]. The maximum indoor temperature recorded in our participants’ homes was 38.1 °C. A study by Williams et al. identifying threshold temperatures for heat-related morbidity and mortality in those aged ≥65 years in Adelaide, showed that mortality increased when outdoor maximum and minimum temperatures exceed 30 °C and 16 °C, respectively, whereas for ambulance callouts, the thresholds were 28 °C and 18 °C, respectively [59]. ASHRAE’s Thermal Environmental Conditions for Human Occupancy Standard-55 [41] classifies an indoor summer thermal comfort range as being 23–28 °C, which lies within the (outdoor) temperature thresholds for health as mentioned above. On hot days, temperatures outside of this range could easily be exceeded in poorly insulated and free-running homes, as shown in our study, and at these high indoor operative temperatures, some participants described their health as being poorest (Figure 4).

4.2. Optimal Temperatures for Human Health and Thermal Comfort

While housing should be a modifier of exposure to external climate [26], data from the homes in three regions showed that indoor temperatures fluctuated following the fluctuations of the outdoor temperatures, except when heaters and coolers were used. With most heat-related [26] and cold-related [51] fatalities occurring indoors, it is, therefore, important that, for human health, indoor operative temperatures be kept within an ‘optimal’ range and extremes avoided.
Thermal comfort can come at a cost which can be a barrier for occupants. There was triangulation in our findings from the different stages of the research, in that the majority of participants were concerned about utility costs involved in operating air conditioners and heaters. This point was recognized in our previous work [21] and could be a definitive influencing factor for using passive means of attaining thermal comfort as an alternative to technological solutions. However, these passive adaptive behaviours may become more difficult as occupants age and can have limitations in poorly insulated and poorly shaded homes.
While our findings may indicate that conditions providing optimal thermal satisfaction are also the healthiest for older South Australians, caution is advised in making this assumption. Illnesses can occur at any temperature, and extreme thermal environments do not always adversely affect human health, although the risks may be greater. As shown in Figure 4, some participants in our study described having good or even very good health below 15 °C and above 28 °C indoor temperatures that may be hazardous to some. Notwithstanding, it is known that older people have a lowered tolerance of temperature extremes for physiological reasons [3], and a decreased thermal perception and warm and cold sensitivities [60], meaning they can unknowingly be at risk in temperatures they perceive to be comfortable. Therefore, for public health purposes, authorities should aim to determine indoor thermal comfort ranges, supported by epidemiological evidence, which protect occupants from the harmful health effects of indoor cold or heat (as indicated by the WHO Housing and Health guidelines) [49].
The calculation of the THHI shown in Equation (3) could be employed to further determine appropriate limits. A health/wellbeing perception of “good to very good” occurred within the temperature range of 15.1 to 27.5 °C with a relative humidity of 55%. This temperature range corresponded almost exactly to the mean temperature conditions recorded in the houses as shown in Figure 2, 15.8 to 27.5 °C. At the same relative humidity value, a health/wellbeing perception of “very good” would be achieved with a narrower temperature range of 18.4 to 24.3 °C. The analysis of the measured temperature data showed that this optimal range was exceeded on average in houses at least 40% of the time in each climate zone, suggesting that improving the overall thermal performance of houses would have perceived, if not actual, heath/wellbeing benefits.

4.3. The Way Forward

The synthesis of our qualitative and quantitative evidence provides a justification for recommendations that support healthy thermal environments for the ageing population, whilst recognising that these should be cognisant of individual needs, preferences, financial constraints and acclimatization to the local climate. However, as noted by the WHO, there is “no typical older person”, with some in their 80s having an excellent physical fitness and mental capability, and others that are care-dependent [61]. Indeed, in our broader research, we found a considerable diversity in circumstances and abilities among the study participants [6], with thermal preferences and ‘personalities’ varying according to sex, age, health status and financial concerns [28].
Buildings that involve a clever design combined with smart technology to sense and regulate temperature fluctuations may become the norm for new homes in the future. At present, however, in Australia, older people tend to have older homes, for which retrofitting may not be practical. Relatedly, it is evident from the telephone survey and the home monitoring study that many of the participants live in dwellings that lack wall insulation and shading and appear to (reluctantly) rely on the use of heaters and coolers to achieve comfortable conditions. However, temperatures outside the comfort range may exacerbate pre-existing conditions such as asthma, bronchitis, pneumonia and heart conditions [29].
The combined findings from our mixed-methods research inform customised recommendations and guidelines aimed to achieve both thermal comfort and healthy environments in the homes of older people [45]. These guidelines provide targeted information specific to temperature preferences and location-specific suggestions for house design and retrofitting, such as the need to increase external shading to improve summer comfort or increase air tightness to improve winter comfort [62].

4.4. Strengths and Limitations

This study had a number of strengths and helped to fill the gaps in knowledge about the effects of indoor thermal environments on the health of a particularly vulnerable population. Firstly, this novel multidisciplinary study used innovative methods to investigate the link between thermal comfort and self-reported health and wellbeing of older people in three climate zones. Dissimilar to most temperature–health epidemiological studies, the house monitoring study lacked misclassification bias, as accurate data on personal temperature exposure was ascertained in real-time as respondents reported their health and wellbeing on fit-for-purpose equipment. Additionally, a broad range of temperatures was reported during the study period. In fact, the 2018–2019 summer in South Australia was the warmest on record in terms of the mean maximum temperature (3.09 °C warmer than average) with January 2019 being the state’s hottest month on record [63]. Whereas many studies fail to incorporate the effect of humidity on health, we developed a unique Temperature Humidity Health Index (THHI) that expresses the combined influence of the indoors operative temperature and humidity on perceived health and wellbeing for these participants. We described the method for developing the index but cautioned that it was derived from the data for this cohort of older people only. The development of any generalised index for other age groups and climate zones requires broader scale research involving micro-environmental and health data. Finally, while our study addressed local issues of housing and health, the findings suggested that they may be generalizable to many urban and regional areas in similar temperate or semi-arid climates around the world, particularly if there are also similarities in housing stock for older people.
The limitations of the study are also acknowledged. Although there were over 300 participants, the number involved in each study was not large, and broader research in more climate zones is warranted. Furthermore, given the nature of the study, only self-reported health effects were used, which lacked the accuracy of records from healthcare providers. While this study did not have sufficient data to meaningfully distinguish health and wellbeing outcomes between urban and rural areas, others [64] have shown that in South Australia there was no significant difference in the physical health of urban and rural respondents, although mental health was better among those in rural areas. Overall, the cohort of participants in this study mostly enjoyed good health and good mobility, with up to 75% of the telephone survey respondents and 70% of the home monitoring participants considering themselves to be quite healthy. While this was representative of older Australians in general [29,65], the study lacked participants who were particularly at-risk, including older people with chronic diseases such as dementia [6,66,67,68]. Other authors have noted the paucity of research on links between thermal comfort and health overall, and notably in older people, those living with chronic health conditions and people of a low socioeconomic status [26]. As potentially 20–30% of the study participants could be at increased risk of temperature-related illnesses due to poorer physical or mental health, impaired mobility, low income or living in older, poorly insulated houses [7,69], this highlights significant gaps in knowledge and opportunities for future research.
The indoor air quality and chemical pollutants such as carbon monoxide, ozone, radon, volatile organic compounds and particulate matter can have a significant impact on health and wellbeing [70], but were not taken into account or controlled for in our analysis. This important area of environmental health warrants further research to investigate the health and wellbeing impacts of indoor air quality on older people in Australia.
Additionally, our study participants were English-speaking only. According to a recent report of factors affecting the risk of mortality during heatwaves in Adelaide, higher relative risks were found in individuals with a limited English-speaking proficiency and areas with less vegetation and a greater proportion of renters [58]. Therefore, more collaborative architecture–public health research in this area needs to be undertaken, involving a greater diversity (in terms of health, ethnicity, socioeconomic status and housing tenure) in study populations of older people.

5. Conclusions

Despite limitations as discussed above, our study indicated that the thermal environment of housing may have implications for the health and wellbeing of older people in South Australia. Participants generally coped well with thermal changes with no major effects on their health and wellbeing; however, they believed that ailments were affected by temperature variations. Self-reported health and wellbeing were good when internal operative temperatures were perceived to be satisfactory and reportedly declined when temperatures were too warm or too cold. Participants mostly used adaptive strategies to cope with thermal variation, using cooling and heating sparingly due to financial concerns. As a consequence, some of the monitored houses recorded temperatures outside of the recommended range for optimal health. Using a range of methods, we demonstrated that, despite providing thermal satisfaction, internal operative temperatures were colder (and sometimes warmer) than guidelines recommend and, therefore, may have the potential to adversely affect the health of older occupants.
Building designers need to be mindful that environmental conditions and housing are part of the key determinants of health [1]. As such, the effects of housing on comfort and health should be taken into consideration when designing homes for vulnerable populations. Older people can have several risk factors for temperature-related adverse health effects, including chronic health conditions, poor mobility and a low income. Prevention is key and, as such, a collaborative approach is needed for a thermally efficient and healthy housing design, particularly as climate change ensues.

Author Contributions

Conceptualization, V.S., D.P., A.H., T.W., J.v.H. and H.B.; methodology, V.S., A.H., T.W., H.B. and L.A.M.; analysis, T.W., A.H., V.S., H.B. and L.A.M.; investigation, V.S., D.P., A.H., T.W., J.Z., R.V., J.v.H., H.B. and L.A.M.; resources, V.S. and T.W.; data curation, A.H. and T.W.; writing—original draft preparation, A.H.; writing—review and editing, A.H., T.W., V.S., H.B., L.A.M., J.v.H., R.V. and J.Z.; visualization, L.A.M. and T.W.; supervision, V.S., T.W. and D.P.; project administration, V.S. and H.B.; funding acquisition, V.S. All authors have read and agreed to the published version of the manuscript.

Funding

The project “Improving the thermal environment of housing for older Australians” was funded by the Australian Research Council through the ARC Discovery Project grant scheme (DP180102019 to V.S.).

Institutional Review Board Statement

Ethics approval for the study was obtained from the Human Research Ethics Committee of The University of Adelaide with approval number H-2018-042.

Informed Consent Statement

Informed consent was obtained from all subjects involved in the study.

Acknowledgments

The authors wish to thank the people who generously participated in the project by completing surveys, participating in focus groups, and agreeing to the monitoring and surveys in their homes.

Conflicts of Interest

The authors declare no conflict of interest. The funders had no role in the design of the study; in the collection, analyses, or interpretation of data; in the writing of the manuscript or in the decision to publish the results.

References

  1. Dahlgren, G.; Whitehead, M. Policies and Strategies to Promote Social Equity in Health; Institute for Future Studies: Stockholm, Sweden, 1991. [Google Scholar]
  2. Howden-Chapman, P. Housing standards: A glossary of housing and health. J. Epidemiol. Community Health 2004, 3, 162–168. [Google Scholar] [CrossRef] [PubMed] [Green Version]
  3. Kenney, W.L.; Munce, T.A. Invited review: Aging and human temperature regulation. J. Appl. Physiol. 2003, 95, 2598–2603. [Google Scholar] [CrossRef] [PubMed]
  4. Schwartz, J. Who is sensitive to extremes of temperature? A case-only analysis. Epidemiology 2005, 16, 67–72. [Google Scholar] [CrossRef] [PubMed]
  5. Hansen, A.; Bi, P.; Pisaniello, D.; Nitschke, M.; Tucker, G.; Newbury, J.; Kitson, A.; Dal Grande, E.; Avery, J.; Zhang, Y.; et al. Heat-health behaviours of older people in two Australian states. Australas J. Ageing 2015, 34, E19–E25. [Google Scholar] [CrossRef] [PubMed]
  6. van Hoof, J.; Bennetts, H.; Hansen, A.; Kazak, J.K.; Soebarto, V. The living environment and thermal behaviours of older South Australians: A multi-focus group study. Int. J. Environ. Res. Public Health 2019, 16, 935. [Google Scholar] [CrossRef] [PubMed] [Green Version]
  7. Nitschke, M.; Hansen, A.; Bi, P.; Pisaniello, D.; Newbury, J.; Kitson, A.; Tucker, G.; Avery, J.; Dal Grande, E. Risk factors, health effects and behaviour in older people during extreme heat: A survey in South Australia. Int. J. Environ. Res. Public Health 2013, 10, 6721–6733. [Google Scholar] [CrossRef] [Green Version]
  8. Gasparrini, A.; Guo, Y.; Hashizume, M.; Lavigne, E.; Zanobetti, A.; Schwartz, J.; Tobias, A.; Tong, S.; Rocklov, J.; Forsberg, B.; et al. Mortality risk attributable to high and low ambient temperature: A multicountry observational study. Lancet 2015, 386, 369–375. [Google Scholar] [CrossRef]
  9. Bennett, C.M.; Dear, K.B.; McMichael, A.J. Shifts in the seasonal distribution of deaths in Australia, 1968–2007. Int. J. Biometeorol. 2014, 58, 835–842. [Google Scholar] [CrossRef]
  10. Barnett, A.G.; Dobson, A.J.; McElduff, P.; Salomaa, V.; Kuulasmaa, K.; Sans, S. Cold periods and coronary events: An analysis of populations worldwide. J. Epidemiol. Community Health 2005, 59, 551–557. [Google Scholar] [CrossRef] [Green Version]
  11. Hajat, S.; Kovats, R.S.; Lachowycz, K. Heat-related and cold-related deaths in England and Wales: Who is at risk? Occup. Environ. Med. 2007, 64, 93–100. [Google Scholar] [CrossRef] [Green Version]
  12. Costello, A.; Abbas, M.; Allen, A.; Ball, S.; Bell, S.; Bellamy, R.; Friel, S.; Groce, N.; Johnson, A.; Kett, M.; et al. Managing the health effects of climate change: Lancet and University College London Institute for Global Health Commission. Lancet 2009, 373, 1693–1733. [Google Scholar] [CrossRef]
  13. Astrom, D.O.; Forsberg, B.; Rocklov, J. Heat wave impact on morbidity and mortality in the elderly population: A review of recent studies. Maturitas 2011, 69, 99–105. [Google Scholar] [CrossRef] [PubMed]
  14. McMichael, A.J.; Wilkinson, P.; Kovats, R.S.; Pattenden, S.; Hajat, S.; Armstrong, B.; Vajanapoom, N.; Niciu, E.M.; Mahomed, H.; Kingkeow, C.; et al. International study of temperature, heat and urban mortality: The ’ISOTHURM’ project. Int. J. Epidemiol. 2008, 37, 1121–1131. [Google Scholar] [CrossRef] [Green Version]
  15. Bi, P.; Williams, S.; Loughnan, M.; Lloyd, G.; Hansen, A.; Kjellstrom, T.; Dear, K.; Saniotis, A. The effects of extreme heat on human mortality and morbidity in Australia: Implications for Public Health. Asia Pac. J. Public Health 2011, 23, 27S–36S. [Google Scholar]
  16. Diaz, J.; Garcia, R.; Lopez, C.; Linares, C.; Tobias, A.; Prieto, L. Mortality impact of extreme winter temperatures. Int. J. Biometeorol. 2005, 49, 179–183. [Google Scholar] [CrossRef]
  17. Medina-Ramon, M.; Schwartz, J. Temperature, temperature extremes, and mortality: A study of acclimatization and effect modification in 50 United States Cities. Occup. Environ. Med. 2007, 64, 827–833. [Google Scholar] [CrossRef] [Green Version]
  18. Basu, R.; Samet, J.M. Relation between elevated ambient temperature and mortality: A review of the epidemiologic evidence. Epidemiol. Rev. 2002, 24, 190–202. [Google Scholar] [CrossRef] [PubMed]
  19. de Vries, R.; Blane, D. Fuel poverty and the health of older people: The role of local climate. J. Public Health 2013, 35, 361–366. [Google Scholar] [CrossRef] [PubMed] [Green Version]
  20. Howden-Chapman, P.; Viggers, H.; Chapman, R.; O’Sullivan, K.; Barnard, L.T.; Lloyd, B. Tackling cold housing and fuel poverty in New Zealand: A review of policies, research, and health impacts. Energy Policy 2012, 49, 134–142. [Google Scholar] [CrossRef]
  21. Hansen, A.; Bi, P.; Nitschke, M.; Pisaniello, D.; Newbury, J.; Kitson, A. Perceptions of heat-susceptibility in older persons: Barriers to adaptation. Int. J. Environ. Res. Public Health 2011, 8, 4714–4728. [Google Scholar] [CrossRef] [PubMed]
  22. Nitschke, M.; Krackowizer, A.; Hansen, A.L.; Bi, P.; Tucker, G.R. Heat health messages: A randomized controlled trial of a preventative messages tool in the older population of South Australia. Int. J. Environ. Res. Public Health 2017, 14, 992. [Google Scholar] [CrossRef] [Green Version]
  23. van Loenhout, J.A.; le Grand, A.; Duijm, F.; Greven, F.; Vink, N.M.; Hoek, G.; Zuurbier, M. The effect of high indoor temperatures on self-perceived health of elderly persons. Environ. Res. 2016, 146, 27–34. [Google Scholar] [CrossRef]
  24. Loughnan, M.; Carroll, M.; Tapper, N.J. The relationship between housing and heat wave resilience in older people. Int. J. Biometeorol. 2015, 59, 1291–1298. [Google Scholar] [CrossRef]
  25. Naughton, M.P.; Henderson, A.; Mirabelli, M.C.; Kaiser, R.; Wilhelm, J.L.; Kieszak, S.M.; Rubin, C.H.; McGeehin, M.A. Heat-related mortality during a 1999 heat wave in Chicago. Am. J. Prev. Med. 2002, 22, 221–227. [Google Scholar] [CrossRef]
  26. Kenny, G.P.; Flouris, A.D.; Yagouti, A.; Notley, S.R. Towards establishing evidence-based guidelines on maximum indoor temperatures during hot weather in temperate continental climates. Temperature 2019, 6, 11–36. [Google Scholar] [CrossRef] [PubMed]
  27. van Hoof, J.; Schellen, L.; Soebarto, V.; Wong, J.K.W.; Kazak, J.K. Ten questions concerning thermal comfort and ageing. Build. Environ. 2017, 120, 123–133. [Google Scholar] [CrossRef]
  28. Bennetts, H.; Martins, L.A.; van Hoof, J.; Soebarto, V. Thermal personalities of older people in South Australia: A personas-based approach to develop thermal comfort guidelines. Int. J. Environ. Res. Public Health 2020, 17, 8402. [Google Scholar] [CrossRef]
  29. Soebarto, V.; Bennetts, H.; Hansen, A.; Zuo, J.; Williamson, T.; Pisaniello, D.; van Hoof, J.; Visvanathan, R. Living environment, heating-cooling behaviours and well-being: Survey of older South Australians. Build. Environ. 2019, 157, 215–226. [Google Scholar] [CrossRef]
  30. Australian Bureau of Statistics National. State and Territory Population. Available online: https://www.abs.gov.au/statistics/people/population/national-state-and-territory-population/jun-2020 (accessed on 24 March 2021).
  31. Stern, H.; de Hoedt, G.; Ernst, J. Objective classification of Australian climates. Aust. Meteorol. Mag. 2000, 49, 87–96. [Google Scholar]
  32. Australian Building Codes Board Climate Zone Map Australia. Available online: https://www.abcb.gov.au/resource/map/climate-zone-map-australia (accessed on 27 October 2021).
  33. EuroQol Research Foundation. EQ-5D-5L User Guide. 2019. Available online: https://euroqol.org/publications/user-guides (accessed on 5 May 2021).
  34. IBM Corp IBM SPSS Statistics for Windows, Version 25.0. Available online: https://www.ibm.com/products/spss-statistics (accessed on 27 October 2021).
  35. Braun, V.; Clarke, V. Using thematic analysis in psychology. Qual. Res. Psych. 2006, 3, 77–101. [Google Scholar] [CrossRef] [Green Version]
  36. Soebarto, V.; Williamson, T.; Bennetts, H.; Arakawa Martins, L.; Pisaniello, D.; Hansen, A.; Visvanathan, R.; Carre, A. Development of an integrated data acquisition system for thermal comfort. In Proceedings of the Windsor 2020 Resilient Comfort Conference, Windsor, UK, 16–19 April 2020; Roaf, S., Nicol, F., Finlayson, W., Eds.; Silesian University of Technology: Gliwice, Poland, 2020; pp. 155–170. [Google Scholar]
  37. Tanita Corporation Innerscan Dual RD-953 Instruction Manual. Available online: https://tanita.eu/media/wysiwyg/manuals/home-use-body-composition-monitors/rd-953-instruction-manual-en.pdf (accessed on 27 October 2021).
  38. Völgyi, E.; Tylavsky, F.A.; Lyytikäinen, A.; Suominen, H.; Alén, M.; Cheng, S. Assessing body composition with DXA and bioimpedance: Effects of obesity, physical activity, and age. Obesity 2008, 16, 700–705. [Google Scholar] [CrossRef] [PubMed]
  39. Arakawa Martins, L.; Williamson, T.; Bennetts, H.; Zuo, J.; Visvanathan, R.; Hansen, A.; Pisaniello, D.; van Hoof, J.; Soebarto, V. Individualising thermal comfort models for older people: The effects of personal characteristics on comfort and wellbeing. In Proceedings of the Windsor 2020 Resilient Comfort Conference, Windsor, UK, 16–19 April 2020; Roaf, S., Nicol, F., Finlayson, W., Eds.; Silesian University of Technology: Gliwice, Poland, 2020; pp. 187–199. [Google Scholar]
  40. Soebarto, V.; Williamson, T.; Carre, A.; Arakawa Martins, L. Understanding indoor environmental conditions and occupant’s responses in houses of older people. IOP Conf. Ser. Mater. Sci. Eng. 2019, 609, 042096. [Google Scholar] [CrossRef] [Green Version]
  41. De Dear, R. Ping-pong globe thermometers for mean radiant temperatures. H V Eng. 1988, 60, 10–11. [Google Scholar]
  42. d’Ambrosio Alfano, F.R.; Dell’isola, M.; Ficco, G.; Palella, B.I.; Riccio, G. On the measurement of the mean radiant temperature by means of globes: An experimental investigation under black enclosure conditions. Build. Environ. 2021, 193, 107655. [Google Scholar] [CrossRef]
  43. ASHRAE. Thermal Environmental Conditions for Human Occupancy; American Society of Heating, Refrigerating and Air Conditioning Engineers, Inc.: Atlanta, GA, USA, 2020. [Google Scholar]
  44. Adlin, T.; Pruitt, J. The Essential Persona Lifecycle Your Guide to Building and Using Personas, 1st ed.; Morgan Kaufmann: Burlington, MA, USA, 2010. [Google Scholar]
  45. Arakawa Martins, L.; Soebarto, V.; Williamson, T.; Pisaniello, D.; Bennetts, H. The use of building performance simulation and personas for the development of thermal comfort guidelines for older people in South Australia. J. Build. Perform. Simul. 2021; in press. [Google Scholar] [CrossRef]
  46. Williamson, T.; Soebarto, V.; Bennetts, H.; Arakawa Martins, L.; Pisaniello, D. Thermal comfort, well-being and health of older residents in South Australia. In Proceedings of the Windsor 2020 Resilient Comfort Conference, Windsor, UK, 16–19 April 2020; Roaf, S., Nicol, F., Finlayson, W., Eds.; Silesian University of Technology: Gliwice, Poland, 2020; pp. 171–186. [Google Scholar]
  47. United Nations Department of Economic and Social Affairs Sustainable Development. Available online: https://sdgs.un.org/goals (accessed on 24 March 2021).
  48. Curriero, F.C.; Heiner, K.S.; Samet, J.M.; Zeger, S.L.; Strug, L.; Patz, J.A. Temperature and mortality in 11 cities of the eastern United States. Am. J. Epidemiol. 2002, 155, 80–87. [Google Scholar] [CrossRef]
  49. World Health Organization. WHO Housing and Health Guidelines; World Health Organization: Geneva, Switzerland, 2018. [Google Scholar]
  50. Fyfe, C.; Telfar, L.; Barnard; Howden-Chapman, P.; Douwes, J. Association between home insulation and hospital admission rates: Retrospective cohort study using linked data from a national intervention programme. BMJ 2020, 371, m4571. [Google Scholar] [CrossRef]
  51. Bright, F.M.; Winskog, C.; Walker, M.; Byard, R.W. A comparison of hypothermic deaths in South Australia and Sweden. J. Forensic. Sci. 2014, 59, 983–985. [Google Scholar] [CrossRef]
  52. Hansen, A.; Soebarto, V. The epidemiology of health and mortality at extremes. In Proceedings of the 1st International Conference on Comfort at the Extremes: Energy, Economy and Climate, Dubai, United Arab Emirates, 10–11 April 2019; Roaf, S., Finlayson, W., Eds.; Ecohouse Initiave Ltd.: Dubai, United Arab Emirates, 2019; pp. 10–22. [Google Scholar]
  53. Byard, R.W.; Bright, F.M. Lethal hypothermia—A sometimes elusive diagnosis. Forensic Sci. Med. Pathol. 2018, 14, 421–423. [Google Scholar] [CrossRef] [Green Version]
  54. Bright, F.; Gilbert, J.D.; Winskog, C.; Byard, R.W. Additional risk factors for lethal hypothermia. J. Forensic Leg. Med. 2013, 20, 595–597. [Google Scholar] [CrossRef] [PubMed]
  55. Hwang, R.L.; Chen, C.P. Field study on behaviors and adaptation of elderly people and their thermal comfort requirements in residential environments. Indoor Air 2010, 20, 235–245. [Google Scholar] [CrossRef]
  56. Davis, R.E.; McGregor, G.R.; Enfield, K.B. Humidity: A review and primer on atmospheric moisture and human health. Environ. Res. 2016, 144, 106–116. [Google Scholar] [CrossRef] [Green Version]
  57. Han, L.; Ran, J.; Chan, K.H.; Mak, Y.W.; Suen, L.; Cowling, B.J.; Yang, L. Indoor environmental factors and acute respiratory illness in a prospective cohort of community-dwelling older adults. J. Infect. Dis. 2020, 222, 967–978. [Google Scholar] [CrossRef]
  58. Varghese, B.M.; Beaty, B.; Bi, P.; Nairn, J. Heatwave-Health Vulnerability in Adelaide: Analysis of Mortality and Morbidity Outcomes. Available online: https://ehp.niehs.nih.gov/doi/abs/10.1289/isee.2020.virtual.P-0399 (accessed on 27 October 2021).
  59. Williams, S.; Nitschke, M.; Sullivan, T.; Tucker, G.R.; Weinstein, P.; Pisaniello, D.L.; Parton, K.A.; Bi, P. Heat and health in Adelaide, South Australia: Assessment of heat thresholds and temperature relationships. Sci. Total Environ. 2012, 414, 126–133. [Google Scholar] [CrossRef] [PubMed]
  60. Guergova, S.; Dufour, A. Thermal sensitivity in the elderly: A review. Ageing Res. Rev. 2011, 10, 80–92. [Google Scholar] [CrossRef] [PubMed]
  61. World Health Organization UN Decade of Healthy Ageing. Available online: https://www.who.int/initiatives/decade-of-healthy-ageing (accessed on 24 March 2021).
  62. Soebarto, V.; Bennetts, H.; Arakawa Martins, L.; van Hoof, J.; Visvanathan, R.; Hansen, A.; Pisaniello, D.; Williamson, T.; Zuo, J. Thermal Comfort at Home: A Guide for Older South Australians; The University of Adelaide: Adelaide, Australia, 2021; ISBN 978-0-646-85165-5. [Google Scholar] [CrossRef]
  63. Australian Government Bureau of Meteorology South Australia in Summer 2018–2019: Record Warm Days and Drier than Average. Available online: http://www.bom.gov.au/climate/current/season/sa/archive/201902.summary.shtml (accessed on 24 March 2021).
  64. Ziersch, A.M.; Baum, F.; Ngurah Darmawan, I.G.; Kavanagh, A.M.; Bentley, R.J. Social capital and health in rural and urban communities in South Australia. ANZ J. Public Health. 2009, 33, 7–16. [Google Scholar] [CrossRef] [PubMed]
  65. Australian Bureau of Statistics National Health Survey: First Results 2014–2015. Available online: https://www.abs.gov.au/AUSSTATS/[email protected]/DetailsPage/4364.0.55.0012014-15?OpenDocument (accessed on 27 October 2021).
  66. Hansen, A.; Bi, P.; Nitschke, M.; Ryan, P.; Pisaniello, D.; Tucker, G. The effect of heat waves on mental health in a temperate Australian city. Environ. Health Perspect. 2008, 116, 1369–1375. [Google Scholar] [CrossRef] [Green Version]
  67. Zhang, Y.; Nitschke, M.; Krackowizer, A.; Dear, K.; Pisaniello, D.; Weinstein, P.; Tucker, G.; Shakib, S.; Bi, P. Risk factors of direct heat-related hospital admissions during the 2009 heatwave in Adelaide, Australia: A matched case-control study. BMJ Open 2016, 6, e010666. [Google Scholar] [CrossRef] [Green Version]
  68. van Hoof, J.; Kort, H.S.M.; Hensen, J.L.M.; Duijnstee, M.S.H.; Rutten, P.G.S. Thermal comfort and the integrated design of homes for older people with dementia. Build. Environ. 2010, 45, 358–370. [Google Scholar] [CrossRef] [Green Version]
  69. Vandentorren, S.; Bretin, P.; Zeghnoun, A.; Mandereau-Bruno, L.; Croisier, A.; Cochet, C.; Riberon, J.; Siberan, I.; Declercq, B.; Ledrans, M. August 2003 heat wave in France: Risk factors for death of elderly people living at home. Eur. J. Public Health 2006, 16, 583–591. [Google Scholar] [CrossRef] [Green Version]
  70. Cincinelli, A.; Martellini, T. Indoor air quality and health. Int. J. Environ. Res. Public Health 2017, 14, 1286. [Google Scholar] [CrossRef] [PubMed] [Green Version]
Figure 1. Stages of the study on “Improving thermal environment of housing for older Australians”.
Atmosphere 13 00096 g001
Figure 2. External dry bulb temperature and corresponding internal operative living room temperature of homes in climate zones (a) Iron Triangle—Bsk (Zone 4); (b) Adelaide—Csa (Zone 5); (c) Fleurieu—Csb (Zone 6); (d) the three climate zones together, showing an exponential line of best fit; n = 10,813.
Atmosphere 13 00096 g002aAtmosphere 13 00096 g002b
Figure 3. Responses to the question: “Do the conditions in this room influence your health and wellbeing?” versus binned internal operative temperature (n = 10,813).
Atmosphere 13 00096 g003
Figure 4. Responses to the question: “How would you describe your health and wellbeing at the moment?” versus binned internal operative temperature (n = 10,813).
Atmosphere 13 00096 g004
Figure 5. Responses to the question: “How would you describe your health and wellbeing at the moment?” versus binned absolute indoor humidity—living rooms and bedrooms (n = 10,813).
Atmosphere 13 00096 g005
Figure 6. Window condition, as reported by the participants, vs. external temperature.
Atmosphere 13 00096 g006
Figure 7. Clothing level, as reported by the participants, vs. indoor operative temperature.
Atmosphere 13 00096 g007
Figure 8. Activity level, as reported by the participants, vs. indoor operative temperature.
Atmosphere 13 00096 g008
Table 1. Number and sex of participants in each stage of the study in the three regions.
StudyIron Triangle
Bsk (Zone 4)
Adelaide
Csa (Zone 5)
Fleurieu
Csb (Zone 6)
Total
MalesFemalesMalesFemalesMalesFemales
Survey152535554872250
Focus groups0752231249
Home monitoring231023112271
TOTAL17355010062106370 1
1 As some participants took part in more than one stage of the study, the number of individual participants totalled 303.
Table 2. Descriptive statistics for maximum (max) and minimum (min) temperatures (°C) during the period homes were monitored and when occupants responded to the survey, showing the amount of time cooling and heating were used by occupants.
Metric and TimeIron TriangleAdelaideFleurieu
Bsk (Zone 4)Csa (Zone 5)Csb (Zone 6)
Throughout monitoring period:
Outdoor 1
Max daily temperature (°C)41.147.440.5
Min daily temperature (°C)−0.6−1.70.0
Indoor 2
Ave max operative temperature (°C)32.731.932.7
Ave min operative temperature (°C)12.812.011.0
Mean SD operative temperature (°C)3.253.273.11
At the time votes were recorded 3
Max indoor (outdoor) hourly temp. (°C)28.9 (40)38.1 (46.8)33.4 (40.5)
Min indoor (outdoor) hourly temp. (°C)12.6 (4.2)11.8 (2.4)6.8 (4.8)
Ave indoor (outdoor) RH (%)52 (54)56 (57)57 (63)
AC usage (% of time)8.78.39.7
Heating usage (% of time)22.419.815.8
1 Sourced from the Bureau of Meteorology monitoring stations closest to the study sites during year 2019; 2 from hourly measurements during entire monitoring period; 3 from measurements at time vote was recorded. SD = standard deviation; RH = relative humidity.
Table 3. Best fit constants for Equation (1).
Location (Climate Zone)ABKn
Iron Triangle (Bsk, Zone 4)17.40912.3390.004211.60
Adelaide (Csa, Zone 5)15.62111.1810.000442.48
Fleurieu (Csb, Zone 6)15.47012.3940.001991.98
All 3 climate zones15.84411.6650.0008132.28
Publisher’s Note: MDPI stays neutral with regard to jurisdictional claims in published maps and institutional affiliations.

