1. Introduction
Working group I of the sixth report of the IPCC pointed out that global warming continues to occur, and precipitation differs from place to place [
1]. Under the background of global climate change, the temperature and precipitation in the arid region of Xinjiang change differently depending on latitude, longitude, and altitude [
2]. Climate change causes changes in lake water resources [
3]. Mengistu et al. assessed the impact of climate change on water resources in the upper Blue Nile River Basin [
4]. As an important water resource in arid areas, lakes play an important role in residential water use, agricultural irrigation, ecological security, and so on [
5,
6,
7]. Therefore, it is very necessary to explore the temporal status of lake water resources in Xinjiang in different geographical environments.
Remote sensing technology is widely used in the study of temporal dynamic changes of lakes, and the lakes exhibit strong spatiotemporal variability in Xinjiang. For example, the extent of Sayram Lake in the northern Tianshan Mountains was shown to have expanded from that observed in Landsat images from the 1970s [
8]. In addition, the areas of Ayakekum Lake and Aqqikkol Lake in the Kunlun Mountains have increased over the past few decades [
9]. By contrast, Bosten Lake in the southern Tianshan Mountains decreased in water level and lake extent in the 2000s [
10].
Using multi-resource satellites to study water resources is also a hot topic at present. Ye et al. studied the changes in lake water in Xinjiang using ICESat GLA14 from 2003 to 2009 and Landsat data from 2006 [
11]. Zhang et al. used multi-resource satellites to study the water balance of lakes in the northwest of the Tibetan Plateau and discussed the relationship between lake change and glacier meltwater and precipitation [
12]. Li et al. used long time-series satellite remote sensing data to study the impact of hydrological changes in Poyang Lake on different wetland cover types, and the results showed that the water, beach, and main vegetation communities were related to hydrological changes [
13]. Li et al. studied hydrological and morphological indexes, such as lake area, water level, and volume change, using remote sensing technology in Võrtsjärv Lake [
14]. Wang et al. used multi-source remote sensing data to construct an estimation method for Ebinur Lake inflow, which can quickly simulate the lake water volume and water level and reduce the input parameters required by the conventional lake water volume [
15].
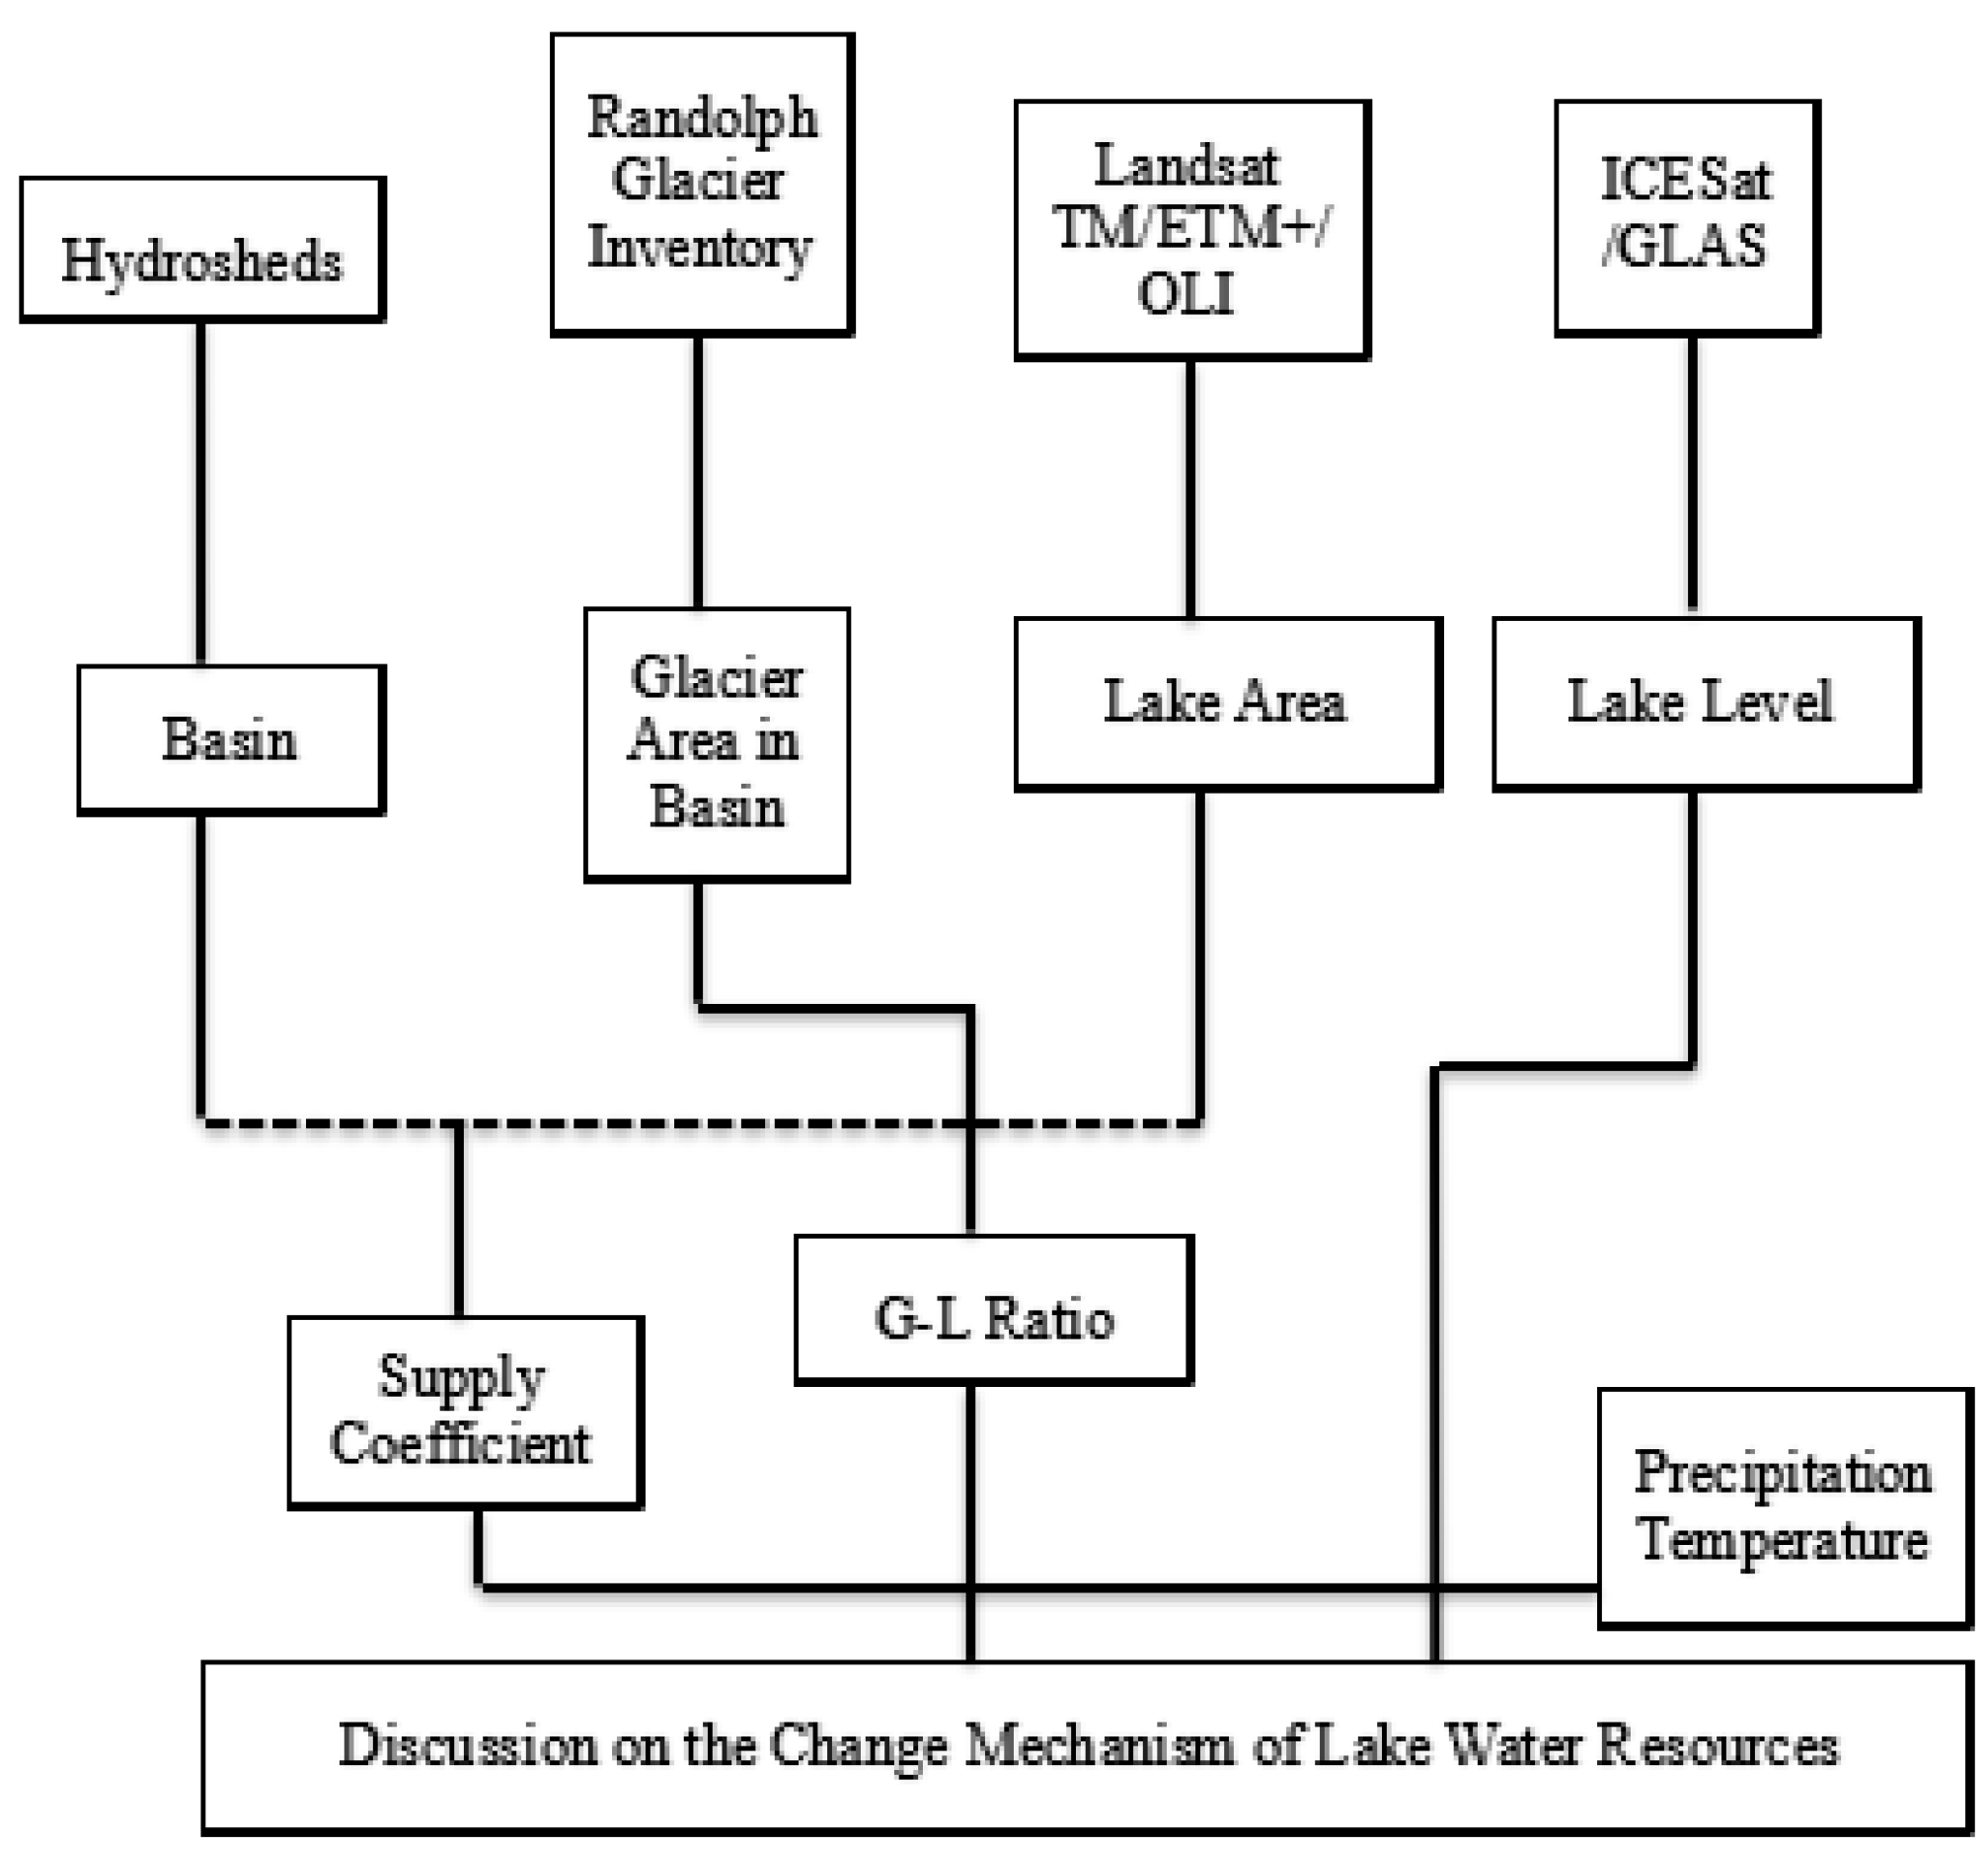
In this study, data from an earth resource satellite (Landsat) and an earth observation laser satellite (ICESat) were integrated to study the changes in eight typical lakes; the specific technical process is shown in
Figure 1. The surface area of these eight typical lakes accounts for 70.75% of the lake area in Xinjiang and reflects the changes in the temporal and spatial characteristics of lakes in Xinjiang to a certain extent. However, most of the recent research on lakes in Xinjiang has studied the temporal and spatial characteristics of lakes through topographic distribution and has failed to further study the characteristics of different types of lakes. On the other hand, most studies focus on the impacts of temperature, precipitation, and potential evapotranspiration on lakes, and they lack consideration of glacier and runoff factors. To further study the spatial and temporal characteristics of lake change, we divide lakes into two types: alpine lakes and non-alpine lakes. Alpine lakes are relatively high in altitude and less affected by human activities, while non-alpine lakes are the opposite [
16]. By analyzing the relationship between the water level changes in different types of lakes, the ratio of glacier area to lake area, and the ratio of lake basin area to lake area, it is possible to determine whether glacier meltwater or other climatic factors lead to water level changes. At the same time, to further analyze the factors of lake change, this paper also discusses the changing trends of precipitation and temperature as well as their relationship with the rate of change in lake levels.
2. Study Area and Materials
2.1. Xinjiang Lakes and Climate
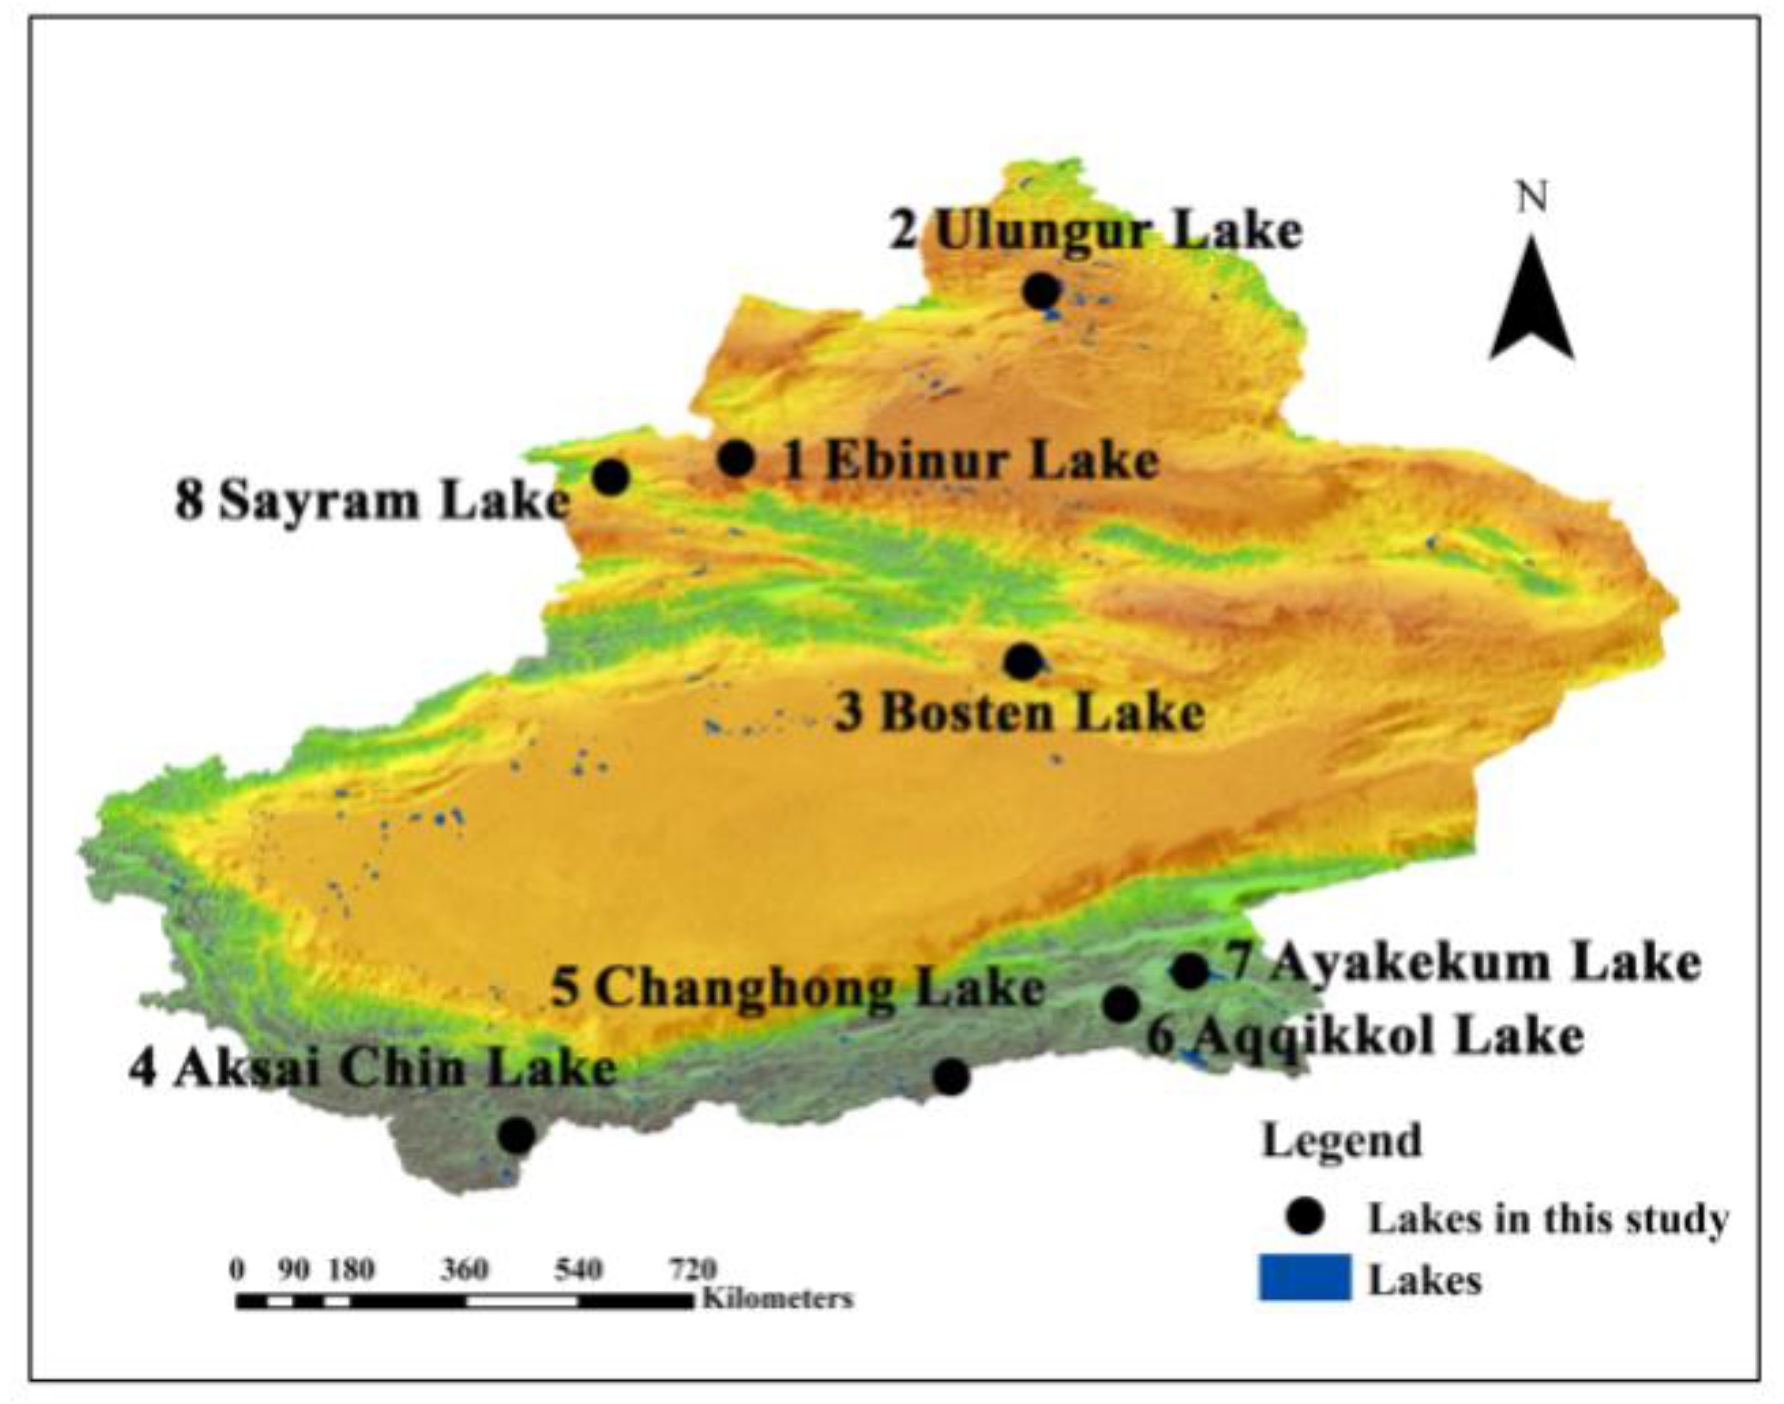
Xinjiang is located in northwest China (34°22’ N–49°33’ N, 73°32’ E–96°21’ E) and has an area of 1.66 million square kilometers. Xinjiang is surrounded by basins and numerous mountain ranges and is referred to as “Three Mountains Surrounding Two Basins”. It is divided into two parts, i.e., northern Xinjiang and southern Xinjiang, by the Tianshan Mountains. The Altay Mountains and Junggar Basin are in northern Xinjiang, while the Kunlun Mountains and Tarim Basin are in southern Xinjiang. There are more than 100 lakes in Xinjiang. One hundred and eight lakes have surface areas larger than 1 km
2 [
17]. The distribution of the lakes and research lakes is shown in
Figure 2. In Xinjiang, the annual mean temperature is 10–15 °C, and the annual precipitation is less than 150 mm, which is only 23% of the average precipitation level in China (630 mm) [
18].
2.2. Artificial Satellite Used for Interpreting Lake Area
We used Landsat Thematic Mapper (TM), Enhanced Thematic Mapper Plus (ETM+), and Operational Land Imager (OLI) images from USGS (
https://glovis.usgs.gov/) to extract the lake surface area of eight typical lakes from 1989 to 2015. With a spatial resolution of 30 m, the images provided sufficiently precise boundaries for the lakes. To illustrate the spatial and temporal characteristics of the lakes, we utilized 248 images. All the images were collected between July and October to reduce the impact of seasonal changes. All images of the lakes’ extents were cloudless or had a cloud amount of less than 1%. We filled the unscanned gaps in Landsat 7 SLC-off ETM+ images using the Neighborhood Similar Pixel Interpolator (NSPI) method [
19]. The images required radiometric correction in order to convert digital numbers (DN) to surface reflectance values [
20].
2.3. Altimetry Satellite Used for Interpreting Lake Area
The Geoscience Laser Altimeter System (GLAS) on board the Ice, Cloud, and Elevation Satellite (ICESat) was launched in January 2003. ICESat/GLAS was used to extract water level variations in Xinjiang during the 2003–2009 period. Previous studies have shown that the ICESat is widely utilized to estimate forest canopy height [
21], water elevation variation [
11,
22], ice thickness [
23], snow depth [
24], etc. The accuracy of the ICESat/GLAS measurements of elevations over flat terrain is ~2 cm within 70 m footprints paced at 172 m [
25,
26]. The reliability of the ICESat/GLAS measurements of water level variations for lakes in Xinjiang has been confirmed through comparisons with data from hydrological stations [
27,
28,
29,
30].
The ICESat’s L2 Global Land Surface Altimetry Data (GLA14) were downloaded from the National Snow and Ice Data Center. The ICESat/GLA14 possesses vertical accuracy, which can be utilized for high precision measurements of small inland waters [
31]. ICESat Release 33 GLA14 data were used to measure the water level variation of lakes in Xinjiang. The annual rates of change in lake levels in each of the eight typical lakes between 2003 and 2009 were estimated.
2.4. Other Data Sources and Processing
The distribution of glaciers in each lake was acquired from the Randolph Glacier Inventory, and whether the glacial meltwater could be used as the recharge water resource for the lake was previously determined [
32]. Numerous previous studies have proven that the glacier data from the Randolph Glacier Inventory are useful and reliable [
33,
34].
From USGS, we obtained watersheds from the HydroSHEDS dataset (
https://www.worldwildlife.org/pages/hydrosheds). We checked the data with assistance from Google Earth Geomorphology. Incorrect basin boundaries were modified by DEM. For example, the undescribed Ulungur Lake Basin extent was delineated. The glaciers inside the boundary of the lake basin were extracted. The parameters of the lakes, lake surface area, lake level variations, G–L ratio, and supply coefficient are listed in
Table 1.
We obtained the data on monthly precipitation and monthly mean temperature with a spatial resolution of 0.5° from the China Meteorological Data Sharing Service System (
http://cdc.cma.gov.cn/). The data were interpolated using the thin-plate smoothing splines (TPS) method. Previous studies have demonstrated that the TPS method is highly precise in Xinjiang [
35].
The cultivated land data in the basin obtained from land-use data came from the resource and environment data cloud platform of the Chinese Academy of Sciences (
http://www.resdc.cn/) Land use data of China were collected for 1980, 1990, 1995, 2000, 2005, and 2015 (30 m × 30 m).
3. Results and Analysis
3.1. Lake Surface Area Changes
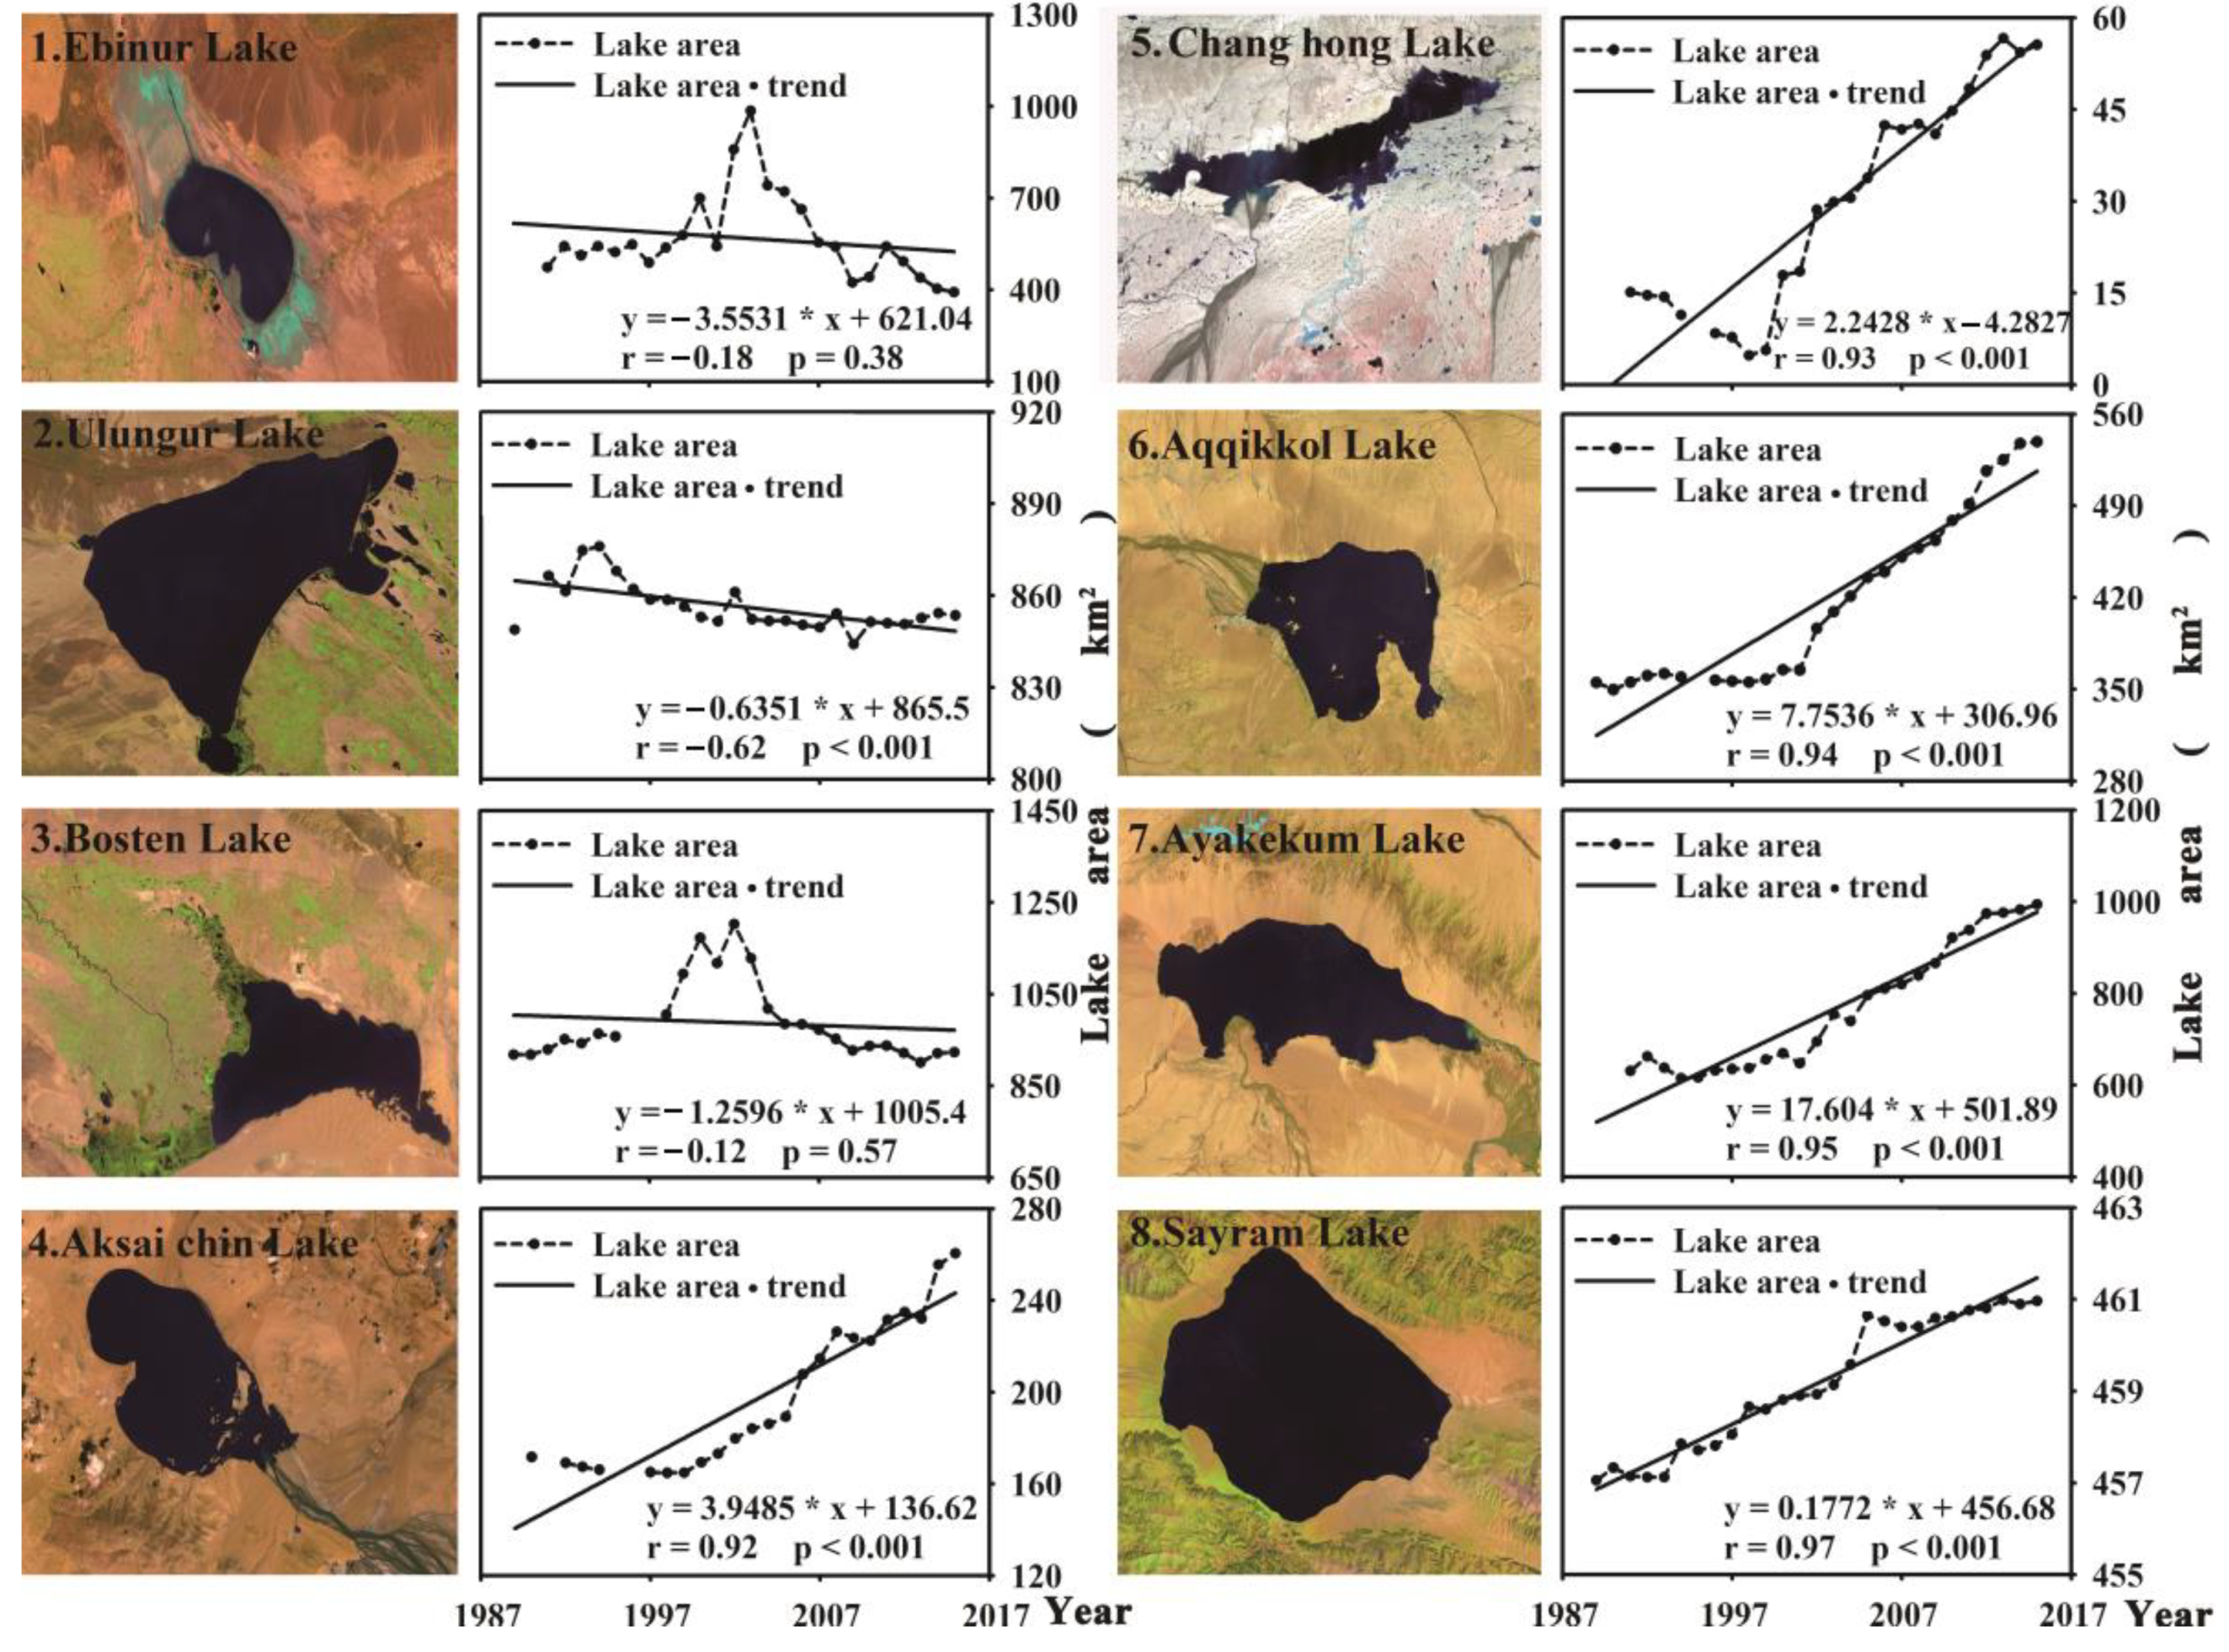
The temporal and spatial dynamic changes in the lake areas of eight typical lakes from 1989 to 2015 are shown in
Figure 3. In addition, the average area of each lake from 1989 to 2015 is shown in
Table 1. In this study, the total area of the eight typical lakes was 4513.84 km
2, accounting for 70.75% (calculated in 2006) of the total surface area of the sum of the lake surface areas larger than 10 km
2 [
11]. Therefore, the changes in these eight typical lakes can reflect the dynamic changes of lakes in Xinjiang. We divided the eight typical lakes into two types, i.e., alpine lakes (type 1) and non-alpine lakes (type 2). Over the past three decades, the lake surface areas of the two types varied dynamically. The lake surface area of type 1 was 2383.28 km
2 in 2015; compared with 1992, the area change rate was 38.63%.
The lake surface area of type 2 was 2169.03 km
2 in 2015, which constitutes an area change rate of −4.44% compared with the lake area in 1991. The lake surface area of non-alpine lakes showed a decreasing trend for the 1989–2015 period of −0.6351 km
2/y (r = −0.62,
p < 0.001) to −3.5531 km
2/y (r = −0.18,
p = 0.38). In addition, rapid shrinkage occurred in Ebinur Lake, with a change rate of −3.5531 km
2/y. The runoff of the Bortala River and Jinghe River was one of the factors affecting the area change of Ebinur Lake. In 2002, the maximum runoff of the Bortala River was 7.8 × 10
8 m
3, the lake water resources were fully replenished, and the lake area became larger. In 2008, the precipitation of the Bortala River and Jinghe River decreased sharply and was as low as 104.3 mm and 68.1 mm, respectively. When the precipitation showed a decreasing trend, the runoff also showed a decreasing trend, so the area of Ebinur Lake became smaller [
36]. From 1988 to 2002, the increase in temperature and precipitation led to an increase in water entering the lake, which was the main reason for the significant increase in the Bosten Lake area. From 2003 to 2014, the runoff flowing into the lake decreased, and the water flowing out of the lake increased, resulting in a significant decline in the lake area of Bosten Lake [
37].
The lake surface area of alpine lakes exhibited an increasing trend from 1989 to 2015 of 0.0027 km
2/y (r = 0.009,
p = 0.69) to 17.604 km
2/y (r = 0.95,
p < 0.001). Sayram Lake in the Tianshan Mountains exhibited a minimum expansion rate of 0.1772 km
2/y. Ayakekum Lake in the Kunlun Mountains had a maximum expansion rate of 17.604 km
2/y. Lakes ID4, 5, 6, and 7 are located in the Kunlun Mountains, where the change in lake area is mainly affected by climate factors and is mostly not disturbed by human activities. At the beginning of the 21st century, the climate in Xinjiang transformed into “warm and humid”, that is, with the rise of temperature, the climate and hydrological elements in Xinjiang changed significantly, with obvious signals such as continuous increases in precipitation, runoff, and glacier melting and a significant increase in lake area [
38].
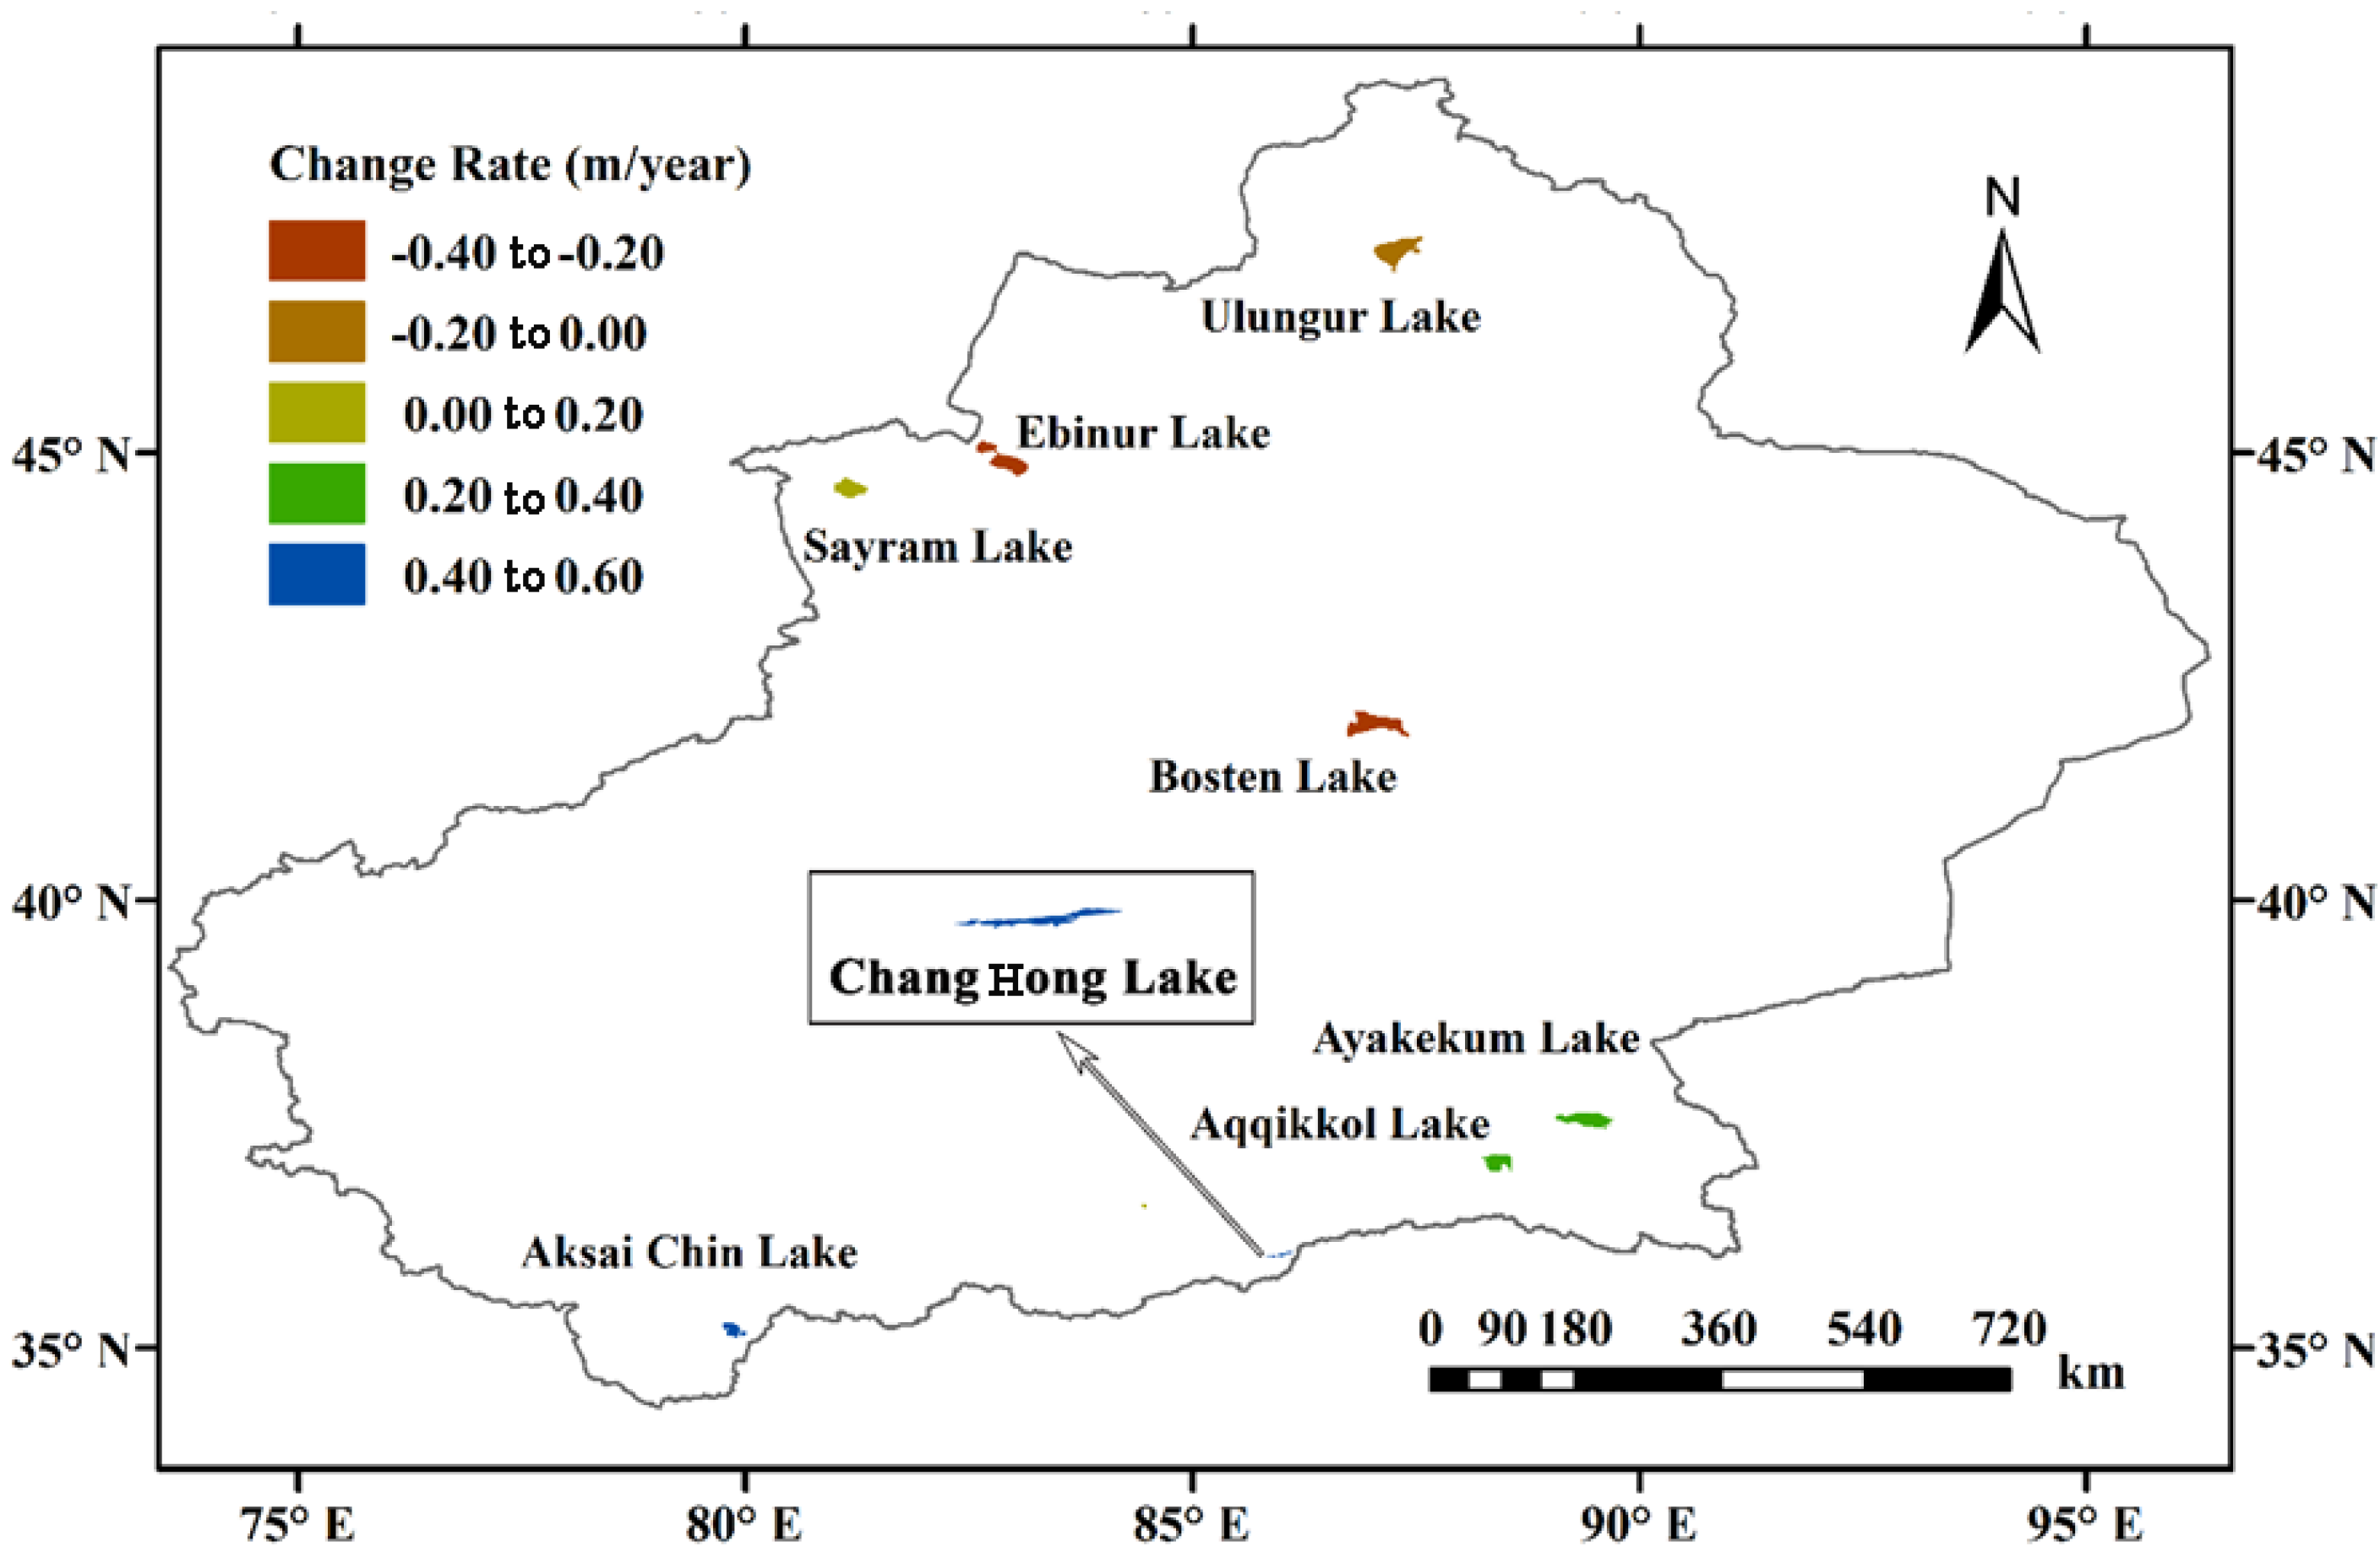
3.2. Changes in Xinjiang Lake Level
From 2003 to 2009, the ICESat GLA14 data also indicated the expansion of alpine lakes and the shrinkage of non-alpine lakes. The spatial distribution of the water level change rate is presented in
Figure 4. The alpine lakes rose at an average rate of 0.34 m/y. Of the alpine lakes, Sayram Lake in the Tianshan Mountains had the lowest increase rate of 0.06 m/y. Compared with Sayram Lake, alpine lakes in the Kunlun Mountains exhibited a greater water level change rate, from 0.24 m/y (r = 0.95,
p = 0.001) to 0.58 m/y (r = 0.79,
p = 0.06). The water level of non-alpine lakes declined from −0.05 m/y (r = −0.40,
p = 0.38) to −0.40 m/y (r = −0.99,
p < 0.001). In Ulungur Lake, the annual change rate of the water level varied slowly because of the artificial control of lake water storage [
39]. The decline in the water level in Bosten Lake was the result of climate change and human activities. Climate change, such as the rise in temperature, increased Kaidu River runoff and the evaporation at the lake’s surface. Human activities mainly manifested as an increase in agricultural irrigation and water outflow [
40,
41,
42].
3.3. Relationship between Lake Changes and G–L Ratio, Supply Coefficient
Changes in lake water levels can reflect lake water storage change more accurately than variations in lake surface area. Simultaneously, it is difficult to estimate the glacier meltwater of the glacier mass loss on the lake water storage change. In Xinjiang, glacier mass research has been limited to Urumqi Glacier No. 1. Over the past decades, glacier mass loss for UG1 has been demonstrated [
43,
44,
45]. However, Xinjiang possessed 20,695 glaciers with a total area of 22,623.82 km
2 [
46]. Because of this immense number and volume, it is infeasible to estimate the total glacier mass balance in this region. Therefore, the glacier area in the basin was used to analyze the supply of glacier meltwater to the lake.
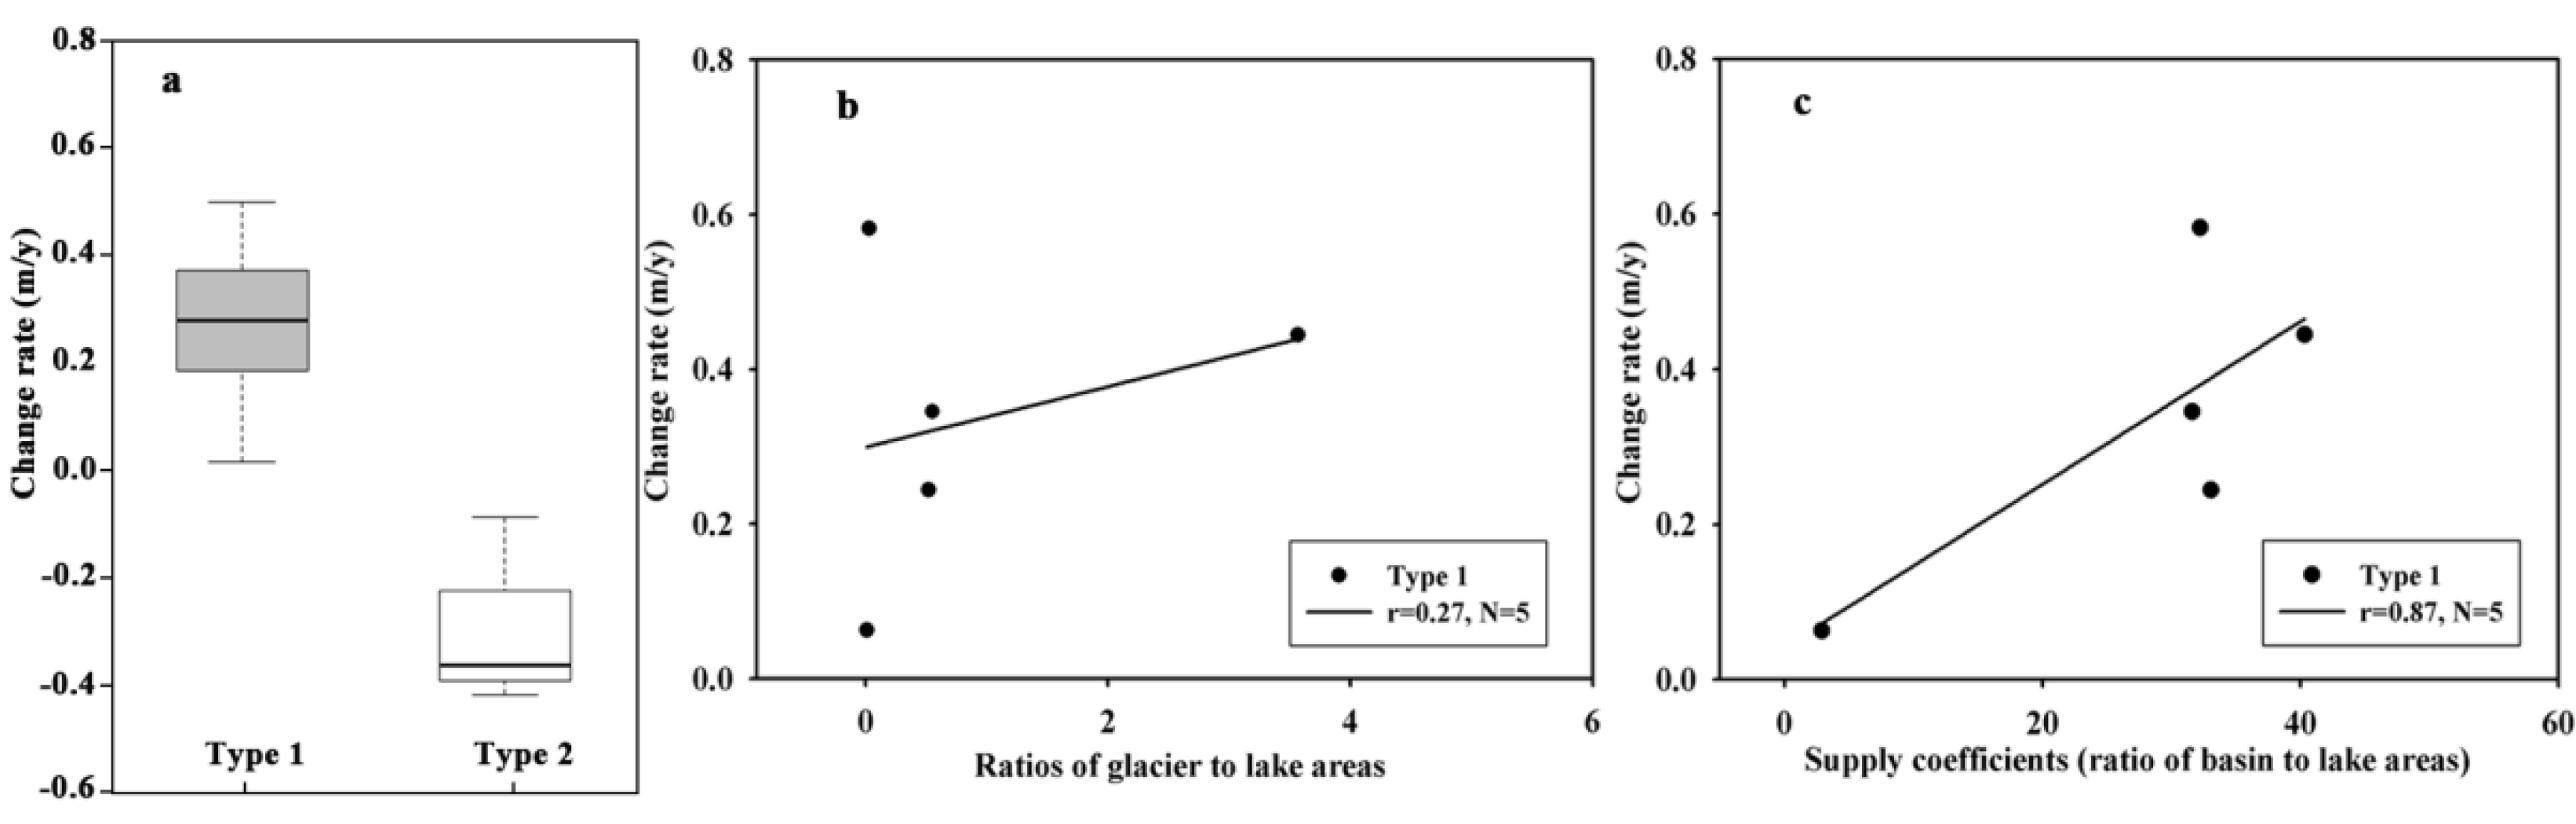
When analyzing the water level change rate of alpine lakes and non-alpine lakes, as shown in
Figure 5a, the change rates of the lake levels were different for the two types. Specifically, the change rates of the lake water level of type 2 decreased, and the change rates of the lake water level of type 1 increased. Compared with type 2 lakes, type 1 lakes are rarely influenced by human activities. To more accurately analyze the influence of natural factors on lake variations, we only researched type 1. To determine whether glacial meltwater was an important factor in the rise in the lake level, we utilized the G–L ratio to infer the impact of glacial meltwater on the change in lake water storage. As shown in
Figure 5b, there was a weak linear relationship between them (r = 0.27,
p = 0.74). To analyze the impact of precipitation on lakes, the relationship between the water level change rate and the water supply coefficient of alpine lakes was analyzed. As shown in
Figure 5C, there was a relatively linear relationship between supply coefficients and the change rate of the lake water level (r = 0.87,
p = 0.13). It can be seen that rainfall runoff had a significant impact on lake changes in the basin.
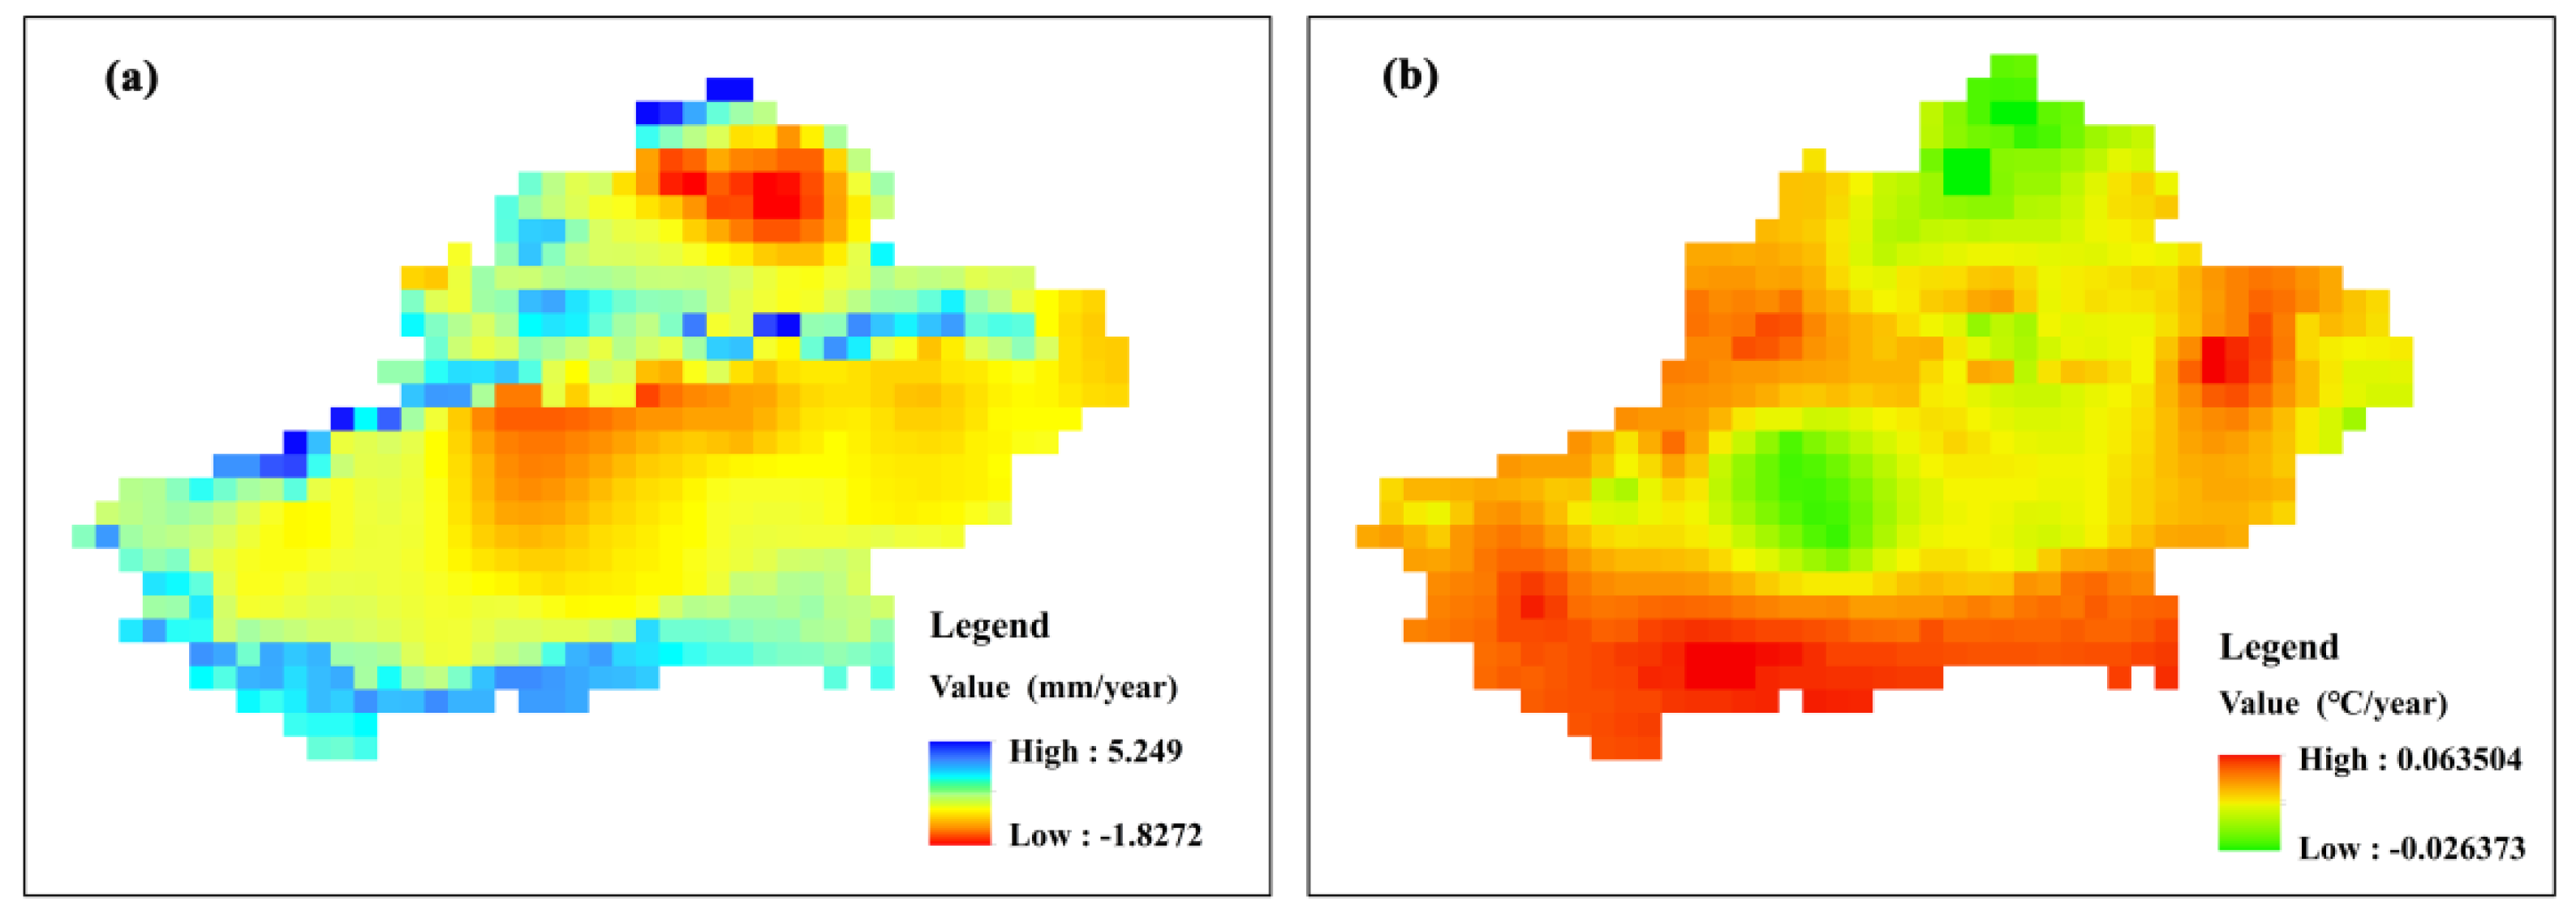
3.4. Relationship between Lake Changes and Climate Variability
In the mountainous region of Xinjiang, temperature and precipitation exerted an important influence on the water budget [
47]. To confirm whether the changes in temperature and precipitation were closely related to the change in lake water resources, we analyzed the interannual change slope of annual precipitation and annual average temperature from 1989 to 2015, and the spatial pattern distributions are shown in
Figure 6a,b.
For alpine lakes with an average DEM of 3989 m, the interannual change rate of annual precipitation ranged from 1.347 mm/y to 3.135 mm/y. In addition, the annual average temperature significantly increased by 0.045–0.054 °C/y. By contrast, the annual precipitation and temperature of non-alpine lakes with an average DEM of 574 m gently varied, with average change rates of 0.531 mm/y and 0.022 °C/y, respectively. In Xinjiang, precipitation and temperature have increased over the past several decades, as proven by different data from various geographical districts (Northern Xinjiang and Southern Xinjiang) and elevations [
18,
48].
The increase in temperature implies that snowmelt runoff was enhanced in lake basins, leading to a positive influence on the lake water budget. Snow constitutes an important freshwater resource and is the response factor most sensitive to climate change [
49,
50]. The area of permanent snow cover in Xinjiang was approximately 10,660.87 km
2 [
51]. Snowmelt exhibited a close relationship with temperature during the snowmelt period (Spring and June) [
52,
53]. We examined the relationship between temperature in the snowmelt period and the water level change of alpine lakes from 2003 to 2009, the results of which are presented in
Table 2. The correlation coefficients of alpine lakes showed a linear relationship between lake water level and snowmelt. Furthermore, Sayram Lake had the highest correlation coefficient (0.82).
The supply coefficient contributed by precipitation revealed a significant correlation with the change rate of lake level. We analyzed the relationship between the precipitation in wet seasons and the water level change [
54], the results of which are shown in
Table 2. The correlation coefficients of alpine lakes were higher than 0.45, which demonstrated that precipitation was highly correlated with the lake water budget.
4. Discussion
Using data from the laser altimetry satellite and Landsat, the changes in the water levels and areas of lakes were analyzed. Ye et al. analyzed water level changes in different geographical environments and only discussed the impacts of temperature and precipitation on the lakes [
11]. This paper not only discussed the change in lake levels of alpine lakes and non-alpine lakes on the basis of a long series of data, but it also analyzes the changes in lake area. At the same time, the reasons for the changes in water resources in different types of lakes were discussed according to the data on glaciers, the watershed, temperature, and precipitation. However, the limited number of lakes researched, the restriction of surviving lake water levels (only six years), the error of the precipitation interpolation algorithm, and the availability of only one year of the Randolph Glacier Inventory may have caused uncertain correlation coefficients of G–L ratio and precipitation on changes in lake water levels.
The variations in lake water levels of alpine lakes in Xinjiang are closely related to precipitation change. However, alpine lakes at different elevations in various geological environments were supplied by distinct contribution rates of temperature, precipitation, and glacier meltwater. They were also affected by other factors, such as snowmelt supply, groundwater discharge, etc. The change rate of water levels of some lakes may be attributable to these factors or other causes. Mountain lakes in Northern Xinjiang are greatly affected by the changes in precipitation and temperature; oasis lakes are affected by climate and groundwater development; and plain lakes are affected by climate change and human activities [
55]. In a study of typical lakes larger than 10 km
2 in Xinjiang, the area of most lakes was positively correlated with annual precipitation, and lakes in different regions had different correlations with temperature [
8]. Moreover, previous studies of alpine lakes on the Tibetan Plateau have demonstrated that a positive correlation exists between the increased rate of change in lake water levels and supply coefficients [
54].
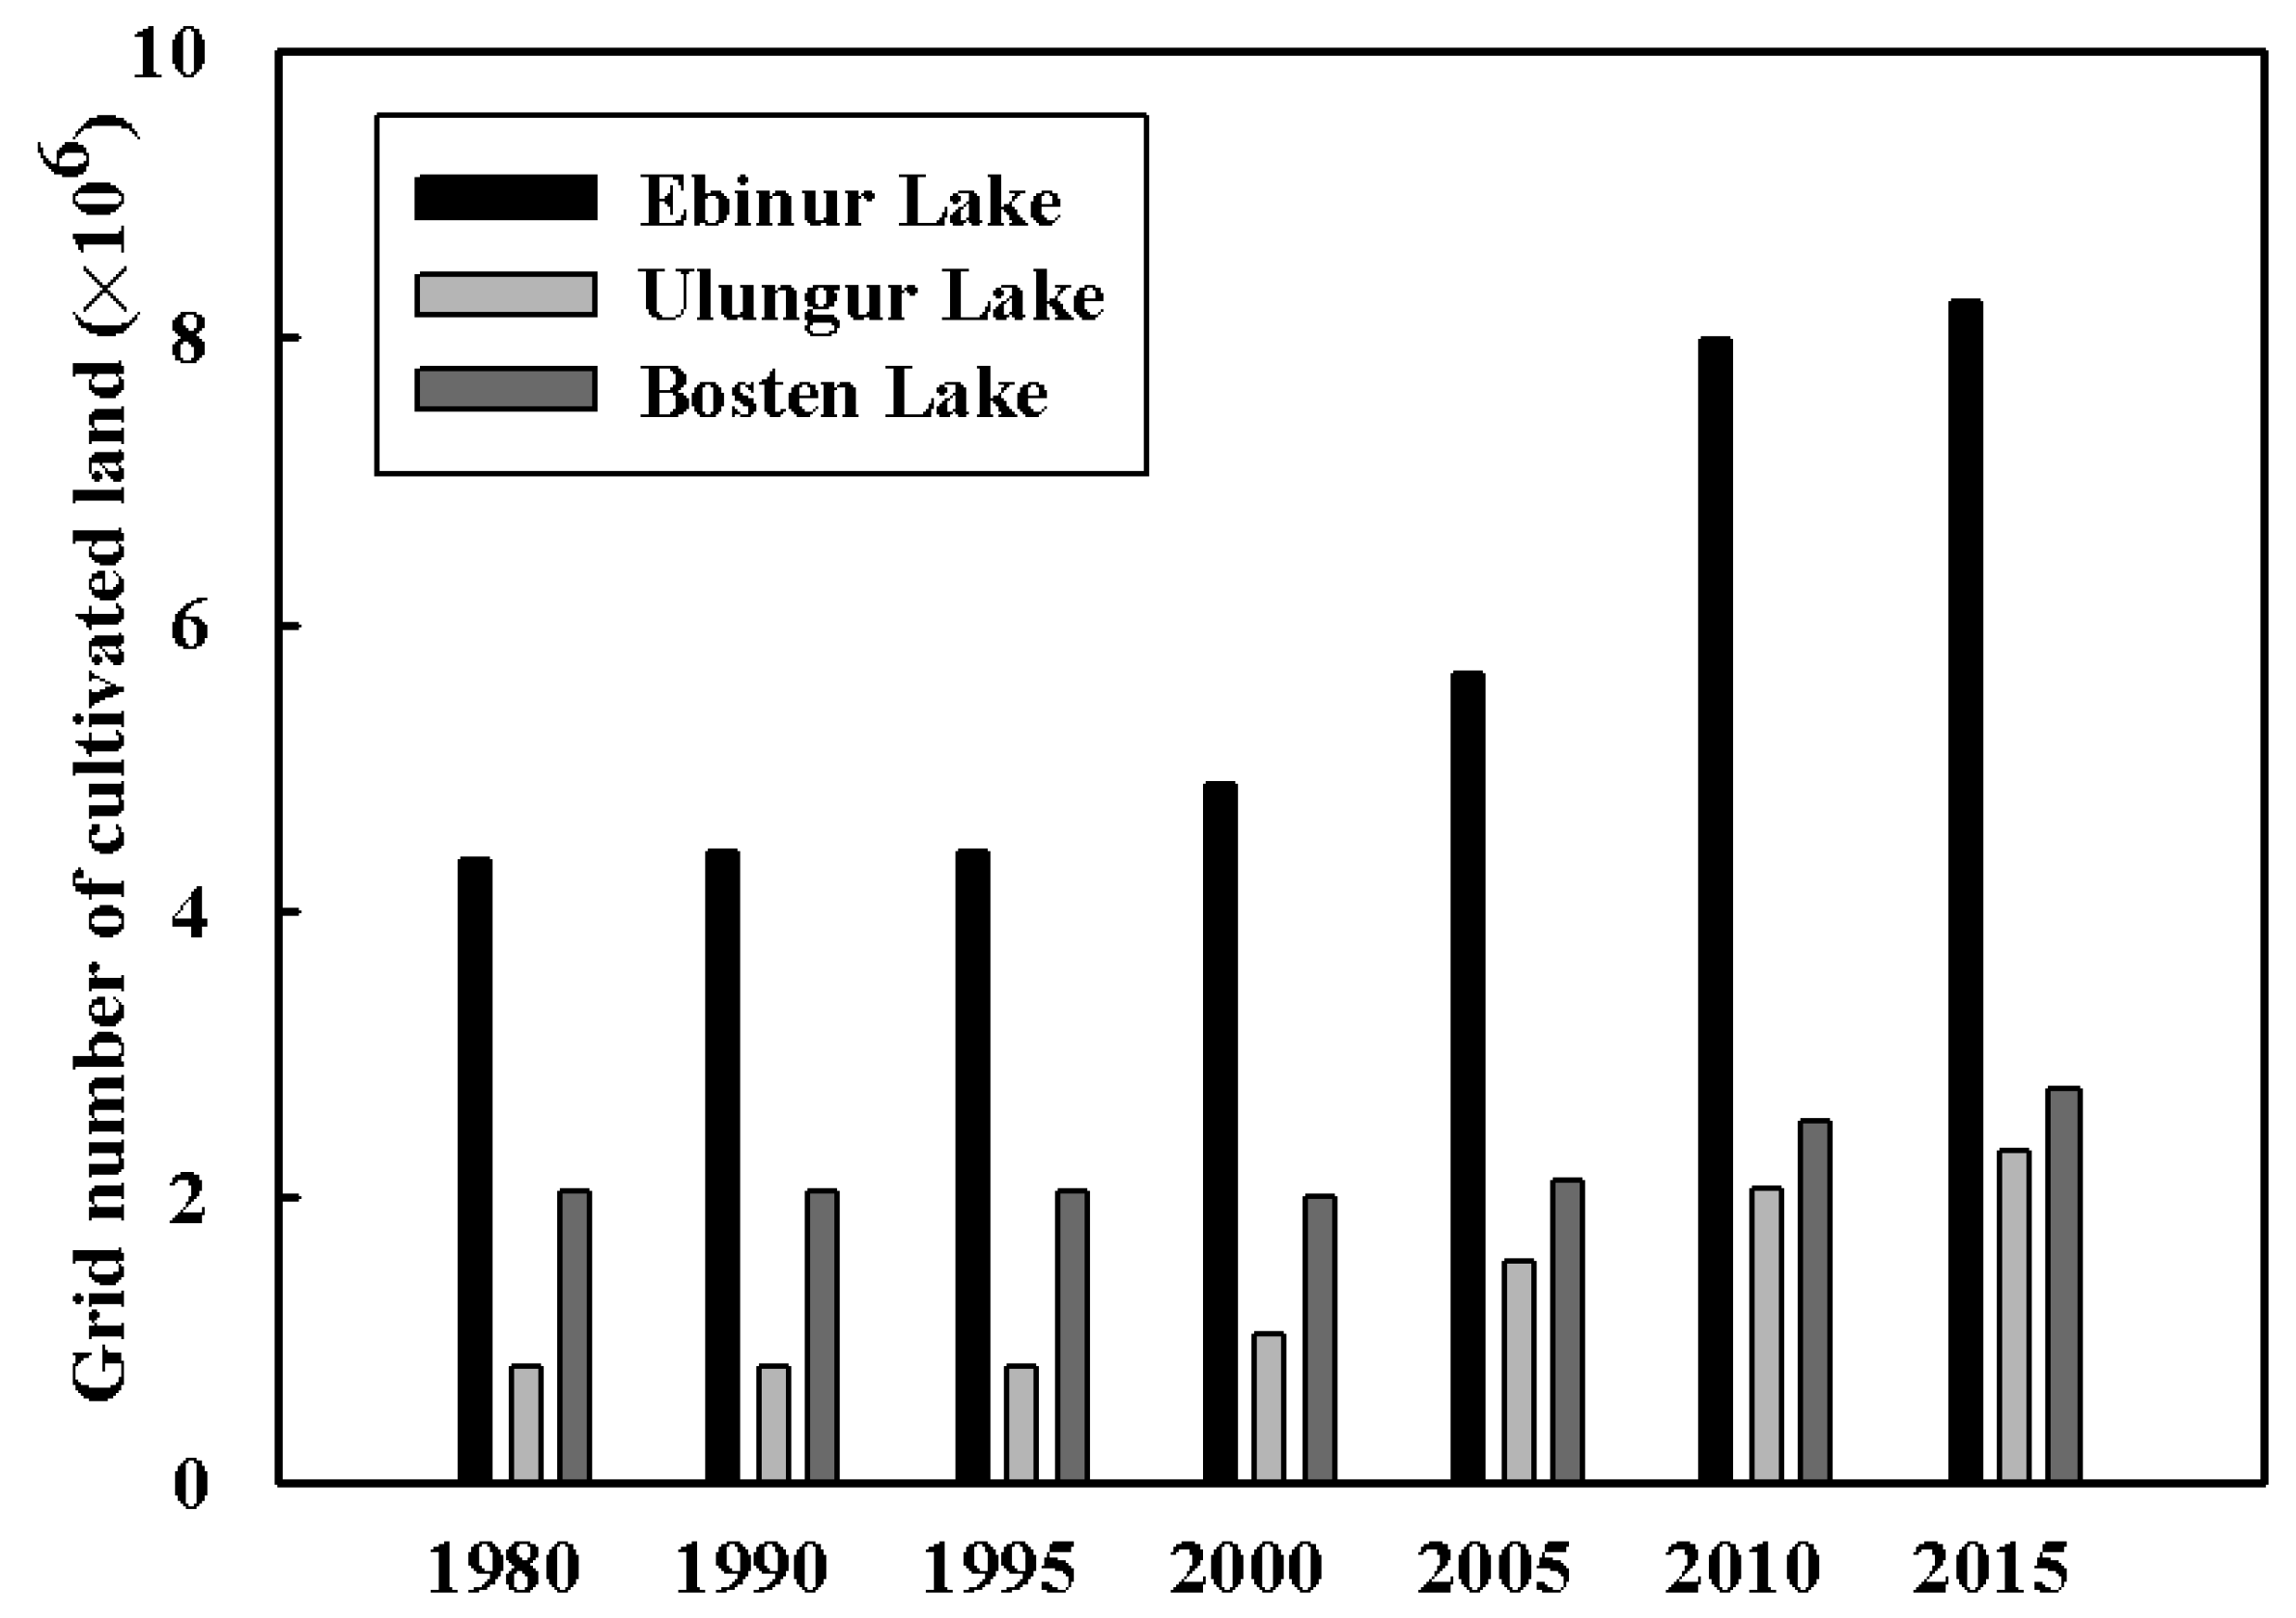
The cultivated land area of non-alpine lakes increased in different ranges during the study period (
Figure 7). In the Ebinur Lake Basin, the rapid increase in population and economic acceleration have led to the development of a large area of cultivated land. Because of the need for agricultural water diversion and irrigation, large-scale reservoirs are built near the main rivers entering the lake, resulting in a significant reduction in the surface runoff flowing into the Ebinur Lake [
56]. The irrigation area of cultivated land in the Ulungur Lake Basin has increased and the number of lake water resources has decreased, but the project of diverting the Irtysh River to Ulungur Lake increased the inflow water to Ulungur Lake [
57]. The water consumption of Bosten Lake maintains the domestic water, industrial, and agricultural production of Bayingolin Mongolian Autonomous Prefecture. The local government uses the opportunity of Bosten Lake in the wet season to transfer ecological water to the Tarim River [
58].
In this paper, only ICESat data were used to analyze the lake water level data. JASON-1 JASON -2, JASON -3, ENVISAT, and cryosat-2 altimetry satellites provided a good data source for the dynamic change monitoring of inland lake water levels. LANDSAT was used to analyze the lake area data. Finally, high-resolution images can grasp the change information of lakes quickly and accurately for a long time, so they can provide more powerful support for water resource investigation and monitoring, ecological civilization construction, and response to global climate change.
5. Summary
We obtained water levels from ICESat GLA14 between 2003 and 2009, and a long-term and continuous investigation of lake surface areas was conducted using Landsat images from 1989 to 2015. The data showed shrinkage in non-alpine lakes and expansion in alpine lakes. The minimum increase rate of the water levels of alpine lakes was 0.06 m/y, indicating rapid expansion from 2003 to 2009. By contrast, non-alpine lakes decreased more substantially, and the maximum decrease rate of the water level was 0.40 m/y.
We analyzed five typical alpine lakes, all of which were glacier-fed lakes. In addition, they were less affected by human activities than other lake types. In the lake basins, the supply coefficients exhibited a close correlation with the change rate of water level. On the other hand, the G–L ratio had only a weak correlation. From 2003 to 2009, the water level changes agreed well with variations in precipitation in the wet seasons and temperature in the snowmelt period. It was found that in different geographical environments, different factors may lead to different changes in the water resources of alpine lakes. Alpine lakes in the Kunlun Mountains increased more rapidly, with an average change rate of 0.40 m/y, compared with alpine lakes in the Tianshan Mountains (0.06 m/y). Thus, it can be seen that the expansion of alpine lakes is affected by comprehensive factors, precipitation, temperature, and snowmelt.
Our research was limited to analyzing the response of lake water resources to factors such as precipitation, glacier meltwater, temperature, and runoff. The change rate of the mooring water level may also be related to the characteristics of lake bathymetry, groundwater discharge, and other factors. However, because of the limitations of the measured water level, meteorological station data, and other potential factors, it is difficult to establish a reliable numerical model of the water balance of alpine lakes. To quantitatively clarify the driving mechanism of water balance in alpine lakes, reliable meteorological factor data, high-precision remote sensing satellites, and advanced modeling technology are requisite.
Author Contributions
Software, Y.L., H.G.; validation, Z.Y., H.G.; resources, Z.Y., Q.J.; writing—original draft preparation, Y.L.; supervision, A.M.; All authors have read and agreed to the published version of the manuscript.
Funding
This research was funded by Xinjiang Autonomous Region Science and Technology Plan Project, grant number 2021D01B05.
Conflicts of Interest
The authors declare no conflict of interest.
References
- Eyring, V.; Gillett, N.P.; Achutarao, K.; Barimalala, R.; Barreiro Parrillo, M.; Bellouin, N.; Cassou, C.; Durack, P.; Kosaka, A.; Mitchell, D.; et al. Human Influence on the Climate System: Contribution of Working Group I to the Sixth Assessment Report of the Intergovernmental Panel on Climate Change; IPCC Sixth Assessment Report; IPCC: Geneva, Switzerland, 2021. [Google Scholar]
- Zheng, S.; Zhang, B.; Peng, D.; Yu, L.; Lin, B.; Pan, Y.; Xie, Q. The trend towards a warmer and wetter climate observed in arid and semi-arid areas of northwest China from 1959 to 2019. Environ. Res. Commun. 2021, 3, 115011. [Google Scholar] [CrossRef]
- Zheng, L.; Xia, Z.; Xu, J.; Chen, Y.; Yang, H.; Li, D. Exploring annual lake dynamics in Xinjiang (China): Spatiotemporal features and driving climate factors from 2000 to 2019. Clim. Chang. 2021, 166, 1–20. [Google Scholar] [CrossRef]
- Mengistu, D.; Bewket, W.; Dosio, A.; Panitz, H.J. Climate change impacts on water resources in the upper blue nile (Abay) river basin, ethiopia. J. Hydrol. 2021, 592, 125614. [Google Scholar] [CrossRef]
- Duan, W.; Maskey, S.; Chaffe, P.L.B.; Luo, P.; He, B.; Wu, Y.; Hou, J. Recent Advancement in Remote Sensing Technology for Hydrology Analysis and Water Resources Management. Remote Sens. 2021, 13, 1097. [Google Scholar] [CrossRef]
- Xue, D.; Zhou, J.; Zhao, X.; Liu, C.; Wei, W.; Yang, X.; Li, Q.; Zhao, Y. Impacts of climate change and human activities on runoff change in a typical arid watershed, NW China. Ecol. Indic. 2021, 121, 107013. [Google Scholar] [CrossRef]
- Golobokova, L.; Netsvetaeva, O.; Khodzher, T.; Obolkin, V.; Khuriganova, O. Atmospheric Deposition on the Southwest Coast of the Southern Basin of Lake Baikal. Atmosphere 2021, 12, 1357. [Google Scholar] [CrossRef]
- Liu, Y.; Yang, J.; Chen, Y.; Fang, G.; Li, W. The temporal and spatial variations in lake surface areas in Xinjiang, China. Water 2018, 10, 431. [Google Scholar] [CrossRef] [Green Version]
- Yang, R.; Zhu, L.; Wang, J.; Ju, J.; Ma, Q.; Turner, F.; Guo, Y. Spatiotemporal variations in volume of closed lakes on the Tibetan Plateau and their climatic responses from 1976 to 2013. Clim. Chang. 2017, 140, 621–633. [Google Scholar] [CrossRef]
- Tan, C.; Ma, M.; Kuang, H. Spatial-temporal characteristics and climatic responses of water level fluctuations of global major lakes from 2002 to 2010. Remote Sens. 2017, 9, 150. [Google Scholar] [CrossRef] [Green Version]
- Ye, Z.; Liu, H.; Chen, Y.; Shu, S.; Wu, Q.; Wang, S. Analysis of water level variation of lakes and reservoirs in Xinjiang, China using ICESat laser altimetry data (2003–2009). PLoS ONE 2017, 12, e0183800. [Google Scholar] [CrossRef]
- Zhang, G.; Chen, W.; Li, G.; Yang, W.; Yi, S.; Luo, W. Lake water and glacier mass gains in the northwestern Tibetan Plateau observed from multi-sensor remote sensing data: Implication of an enhanced hydrological cycle. Remote Sens. Environ. 2020, 237, 111554. [Google Scholar] [CrossRef]
- Liang, D.; Lu, J.; Chen, X.; Liu, C.; Lin, J. An investigation of the hydrological influence on the distribution and transition of wetland cover in a complex lake–floodplain system using time-series remote sensing and hydrodynamic simulation. J. Hydrol. 2020, 587, 125038. [Google Scholar] [CrossRef]
- Li, S.; Toming, K.; Nõges, T.; Kutser, T. Integrating remote sensing of hydrological processes and dissolved organic carbon fluxes in long-term lake sudies. J. Hydrol. 2022, 605, 127331. [Google Scholar] [CrossRef]
- Wang, J.; Yang, S.; Liu, H.; Wang, P.; Lou, H.; Gong, T. Simulation of Lake Water Volume in Ungauged Terminal Lake Basin Based on Multi-Source Remote Sensing. Remote Sens. 2021, 13, 697. [Google Scholar] [CrossRef]
- Dong, J.; Yan, D.; Mo, K.; Chen, Q.; Zhang, J.; Chen, Y.; Wang, Z. Antibiotics along an alpine river and in the receiving lake with a catchment dominated by grazing husbandry. J. Environ. Sci. 2022, 115, 374–382. [Google Scholar] [CrossRef] [PubMed]
- Fang, L.; Tao, S.; Zhu, J.; Liu, Y. Impacts of climate change and irrigation on lakes in arid northwest China. J. Arid. Environ. 2018, 154, 34–39. [Google Scholar] [CrossRef]
- Li, Q.; Chen, Y.; Shen, Y.; Li, X.; Xu, J. Spatial and temporal trends of climate change in Xinjiang, China. J. Geogr. Sci. 2011, 21, 1007–1018. [Google Scholar] [CrossRef]
- Chen, J.; Zhu, X.; Vogelmann, J.; Gao, F.; Jin, S. A simple and effective method for filling gaps in Landsat ETM+ SLC-off images. Remote Sens. Environ. 2011, 115, 1053–1064. [Google Scholar] [CrossRef]
- Chen, X.; Vierling, L.; Deering, D. A simple and effective radiometric correction method to improve landscape change detection across sensors and across time. Remote Sens. Environ. 2005, 98, 63–79. [Google Scholar] [CrossRef]
- Lefsky, M.A.; Harding, D.J.; Keller, M.; Cohen, W.B.; Carabajal, C.C.; Del Bom Espirito-Santo, F.; Hunter, M.O.; De Oliveira, R. Estimates of forest canopy height and aboveground biomass using ICESat. Geophys. Res. Lett. 2005, 32, 1–4. [Google Scholar] [CrossRef] [Green Version]
- Smith, B.E.; Fricker, H.A.; Joughin, I.R.; Tulaczyk, S. An inventory of active subglacial lakes in Antarctica detected by ICESat (2003–2008). J. Glaciol. 2009, 55, 573–595. [Google Scholar] [CrossRef] [Green Version]
- Kwok, R.; Rothrock, D.A. Decline in Arctic sea ice thickness from submarine and ICESat records: 1958-2008. Geophys. Res. Lett. 2009, 36, L15501. [Google Scholar] [CrossRef] [Green Version]
- Treichler, D.; Kaeaeb, A. Snow depth from ICESat laser altimetry—A test study in southern Norway. Remote Sens. Environ. 2017, 191, 389–401. [Google Scholar] [CrossRef] [Green Version]
- Duong, V.H.; Lindenbergh, R.; Pfeifer, N.; Vosselman, G. Single and two epoch analysis of ICESat full waveform data over forested areas. Int. J. Remote Sens. 2008, 29, 1453–1473. [Google Scholar] [CrossRef]
- Zhang, G.; Xie, H.; Kang, S.; Yi, D.; Ackley, S.F. Monitoring lake level changes on the Tibetan Plateau using ICESat altimetry data (2003–2009). Remote Sens. Environ. 2011, 115, 1733–1742. [Google Scholar] [CrossRef]
- Wang, X.; Gong, P.; Zhao, Y.; Xu, Y.; Cheng, X.; Niu, Z.; Luo, Z.; Huang, H.; Sun, F.; Li, X. Water-level changes in China’s large lakes determined from ICESat/GLAS data. Remote Sens. Environ. 2013, 132, 131–144. [Google Scholar] [CrossRef]
- Zhang, G.; Xie, H.; Yao, T.; Kang, S. Water balance estimates of ten greatest lakes in China using ICESat and Landsat data. Chin. Sci. Bull. 2013, 58, 3815–3829. [Google Scholar] [CrossRef] [Green Version]
- Li, J. Mapping lake level changes using ICESat/GLAS satellite laser altimetry data: A case study in arid regions of central Asia. In Proceedings of the MIPPR 2011: Remote Sensing Image Processing, Geographic Information Systems, and Other Applications, Guilin, China, 23 November 2011; International Society for Optics and Photonics: Bellingham, WA, USA, 2011. [Google Scholar]
- Li, J.; Chen, X.; Bao, A.M. Spatial-temporal Characteristics of Lake Level Changes in Central Asia during 2003–2009. Acta Geogr. Sin. 2011, 66, 1219–1229. [Google Scholar]
- Phan, V.H.; Lindenbergh, R.; Menenti, M. ICESat derived elevation changes of Tibetan lakes between 2003 and 2009. Int. J. Appl. Earth Obs. Geoinf. 2012, 17, 12–22. [Google Scholar] [CrossRef]
- Arendt, A.; Bliss, A.; Bolch, T.; Cogley, J.G.; Gardner, A.S.; Hagen, J.-O.; Hock, R.; Huss, M.; Kaser, G.; Kienholz, C.; et al. Randolph Glacier Inventory—A Dataset of Global Glacier Outlines: Version 5.0: Technical Report; Global Land Ice Measurements from Space: Boulder, CO, USA, 2015. [Google Scholar]
- Gardelle, J.; Berthier, E.; Arnaud, Y.; Kääb, A. Region-wide glacier mass balances over the Pamir-Karakoram-Himalaya during 1999–2011. Cryosphere 2013, 7, 1263–1286. [Google Scholar] [CrossRef] [Green Version]
- Lutz, A.F.; Immerzeel, W.W.; Shrestha, A.B.; Bierkens, M.F.P. Consistent increase in High Asia’s runoff due to increasing glacier melt and precipitation. Nat. Clim. Chang. 2014, 4, 587–592. [Google Scholar] [CrossRef] [Green Version]
- Zhang, R.; Guo, J.; Liang, T.; Feng, Q.; Yusupujiang, A. Comparing interpolation techniques for annual temperature mapping across Xinjiang region. IOP Conf. Ser. Earth Environ. Sci. 2016, 46, 012028. [Google Scholar] [CrossRef] [Green Version]
- Mengistu, D.; Bewket, W.; Dosio, A.; Panitz, H.-J. The water body extraction of Ebinur Lake based on four water indexes and analysis of spatial-temporal changes. J. Yangtze River Sci. Res. Inst. 2022, 1–10. (In Chinese) [Google Scholar]
- Guo, M.; Wu, W.; Zhou, X.; Chen, Y.; Li, J. Investigation of the dramatic changes in lake level of the Bosten Lake in northwestern China. Theor. Appl. Climatol. 2015, 119, 341–351. [Google Scholar] [CrossRef]
- Shi, Y.; Shen, Y.; Kang, E.; Li, D.; Ding, Y.; Zhang, G.; Hu, R. Recent and future climate change in northwest China. Clim. Chang. 2007, 80, 379–393. [Google Scholar] [CrossRef]
- Xie, L. Analysis on the Change of Water Level and Quality in Wulungu Lake. J. Water Resour. Water Eng. 2009, 20, 148–150. [Google Scholar]
- Guo, M.J.; Zhou, H.D.; Li, P. Investigation of the Changes in the Water Level of Bosten Lake in the Past 50 Years. Res. Soil Water Conserv. 2015, 22, 52–57. [Google Scholar]
- Mamattursun, E.; Gulziba, A.; Mardan, A. Water Variation Level Drivers of Bosten Lake Based on Principal Components Analysis. J. Salt Lake Res. 2015, 23, 1–7. [Google Scholar]
- Zhang, T.; Wu, J.F.; Lin, J.; Wu, M.; Zhang, H. Analysis of Water Level Change of Bosten Lake Based on Water Balance. J. China Hydrol. 2015, 35, 78–83. [Google Scholar]
- Ye, B.; Yang, D.; Jiao, K.; Han, T.; Jin, Z.; Yang, H.; Li, Z. The Urumqi River source Glacier No. 1, Tianshan, China: Changes over the past 45 years. Geophys. Res. Lett. 2005, 32, 21. [Google Scholar] [CrossRef]
- Han, T.; Ding, Y.; Ye, B.; Liu, S.; Jiao, K. Mass-balance characteristics of Urumqi glacier no. 1, Tien Shan, China. Ann. Glaciol. 2006, 43, 323–328. [Google Scholar] [CrossRef] [Green Version]
- Jing, Z.; Jiao, K.; Yang, T.; Wang, N.; Li, Z. Mass balance and recession of Urumqi glacier No. 1, Tien Shan, China, over the last 45 years. Ann. Glaciol. 2006, 43, 214–217. [Google Scholar] [CrossRef] [Green Version]
- Liu, S.; Yao, X.; Guo, W.; Xu, J.; Shangguan, D.; Wei, J.; Bao, W.; Wu, L. The contemporary glaciers in China based on the Second Chinese Glacier Inventory. Acta Geogr. Sin. 2015, 70, 3–16. [Google Scholar]
- Yao, J.; Chen, Y.; Zhao, Y.; Guan, X.; Mao, W.; Yang, L. Climatic and associated atmospheric water cycle changes over the Xinjiang, China. J. Hydrol. 2020, 585, 124823. [Google Scholar] [CrossRef]
- Xu, G.; Wei, W. Climate Change of Xinjiang and its Impact on Eco-Enviroment. Arid. Land Geogr. 2004, 27, 14–18. [Google Scholar]
- Ma, Y.; Huang, Y.; Chen, X.; Bao, A. Analyzing spatial-temporal variability of snow cover in Xinjiang. Adv. Water Sci. 2013, 24, 483–489. [Google Scholar]
- Hu, L.; Li, S.; Liang, F. Analysis of the Variation Characteristics of Snow Covers in Xinjiang Region During Recent 50 Years. J. Glaciol. Geocryol. 2013, 35, 793–800. [Google Scholar]
- Lou, M.; Liu, Z.; Lou, S.; Dai, R. Temporal and Spatial Distribution of Snow Cover in Xinjiang from 2002 to 2011. J. Glaciol. Geocryol. 2013, 35, 1095–1102. [Google Scholar]
- Lau, W.K.M.; Kim, M.-K.; Kim, K.-M.; Lee, W.-S. Enhanced surface warming and accelerated snow melt in the Himalayas and Tibetan Plateau induced by absorbing aerosols. Environ. Res. Lett. 2010, 5, 025204. [Google Scholar] [CrossRef]
- Ye, B.; Ding, Y.; Kang, E.; Li, G.; Han, T. Response of the snowmelt and glacier runoff to the climate warming-up in the last 40 years in Xinjiang Autonomous Region, China. Sci. China Ser. D-Earth Sci. 1999, 42, 44–51. [Google Scholar] [CrossRef]
- Song, C.; Huang, B.; Richards, K.; Ke, L.; Hien Phan, V. Accelerated lake expansion on the Tibetan Plateau in the 2000s: Induced by glacial melting or other processes? Water Resour. Res. 2014, 50, 3170–3186. [Google Scholar] [CrossRef] [Green Version]
- Zhang, J.; Zhou, J.; Zhang, G.; Ji, Y.; Zeng, Y.; Fan, W.; Aikelamu, A. Climate-and human-driven variations in lake area and number in North Xinjiang, China. Int. J. Remote Sens. 2021, 42, 469–485. [Google Scholar] [CrossRef]
- Zhang, J.; Ding, J.; Wu, P.; Tan, J.; Huang, S.; Teng, D.; Cao, X.; Wang, J.; Chen, W. Assessing arid inland lake watershed area and vegetation response to multiple temporal scales of drought across the Ebinur Lake Watershed. Sci. Rep. 2020, 10, 1–71354. [Google Scholar] [CrossRef] [PubMed]
- Gao, F.; He, B.; Yan, Z.; Xue, S.; Li, Y. Analysis of the changes and driving force of the water area in the Ulungur Lake over the past 40 years. J. Water Supply Res. Technol.-Aqua 2020, 69, 500–511. [Google Scholar] [CrossRef]
- Li, Y.; Hu, L.; Zhao, Y.; Wang, H.; Huang, X.; Chen, G.; Leppänen, J.J.; Fontana, L.; Ren, L.; Zhao, H. Meltwater-driven water-level fluctuations of Bosten Lake in arid China over the past 2000 years. Geophys. Res. Lett. 2021, 48, e2020GL090988. [Google Scholar]
| Publisher’s Note: MDPI stays neutral with regard to jurisdictional claims in published maps and institutional affiliations. |
© 2022 by the authors. Licensee MDPI, Basel, Switzerland. This article is an open access article distributed under the terms and conditions of the Creative Commons Attribution (CC BY) license (https://creativecommons.org/licenses/by/4.0/).


