
Hydrogeochemistry Characteristics of Groundwater in the Nandong Karst Water System, China

Abstract
:1. Introduction
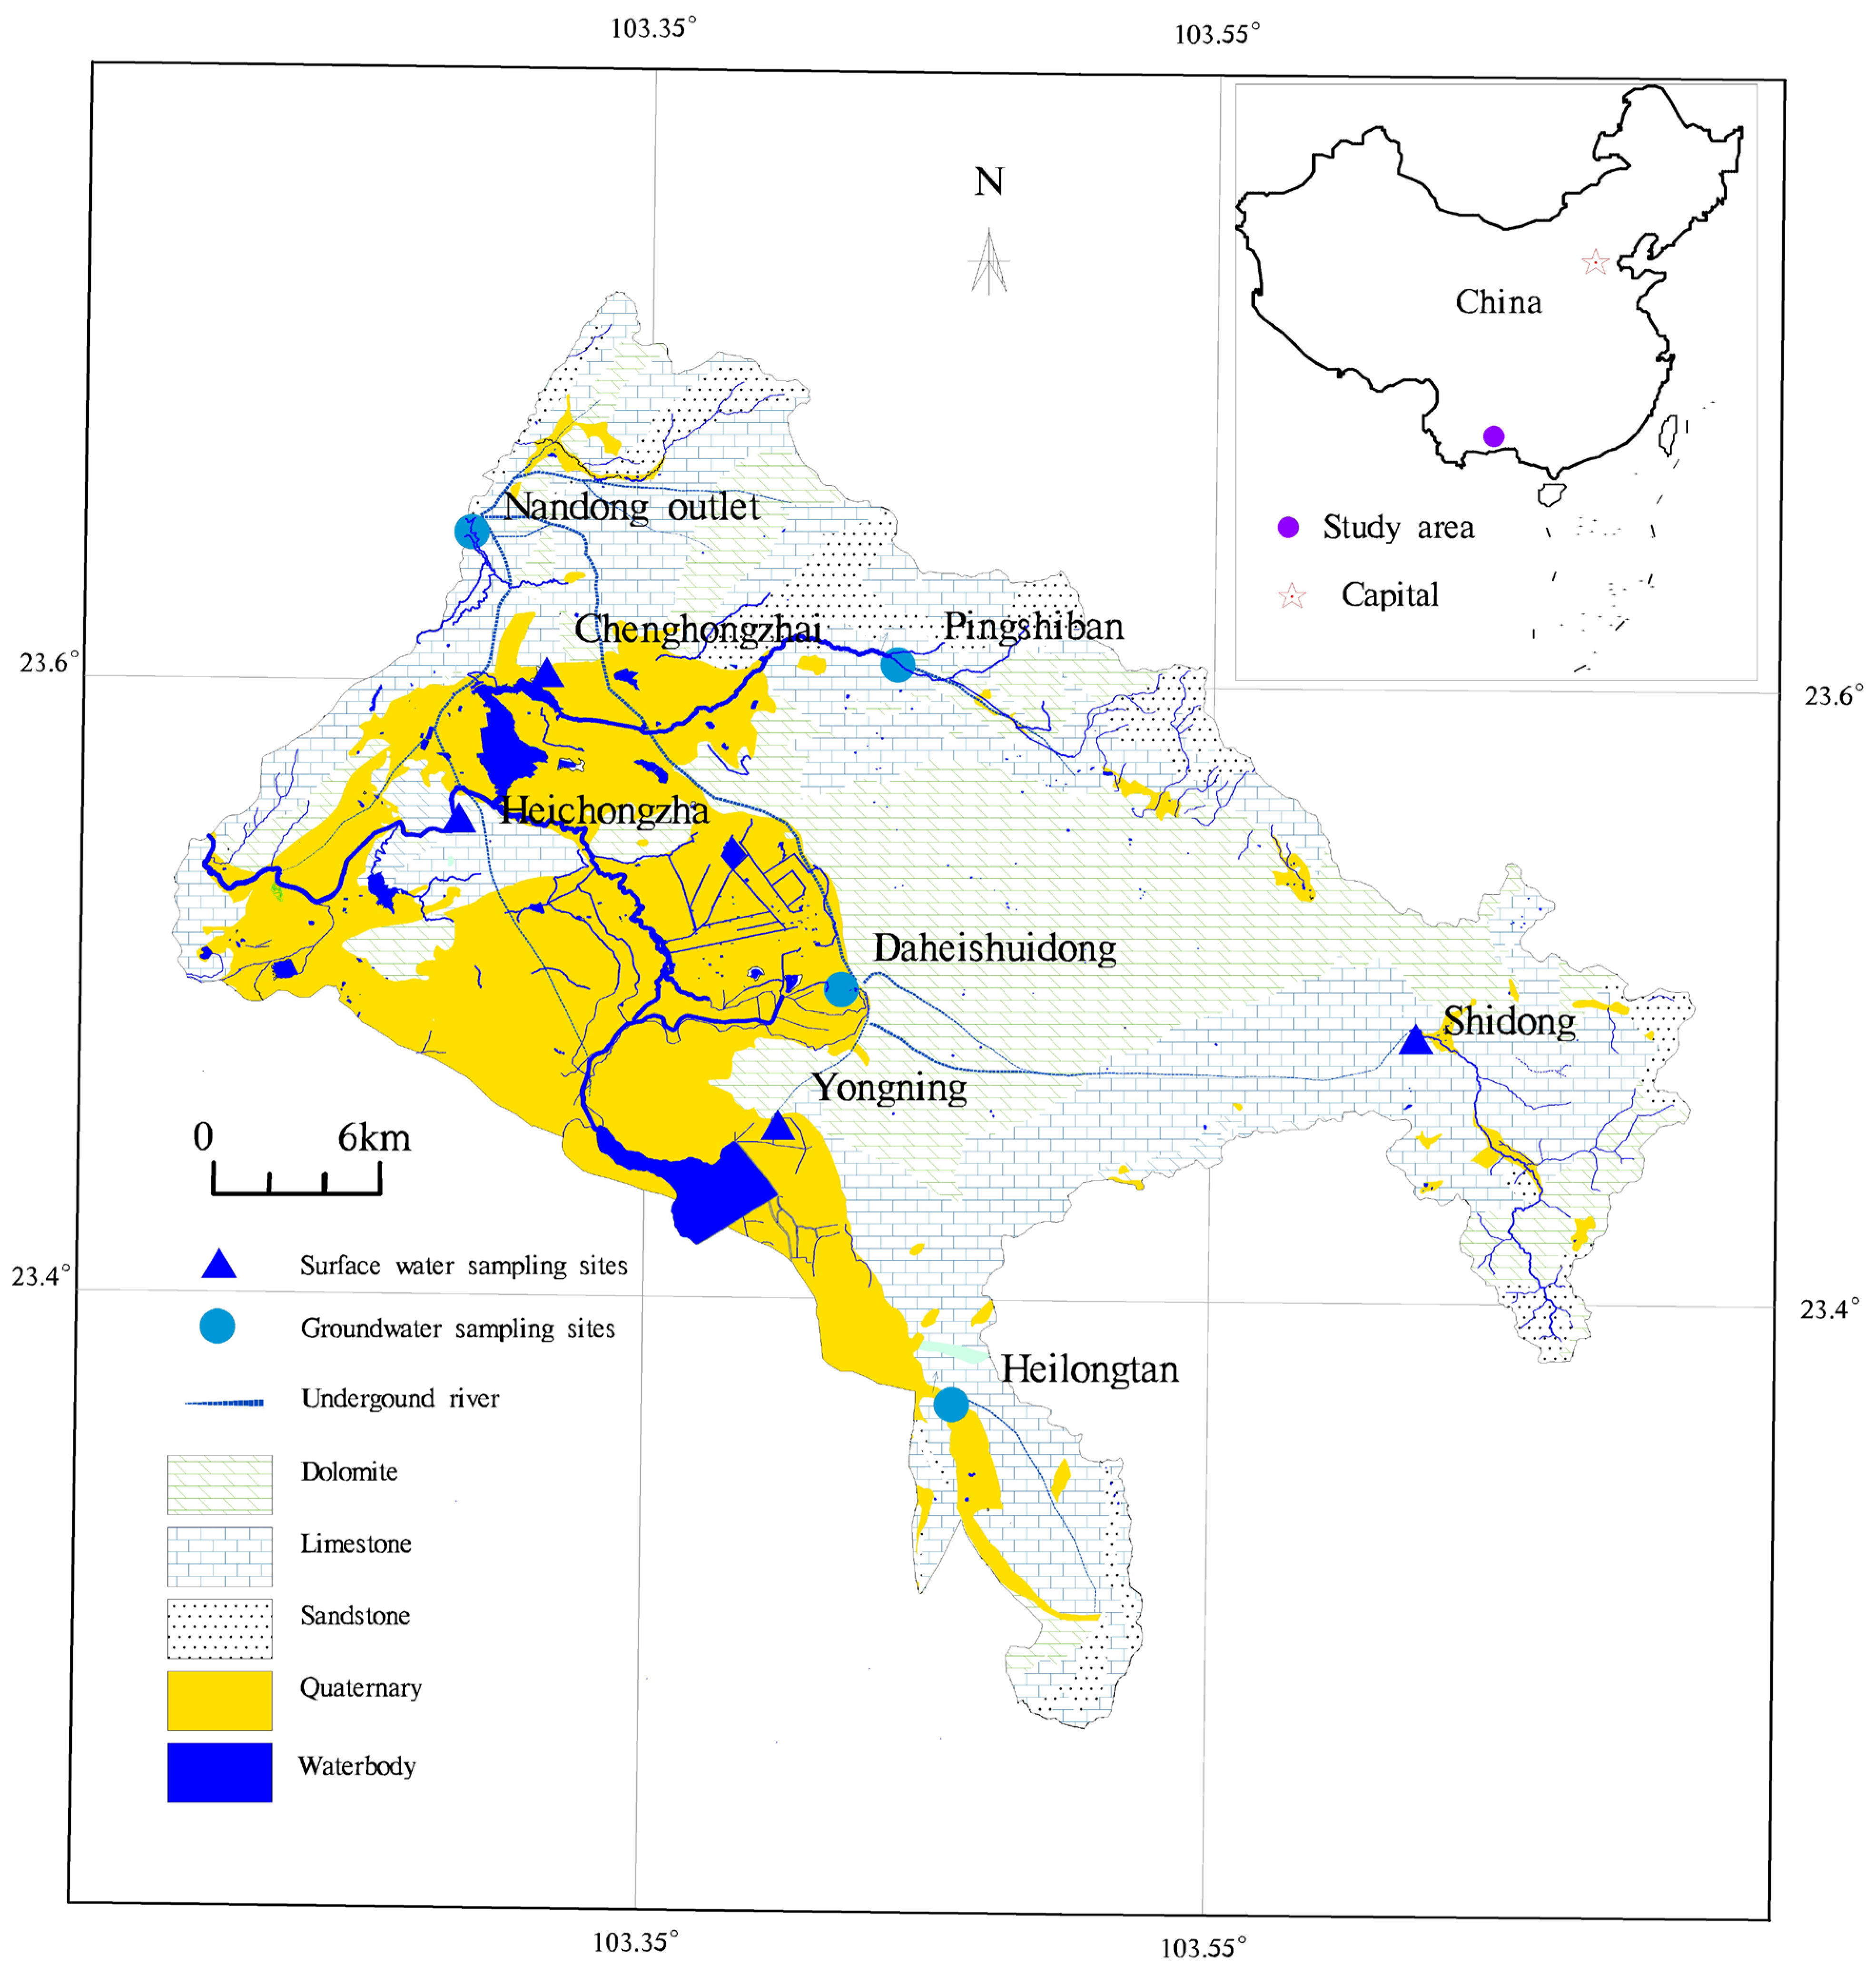
2. Study Area
2.1. Geological and Hydrogeological Setting
2.2. Rainfall
3. Methods
3.1. Sampling and Analytical Procedures
3.2. Pollution Evaluation
4. Results
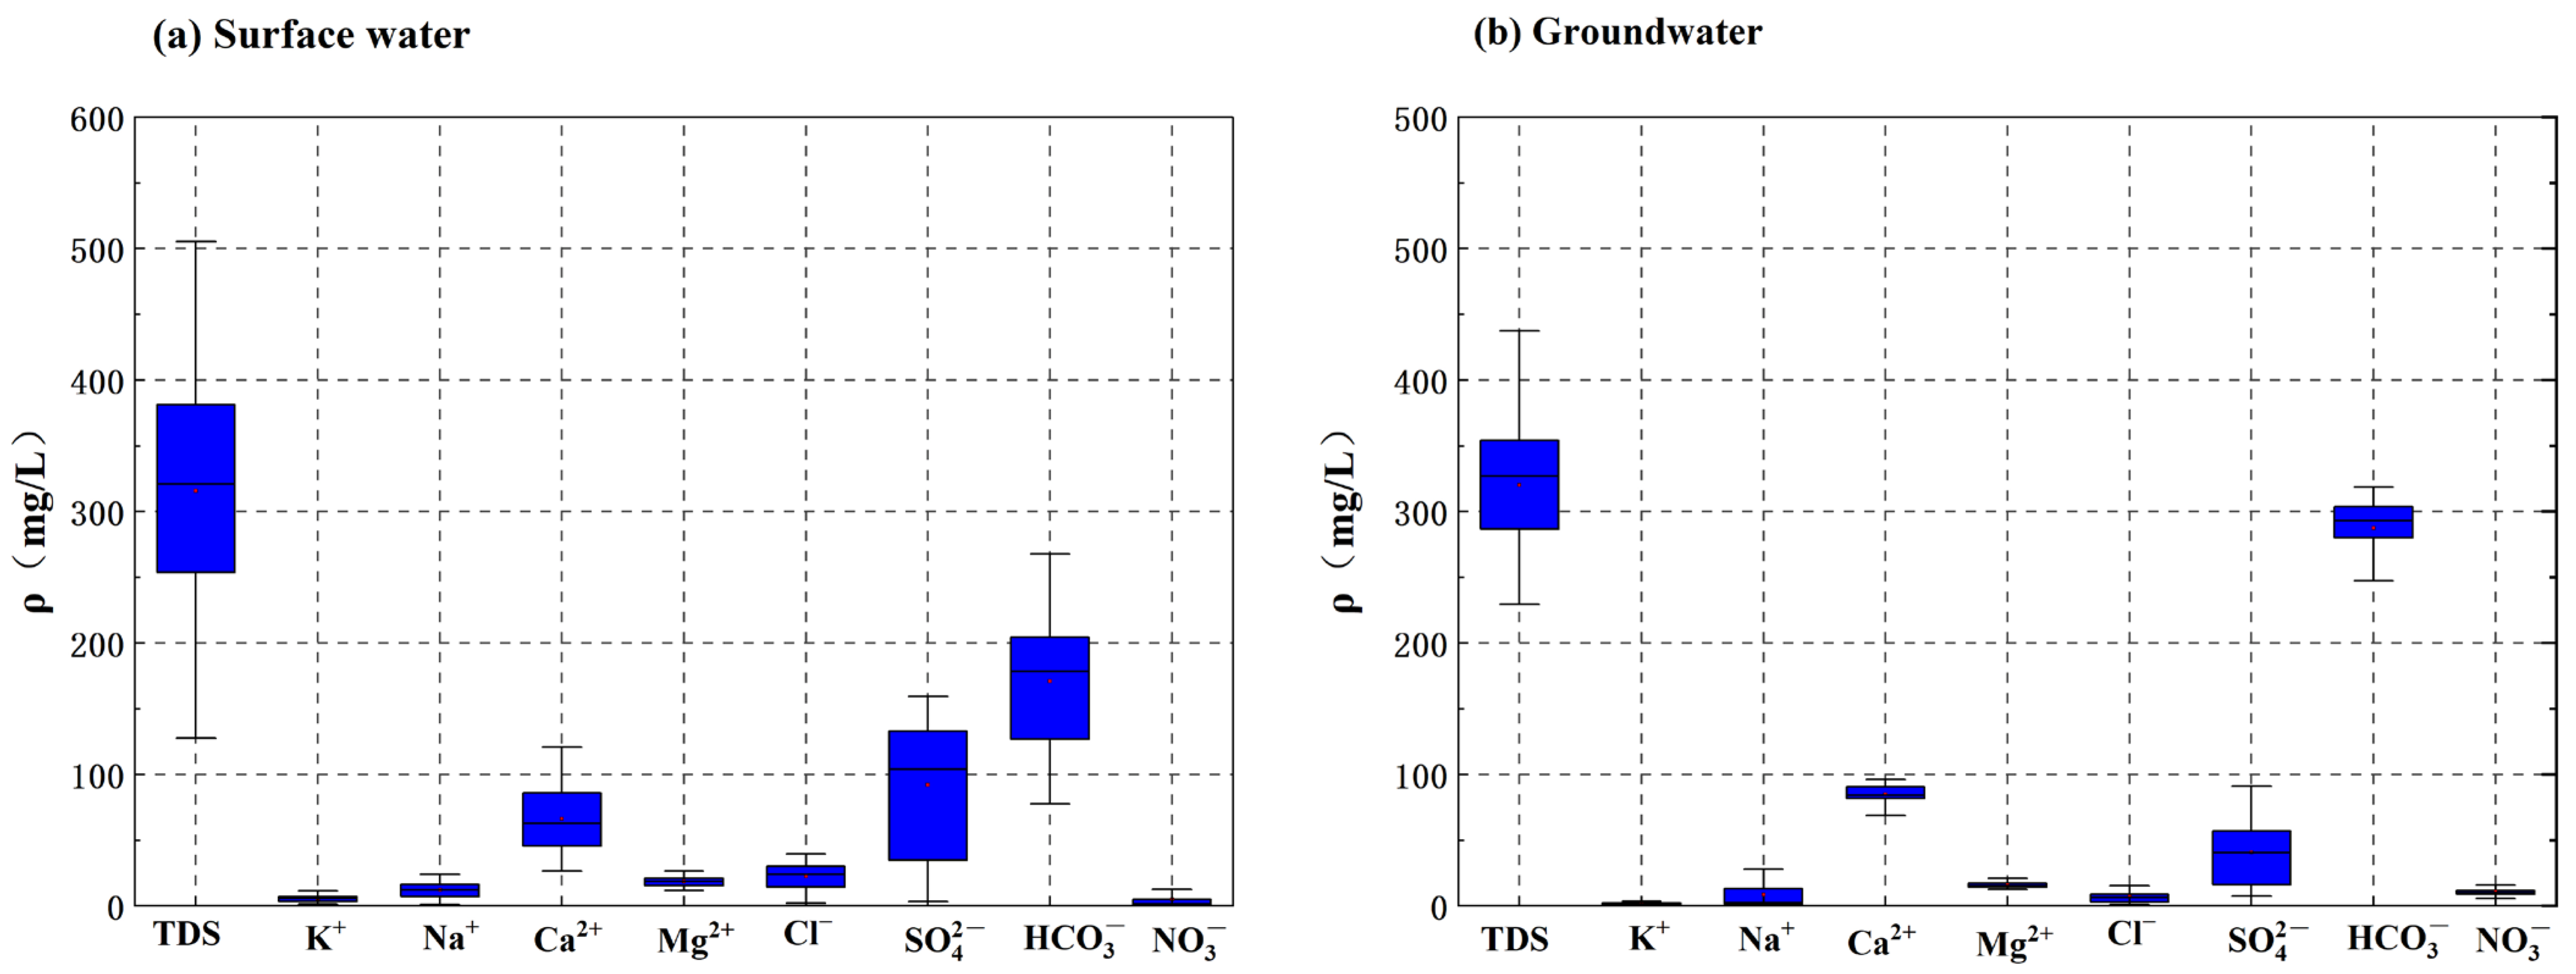
4.1. Water Chemical Characteristics of Groundwater
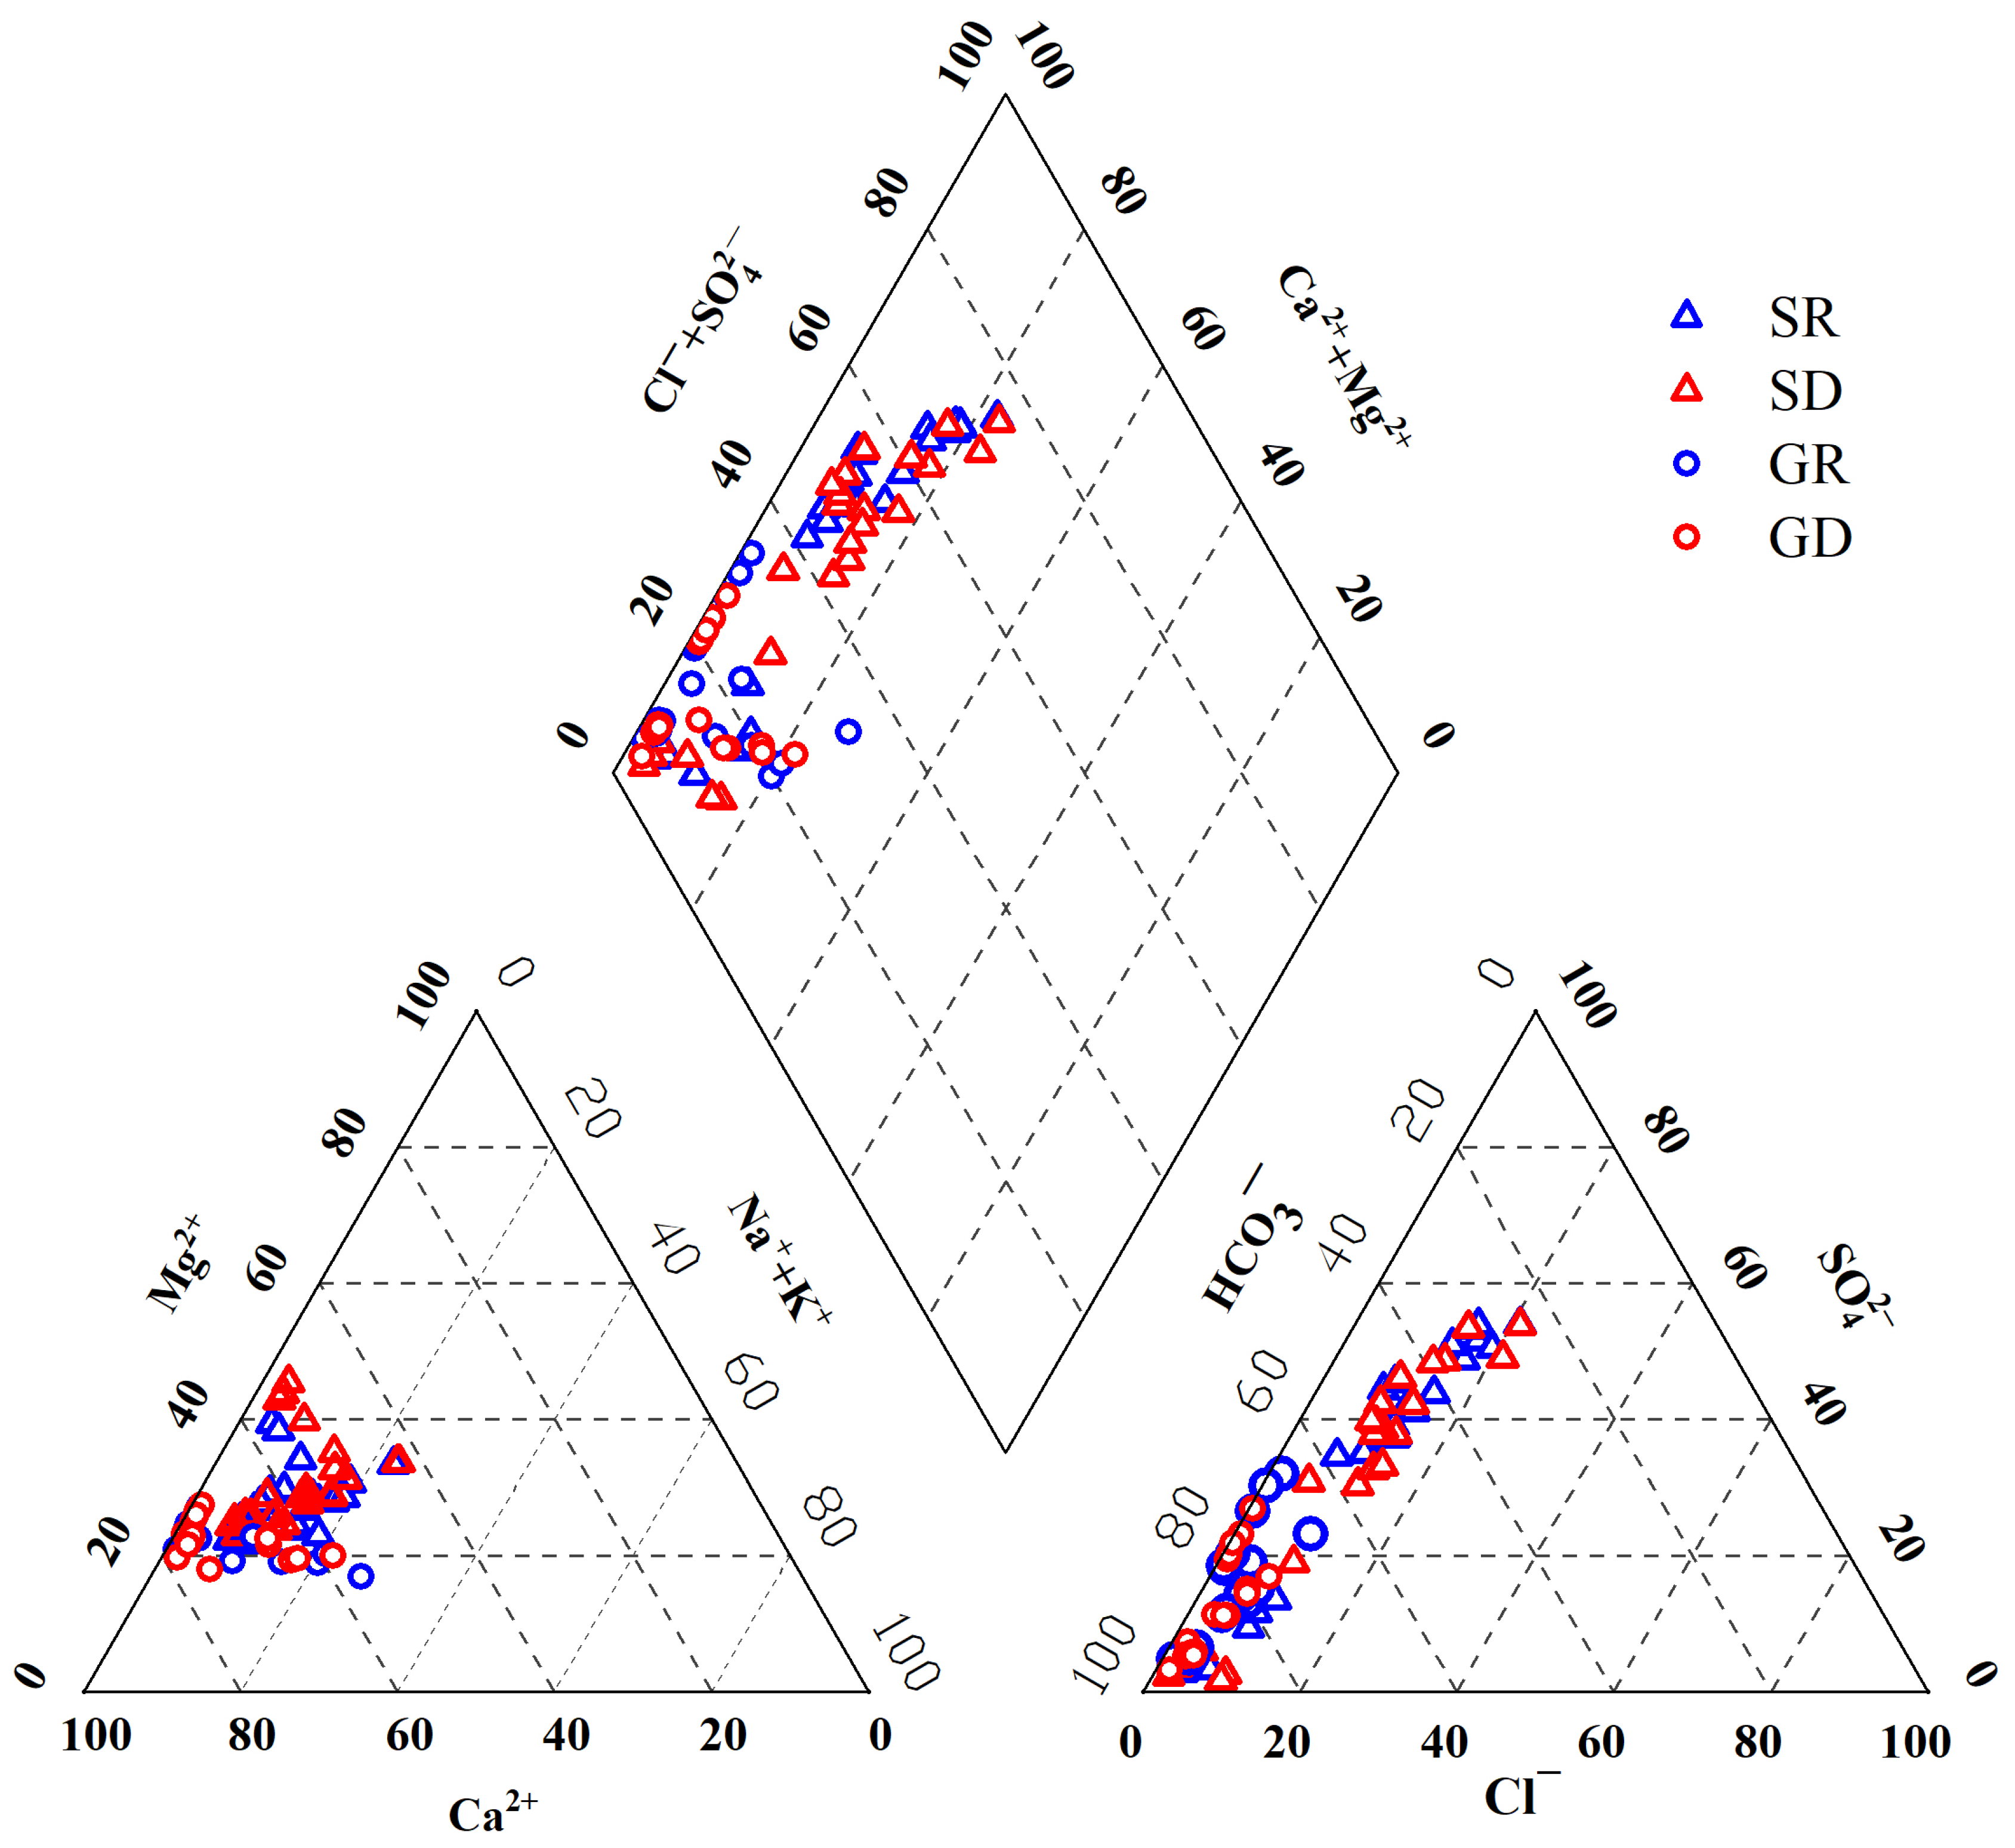
4.2. Water Chemistry Type
5. Discussion
5.1. Correlation between Different Ions
5.2. Multivariate Statistical Analysis
5.3. Natural Environmental Influences
5.3.1. Atmospheric Precipitation
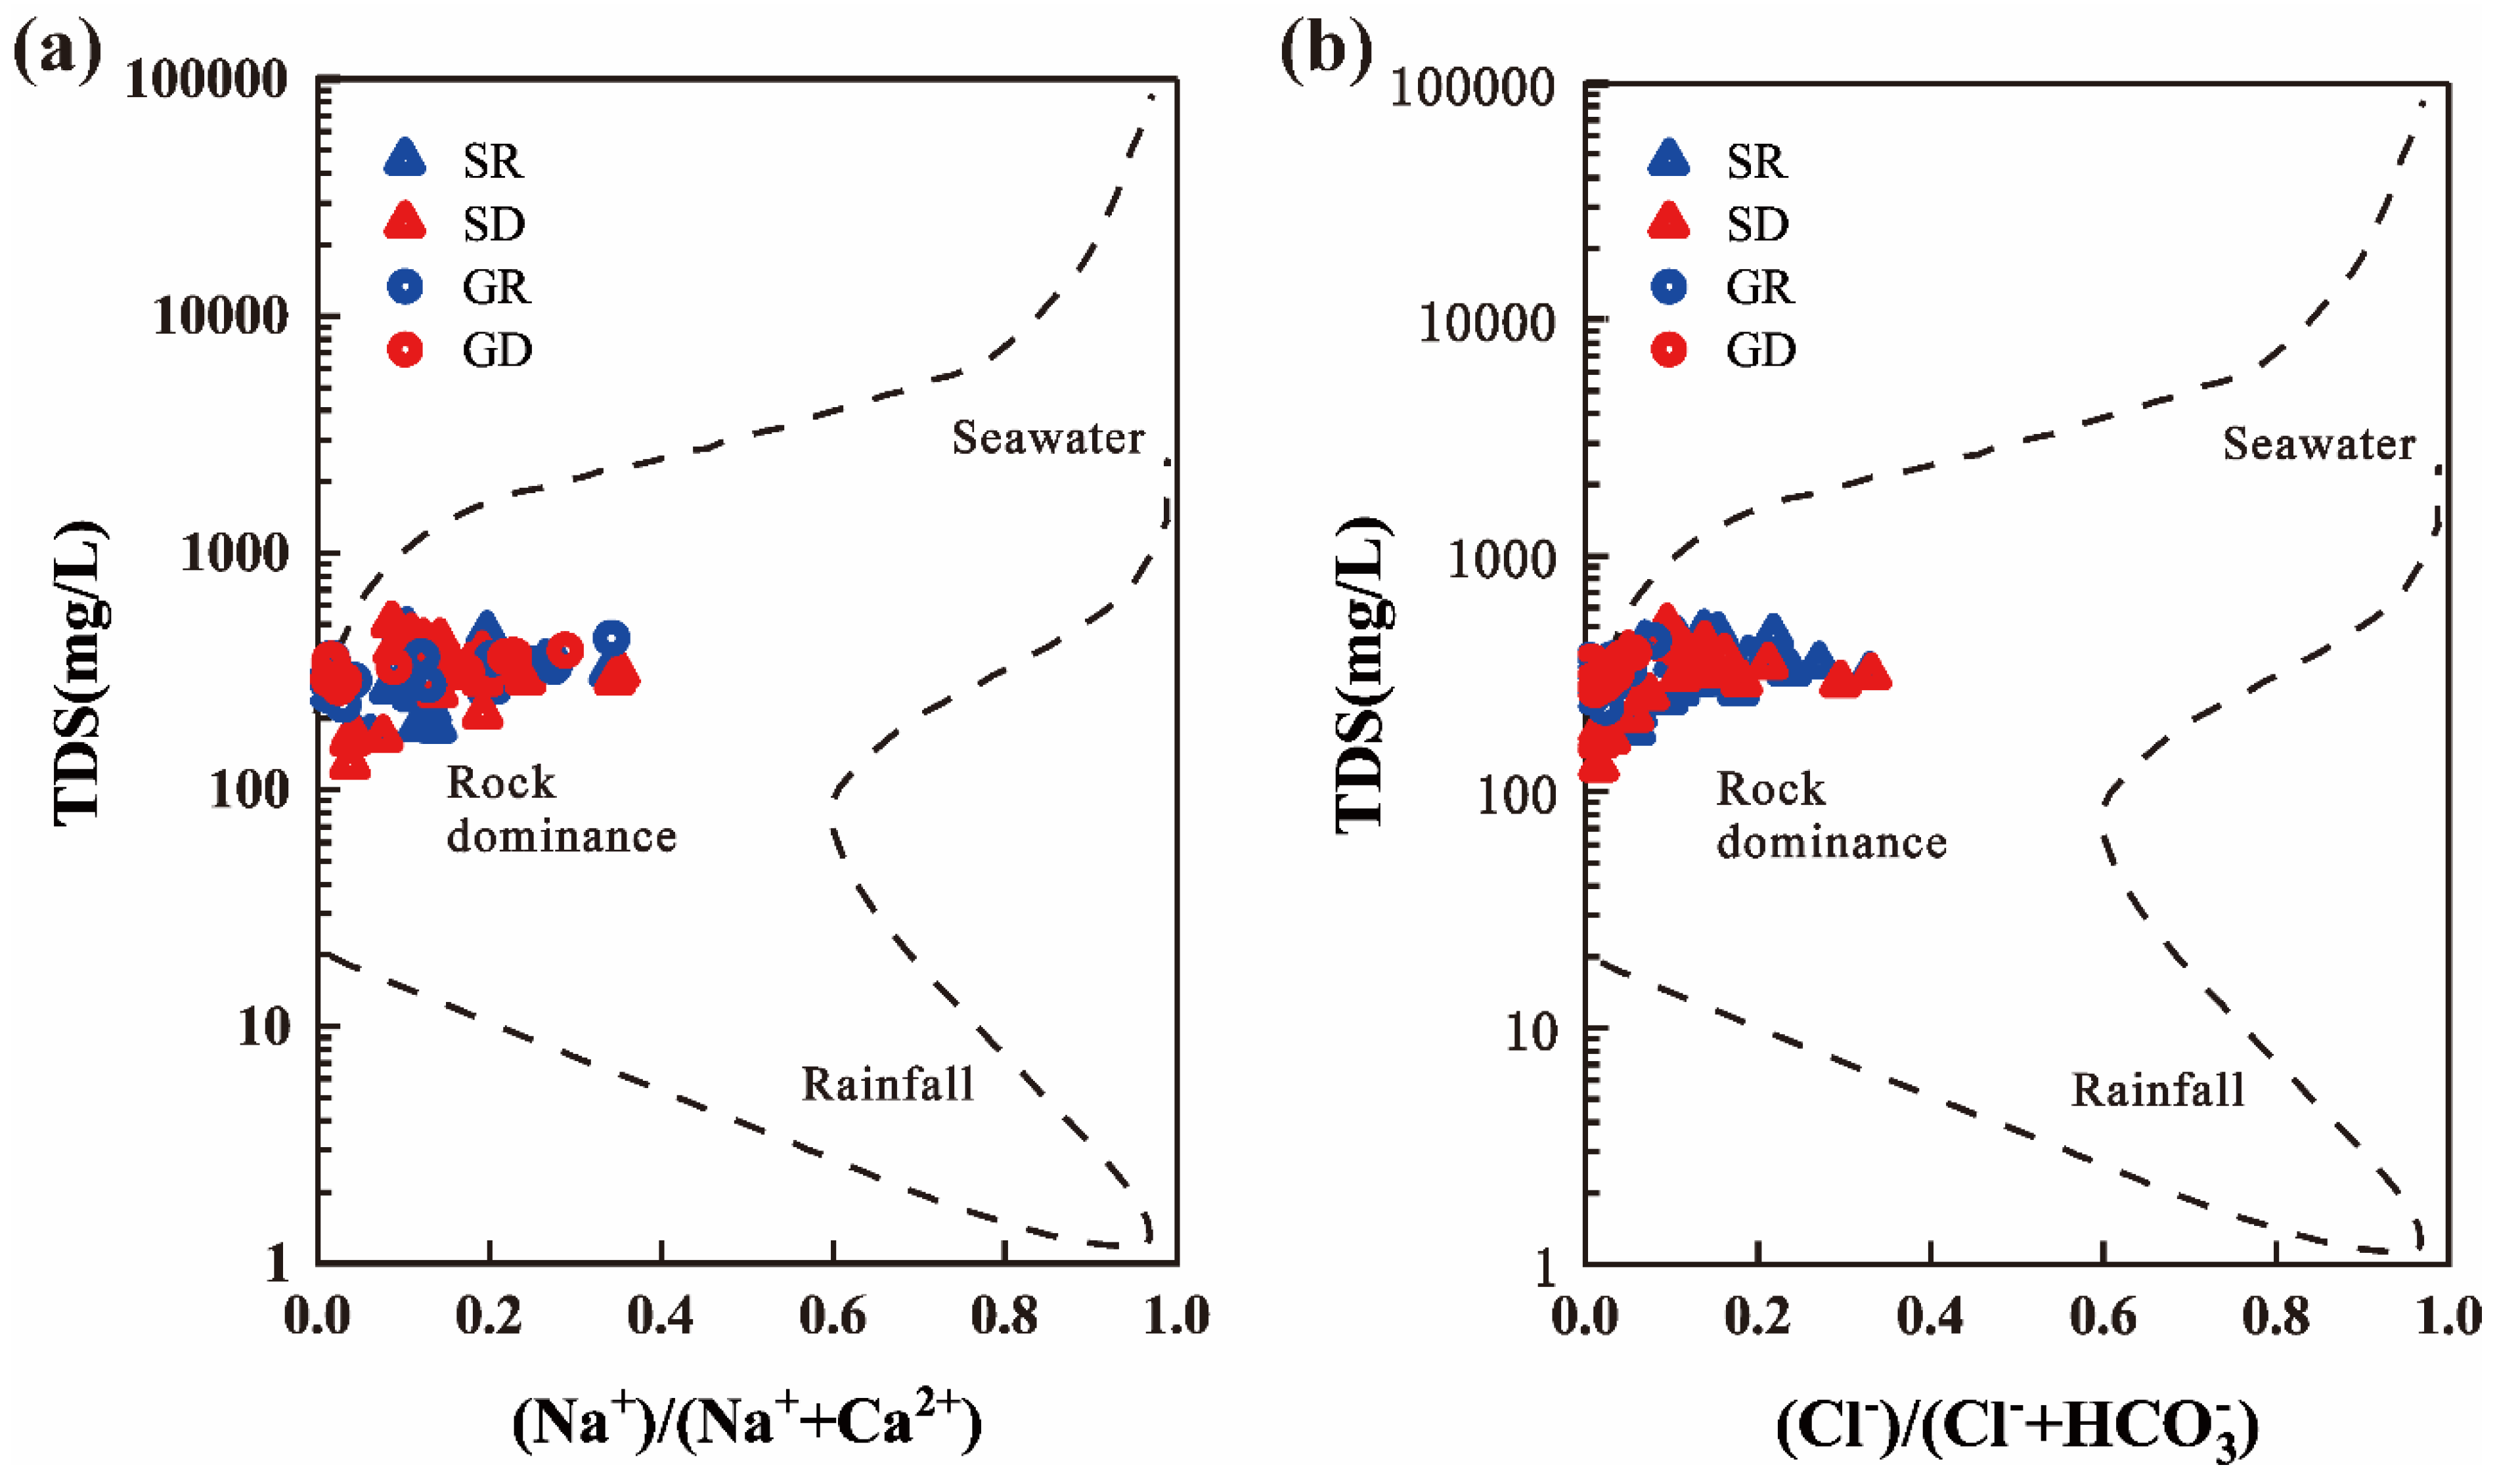
5.3.2. Major Natural Mechanisms Controlling Water Chemistry
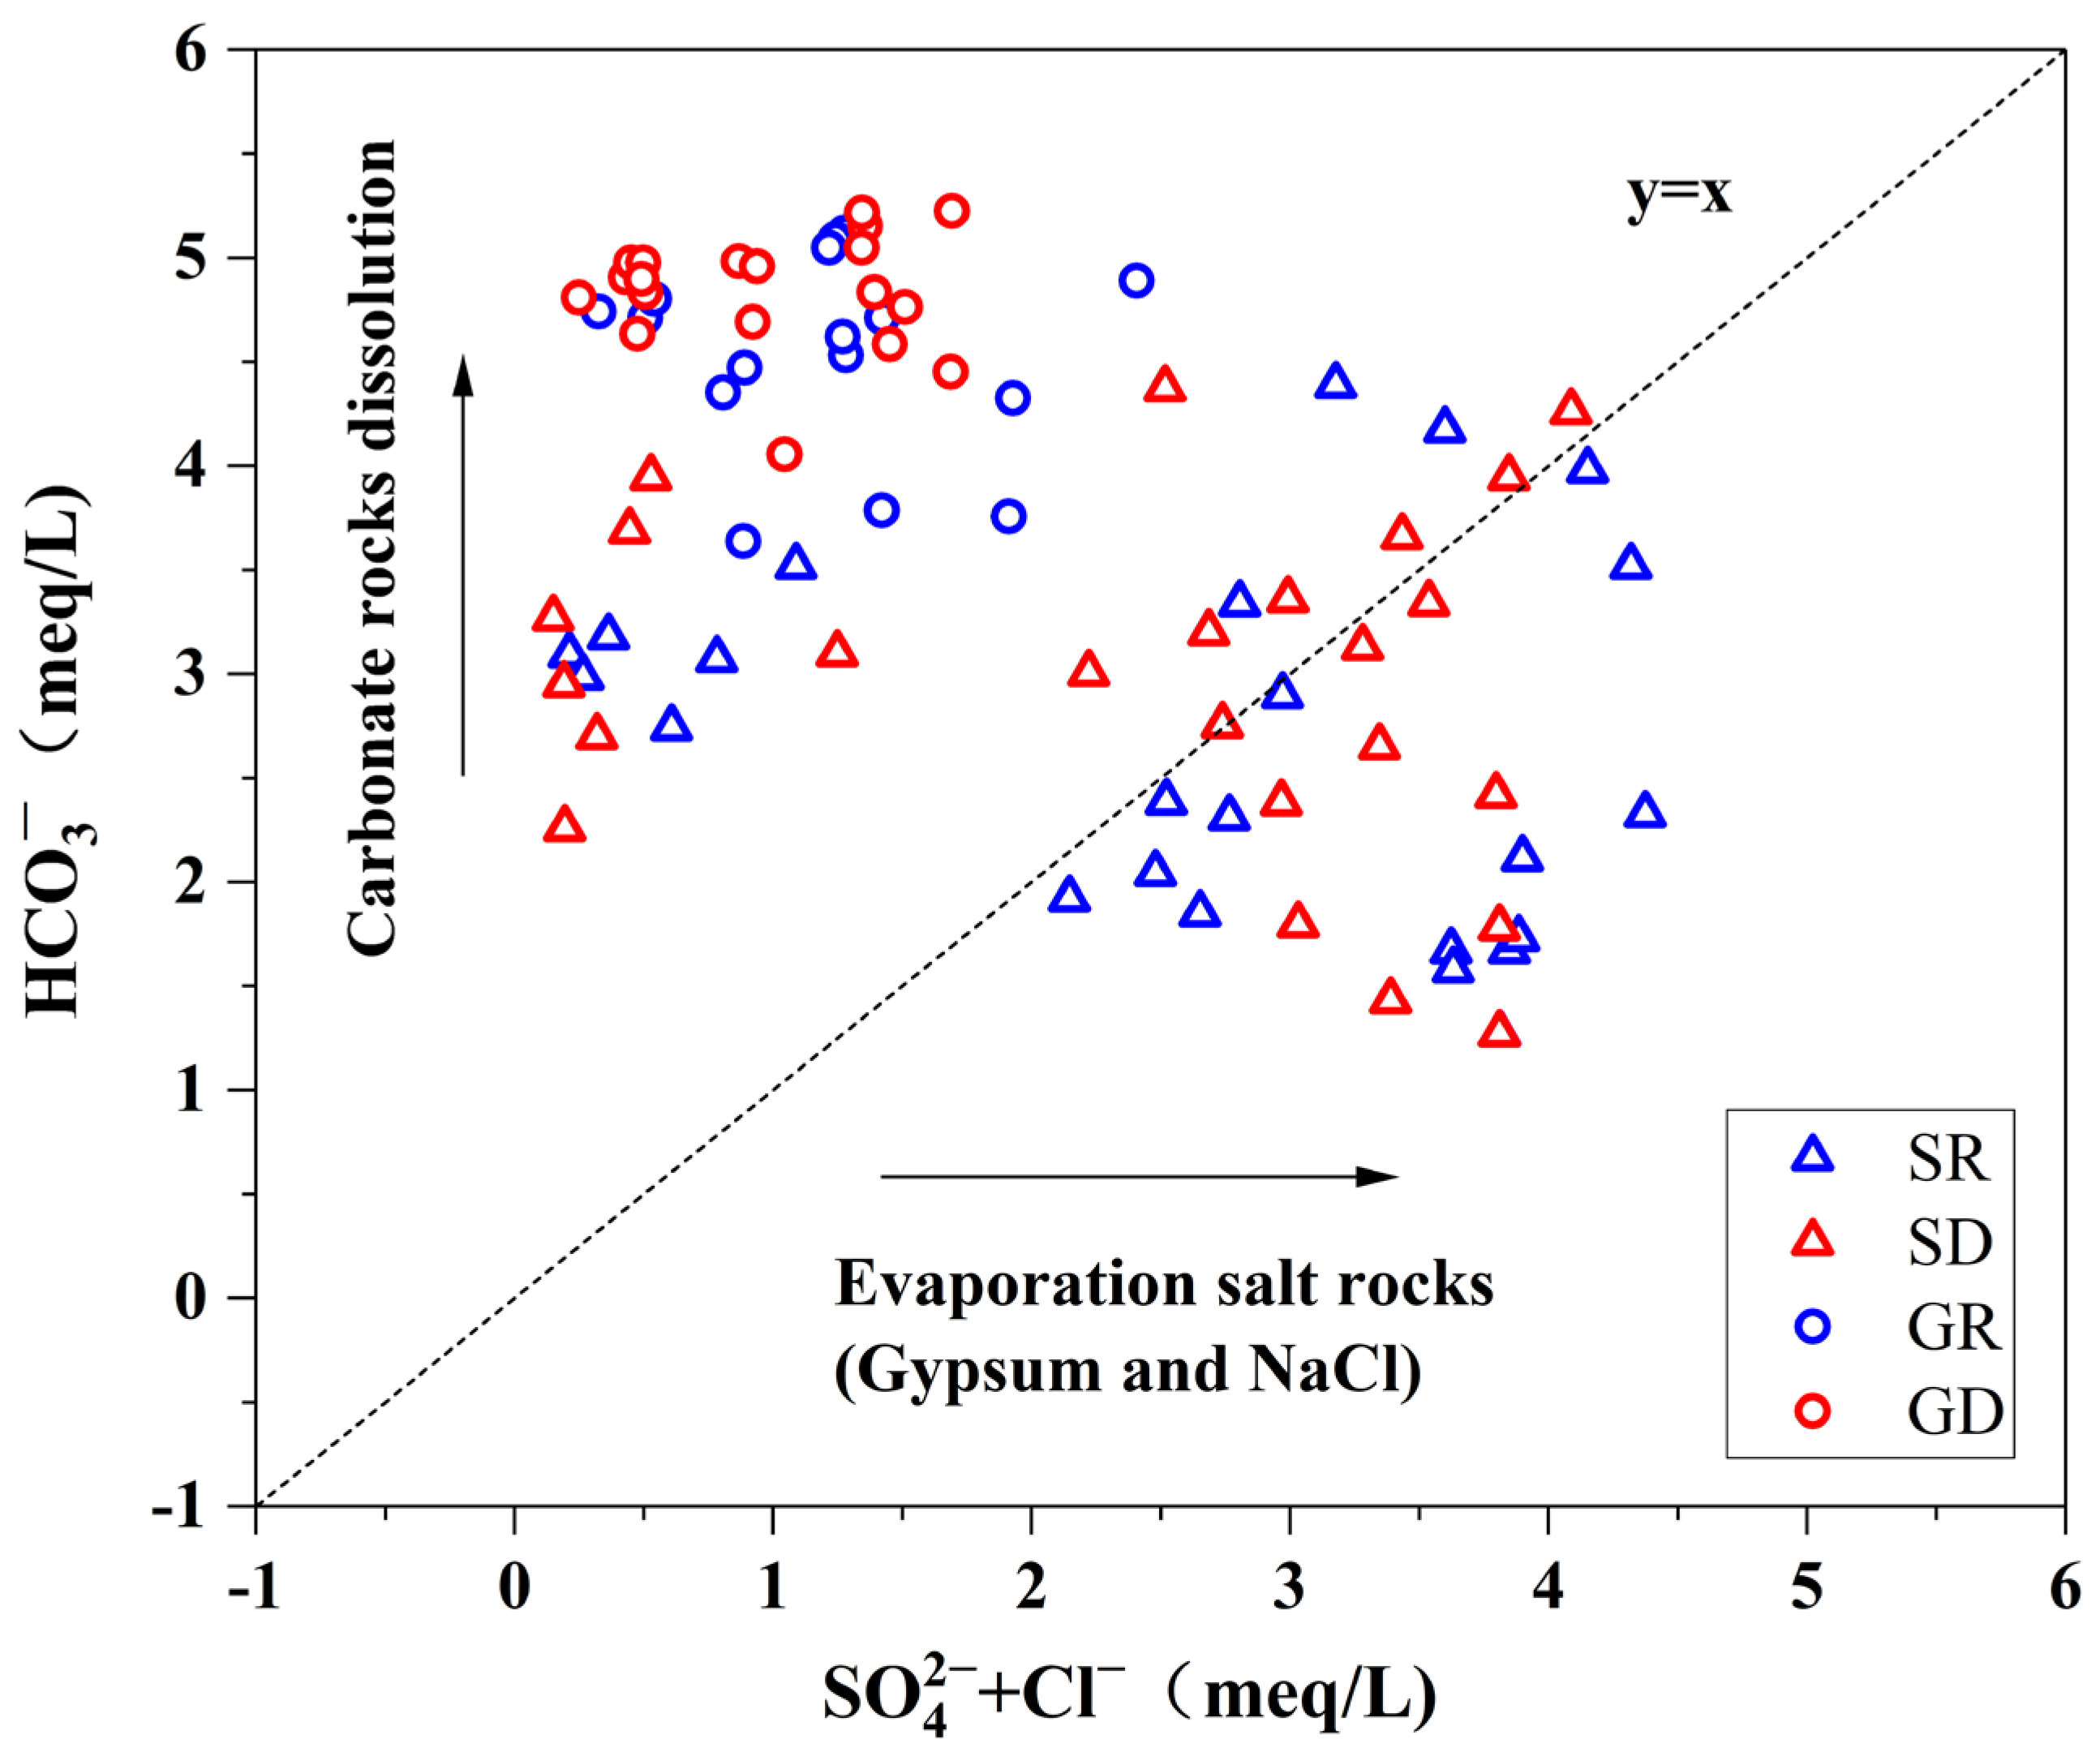
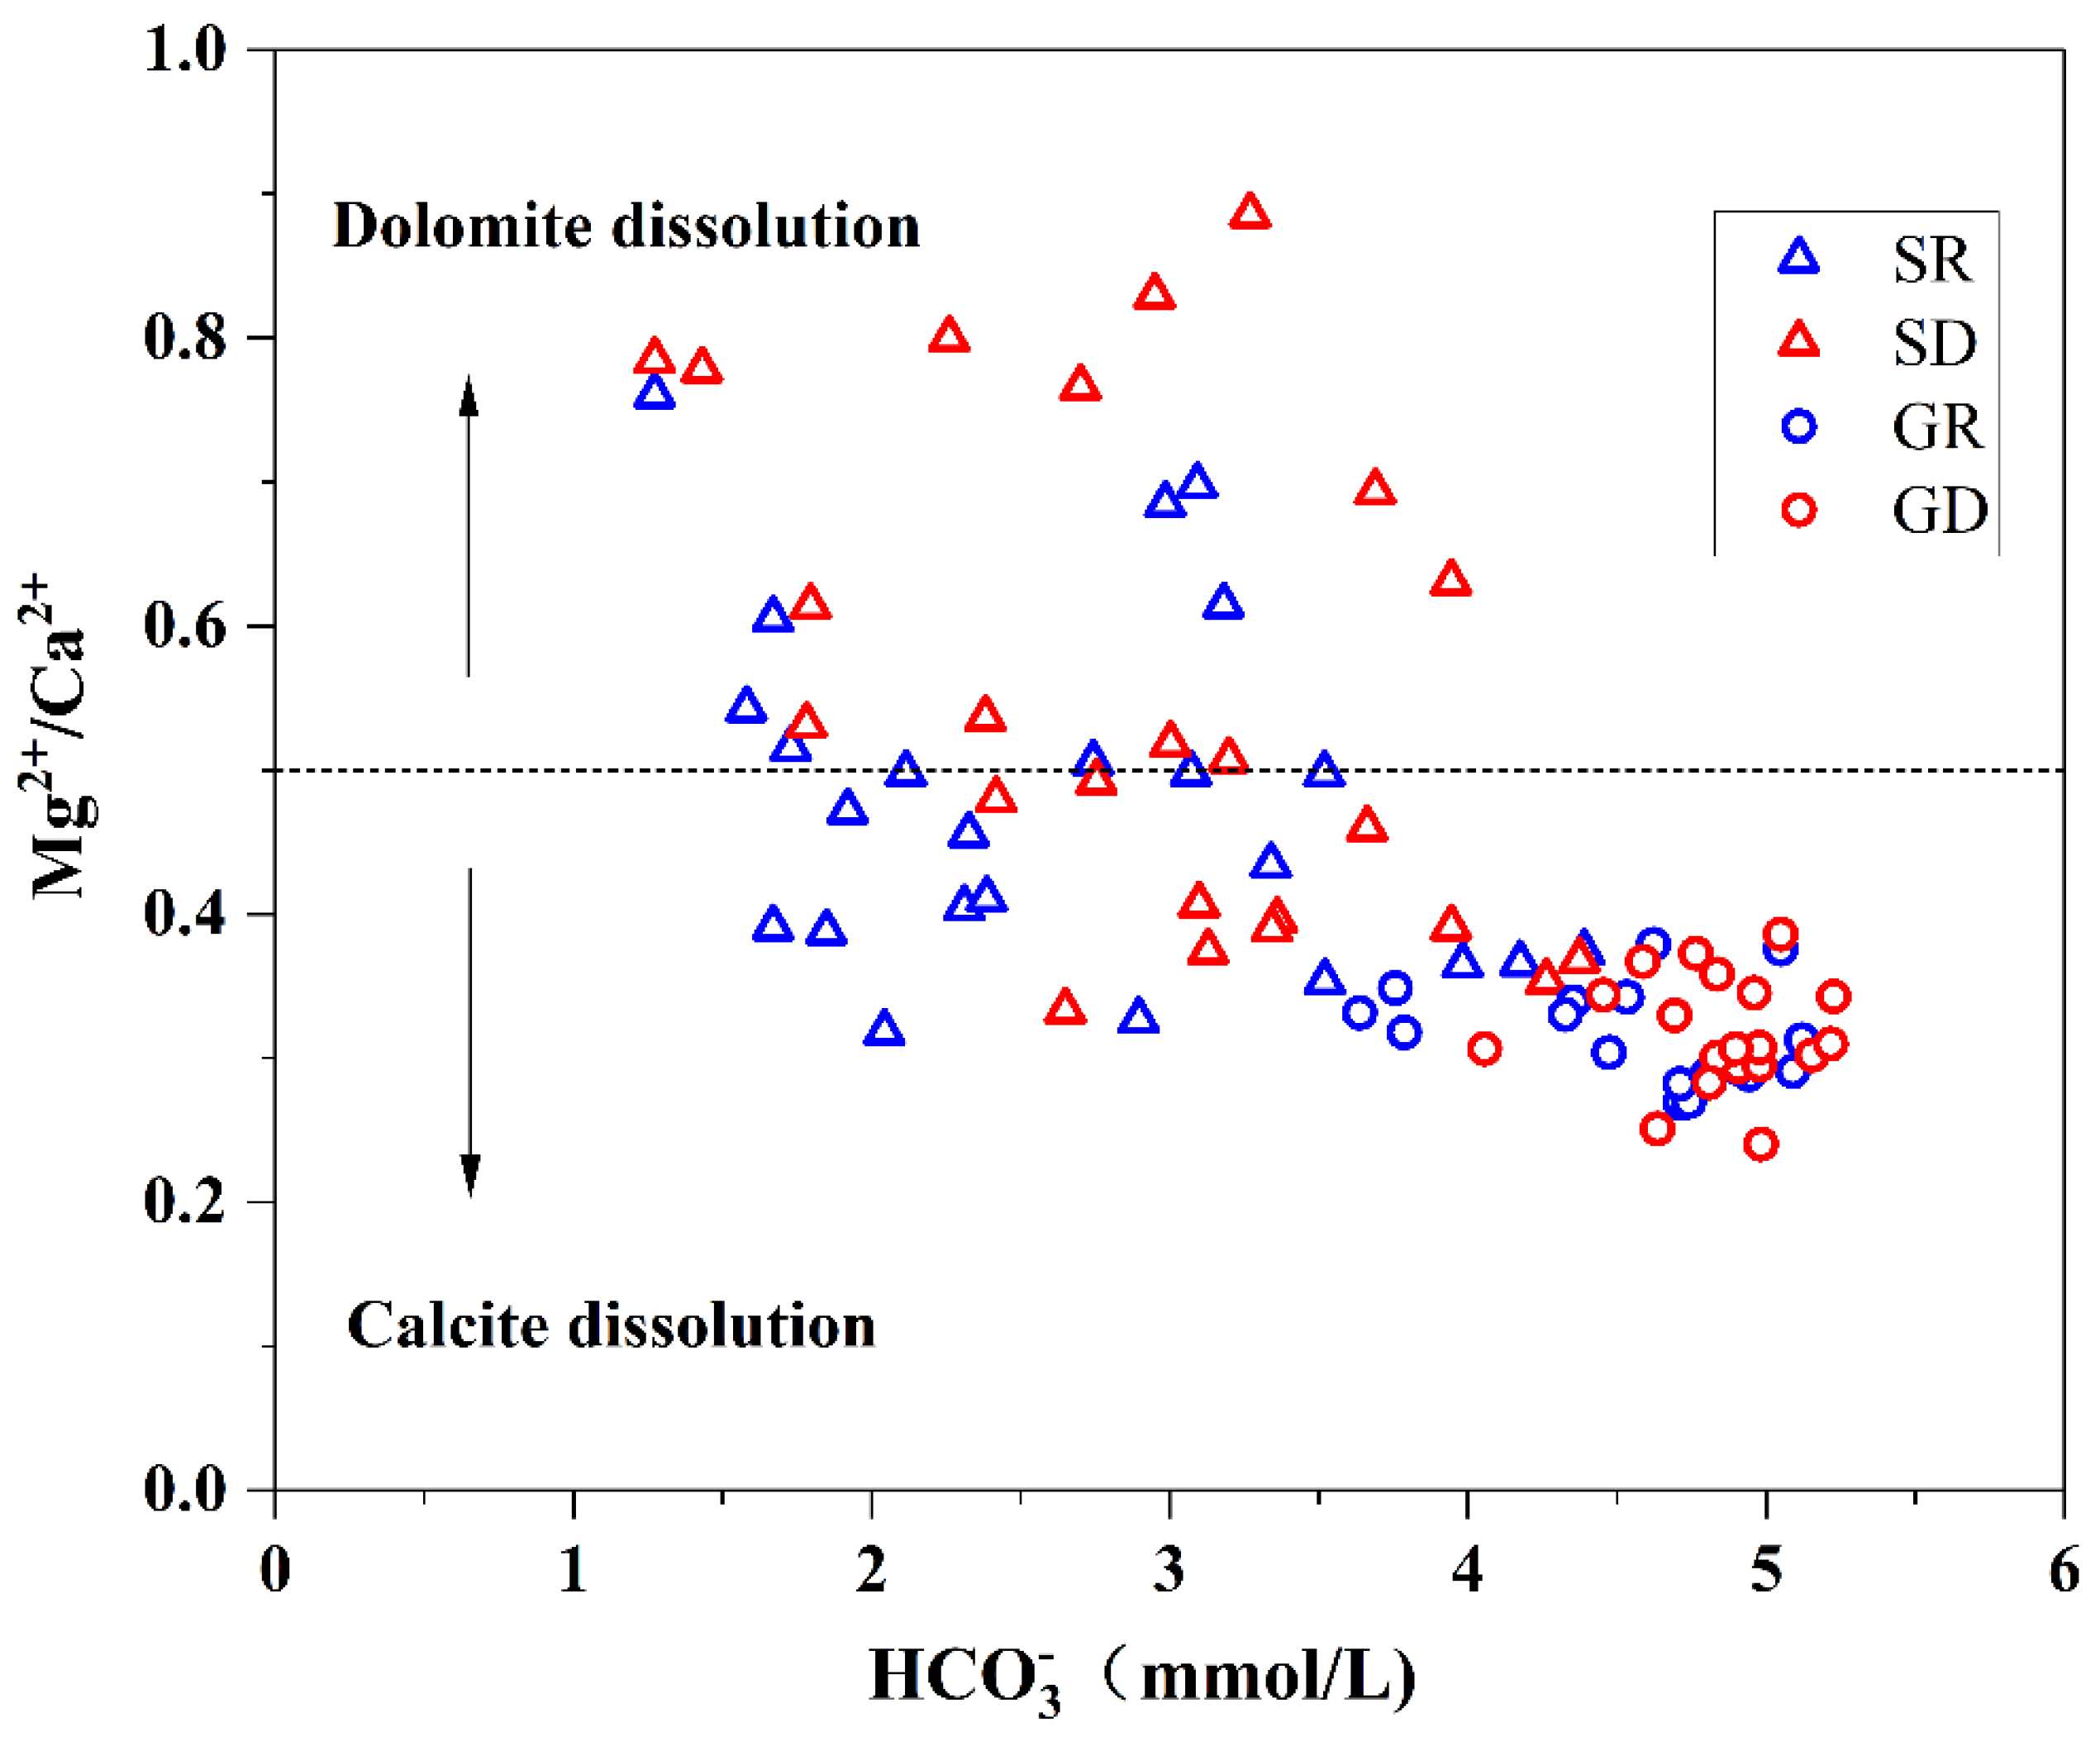
5.3.3. Water-Rock Interactions
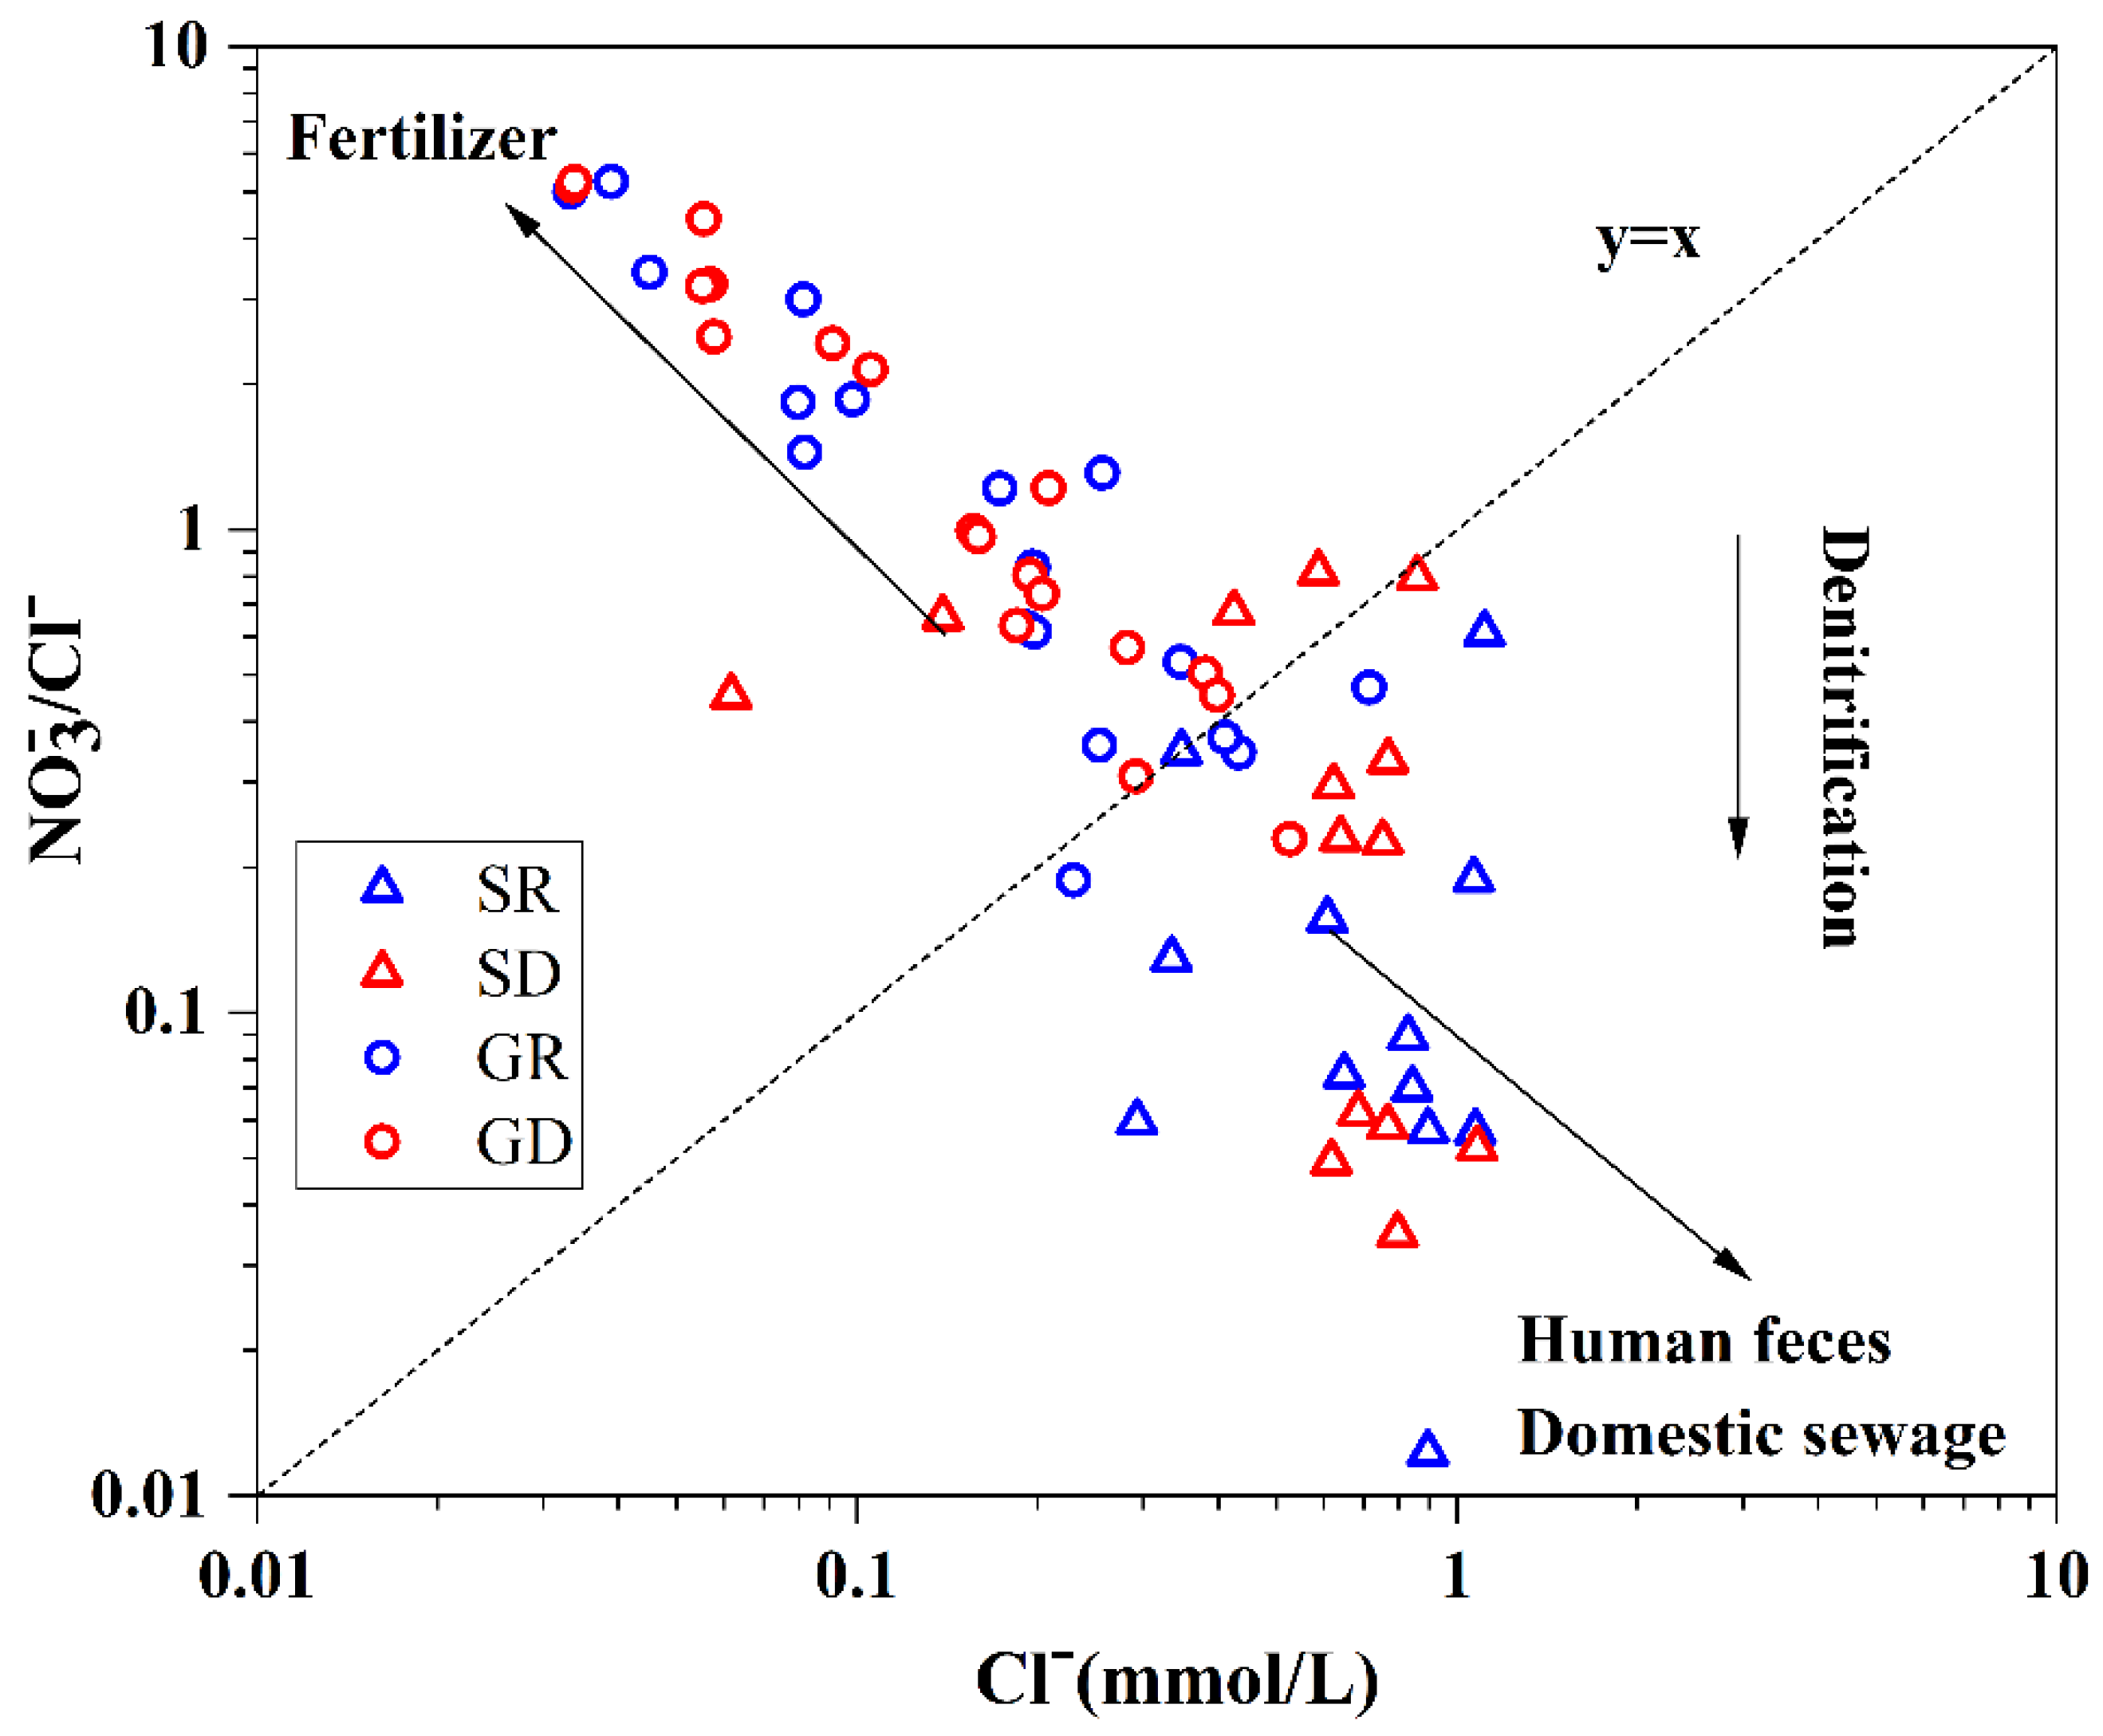
5.4. Effects of Human Activities
6. Conclusions
Author Contributions
Funding
Institutional Review Board Statement
Informed Consent Statement
Data Availability Statement
Acknowledgments
Conflicts of Interest
References
- Jiang, Y.; Wu, Y.; Groves, C.; Yuan, D.; Kambesis, P. Natural and Anthropogenic Factors Affecting the Groundwater Quality in the Nandong Karst Underground River System in Yunan, China. J. Contam. Hydrol. 2009, 109, 49–61. [Google Scholar] [CrossRef] [PubMed]
- Yu, Y.; Zhao, W.; Martinez-Murillo, J.F.; Pereira, P. Loess Plateau: From Degradation to Restoration. Sci. Total Environ. 2020, 738, 140206. [Google Scholar] [CrossRef] [PubMed]
- Wang, Z.; Yin, J.-J.; Pu, J.; Wang, P.; Liang, X.; Yang, P.; He, Q.; Gou, P.; Yuan, D. Integrated Understanding of the Critical Zone Processes in a Subtropical Karst Watershed (Qingmuguan, Southwestern China): Hydrochemical and Isotopic Constraints. Sci. Total Environ. 2020, 749, 141257. [Google Scholar] [CrossRef] [PubMed]
- Li, C.; Gao, X.; Wang, W.; Zhang, X.; Zhang, X.; Jiang, C.; Wang, Y. Hydro-Biogeochemical Processes of Surface Water Leakage into Groundwater in Large Scale Karst Water System: A Case Study at Jinci, Northern China. J. Hydrol. 2020, 596, 125691. [Google Scholar] [CrossRef]
- Qin, W.; Han, D.; Song, X.; Liu, S. Environmental Isotopes (Δ18O, Δ2H, 222Rn) and Hydrochemical Evidence for Understanding Rainfall-Surface Water-Groundwater Transformations in a Polluted Karst Area. J. Hydrol. 2021, 592, 125748. [Google Scholar] [CrossRef]
- Li, Y.; Jiang, Z.; Chen, Z.; Yu, Y.; Lan, F.; Shan, Z.; Sun, Y.; Liu, P.; Tang, X.; Rodrigo-Comino, J. Anthropogenic Disturbances and Precipitation Affect Karst Sediment Discharge in the Nandong Underground River System in Yunnan, Southwest China. Sustainability 2020, 12, 3006. [Google Scholar] [CrossRef] [Green Version]
- Liu, R.; Wang, J.; Zhan, H.; Chen, Z.; Li, W.; Yang, D.; Zheng, S. Influence of Thick Karst Vadose Zone on Aquifer Recharge in Karst Formations. J. Hydrol. 2021, 592, 125791. [Google Scholar] [CrossRef]
- Parise, M.; De Waele, J.; Gutierrez, F. Current Perspectives on the Environmental Impacts and Hazards in Karst. Environ. Geol. 2009, 58, 235–237. [Google Scholar] [CrossRef]
- Jiang, Z.; Lian, Y.; Qin, X. Rocky Desertification in Southwest China: Impacts, Causes, and Restoration. Earth Sci. Rev. 2014, 132, 1–12. [Google Scholar] [CrossRef]
- Li, Y.; Jiang, Z.; Yu, Y.; Shan, Z.; Lan, F.; Yue, X.; Liu, P.; Gyasi-Agyei, Y.; Rodrigo-Comino, J. Evaluation of Soil Erosion and Sediment Deposition Rates by the 137Cs Fingerprinting Technique at Different Hillslope Positions on a Catchment. Environ. Monit. Assess. 2020, 192, 717. [Google Scholar] [CrossRef]
- Lan, F.; Qin, X.; Jiang, Z.; Meng, R.; Mo, R.; Yang, S.; Wang, W.; An, S. Influences of Land Use/Land Cover on Hydrogeochemical Indexes of Karst Groundwater in the Dagouhe Basin, Southwest China: Influences of Land Use/Land Cover on Underground Hydrogeochemistry. Clean Soil Air Water 2015, 43, 683–689. [Google Scholar] [CrossRef]
- Helena, B. Temporal Evolution of Groundwater Composition in an Alluvial Aquifer (Pisuerga River, Spain) by Principal Component Analysis. Water Res. 2000, 34, 807–816. [Google Scholar] [CrossRef]
- Luo, F.; Wu, G.; Wang, C.; Zhang, L. Application of Nemerow pollution index method and Single factor evaluation method in water quality evaluation. Environ. Sustain. Dev. 2016, 41, 87–89, (In Chinese with English Abstract). [Google Scholar] [CrossRef]
- Miao, Q.; Li, X.; Xu, Y.; Liu, C.; Lv, Z. Chemical Characteristics of Groundwater and Source Identification in a Coastal City. PLoS ONE 2021, 16, e0256360. [Google Scholar] [CrossRef] [PubMed]
- Aiuppa, A.; Bellomo, S.; Brusca, L.; D’Alessandro, W.; Federico, C. Natural and Anthropogenic Factors Affecting Groundwater Quality of an Active Volcano (Mt. Etna, Italy). Appl. Geochem. 2003, 18, 863–882. [Google Scholar] [CrossRef]
- Brenot, A.; Baran, N.; Petelet-Giraud, E.; Négrel, P. Interaction between Different Water Bodies in a Small Catchment in the Paris Basin (Brévilles, France): Tracing of Multiple Sr Sources through Sr Isotopes Coupled with Mg/Sr and Ca/Sr Ratios. Appl. Geochem. 2008, 23, 58–75. [Google Scholar] [CrossRef]
- Edmunds, W.M.; Shand, P.; Hart, P.; Ward, R.S. The Natural (Baseline) Quality of Groundwater: A UK Pilot Study. Sci. Total Environ. 2003, 310, 25–35. [Google Scholar] [CrossRef] [Green Version]
- Valdes, D.; Dupont, J.-P.; Laignel, B.; Ogier, S.; Leboulanger, T.; Mahler, B.J. A Spatial Analysis of Structural Controls on Karst Groundwater Geochemistry at a Regional Scale. J. Hydrol. 2007, 340, 244–255. [Google Scholar] [CrossRef]
- Négrel, P. Geochemical Study of a Granitic Area—The Margeride Mountains, France: Chemical Element Behavior and 87Sr/86Sr Constraints. Aquat. Geochem. 1999, 5, 125–165. [Google Scholar] [CrossRef]
- Böhlke, J.K.; Horan, M. Strontium Isotope Geochemistry of Groundwaters and Streams Affected by Agriculture, Locust Grove, MD. Appl. Geochem. 2000, 15, 599–609. [Google Scholar] [CrossRef]
- Petelet-Giraud, E.; Négrel, P.; Casanova, J. Variability of 87 Sr/ 86 Sr in Water Draining Granite Revealed after a Double Correction for Atmospheric and Anthropogenic Inputs. Hydrol. Sci. J. 2003, 48, 729–742. [Google Scholar] [CrossRef] [Green Version]
- Widory, D.; Kloppmann, W.; Chery, L.; Bonnin, J.; Rochdi, H.; Guinamant, J.-L. Nitrate in Groundwater: An Isotopic Multi-Tracer Approach. J. Contam. Hydrol. 2004, 72, 165–188. [Google Scholar] [CrossRef] [PubMed]
- Négrel, P.; Petelet-Giraud, E. Strontium Isotopes as Tracers of Groundwater-Induced Floods: The Somme Case Study (France). J. Hydrol. 2005, 305, 99–119. [Google Scholar] [CrossRef]
- Zhu, X.; Fan, T.; Guan, W. The analysis of stable isotopes of precipitation in Kunming. Yunnan Geogr. Environ. Res. 2013, 25, 90–95, (In Chinese with English Abstract). [Google Scholar]
- Tang, C.; Zheng, X.; Liang, Y. Hydrochemical Characteristics and Formation Causes of Ground Karst Water Systems in the Longzici Spring Catchment. Environ. Sci. 2020, 41, 2087–2095, (In Chinese with English Abstract). [Google Scholar] [CrossRef]
- Feth, J.H.; Gibbs, R.J. Mechanisms Controlling World Water Chemistry: Evaporation-Crystallization Process. Science 1971, 172, 870–872. [Google Scholar] [CrossRef] [Green Version]
- Gibbs, R.J. Mechanisms Controlling World Water Chemistry. Sci. New Ser. 1970, 170, 1088–1090. [Google Scholar] [CrossRef]
- Lv, J.; An, Y.; Wu, Q.; Luo, J.; Jiang, H. Hydrochemical Characteristics and Sources of Qingshuijiang River Basin at Wet Season in Guizhou Province. Environ. Sci. 2015, 36, 1565–1572, (In Chinese with English Abstract). [Google Scholar] [CrossRef]
- Wu, Q.; Han, G.; Tao, F.; Tang, Y. Chemical Characterization of Rainwater in a Karst Rural Site: A Case Study of Puding, China. Environ. Sci. 2011, 32, 26–32, (In Chinese with English Abstract). [Google Scholar] [CrossRef]
- Zhou, J.; Jiang, Z.; Xu, G.; Qin, X.; Huang, Q.; Zhang, L. Major Ionic Characteristics and Controlling Factors of Karst Groundwater at Xiangshui, Chongzuo. Environ. Sci. 2019, 40, 2143–2151, (In Chinese with English Abstract). [Google Scholar] [CrossRef]
- Xie, N.; Xue, L. The Spatial Differences of Chemical Characteristics of Precipitation in Seven Regions of China. Hubei Agric. Sci. 2012, 51, 2971–2975, (In Chinese with English Abstract). [Google Scholar] [CrossRef]
- Puig, R.; Soler, A.; Widory, D.; Mas-Pla, J.; Domènech, C.; Otero, N. Characterizing Sources and Natural Attenuation of Nitrate Contamination in the Baix Ter Aquifer System (NE Spain) Using a Multi-Isotope Approach. Sci. Total Environ. 2017, 580, 518–532. [Google Scholar] [CrossRef] [PubMed]


| pH | Concentration (mg/L) | ||||||||||||||
|---|---|---|---|---|---|---|---|---|---|---|---|---|---|---|---|
| K+ | Na+ | Ca2+ | Mg2+ | Cl− | TDS | CODMn | Hardness | ||||||||
| Rain season | Min | 7.15 | 0.57 | 0.76 | 68.71 | 13.78 | 1.18 | 11.68 | 221.92 | 2.68 | nd | nd | 229.22 | nd | 187.92 |
| Max | 7.59 | 4.71 | 45.10 | 96.00 | 20.98 | 25.34 | 90.94 | 312.28 | 20.87 | 0.690 | 0.60 | 437.23 | 0.97 | 318.79 | |
| Mean | 7.38 | 1.61 | 9.57 | 83.84 | 15.82 | 7.61 | 43.76 | 279.42 | 10.77 | 0.084 | 0.05 | 317.19 | 0.35 | 270.33 | |
| SD | 0.12 | 1.18 | 12.81 | 7.48 | 2.20 | 6.02 | 25.10 | 27.04 | 4.51 | 0.184 | 0.13 | 48.01 | 0.20 | 32.20 | |
| CV% | 1.68 | 73.71 | 133.83 | 8.93 | 13.89 | 79.16 | 57.36 | 9.68 | 41.92 | 219.88 | 269.16 | 15.14 | 58.09 | 11.91 | |
| Exceedance/% | 0 | - | 0 | - | - | 0 | 0 | - | 0 | 0 | 0 | 0 | 0 | 0 | |
| Dry season | Min | 7.20 | 0.78 | 1.10 | 79.52 | 12.49 | 1.19 | 7.58 | 247.40 | 5.58 | nd | nd | 271.92 | nd | 254.23 |
| Max | 7.96 | 3.70 | 33.87 | 95.59 | 22.10 | 18.69 | 79.36 | 318.78 | 15.78 | 2.660 | 0.09 | 388.64 | 1.64 | 329.25 | |
| Mean | 7.44 | 1.56 | 7.87 | 86.28 | 16.53 | 6.49 | 38.34 | 295.41 | 10.70 | 0.179 | 0.02 | 322.97 | 0.45 | 283.55 | |
| SD | 0.17 | 0.93 | 9.88 | 5.53 | 2.76 | 4.82 | 22.62 | 16.63 | 2.57 | 0.593 | 0.02 | 34.59 | 0.40 | 23.70 | |
| CV% | 2.25 | 59.62 | 125.46 | 6.41 | 16.72 | 74.30 | 58.99 | 5.63 | 24.03 | 332.09 | 104.59 | 10.71 | 88.16 | 8.36 | |
| Exceedance/% | 0 | - | 0 | - | - | 0 | 0 | - | 0 | 0 | 0 | 0 | 0 | 0 | |
| All | Min | 7.15 | 0.57 | 0.76 | 68.71 | 12.49 | 1.18 | 7.58 | 221.92 | 2.68 | nd | nd | 229.22 | nd | 187.92 |
| Max | 7.96 | 4.71 | 45.10 | 96.00 | 22.10 | 25.34 | 90.94 | 318.78 | 20.87 | 2.660 | 0.60 | 437.23 | 1.64 | 329.25 | |
| Mean | 7.41 | 1.58 | 8.70 | 85.09 | 16.18 | 7.04 | 40.98 | 287.63 | 10.73 | 0.132 | 0.03 | 320.16 | 0.40 | 277.12 | |
| SD | 0.15 | 1.06 | 11.43 | 6.67 | 2.53 | 5.47 | 24.01 | 23.70 | 3.65 | 0.446 | 0.10 | 41.76 | 0.32 | 28.92 | |
| CV% | 2.04 | 67.10 | 131.40 | 7.83 | 15.63 | 77.74 | 58.60 | 8.24 | 33.99 | 337.06 | 284.69 | 13.04 | 80.11 | 10.44 | |
| Exceedance/% | 0 | - | 0 | - | - | 0 | 0 | - | 0 | 0 | 0 | 0 | 0 | 0 | |
| Standard value | 6.5–8.5 | - | 200 | - | - | 250 | 250 | - | 88.57 | 3.29 | 0.64 | 1000 | 3.0 | 450 | |
| pH | Concentration (mg/L) | ||||||||||||||
|---|---|---|---|---|---|---|---|---|---|---|---|---|---|---|---|
| K+ | Na+ | Ca2+ | Mg2+ | Cl− | TDS | CODMn | Hardness | ||||||||
| Rain season | Min | 6.84 | 2.50 | 1.81 | 36.98 | 11.87 | 4.16 | 4.54 | 77.62 | nd | nd | nd | 166.97 | 1.27 | 146.68 |
| Max | 7.44 | 10.71 | 23.92 | 115.70 | 25.32 | 39.46 | 156.61 | 267.78 | 42.060 | 1.240 | 2.66 | 476.14 | 5.17 | 393.20 | |
| Mean | 7.23 | 5.44 | 12.21 | 66.79 | 18.02 | 23.77 | 95.83 | 162.08 | 3.801 | 0.097 | 0.34 | 313.11 | 2.65 | 240.56 | |
| SD | 0.15 | 2.30 | 6.35 | 23.51 | 4.15 | 11.05 | 51.39 | 52.65 | 8.527 | 0.282 | 0.63 | 92.94 | 1.01 | 71.97 | |
| CV% | 2.04 | 42.21 | 52.01 | 35.21 | 23.02 | 46.50 | 53.63 | 32.49 | 224.34 | 291.91 | 186.78 | 29.68 | 38.34 | 29.92 | |
| Exceedance/% | 0 | - | - | - | - | 0 | - | 0 | - | 4.17 | - | 0 | - | ||
| Dry season | Min | 7.24 | 1.56 | 1.06 | 26.43 | 12.68 | 2.19 | 3.26 | 77.62 | nd | nd | nd | 127.72 | 0.59 | 118.26 |
| Max | 7.78 | 11.64 | 23.65 | 102.70 | 26.56 | 38.37 | 147.38 | 266.74 | 42.430 | 1.540 | 7.46 | 447.38 | 5.26 | 355.67 | |
| Mean | 7.46 | 5.77 | 12.14 | 63.47 | 19.32 | 20.99 | 85.33 | 176.15 | 6.141 | 0.261 | 0.75 | 310.28 | 2.44 | 241.36 | |
| SD | 0.12 | 2.51 | 6.07 | 23.31 | 2.96 | 10.40 | 52.79 | 48.60 | 10.474 | 0.449 | 1.57 | 90.89 | 1.01 | 66.88 | |
| CV% | 1.66 | 43.47 | 50.02 | 36.73 | 15.32 | 49.53 | 61.87 | 27.59 | 170.56 | 171.65 | 209.01 | 29.29 | 41.53 | 27.71 | |
| Exceedance/% | 0 | - | - | - | - | 0 | - | 0 | - | 16.67 | - | 0 | - | ||
| All | Min | 6.84 | 1.56 | 1.06 | 26.43 | 11.87 | 2.19 | 3.26 | 77.62 | nd | nd | nd | 127.72 | 0.59 | 118.26 |
| Max | 7.78 | 11.64 | 23.92 | 120.72 | 26.56 | 39.46 | 159.40 | 267.78 | 42.430 | 4.460 | 7.46 | 505.24 | 5.26 | 406.92 | |
| Mean | 7.34 | 5.55 | 12.16 | 66.32 | 18.80 | 22.51 | 92.12 | 170.86 | 5.173 | 0.266 | 0.53 | 315.76 | 2.55 | 244.41 | |
| SD | 0.18 | 2.41 | 6.15 | 24.55 | 3.77 | 10.74 | 52.72 | 52.30 | 9.627 | 0.719 | 1.19 | 95.10 | 1.01 | 72.77 | |
| CV% | 2.40 | 43.32 | 50.59 | 37.01 | 20.04 | 47.69 | 57.23 | 30.61 | 186.10 | 269.85 | 225.80 | 30.12 | 39.58 | 29.77 | |
| Exceedance/% | 0 | - | - | - | - | 0 | 0 | - | 0 | - | 10.42 | - | 0 | - | |
| Standard value | 6–9 | - | - | - | - | 250 | 250 | - | 44.29 | - | 1.29 | - | 20 | - | |
| Na+ | K+ | Ca2+ | Mg2+ | Cl− | TDS | CODMn | pH | |||||||
|---|---|---|---|---|---|---|---|---|---|---|---|---|---|---|
| Surface water | Na+ | 1.000 | ||||||||||||
| K+ | 0.353 * | 1.000 | ||||||||||||
| Ca2+ | 0.246 | −0.089 | 1.000 | |||||||||||
| Mg2+ | 0.463 ** | −0.042 | 0.737 ** | 1.000 | ||||||||||
| −0.472 ** | −0.140 | 0.518 ** | 0.356 * | 1.000 | ||||||||||
| Cl− | 0.889 ** | 0.333 ** | 0.537 ** | 0.609 ** | −0.257 | 1.000 | ||||||||
| 0.748 * | 0.058 | 0721 ** | 0.666 ** | −0.178 | 0.867 ** | 1.000 | ||||||||
| 0.203 | 0.137 | 0.301 * | 0.236 | −0.040 | 0.234 | 0.265 | 1.000 | |||||||
| 0.095 | −0.143 | 0.371 ** | 0.356 * | 0.160 | 0.160 | 0.309 * | 0.301 * | 1.000 | ||||||
| 0.131 | 0.567 ** | 0.036 | −0.052 | −0.047 | 0.204 | 0.131 | −0.143 | −0.096 | 1.000 | |||||
| TDS | 0.556 ** | 0.091 | 0.931 ** | 0.820 ** | 0.282 | 0.768 ** | 0.876 ** | 0.354 * | 0.378 ** | 0.108 | 1.000 | |||
| COD | 0.437 ** | 0.609 ** | 0.155 | 0.173 | −0.153 | 0.513 ** | 0.364 * | −0.014 | 0.137 | 0.318 * | 0.556 ** | 1.000 | ||
| pH | 0.150 | 0.244 | 0.165 | 0.218 | 0.160 | 0.139 | 0.140 | 0.260 | 0.201 | 0.292 * | 0.242 | 0.142 | 1.000 | |
| groundwater | Na+ | 1.000 | ||||||||||||
| K+ | 0.921 ** | 1.000 | ||||||||||||
| Ca2+ | −0.133 | −0.189 | 1.000 | |||||||||||
| Mg2+ | −0.130 | −0.201 | 0.682 ** | 1.000 | ||||||||||
| 0.400 * | 0.345 * | 0.300 | 0.049 | 1.000 | ||||||||||
| Cl− | 0.944 ** | 0.876 ** | −0.233 | −0.292 | 0.471 ** | 1.000 | ||||||||
| 0.188 | 0.151 | 0.524 ** | 0.698 | −0.320 | −0.127 | 1.000 | ||||||||
| 0.182 | 0.179 | 0.360 * | −0.149 | −0.045 | 0.116 | 0.231 | 1.000 | |||||||
| 0.110 | 0.065 | −0.117 | 0.052 | 0.014 | 0.074 | −0.056 | −0.282 | 1.000 | ||||||
| .0.024 | 0.247 | −0.384 * | −0.155 | −0.157 | −0.018 | −0.099 | −0.343 * | −0.036 | 1.000 | |||||
| TDS | 0.661 ** | 0.586 ** | 0.556 ** | 0.517 ** | 0.321 | 0.499 ** | 0.719 ** | 0.322 | −0.003 | −0.182 | 1.000 | |||
| COD | 0.092 | 0.175 | −0.185 | −0.115 | 0.002 | 0.104 | −0.133 | −0.180 | 0.588 ** | 0.283 | −0.054 | 1.000 | ||
| pH | −0.208 | −0.127 | 0.274 | 0.453 ** | 0.020 | −0.230 | 0.233 | −0.088 | −0.307 | 0.170 | 0.107 | −0.114 | 1.000 |
| Variables | Surface Water | Groundwater | ||
|---|---|---|---|---|
| PC1 | PC2 | PC1 | PC2 | |
| Na+ | 0.115 | −0.346 | 0.516 | 0.134 |
| K+ | 0.421 | −0.354 | 0.524 | 0.178 |
| Ca2+ | 0.376 | 0.447 | −0.167 | 0.546 |
| Mg2+ | 0.403 | 0.320 | −0.224 | 0.518 |
| Cl− | 0.482 | −0.178 | 0.542 | 0.056 |
| 0.483 | −0.013 | −0.067 | 0.559 | |
| −0.034 | 0.648 | 0.273 | 0.112 | |
| 0.199 | 0.023 | 0.089 | 0.238 | |
| Initial Eigen values | 3.767 | 1.938 | 3.197 | 2.287 |
| % of variance | 47.106 | 24.227 | 39.962 | 28.584 |
| Cumulative % of Variance | 47.106 | 71.334 | 39.962 | 68.546 |
| Surface Water | Groundwater | All | ||||||||||
|---|---|---|---|---|---|---|---|---|---|---|---|---|
| Min | Max | Mean | SD | Min | Max | Mean | SD | Min | Max | Mean | SD | |
| δD (‰) | −80.60 | −24.20 | −52.64 | 13.49 | −86.40 | −69.70 | −73.75 | 2.79 | −86.40 | −24.20 | −61.68 | 14.71 |
| δ18O (‰) | −11.04 | −2.07 | −6.53 | 2.36 | −10.42 | −9.46 | −10.14 | 0.19 | −11.04 | −2.07 | −8.08 | 2.53 |
Publisher’s Note: MDPI stays neutral with regard to jurisdictional claims in published maps and institutional affiliations. |
© 2022 by the authors. Licensee MDPI, Basel, Switzerland. This article is an open access article distributed under the terms and conditions of the Creative Commons Attribution (CC BY) license (https://creativecommons.org/licenses/by/4.0/).
Share and Cite
Zhu, X.; Liu, L.; Lan, F.; Li, J.; Hou, S. Hydrogeochemistry Characteristics of Groundwater in the Nandong Karst Water System, China. Atmosphere 2022, 13, 604. https://doi.org/10.3390/atmos13040604
Zhu X, Liu L, Lan F, Li J, Hou S. Hydrogeochemistry Characteristics of Groundwater in the Nandong Karst Water System, China. Atmosphere. 2022; 13(4):604. https://doi.org/10.3390/atmos13040604
Chicago/Turabian StyleZhu, Xiuqun, Ling Liu, Funing Lan, Jun Li, and Shitian Hou. 2022. "Hydrogeochemistry Characteristics of Groundwater in the Nandong Karst Water System, China" Atmosphere 13, no. 4: 604. https://doi.org/10.3390/atmos13040604
APA StyleZhu, X., Liu, L., Lan, F., Li, J., & Hou, S. (2022). Hydrogeochemistry Characteristics of Groundwater in the Nandong Karst Water System, China. Atmosphere, 13(4), 604. https://doi.org/10.3390/atmos13040604