Abstract
Benzo[a]pyrene (BaP), an indicator of polycyclic aromatic hydrocarbons (PAHs) in the atmosphere, is an important ambient air pollutant with significant human health and environmental effects. In the Czech Republic (CR), BaP, together with aerosol and ambient ozone, ranks (with respect to limit value exceedances and resulting population exposure) among the most problematic air pollutants. The aim of this study is to develop atmospheric deposition patterns of BaP in three years, namely 2012, 2015 and 2019, reflecting different BaP ambient levels. With respect to the available measurements, we accounted for dry deposition fluxes, neglecting wet contribution. We assumed, nevertheless, that the real atmospheric deposition is dominated by dry pathways in our conditions, which is supported by measurements from the rural site of Košetice. The dry deposition spatial pattern was constructed using an inferential approach, with two input layers, i.e., annual mean ambient air BaP concentrations, and deposition velocity of 0.89 cm·s−1. Though our results show an overall decrease in BaP loads over the years, the BaP deposition fluxes, in particular in the broader Ostrava region, remain very high. The presented maps can be considered an acceptable approximation of total BaP deposition and are useful for further detailed analysis of airborne BaP impacts on the environment.
1. Introduction
Benzo[a]pyrene (BaP), C20H12, belongs among the group of polycyclic aromatic hydrocarbons (PAHs), hydrophobic organic pollutants with a complex chemical structure consisting of several aromatic nuclei [1]. Due to their partial volatility, PAHs in the air may be present both in vapour form and bound to particles facilitating their long-range transport, and their environmental fate is partly dependent on their partitioning between the gas and particle phases [2,3]. Though PAHs’ water solubility is low, recent studies suggest that the condensed phase in fog and clouds should not be neglected as a PAH sink, specifically at low temperatures [4].
BaP is a by-product originating from incomplete combustion of organic substances in temperatures ranging between 300 and 600 °C. Its major emission sources are local heating systems, cars, thermal power plants burning fossil fuels, and industrial processes. Hence, it is ubiquitous in the environment, predominantly close to emission sources in impacted regions, including urban and industrialised areas [5]. With respect to regulations, it should be noted, however, that efforts to reduce BaP emissions may be hampered by the climate penalty due to natural climatic variability [6]
BaP is considered one of the most chemically reactive PaHs [7]. Numerous experiments indicate that PAHs are prone to photochemical and/or chemical oxidations [8], though in real conditions, PAH degradation depends strongly on its substrate. BaP, however, can be transported over long distances [9]. In the atmosphere, due to low volatility, it is mostly related to suspended particles (ca 90%), specifically to fine particles PM2.5. A total of 10% of atmospheric BaP at most is assumed to be in gas form [10]. The phase distribution is ambient temperature-dependent [11].
BaP is considered an indicator of PAH loading, as it is stable and exhibits a relatively constant contribution to the carcinogenic activity of PAHs mixture bound to suspended particles [12]. PAHs are dangerous substances with respect both to human health and the environment. They are toxic, mutagenic and carcinogenic, belong among the endogenic disruptors (i.e., substances affecting the endocrine glands) and are immunosuppressive [13,14]. Furthermore, PAHs are harmful with respect to their ability for bioaccumulation in the environment and accumulation in food chains [15]. BaP itself exhibits profound negative effects both on human health and the environment and it belongs among human carcinogens [11]. With respect to the above, the fate, behaviour, transport and removal mechanisms of PAHs, including BaP, in and from the atmosphere have been widely studied [16,17,18].
In Europe, BaP was reported to exceed the target value of 1 ng m−3 [12] at 31% of the measuring sites reporting BaP concentrations to the European ambient air quality database AIRBASE in 2017 [15]. In the CR, with respect to limit value exceedances and population exposure, BaP belongs, along with aerosol and ground-level ozone, among the most problematic ambient air pollutants [19,20,21]. The aim of this paper was to construct spatial patterns of BaP deposition fluxes for the Czech Republic, as an important input to broader environmental analysis. To address this issue, we used an inferential approach, building on a spatial data-driven model of ambient air BaP levels in detailed spatial resolution of 1 × 1 km, and an average BaP deposition velocity modelled by EMEP.
2. Materials and Methods
2.1. Monitoring Network
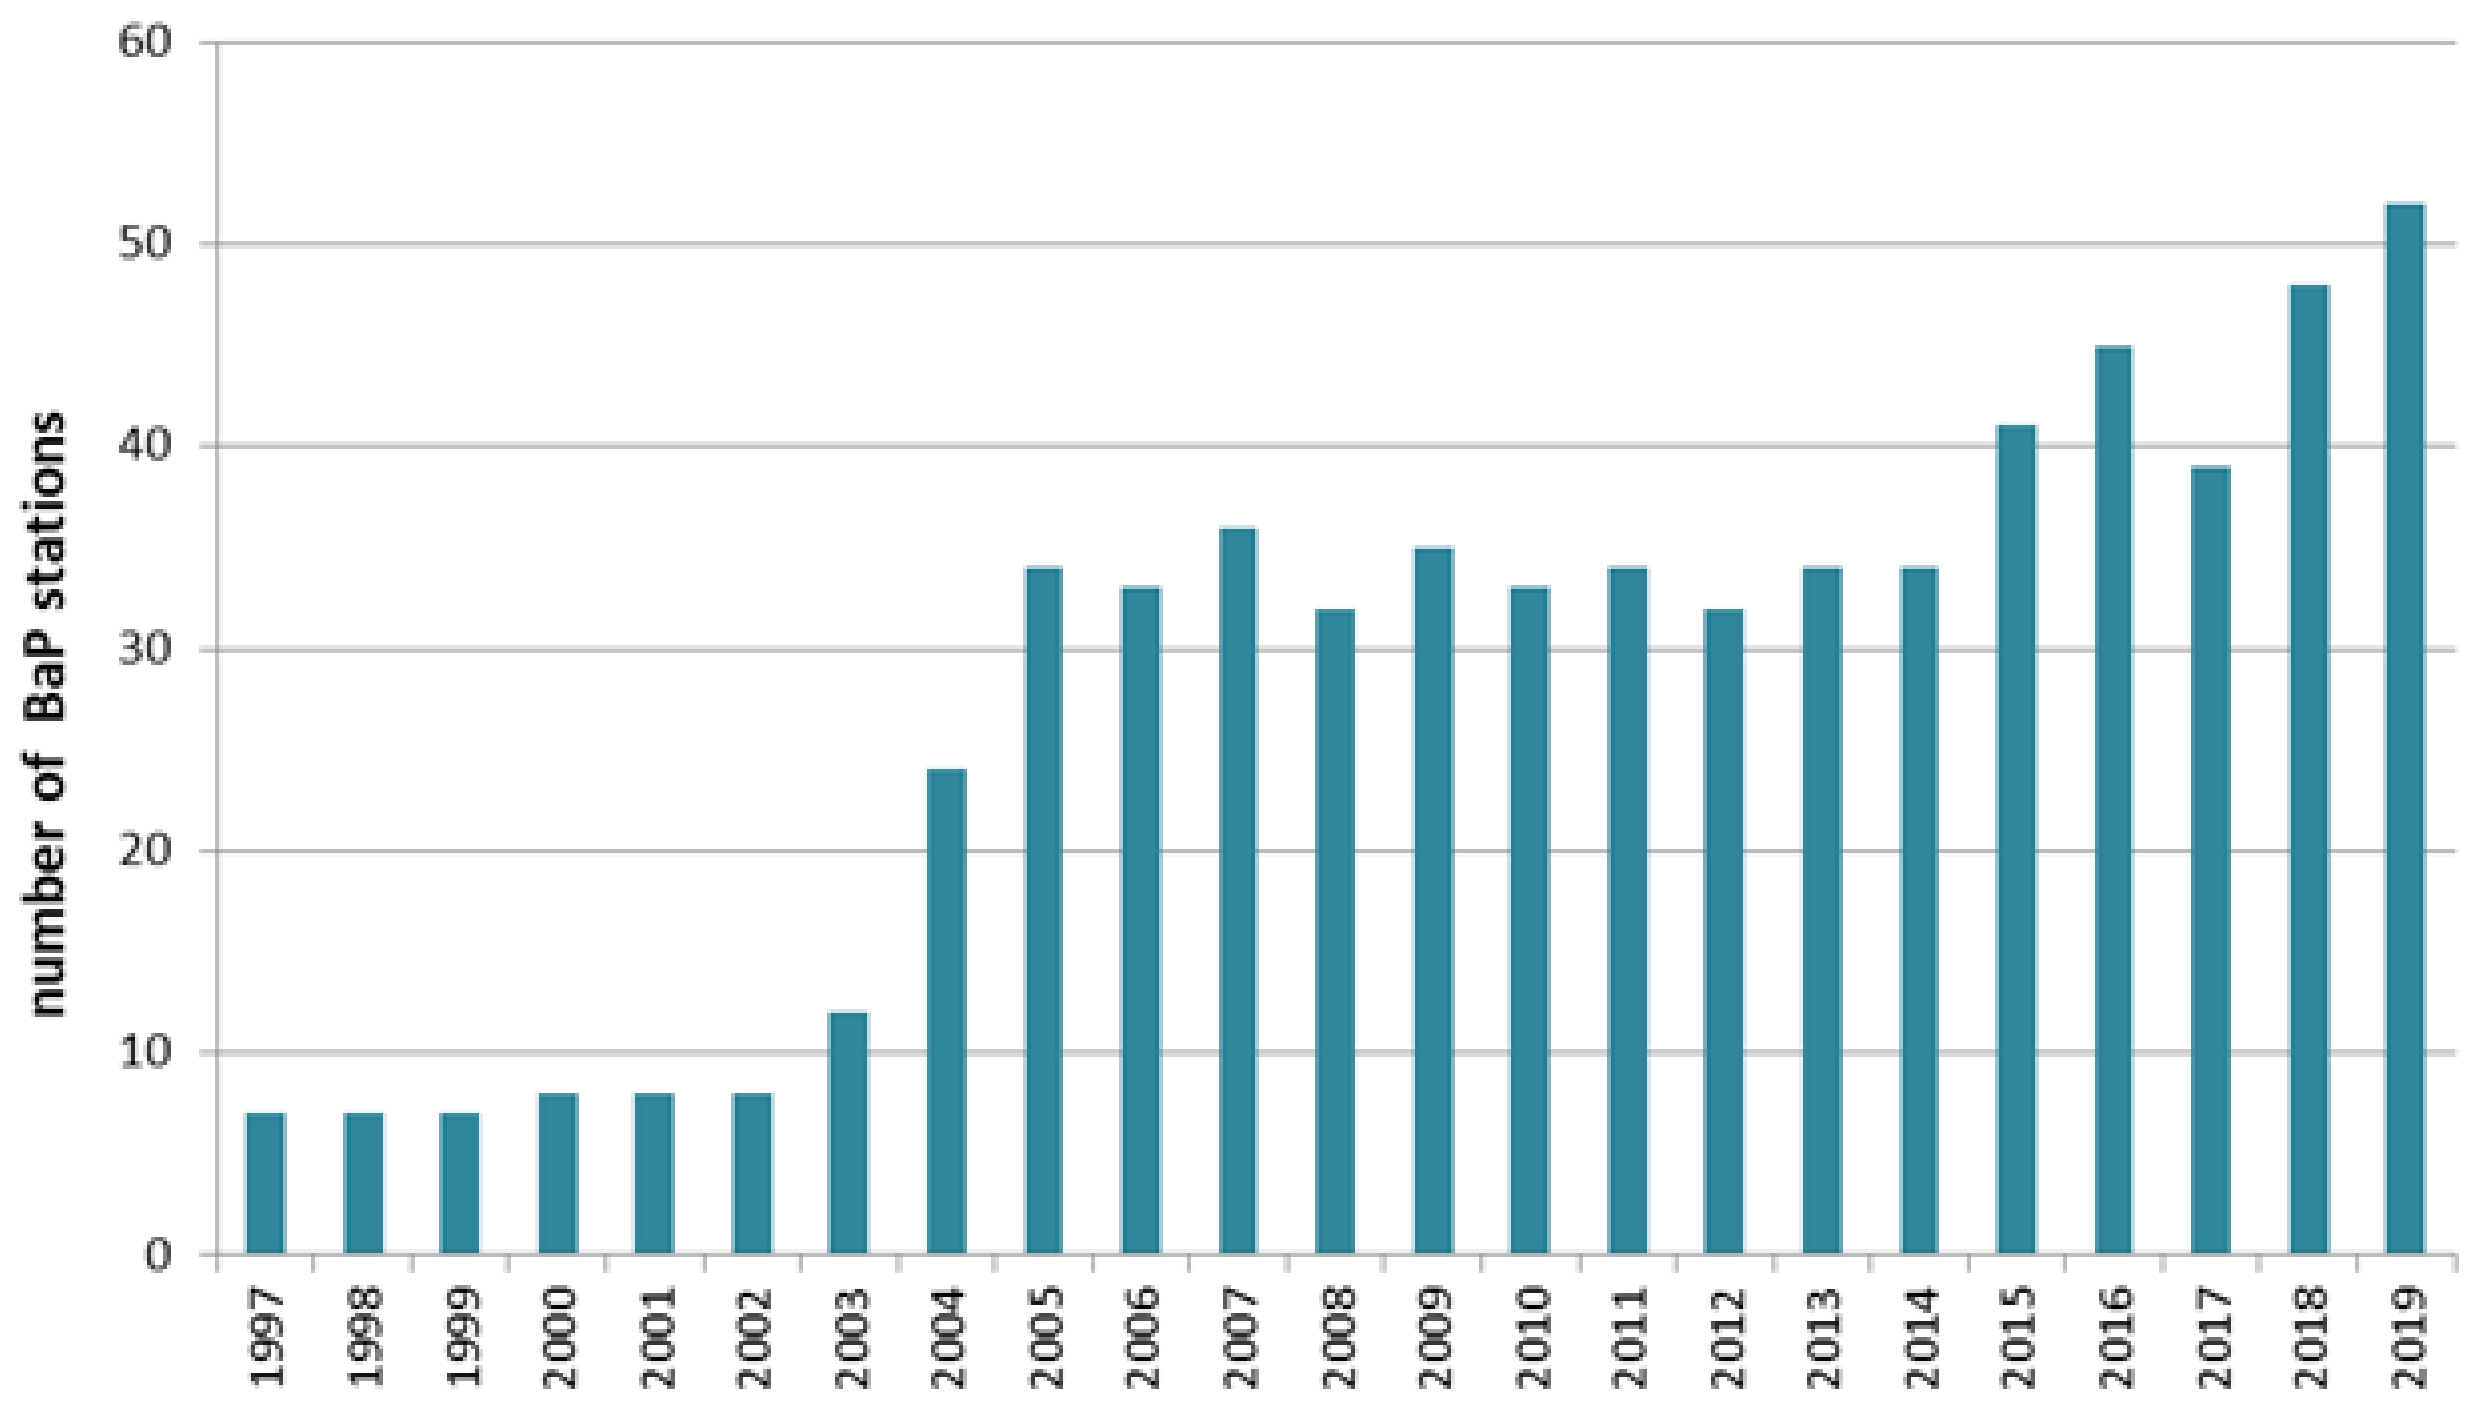
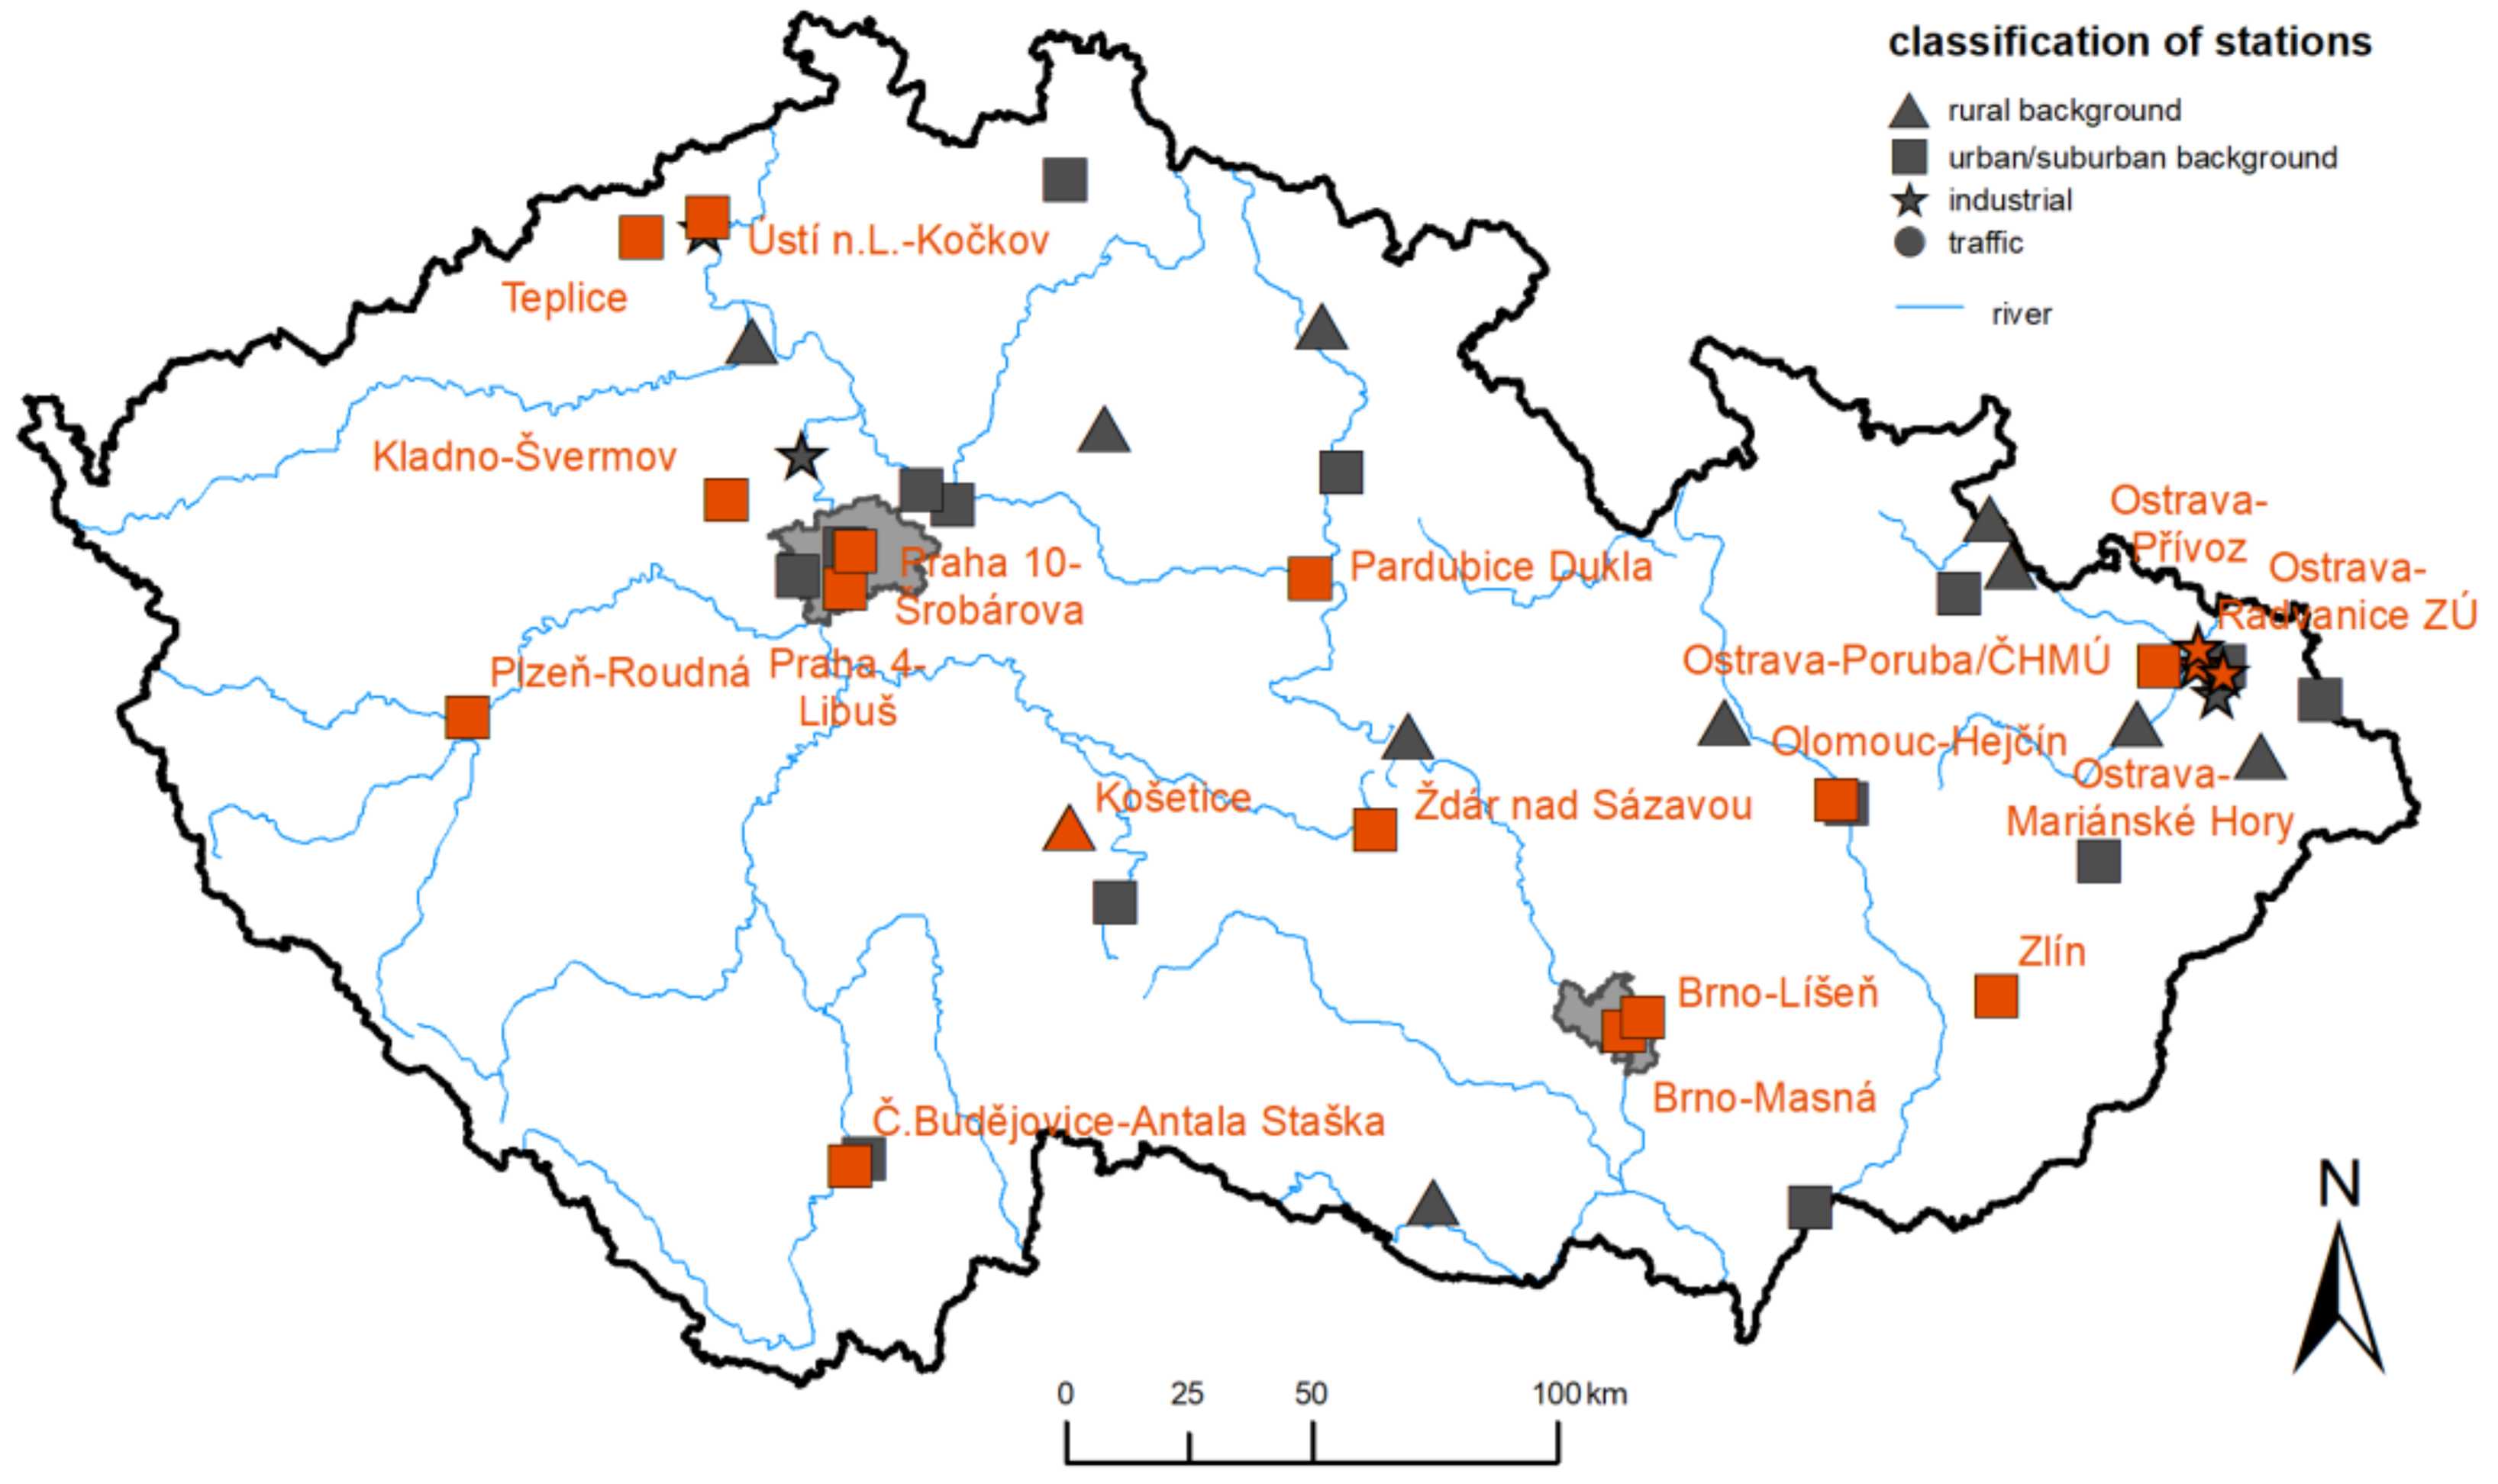
BaP has been monitored in the CR since 1997. The number of monitoring sites has evolved over time (Figure 1) to the current 52 monitoring stations. The stations are situated predominantly in BaP impacted areas (Figure 2). The majority of the stations are located in cities (28 urban and suburban stations). Transport and industrial contributions to BaP are monitored at six traffic and seven industrial stations, whereas background BaP levels are observed at 11 rural monitoring stations. The stations are operated by different owners; most of them, however, are operated by the CHMI.
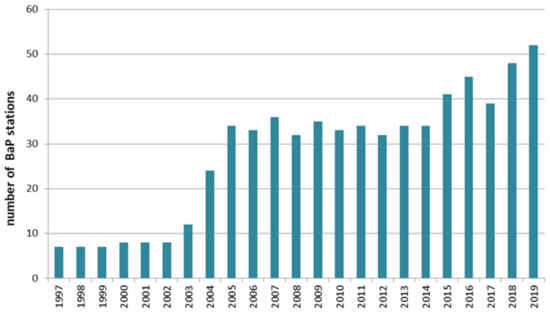
Figure 1.
Changing number of BaP monitoring stations covering the CR in 1997–2019.
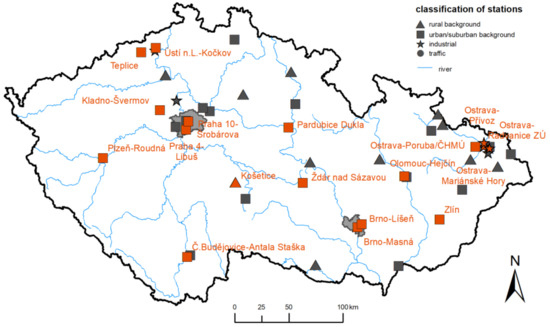
Figure 2.
BaP monitoring network, stations selected for time trend analysis are indicated in orange.
BaP is measured in PM10 sampled by low- or high-volume samplers on a quartz filter and collected at a three-day frequency at minimum. The samples are processed in a certified chemical laboratory using high-pressure liquid chromatography (HPCL) or gas chromatography with mass detection (GC/MS). The lower detection limit is 0.04 ng·m−3 for GC/MS and 0.10 ng·m−3 for HPLC. The measurement uncertainty of BaP is up to 25%. BaP concentrations are stored as daily averaged values in the nation-wide Air Quality Information System (AQIS) database [21].
2.2. BaP Trends and Seasonal Changes
For the analysis of BaP concentration trends, 18 monitoring stations were selected. Based on the data availability and adequate data coverage, the trends were assessed for 2009–2019. The monitoring stations were classified according to their type, i.e., regional, background suburban, background urban and industrial stations. The set of stations for the time trend assessment was selected based on their data coverage and to represent each zone or agglomeration specified for the ambient air quality evaluation by the Czech legislation (Act 201/2012 Coll., on Clean Air Protection, as amended) by at least one urban/suburban station. This was not possible only for the Moravian-Silesian zone. Industrial stations were evaluated only for the problematic area of the Ostrava/Karviná/Frýdek-Místek agglomeration. With respect to regional sites, only one site, the Košetice station, had a complete time series suitable for the trend analysis.
The input data for the time trend analysis were the annual mean BaP concentrations calculated for sites adhering to sufficient data coverage required by EC directive [12]. The minimum data capture for the annual BaP mean concentrations was 90%, and the minimum data coverage was 33%, accordingly. Furthermore, the measurements had to be distributed over the year to be representative of various conditions for climate and anthropogenic activities. The same principal was adhered to for BaP concentration mapping (Section 2.3).
Temporal trends, i.e., annual averages of BaP concentrations, were analysed using the non-parametric Mann–Kendall trend test with a level of significance of 0.05 [22,23]. This test is among the most widely used statistical methods for this kind of data [24,25,26,27] and is particularly useful since it tolerates missing values, and the data need not to conform to any particular distribution. Moreover, as only relative rather than absolute magnitudes of the data are used, this test is less sensitive towards incomplete data capture and special meteorological conditions leading to extreme values that often affect air quality data [28]. If a linear trend is significant, the slope and severity of the trend are estimated by Sen’s test [29]. We used R-Studio software (R version 4.0.3; R Foundation for Statistical Computing, Vienna, Austria) for statistical analyses of trends [30]. With respect to the main emission source of BaP, i.e., local heating [21], we assessed concentration trends not only for the calendar year as a whole, but also specified for the winter (October–March) and summer (April–September) periods.
2.3. Ambient BaP Concentration Maps
Maps of annual mean BaP concentrations for three selected years (2012, 2015 and 2019) were used as the main input for preparing spatial patterns of BaP dry deposition fluxes. Air pollution maps of BaP were created using an approach of Regression–Interpolation–Merging Mapping (RIMM [31]) and were prepared by the CHMI during the regular annual ambient air quality assessment [32,33,34]. A linear regression model followed by an interpolation of its residuals is used for the preparation of concentration maps. Rural and urban maps are prepared separately. The resulting map is created by merging rural and urban maps by population density.
The estimate of concentrations is calculated using the following equation:
where is the estimated concentration value at point , denotes the various supplementary data, and are the parameters of the linear regression model and is the spatial interpolation of the residuals of the linear regression model at point , calculated on the basis of the residuals at the points of measurement. Interpolation of the residuals of the linear regression model at measuring points is performed using ordinary kriging and the inverse distance weighting (IDW) methods [35].
The basic data used for the creation of the BaP concentration maps are the BaP annual mean concentrations measured at 52 individual monitoring stations. Furthermore, additional data used, supplementing the measured BaP concentrations, provide comprehensive information on the entire territory of the CR and indicate a regression dependence on the measured data.
The main secondary supplementary sources of information are outputs of dispersion models, i.e., BaP concentrations, and maps of annual mean PM10 or PM2.5 concentrations. Dispersion models combine data from emission inventories and meteorological data. For the BaP air pollution maps, annual mean concentrations of BaP provided by EMEP/MSC-E [36,37,38], the Czech Gaussian model SYMOS [39], and CAMx (Comprehensive Air Quality Model with Extensions, Ramboll, Copenhagen, Denmark) [40], were the secondary data used. Namely, for the 2012 BaP map the SYMOS, for the 2015 BaP map both EMEP and SYMOS, and for the 2019 BaP map both CAMx and SYMOS outputs were used. As BaP in the atmosphere occurs predominantly bound to suspended particles, PM, namely PM10 or PM2.5, ambient air concentration maps can be utilized as valuable additional data for BaP spatial patterns creation.
The calculated urban and rural map layers are subsequently merged by a layer of population density α:
where is the final estimate of the concentration at point s0, and are the concentration for the rural or urban map layer and α1 and α2 are the classification intervals corresponding to the population density. For the BaP concentration maps, α1 was set to 200 inhabitants per km2 and α2 was set to 1000 inhabitants per km2.
The entire concept of separate mapping of rural and urban pollution is based on the assumption that ≤ for BaP. For areas where this assumption is not fulfilled, a third layer created in a similar way to the urban and rural layers is used; this third layer is created using all the background stations without distinguishing between urban and rural stations.
The uncertainty of the map was assessed using the cross-validation method: concentration at the location of a measuring site is always estimated from other station data only, thus providing an objective estimate of the map quality away from measurement site locations. In this study, the uncertainty of the maps is expressed by the relative root-mean-square error (RRMSE):
where is the measured value of the concentration at point si, is its estimate using cross-validation and is the number of measuring stations. The spatial distribution of the uncertainty was not estimated. It should be noted that the cross-validation is applied only during the interpolation of residuals; the parameters of linear regression are always estimated using all the stations. Therefore, the overall uncertainty of the maps is somewhat underestimated. The uncertainties (RRMSE) were calculated for each map layer separately and were up to 30% for urban and over 60% for rural areas.
The maps are prepared with a spatial resolution of 1 × 1 km. The described methodology of map creating is used in the Czech Republic and elsewhere in Europe [10,21,41].
2.4. BaP Deposition Flux Maps
For preparing a spatial pattern of BaP dry deposition flux, we used an inferential approach [1] accounting for a spatial pattern of annual mean BaP concentrations in ambient air (as described in Section 2.3) and annual mean deposition velocity of 0.89 cm·s−1. The deposition velocity value we used was based on an EMEP model [37], a three-dimensional Eulerian chemical transport model working in the geographical domain of the EMEP region, originally in a spatial resolution of 50 × 50 km. Current air pollution maps are provided in finer resolution, however, namely for 0.1 × 0.1 geographic degrees, which represents a grid of ca 8 × 10 km for central Europe. With respect to vertical span, the EMEP model covers practically the entire troposphere, including the upper soil layer to 20 cm of depth and ocean water. Model runs carried out specifically for the CR for 2018 by EMEP modellers [42] demonstrated that monthly means of deposition velocity ranged between 0.18–2.22 cm·s−1, with 0.89 cm·s−1, on average. Dry deposition velocity was highest in summer, with 2.22 cm·s−1 as the monthly mean in June. The terrain roughness, including vegetation presence, contributed to higher deposition velocity.
2.5. Wet-Only BaP Deposition at the Košetice Site
The only station measuring BaP concentrations in precipitation is the National Atmospheric Observatory Košetice (NAOK) run by the CHMI [43]. The NAOK (49°35′ N, 15°05′ E, 534 m above sea level) is situated in the Czech–Moravian Uplands, some 70 km southeast of the capital, Prague, within 20 km of two towns with up to 20,000 inhabitants, with several small villages nearby, and 6 km from a major motorway. The station is classified as a rural background of the CR, reflecting a typical agricultural area. NAOK is affected by local sources of PAHs, as well as regional and long-range transport; high PAH concentrations are related to local heating [44].
BaP has been collected since 1997 at one-day intervals by a wet-only sampler, a device exposed only during a precipitation event, preventing dry deposition from entering. In the beginning, metal pots with lids were employed for manual sampling before being replaced in 2008 by an automated sampler, Baghirra 1 m2. The sampled precipitation was analysed by gas chromatography with mass spectroscopy detection (GCH-MS) during the entire measuring period. The annual BaP wet deposition fluxes were estimated as BaP annual volume weighted averages multiplied by annual precipitation amounts.
3. Results
3.1. Ambient BaP Concentration Trends and Seasonal Changes
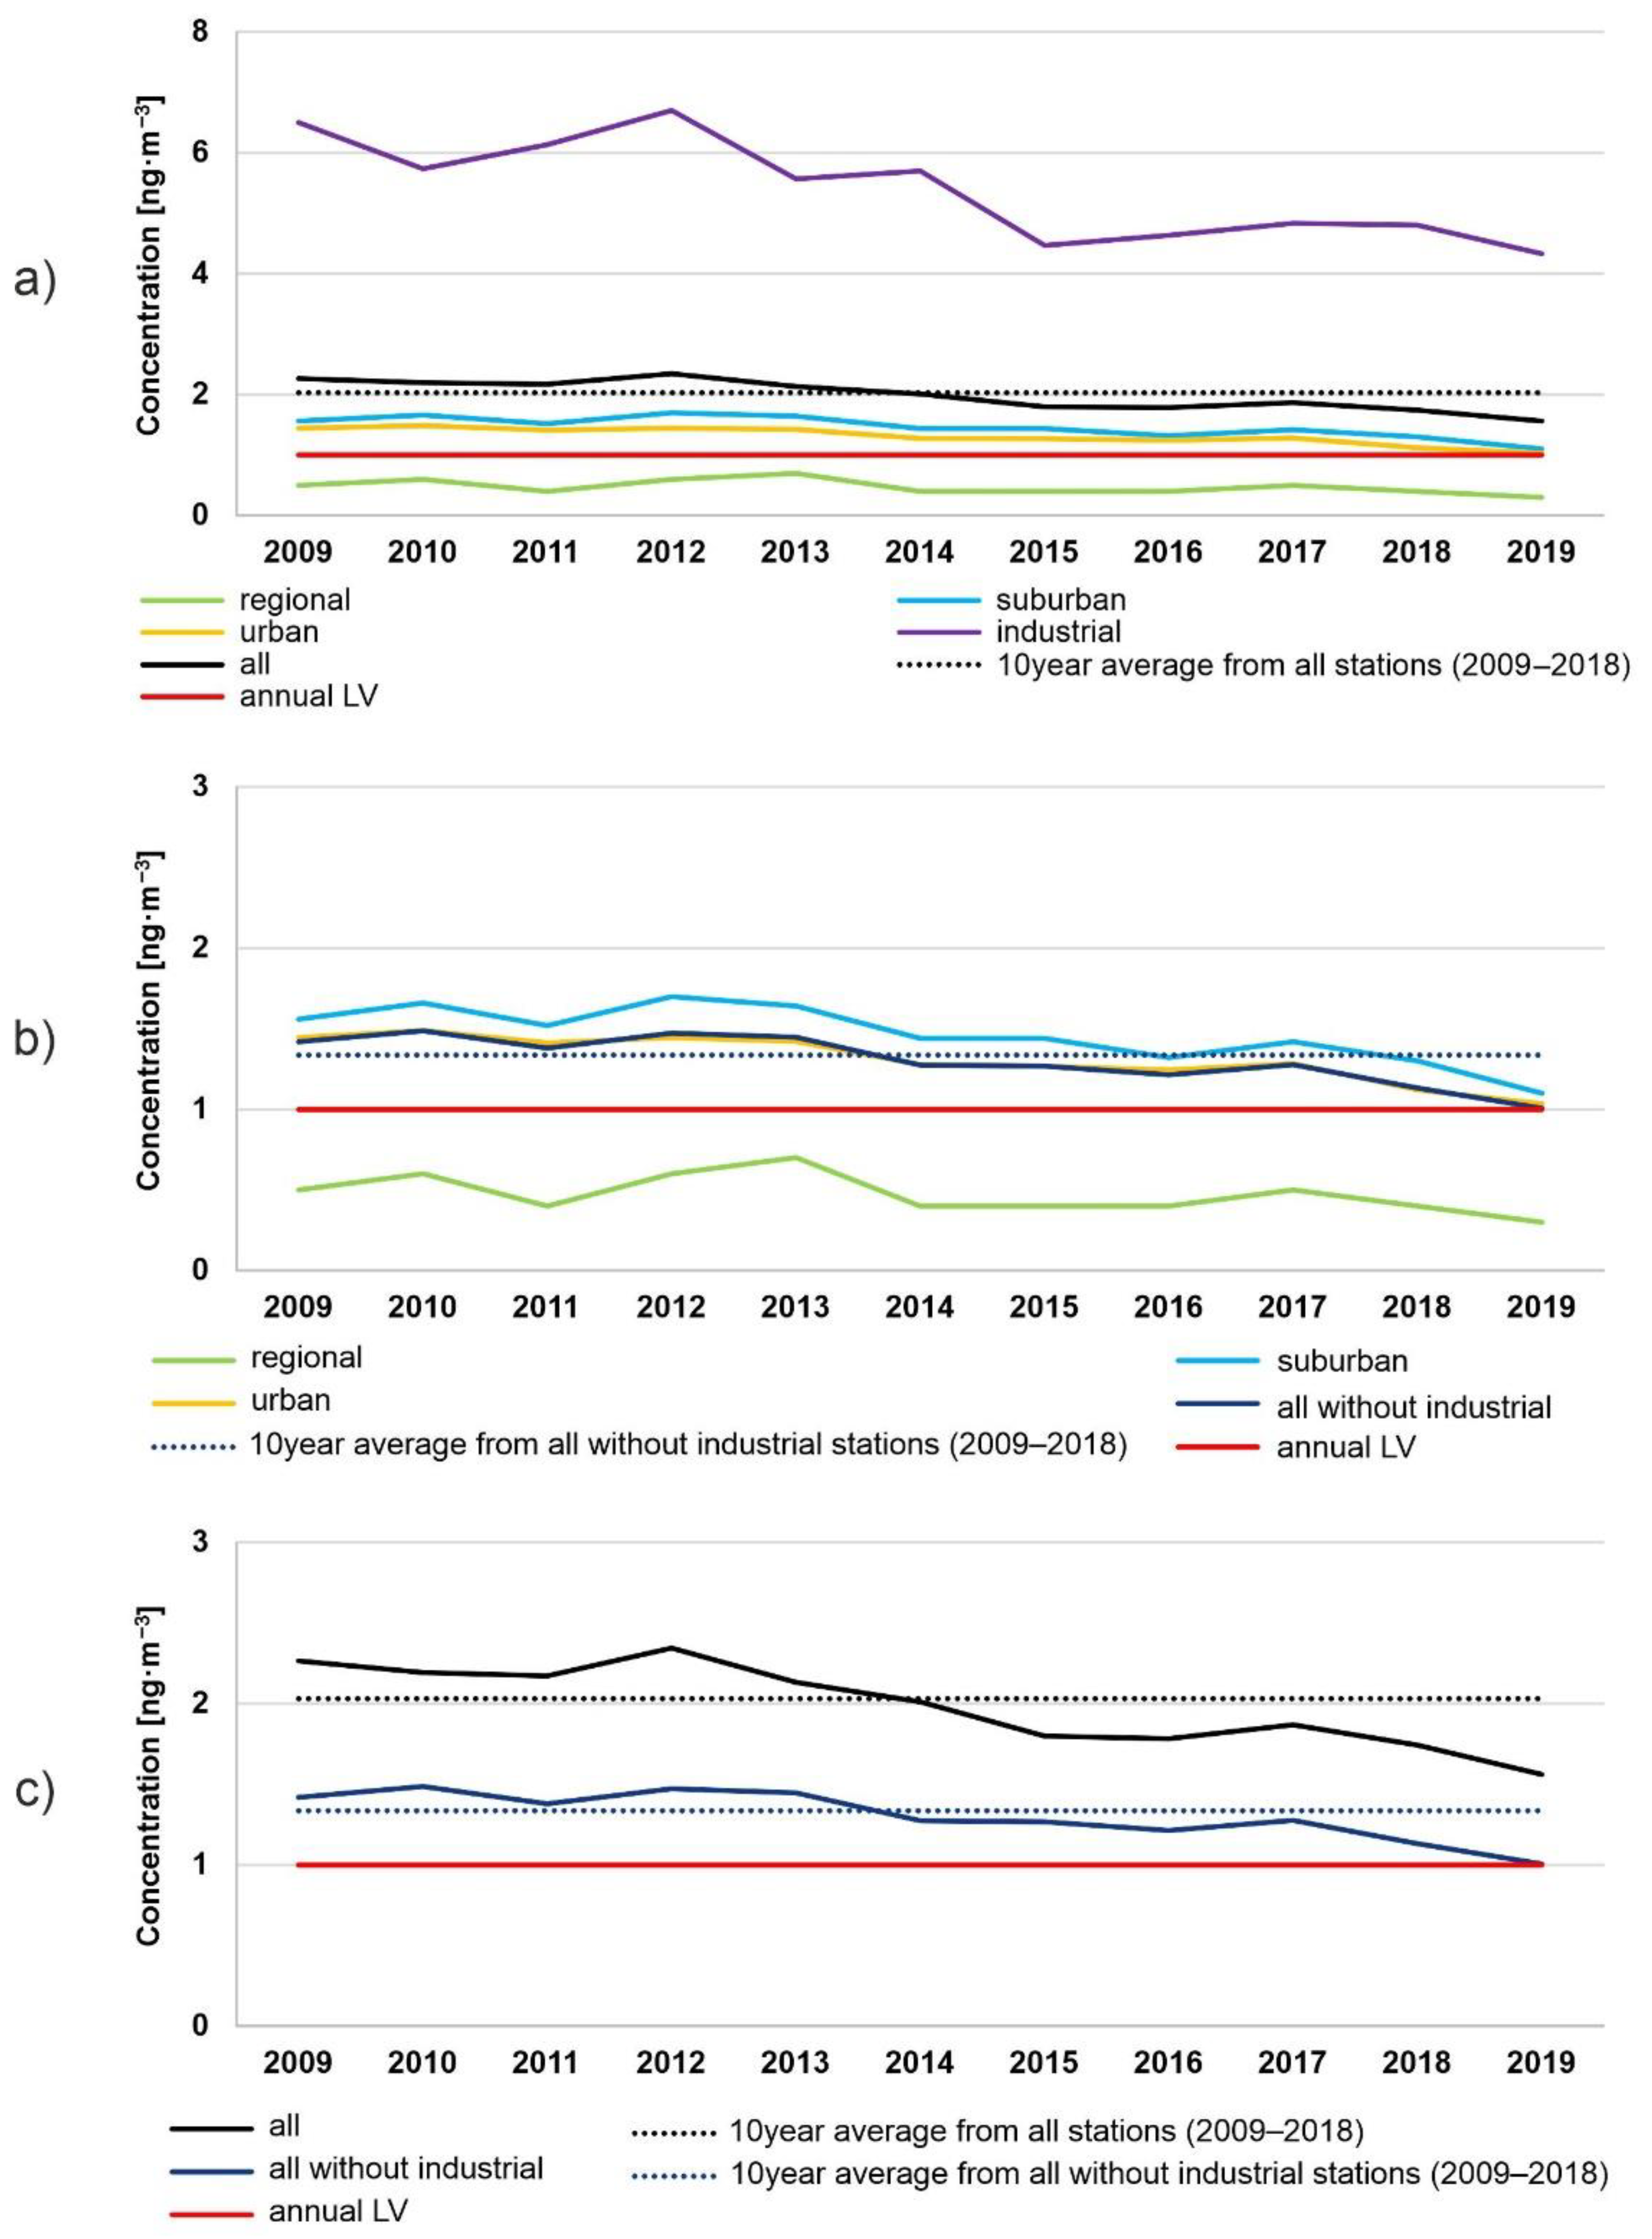
Annual average BaP concentrations at particular types of stations decreased for the period of 2009–2019, with several fluctuations due to the meteorological and dispersion situations. The highest concentrations were measured at industrial stations in the Ostrava/Karviná/Frýdek–Místek agglomeration. Slightly higher BaP concentrations were measured at suburban background stations than in urban background stations (Figure 3). This probably indicates the stronger influence of local heating boilers in suburban areas.
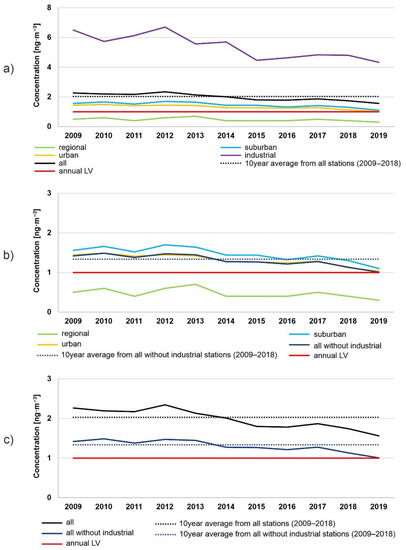
Figure 3.
Annual average concentrations of BaP at particular types of stations (a), at particular types of stations without industrial stations (b) and averages from all stations and from all stations without industrial stations (c).
On average for all stations, the annual average BaP concentrations for 2009–2019 ranged between 1.6 ng·m−3 in 2019 and 2.3 ng·m−3 in 2012 (Table 1, Figure 3). The value of 1.6 ng·m−3 in 2019 was about 20% lower in comparison with the ten-year average 2009–2018 value of 2 ng·m−3 (average of annual average concentrations from all selected stations for 2009–2018). On average, for all stations excluding the industrial ones, the annual average BaP concentrations for 2009–2019 were within a range of 1.0 in 2019 and 1.5 ng·m−3 in 2010; the ten-year average 2009–2018 value was 1.3 ng·m−3.

Table 1.
Concentrations of BaP [ng·m−3] at particular types of stations in 2009–2019.
On average for the type of station, the annual average concentrations of BaP exceeded the target value of 1 ng·m−3 set by a European directive (EC 2004) at industrial, suburban and urban stations. At industrial stations, the annual average concentrations for 2009–2019 ranged from 4.3 to 6.7 ng·m−3, on urban stations from 1.0 to 1.5 ng·m−3 and at suburban sites from 1.1 to 1.7 ng·m−3. At the Košetice regional station, the annual average concentrations were below the target value, ranging from 0.3 to 0.7 ng·m−3.
The average annual concentrations for industrial, suburban backgrounds and urban backgrounds, for all stations and overall, exhibited a significant decreasing trend. At the Košetice regional site, however, no significant trend was found. The approximate decrease in the annual average concentration was −0.07 ng·m−3·year−1 (Sen’s slope) on average for all stations.
Similarly, statistically significant decreases in average winter concentrations were found for all types of stations except the Košetice regional station. For the winter period, the average decrease for all stations overall was −0.13 ng·m−3·year−1 (Sen’s slope). In contrast, no significant trend was found for summer BaP concentrations.
From the above information, it can be concluded that the levels and development of BaP concentrations were significantly affected by the winter period, i.e., the length and temperature of the winter season and the consequent intensity of heating. BaP concentrations can reach high values during the winter period and are measured in a much wider range as compared to the summer concentrations. Based on the measured data, it can be indicated that approximately 90% of the values of daily summer concentrations from all stations for the period 2009–2019 were equal to or less than the target value. In winter, only about 35% of the concentration values from all stations for the period 2009–2019 equalled or were less than the target value (i.e., 1 ng·m−3).
3.2. BaP Deposition Flux Maps
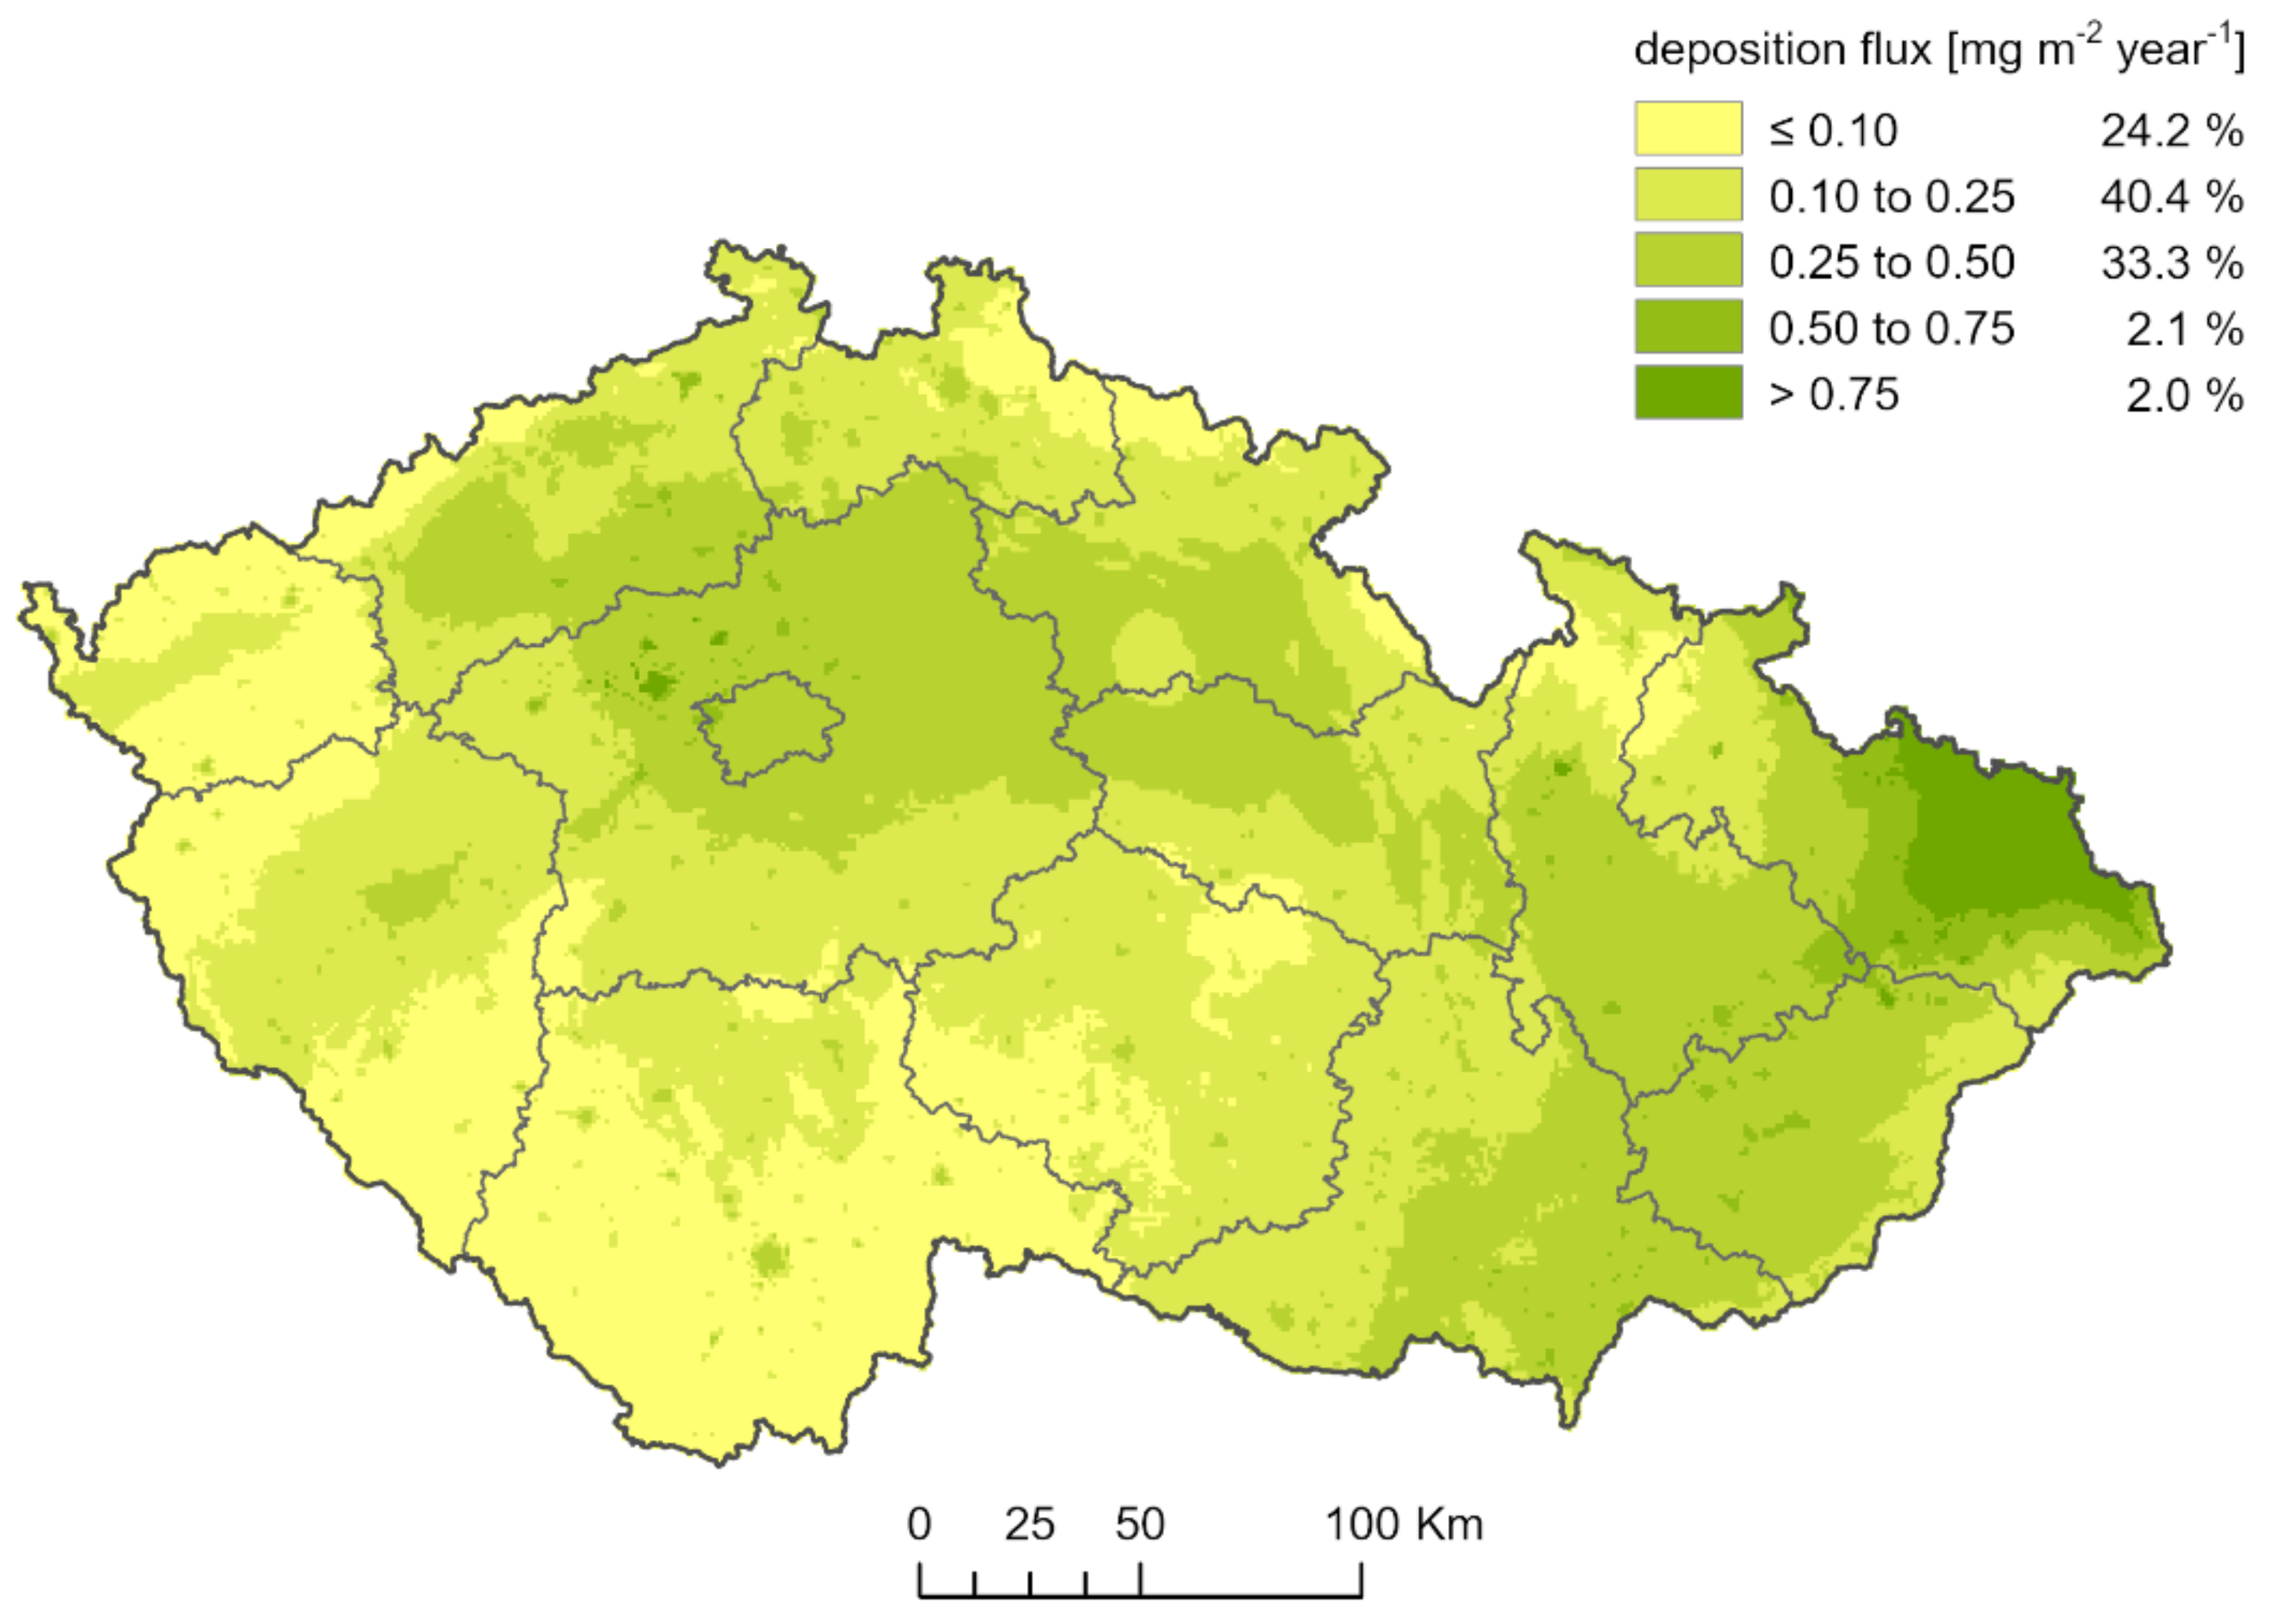
The spatial distribution of BaP dry deposition fluxes over the CR in 2012, 2015 and 2019 are presented in Figure 4, Figure 5 and Figure 6. As there are no limit or threshold values for BaP deposition, the deposition flux classes are chosen purely arbitrarily to make presented maps user-friendly and easily comparable among themselves. Our results show the steadily highest BaP loads in the broader Ostrava region in North Moravia, adjacent to the highly industrialised Lower Silesia in Poland.

Figure 4.
BaP dry deposition flux over Czech Republic, 2012.
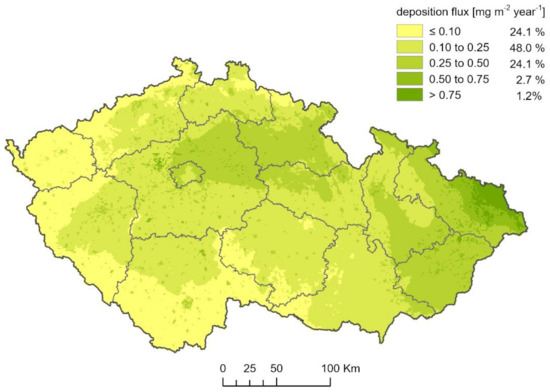
Figure 5.
BaP dry deposition flux over Czech Republic, 2015.

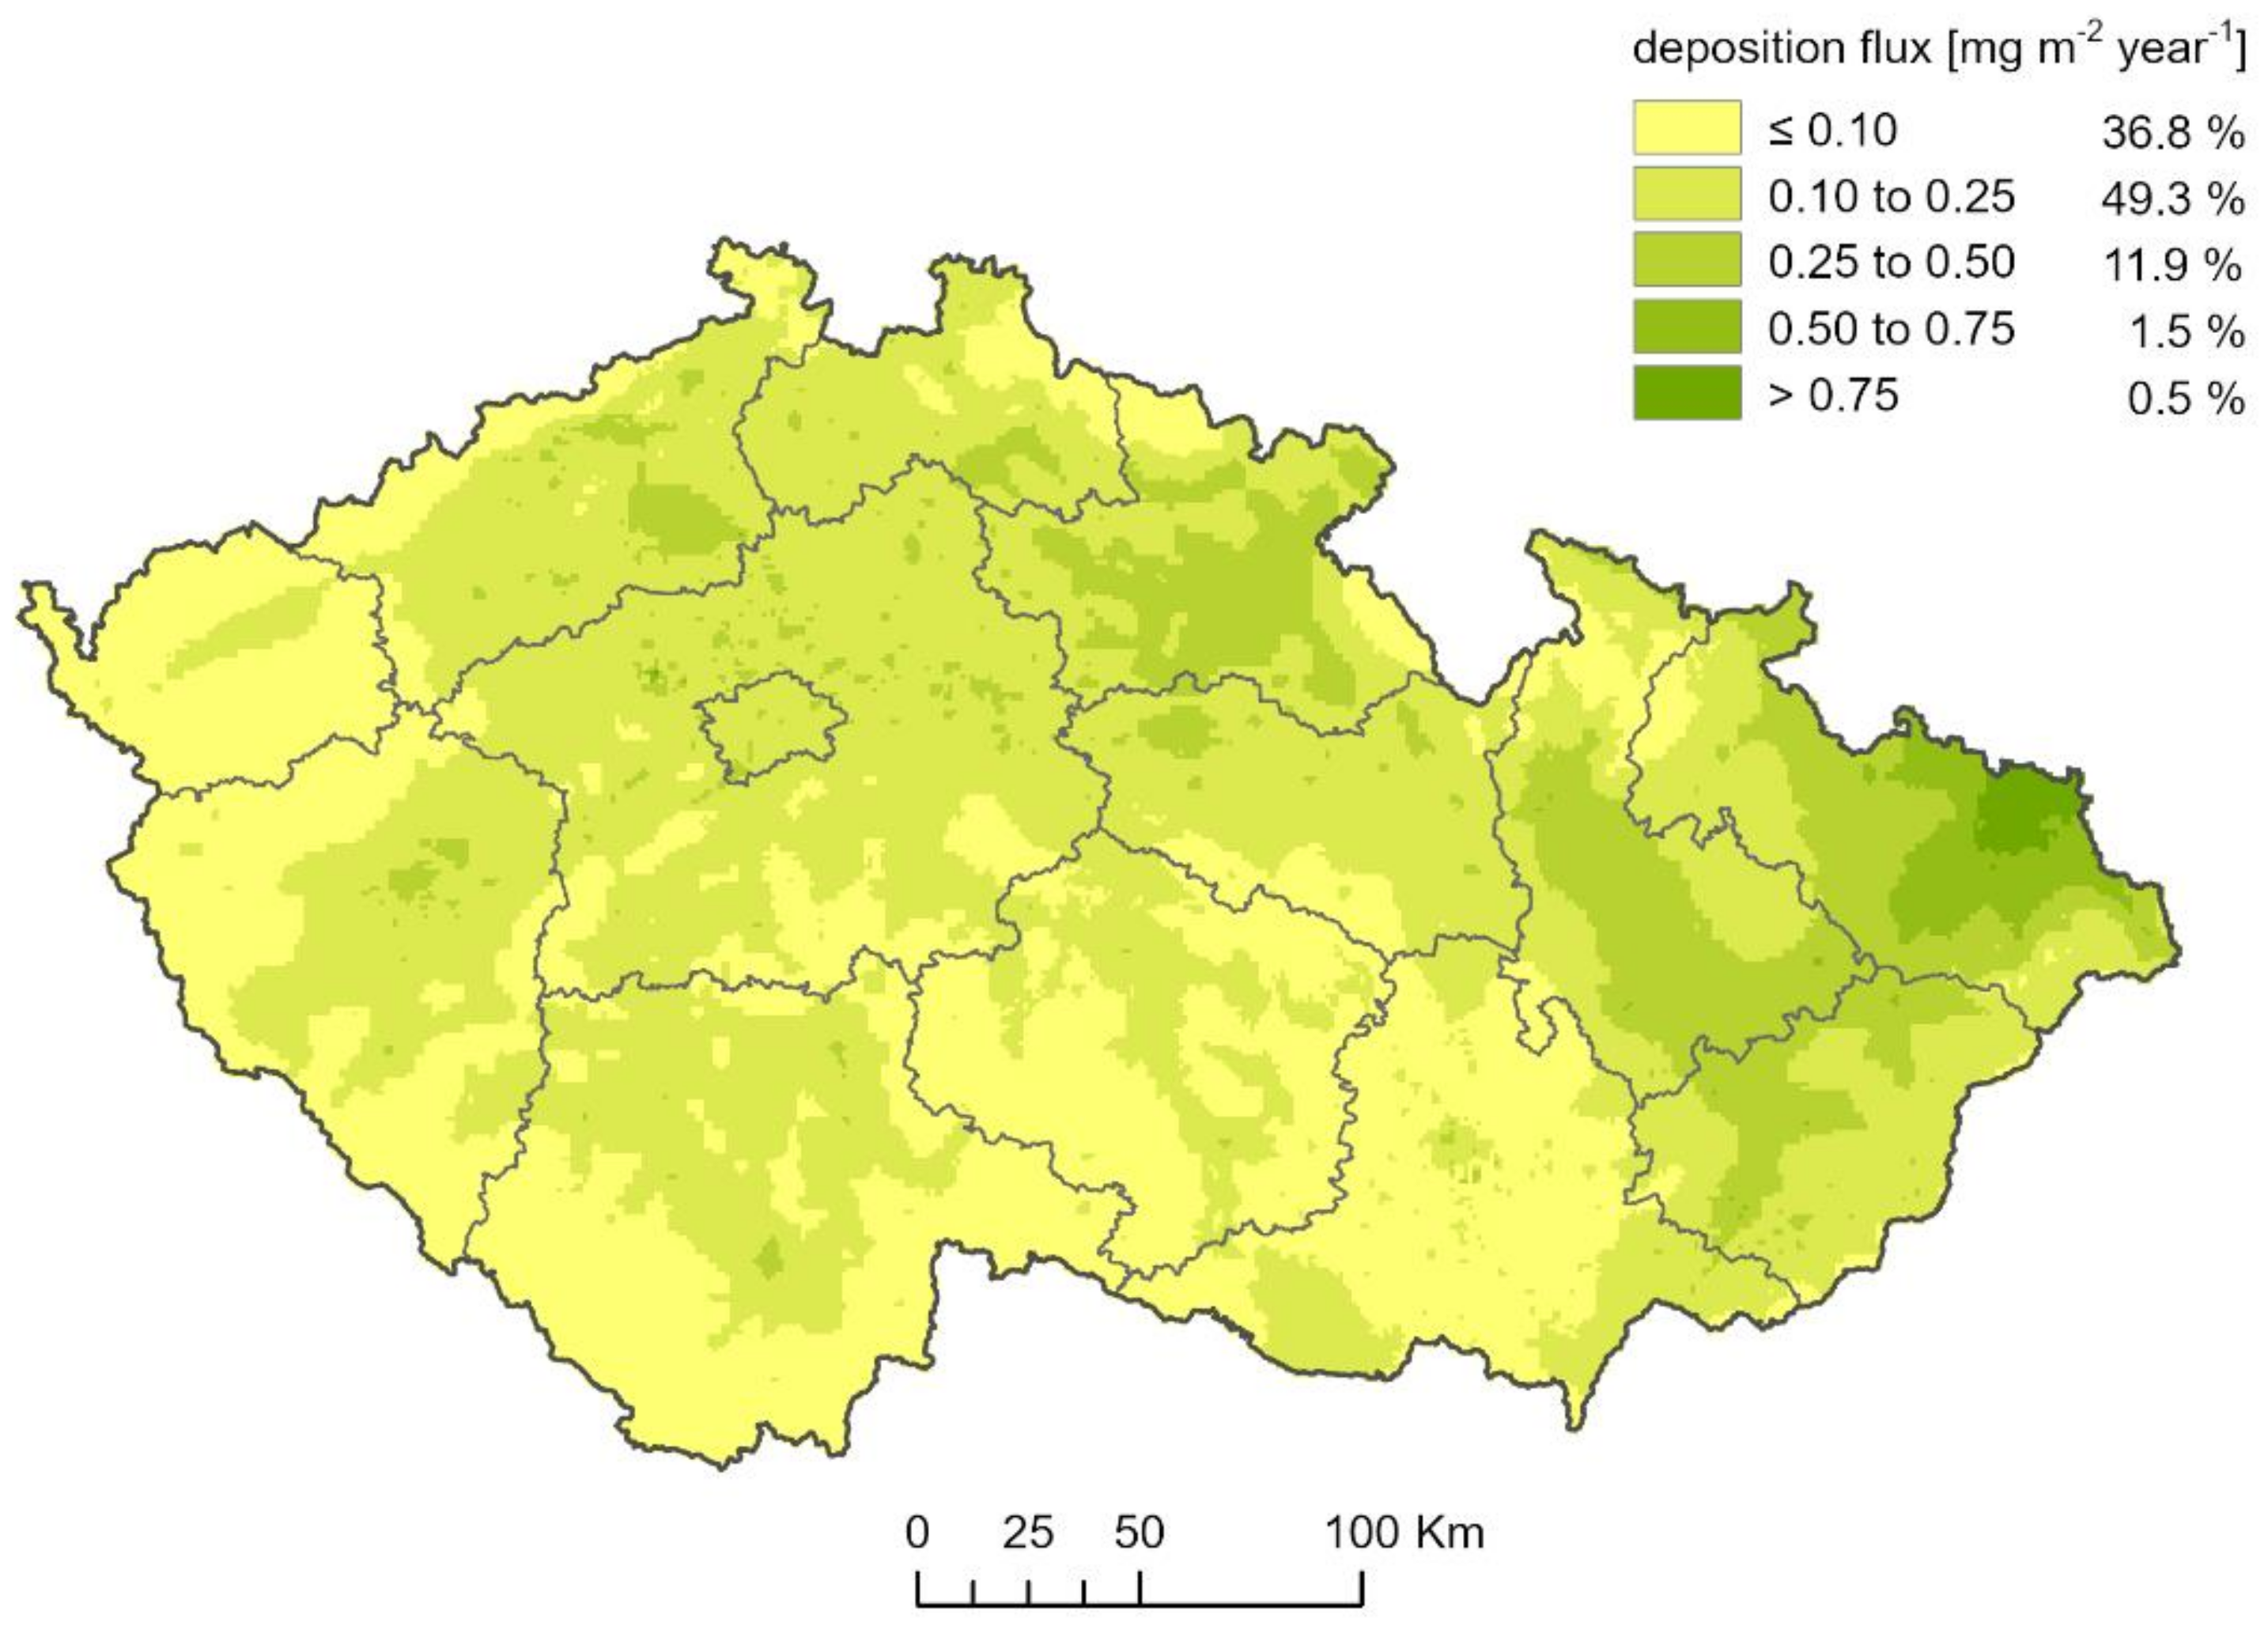
Figure 6.
BaP dry deposition flux over Czech Republic, 2019.
BaP deposition fluxes have obviously decreased over the years, reflecting the decreasing ambient BaP levels, documented by Table 2 showing the percentages of the CR area under BaP concentrations within defined ambient level classes. While the percentage in the lowest concentration class, i.e., less than 0.4 ng·m−3 increased over the years, the two highest concentration classes, i.e., above 2 ng·m−3, and between 1 and 2 ng·m−3 showed a steady decrease.
Table 2.
Relative shares of the CR territory within annual ambient BaP levels in 2012–2019.
The differences between the recent and past BaP loads can be seen from a spatial pattern in Figure 7, showing the differences between BaP dry deposition fluxes between 2012 and 2019. The dark green colour marks the biggest improvement in BaP deposition between 2012 and 2019, measured in the Ostrava region, Drahanská Vysočina and Chřiby (the areas east of Brno), the vicinity of the town of Most, and the north-western vicinity of the capital, Prague. The most pronounced decreases in BaP deposition (more than 0.5 mg·m−2·year−1) were observed in Kladno and Slaný near the capital of Prague, and the relatively largest region with the best improvement is situated north-west of Ostrava, i.e., Havířov, Bohumín and the areas between these towns. The maximum decrease was measured north-east of Bohumín, at the border with Poland. In contrast, slight increases in BaP deposition fluxes, 0.2 mg·m−2 at most, were observed in the surroundings of the towns of Železný Brod, Trutnov, Náchod and Broumov in Northern Bohemia, and České Budějovice in Southern Bohemia. About 45% of the CR showed a steady state in BaP deposition fluxes.
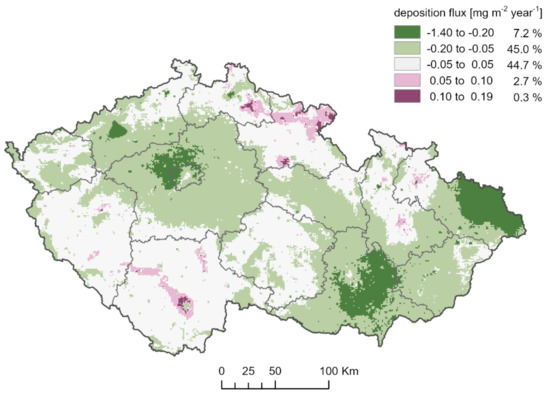
Figure 7.
Map showing the differences in BaP dry deposition flux between 2012 and 2019.
3.3. Comparison of Wet-Only and Dry BaP Deposition at the Košetice Site
According to our results, dry deposition dominates over the wet-only deposition pathway for BaP for NAOK. The annual wet-only deposition flux, ranging between 0.4 and 1.9 μg∙m−2·year−1, was on average about 1% in 2005–2020 (Figure 8). The highest wet-only deposition (1.9 μg∙m−2·year−1) was recorded in 2010, the lowest (0.4 μg∙m−2·year−1) in 2015. The lowest proportion of wet deposition (0.3% equal to 0.6 μg∙m−2·year−1) was recorded in 2006; the highest proportion, in contrast, was in 2019 (2%, 1.6 μg∙m−2·year−1).
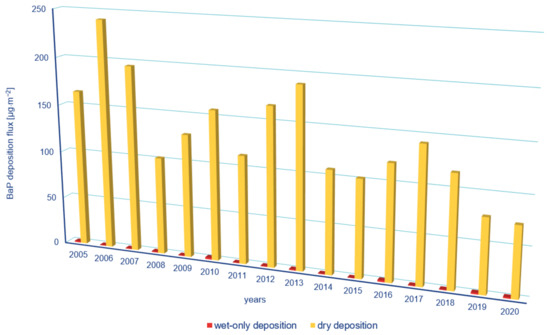
Figure 8.
BaP dry and wet-only deposition fluxes at the NAOK, 2005–2020.
The total BaP deposition at NAOK in 2005–2020 ranged between 74 and 242 μg∙m−2·year−1, with the highest value (241.6 μg∙m−2·year−1) measured in 2006, and the lowest (74.3 μg∙m−2·year−1) in 2020.
4. Discussion
4.1. Ambient BaP Exposure in the CR in Spatial and Temporal Context
The major emission sources of BaP are generally biomass and coal burning in residential heating systems, in particular in old-fashioned and incorrectly operated boilers [45]. In the CR, the major problems with airborne BaP over a long-term basis have been reported in the broader Ostrava region, where the target value of 1 ng·m−3 is often violated, as many as 7–9 times at some sites [34]. Among the emission sources contributing substantially to this unsatisfactory situation in the broader Ostrava region—in addition to old-fashioned residential boilers—are local steel factories, coking plants and regional air pollution transport from highly industrialised Poland with old-fashioned industries [46,47,48,49,50].
Our results indicated decreasing BaP depositions in 2012–2019, reflecting decreasing ambient BaP levels over the CR. A decrease in concentrations has been especially noticeable since 2014 in accordance with the milder winter seasons of 2014 and 2018, prevailing good dispersion conditions in 2015−2019, and decreasing coal consumption in recent years [21]. Moreover, the significant decrease at two particular stations, i.e., Ostrava-Poruba/CHMI and Kladno-Švermov, belonging among those with the highest, above-target value concentrations in the CR recorded, also point out the effect of improvements in residential heating [20]. In spite of the reported improvement, the broader Ostrava region in Northern Moravia, adjacent to the industrial and highly air-polluted Polish Silesia [51], remains the most BaP-loaded region of the CR [52].
Similar to other studies, e.g., [25,53,54,55], the typical seasonal behaviour of the BaP concentrations has been recorded. The reasons are generally known, i.e., seasonal BaP emission sources such as residential heating, higher emissions from motor vehicles, and less mixing in the atmosphere due to the thermal inversions [25,55,56]. During warmer seasons, on the other hand, concentrations are less dependent on anthropogenic emission sources. Summer concentrations are mainly determined by atmospheric conditions favourable for ambient air pollutant dispersion, increased chemical and photochemical decomposition of PAHs due to higher levels of solar radiation and high air temperatures [57,58,59]; hence, the trends in summer concentrations found were not significant.
Our finding of a decrease in BaP deposition fluxes corresponds with decreasing BaP emissions [20], though a decrease in emissions may not be the only cause of this favourable development. Interestingly, Bieser et al. [17], in their study modelling ambient BaP levels over Europe within different emission scenarios, reported that between 2000 and 2020, a large part (ca. 40%) of the ambient BaP concentration decrease was related to reductions in criteria emissions resulting in changed ambient ozone (O3) formation rather than to a direct BaP emission decrease. O3, as the principal chemical degradation agent for BaP, actually affects its ambient levels via photolytic degradation of particulate BaP [11,60]. Indeed, in the CR, a decrease in peak ambient O3 concentrations has been reported over time [61], though mean O3 concentrations have been on the increase since 2014 [62].
4.2. Relevance of BaP Dry Deposition for the Estimation of Total BaP Deposition Flux
In our BaP deposition spatial pattern, only dry deposition is considered. The wet contribution to BaP deposition could not be accounted for as there is only one site measuring BaP concentration in precipitation over the country, i.e., Košetice. However, for temperate climates (which is the climate in Central Europe), dry deposition of PAHs may dominate over wet deposition [60,63] and particle deposition seems to be the major pathway for all PAHs [64].
Nevertheless, it must be remarked that deposition fluxes of PAHs are site-dependent and that various authors have reported different predominant mechanisms. For example, Kiss et al. [65] reported comparable wet and dry deposition fluxes for PAHs in Hungary. We can speculate that if the BaP concentrations in the CR were measured in precipitation at several rural sites rather than only one, in particular at sites situated in relatively clean mountain areas, with lower ambient BaP concentrations but higher precipitation amounts, then the relative contribution of wet deposition to BaP deposition on these sites is likely to be higher. We do not expect, however, any radical change in the overall BaP spatial pattern. Meteorology plays a substantial role in deposition patterns, with the highest effect particularly in winter, with respect both to BaP emissions and dispersion conditions. In cold winters, BaP emissions are much higher due to higher demand for residential heating. Additionally the dispersion conditions are frequently deteriorated due to occurrence of the thermal inversions. Furthermore, the transport of air masses plays a crucial role in deposition processes [66,67].
With respect to BaP specifically: BaP bound to particles (aerosol), i.e., BaP as measured by the CHMI, is assumed to form the predominant part of atmospheric BaP due to its low volatility. Guerreiro et al. [10] reported, for Europe, that 90% of BaP is found in particles and only up to 10% are in the gas phase. When applying the TREND model over the European domain, even 100% BaP was assumed to exist in the solid phase with respect to temperatures being closer to 10 °C rather than 20 °C, i.e., the temperature when BaP partitions to the gas phase [68].
4.3. Strength and Limitations of the BaP Concentration and Deposition Maps
4.3.1. Strength of Final BaP Deposition Maps
We have developed BaP deposition maps at the national level in spatial resolution of 1 × 1 km, using the methodological approach of Regression–Interpolation–Merging Mapping, consisting of merging direct measurements of BaP concentrations in ambient air, models and auxiliary data, and a uniform annual mean deposition velocity of 0.89 cm·s−1 for the entire CR domain. Hence, the final BaP deposition flux spatial patterns are primarily influenced by ambient BaP levels. The maps clearly show the spatial differences in BaP loadings in space and time in detail and indicate regions where human health and environmental effects of BaP can be expected. The maps presented the benefit of long-term regular direct measurements of BaP concentrations in ambient air at different types of sites as classified by EoI [69], reflecting different environments (urban, rural, industrial, traffic), dispersion model outputs and auxiliary data.
4.3.2. Uncertainties in the BaP Concentration Maps
The BaP concentration maps created on the basis of BaP measurements and auxiliary data (i.e., outputs of dispersion models and PM10 or PM2.5 concentration maps) are burdened by higher uncertainty than air pollution maps for other criteria pollutants, such as SO2, NOx, O3, PM10 and PM2.5. This high uncertainty is due to the inadequate number of direct ambient BaP concentration measurements. At the same time, uncertainty differs for rural and urban maps. The uncertainty estimated by a cross-validation analysis and expressed as the relative RMSE is lower for urban than for rural maps. This consists of a higher number of BaP measurements in urban than in rural areas (e.g., 36 urban and 11 rural stations in 2019). The European directive EC, 2004 [12] requires 60% uncertainty at most for modelling BaP concentrations, and the air pollution maps for urban areas were within this limit, whereas in rural areas, the estimated uncertainty was higher than the required value.
In comparison with European maps of annual mean BaP concentrations, which were prepared by similar methodologies [10,41], the uncertainty of the Czech BaP concentration maps is lower. It is necessary to specify, however, that this 60% includes only the interpolation process itself. Additionally, the quality of BaP concentration maps is also affected by the quality of the input data, i.e., the output of dispersion models and the quality of emission data, and obviously of the directly measured BaP ambient air concentrations. Air pollution maps of BaP, however, have been prepared on the basis of the best data currently available and the best approach currently available, and the maps—despite their higher uncertainty—present a reasonable estimate of BaP pollution levels in the CR.
4.3.3. Uncertainties Due to Deposition Velocity
Fairly high uncertainty may arise from the selection of a proper deposition velocity. Generally, for all ambient air pollutants, deposition velocity is affected by numerous factors, such as meteorological parameters (wind speed, relative humidity, atmospheric stability), properties of the receptor surface and the physical and chemical properties of the substance examined [70]. Hence, deposition velocity can vary in a wide range, whereas an assumption of one constant value is a very crude approximation, which may result in large uncertainty in estimating the deposition flux [1,71]. In the scientific literature, a wide range of deposition velocities for both PAHs as a group and for individual PAHs is reported [72,73]. For BaP as an individual, however, deposition fluxes rather than dry deposition velocities themselves are frequently presented [74,75]. That was the reason we opted for using the deposition velocity computed by the EMEP model. The value of 0.89 cm·s−1 that we worked with is similar to the 0.76 cm·s−1 reported by Chang et al. [76] as an average for three sites in Taiwan.
4.4. BaP at the Košetice Site
The Košetice observatory is the only site in the CR monitoring PAHs, including BaP in both ambient air and precipitation [77]. The reported results for this station indicated higher PAH loading as compared to other European rural sites participating in the EMEP project, surprisingly equalling one-third of the PAH concentration measured in big US cities such as Chicago and Cleveland, likely explainable by different fuel consumption [78]. According to our estimate, the total BaP deposition at NAOK ranged between 74 and 242 μg∙m−2 per year, with the highest value (241.6 μg∙m−2 per year) measured in 2006 and the lowest (74.3 μg∙m−2 per year) in 2020. These deposition fluxes are much higher than these reported by Settimo et al. [79] for Italy and referenced fluxes for some European sites regardless of their type, ibidem.
According to our estimates, wet-only deposition surprisingly contributed regularly only about 1% to the total annual BaP deposition flux at this site. In another recent two years, i.e., 2019 and 2020, the slightly higher proportion of wet-only BaP deposition (2% in 2019 and 1.8% in 2020) was likely due to meteorological conditions: with respect to meteorology, 2019 had exceptionally high air temperature, distinctly better dispersion conditions and the usual annual precipitation amount, and 2020 had considerably higher air temperature, standard dispersion conditions and a higher annual precipitation amount.
The estimated wet-only BaP deposition flux at the Košetice observatory is much lower than might be expected for a rural site—a station representing rural background ambient air pollution levels for the CR. Such a value, however, might be supported by estimates from other sites, such as Lake Superior, for which the dry aerosol deposition was reported to dominate the wet removal mechanism for PAHs by an average ratio of 9:1 [80].
5. Conclusions
We have developed maps of BaP dry deposition fluxes over the CR for 2012, 2015 and 2019 in a spatial resolution of 1 × 1 km. These spatial patterns have been constructed on the basis of maps of annual BaP concentrations in ambient air and overall deposition velocity of 0.89 cm·s−1 uniform for the entire territory and over the entire calendar year. Measurements from the only station in the CR measuring BaP concentrations in precipitation, i.e., Košetice, suggested that the wet-only deposition pathway played a negligible role in total BaP deposition in rural areas in the CR. Hence, the dry deposition map of BaP can be considered an acceptable approximation of total BaP deposition flux in conditions of BaP-polluted Central Europe. We have found an overall decrease in BaP deposition fluxes over 2012–2019, reflecting decreasing ambient BaP levels. These were possibly related to decreases in BaP emissions in the CR and reductions in emissions of criteria pollutants in Europe, likely influencing the formation of O3, a principal chemical degradation agent for BaP. In spite of the presented decrease in BaP deposition fluxes, the broader Ostrava region, adjacent to the industrial Polish Silesia, remains the most BaP-loaded area in the CR. In spite of the high uncertainty of the BaP deposition maps, resting in the inherent properties of the selected methodological approach, the limitations of which we indicated in the Discussion section, we believe that the maps provided contribute to our better understanding of different BaP loadings in the CR over time. Furthermore, the BaP deposition maps identify the areas with the highest BaP deposition fluxes where environmental impacts can be expected. The spatial pattern of BaP deposition flux is a valuable tool that might be used for a broader environmental analysis relating the impacts of airborne BaP with its impacts on the environment and ecosystems.
Author Contributions
Conceptualization, I.H.; methodology, I.H., P.K., M.S., L.V.; formal analysis, P.K., M.S., L.V. and H.Š.; investigation, I.H.; data curation, H.Š.; writing—original draft preparation, I.H.; writing—review and editing, I.H., M.S., L.V. and H.Š.; visualization, P.K. and M.S.; project administration, I.H. All authors have read and agreed to the published version of the manuscript.
Funding
This research was funded by the Technological Agency of the Czech Republic (TAČR), Joint Grant No. SS01010231 “Dopady atmosférické depozice na vodní prostředí se zohledněním klimatických podmínek”.
Institutional Review Board Statement
Not applicable.
Informed Consent Statement
Not applicable.
Data Availability Statement
Not applicable.
Acknowledgments
The input data were provided by the Czech Hydrometeorological Institute. We thank Erin Naillon for proofreading our manuscript.
Conflicts of Interest
The authors declare no conflict of interest.
References
- Seinfeld, J.H.; Pandis, S.N. Atmospheric Chemistry and Physics; John Wiley: New York, NY, USA, 1998; p. 1326. [Google Scholar]
- Fernández, P.; Grimalt, J.O.; Vilanova, R.M. Atmospheric Gas-Particle Partitioning of Polycyclic Aromatic Hydrocarbons in High Mountain Regions of Europe. Environ. Sci. Technol. 2002, 36, 1162–1168. [Google Scholar] [CrossRef] [PubMed]
- Callén, M.S.; de la Cruz, M.T.; López, J.M.; Murillo, R.; Navarro, M.V.; Mastral, A.M. Some inferences on the mechanism of atmospheric gas/particle partitioning of polycyclic aromatic hydrocarbons (PAH) at Zaragoza (Spain). Chemosphere 2008, 73, 1357–1365. [Google Scholar] [CrossRef] [PubMed] [Green Version]
- Eagar, J.D.; Ervens, B.; Herckes, P. Impact of partitioning and oxidative processing of PAH in fogs and clouds on atmospheric lifetimes of PAH. Atmos. Environ. 2017, 160, 132–141. [Google Scholar] [CrossRef] [Green Version]
- Nielsen, T.; Jorgensen, H.E.; Larsen, J.C.; Poulsen, M. City air pollution of polycyclic aromatic hydrocarbons and other mutagens: Occurrence, sources and health effects. Sci. Total Environ. 1996, 189–190, 41–49. [Google Scholar] [CrossRef]
- Jiménez-Guerrero, P.; Ratola, N. Influence of the North Atlantic oscillation on the atmospheric levels of benzo[a]pyrene over Europe. Clim. Dyn. 2021, 57, 1173–1186. [Google Scholar] [CrossRef]
- Masclet, P.; Mouvier, G.; Nikolaou, K. Relative decay index and sources of polycyclic aromatic hydrocarbons. Atmos. Environ. 1986, 20, 439–446. [Google Scholar] [CrossRef]
- Thomas, J.F.; Mukai, M.; Tebbens, B.D. Fate of airborne benzoapyrene. Environ. Sci. Technol. 1968, 2, 33. [Google Scholar]
- Lunde, G.; Bjorseth, A. Polycyclic aromatic hydrocarbons in long-range transported aerosols. Nature 1977, 268, 518–519. [Google Scholar] [CrossRef]
- Guerreiro, C.B.B.; Horálek, J.; de Leuw, F.; Couvidat, F. Benzo(a)pyrene in Europe: Ambient air concentrations, population exposure and health effects. Environ. Pollut. 2016, 214, 657–667. [Google Scholar] [CrossRef]
- WG PAH/Working Group on Polycyclic Aromatic Hydrocarbons. Ambient Air Pollution by Polycyclic Aromatic Hydrocarbons (PAH); Position Paper; European Community: Luxembourg, 2001; Available online: https://ec.europa.eu/environment/archives/air/pdf/pp_pah.pdf (accessed on 20 November 2021).
- EC. Directive 2004/107/EC of the European Parliament and of the Council of 15 December 2004 Relating to Arsenic, Cadmium, Mercury and Polycyclic Aromatic Hydrocarbons in Ambient Air; OJ L 23, 26.1.2005; EC: Strasbourg, France, 2004; pp. 3–16. [Google Scholar]
- Boström, C.-E.; Gerde, P.; Hanberg, A.; Jernström, B.; Johansson, C.; Kyrklund, T.; Rannug, A.; Törnqvist, M.; Victorin, K.; Westerholm, R. Cancer risk assessment, indicators and guidelines for polycyclic aromatic hydrocarbons in ambient air. Environ. Health Perspect. 2002, 110, 451–489. [Google Scholar]
- Kim, K.-H.; Jahan, S.A.; Kabir, E.; Brown, R.J.C. A review of airborne polycyclic aromatic hydrocarbons (PAHs) and their human health effects. Environ. Int. 2013, 60, 71–80. [Google Scholar] [CrossRef] [PubMed]
- EEA. Air Quality in Europe—2019 Report; EEE Report No. 10/2019; European Environment Agency: Luxembourg, 2019.
- Bidleman, T.F. Atmospheric processes—Wet and dry deposition of organic compounds are controlled by their vapor-particle partitioning. Environ. Sci. Technol. 1988, 22, 361–367. [Google Scholar] [CrossRef]
- Bieser, J.; Aulinger, A.; Matthias, V.; Quante, M. Impact of Emission Reductions between 1980 and 2020 on Atmospheric Benzo[a]pyrene Concentrations over Europe. Water Air Soil Pollut. 2012, 223, 1393–1414. [Google Scholar] [CrossRef] [Green Version]
- Cao, X.; Huo, S.; Zhang, H.; Ma, C.; Zheng, J. Seasonal variability in multimedia transport and fate of benzo[a]pyrene (BaP) affected by climatic factors. Environ. Pollut. 2022, 292, 118404. [Google Scholar] [CrossRef] [PubMed]
- Hůnová, I. Ambient Air Quality in the Czech Republic: Past and Present. Atmosphere 2020, 11, 214. [Google Scholar] [CrossRef] [Green Version]
- Schreiberová, M.; Vlasáková, L.; Vlček, O.; Šmejdířová, J.; Horálek, J.; Bieser, J. Benzo[a]pyrene in the Ambient Air in the Czech Republic: Emission Sources, Current and Long-Term Monitoring Analysis and Human Exposure. Atmosphere 2020, 11, 955. [Google Scholar] [CrossRef]
- CHMI. Air Pollution in the Czech Republic in 2020; Graphical Yearbook (Czech/English); Czech Hydrometeorological Institute: Prague, Czech Republic, 2021.
- Mann, H.B. Nonparametric tests against trend. Econometrica 1945, 13, 245–259. [Google Scholar] [CrossRef]
- Kendall, M.G. Rank Correlation Methods; Charles Gran: London, UK, 1955. [Google Scholar]
- Garrido, A.; Jimenez-Guerrero, P.; Ratola, N. Levels, trends and health concerns of atmospheric PAHs in Europe. Atmos. Environ. 2014, 99, 474–484. [Google Scholar] [CrossRef]
- Albuquerquea, M.; Coutinho, M.; Borrego, C. Long-term monitoring and seasonal analysis of polycyclic aromatic hydrocarbons (PAHs) measured over a decade in the ambient air of Porto, Portugal. Sci. Total Environ. 2016, 543, 439–448. [Google Scholar] [CrossRef]
- Barzeghara, V.; Sarbakhshc, P.; Hassanvandd, M.S.; Faridie, S.; Gholampoura, A. Long-term trend of ambient air PM10, PM2.5, and O3 and their health effects in Tabriz city, Iran, during 2006–2017. Sustain. Cities Soc. 2020, 54, 101988. [Google Scholar] [CrossRef]
- Hůnová, I.; Bäumelt, V.; Modlík, M. Long-term trends in nitrogen oxides at different types of monitoring stations in the Czech Republic. Sci. Total Environ. 2020, 699, 134378. [Google Scholar] [CrossRef] [PubMed]
- De Leeuw, F.A.A.M. Trends in ground level ozone concentrations in the European Union. Environ. Sci. Policy 2000, 3, 189–199. [Google Scholar] [CrossRef]
- Gilbert, R.O. Statistical Methods for Environmental Pollution Monitoring; Van Nostrand Reinhold: New York, NY, USA, 1987. [Google Scholar]
- R Core Team. R: A Language and Environment for Statistical Computing; R Foundation for Statistical Computing: Vienna, Austria, 2019; Available online: www.R-project.org (accessed on 24 November 2020).
- ETC/ACC. Spatial Mapping of Air Quality for European Scale Assessment. ETC/ACC Technical Paper 2006/6. 2007. Available online: https://www.eionet.europa.eu/etcs/etc-atni/products/etc-atni-reports/etcacc_technpaper_2006_6_spat_aq (accessed on 19 May 2020).
- CHMI. Air Pollution in the Czech Republic in 2012; Graphical Yearbook (Czech/English); Czech Hydrometeorological Institute: Prague, Czech Republic, 2013.
- CHMI. Air Pollution in the Czech Republic in 2015; Graphical Yearbook (Czech/English); Czech Hydrometeorological Institute: Prague, Czech Republic, 2016.
- CHMI. Air Pollution in the Czech Republic in 2019; Graphical Yearbook (Czech/English); Czech Hydrometeorological Institute: Prague, Czech Republic, 2020.
- Cressie, N. Statistics for Spatial Data; Wiley: New York, NY, USA, 1993. [Google Scholar]
- EMEP/MSC-E: Database on Modelling Results of HMs and POPs (1990–2017). Available online: http://en.msceast.org/index.php/pollution-assessment/emep-domain-menu?id=119 (accessed on 3 July 2020).
- Gusev, A.; Mantseva, L.; Shatalov, V.; Strukov, B. Regional Multicompartment Model MSCE-POP; EMEP/MSC-E Technical Report 5/2005; Meteorological Synthesizing Centre-East: Moscow, Russia, 2005. [Google Scholar]
- Gusev, A.; Ilyin, I.; Mantseva, L.; Rozovskaya, O.; Shatalov, V.; Travnikov, O. Progress in Further Developments of MSCE-HM and MSCE_POP Models; EMEP/MSC-E Technical Report 4/2006; Meteorological Synthesizing Centre-East: Moscow, Russia, 2006. [Google Scholar]
- CHMI. Czech Reference Dispersion Model SYMOS’97 (in Czech Only). 2020. Available online: http://portal.chmi.cz/aktualni-situace/stav-ovzdusi/modelovani-kvality-ovzdusi/model-symos (accessed on 30 April 2020).
- CAMx User´s Guide, Version 7.10. Available online: https://camx-wp.azurewebsites.net/Files/CAMxUsersGuide_v7.10.pdf (accessed on 12 December 2021).
- ETC/ATNI. Benzo(a)pyrene (BaP) Annual Mapping. Evaluation of Its Potential Regular Updating. ETC/ATNI Report 18/2021 2022. 2022. Available online: https://doi.org/10.5281/zenodo.5898376 (accessed on 8 February 2022). [CrossRef]
- Gusev, A. (Meteorological Synthesizing Centre—East, Moscow, Russia). Personal communication, 2020. [Google Scholar]
- Váňa, M.; Holubová Smejkalová, A.; Svobodová, J.; Machálek, P. Long-Term Trends of Air Pollution at National Atmospheric Observatory Košetice (ACTRIS, EMEP, GAW). Atmosphere 2020, 11, 537. [Google Scholar] [CrossRef]
- Lhotka, R.; Pokorná, P.; Zíková, N. Long-Term Trends in PAH Concentrations and Sources at Rural Background Site in Central Europe. Atmosphere 2019, 10, 687. [Google Scholar] [CrossRef] [Green Version]
- Křůmal, K.; Mikuška, P.; Horák, J.; Hopan, F.; Krpec, K. Comparison of emissions of gaseous and particulate pollutants from the combustion of biomass and coal in modern and old-type boilers used for residential heating in the Czech Republic, Central Europe. Chemosphere 2019, 229, 51–59. [Google Scholar] [CrossRef]
- Mikuška, P.; Křůmal, K.; Večeřa, Z. Characterization of organic compounds in the PM2.5 aerosol in winter in an industrial urban area. Atmos. Environ. 2015, 105, 97–108. [Google Scholar] [CrossRef]
- Vossler, T.; Cernikovsky, L.; Novak, J.; Placha, H.; Krejci, B.; Nikolova, I.; Chalupnickova, E.; Williams, R. An investigation of local and regional sources of fine particulate matter in Ostrava, the Czech Republic. Atmos. Pollut. Res. 2015, 6, 454–463. [Google Scholar]
- Pokorná, P.; Hovorka, J.; Klán, M.; Hopke, P.K. Source apportionment of size resolved particulate matter at a European air pollution hot spot. Sci. Total Environ. 2015, 502, 172–183. [Google Scholar] [CrossRef]
- Horak, J.; Kubonova, L.; Krpec, K.; Hopan, F.; Kubesa, P.; Motyka, O.; Laciok, V.; Dej, M.; Ochodek, T.; Placha, D. PAH emissions from old and new types of domestic hot water boilers. Environ. Pollut. 2017, 225, 31–39. [Google Scholar] [CrossRef]
- Kozáková, J.; Pokorná, P.; Vodička, P.; Ondráčková, L.; Ondráček, J.; Křůmal, K.; Mikuška, P.; Hovorka, J.; Moravec, P.; Schwarz, J. The influence of local emissions and regional air pollution transport on a European air pollution hot spot. Environ. Sci. Pollut. Res. 2019, 26, 1675–1692. [Google Scholar] [CrossRef]
- Łupikasza, E.B.; Niedźwiedź, T. Relationships between Vertical Temperature Gradients and PM10 Concentrations during Selected Weather Conditions in Upper Silesia (Southern Poland). Atmosphere 2022, 13, 125. [Google Scholar] [CrossRef]
- Volná, V.; Hladký, D.; Seibert, R.; Krejčí, B. Transboundary Air Pollution Transport of PM10 and Benzo[a]pyrene in the Czech–Polish Border Region. Atmosphere 2022, 13, 341. [Google Scholar] [CrossRef]
- Tham, Y.W.F.; Takeda, K.; Sakugawa, H. Polycyclic aromatic hydrocarbons (PAHs) associated with atmospheric particles in Higashi Hiroshima, Japan: Influence of meteorological conditions and seasonal variations. Atmos. Res. 2008, 88, 224–233. [Google Scholar] [CrossRef]
- Masiol, M.; Hofer, A.; Squizzato, S.; Piazza, R.; Rampazzo, G.; Pavoni, B. Carcinogenic and mutagenic risk associated to airborne particle-phase polycyclic aromatic hydrocarbons: A source apportionment. Atmos. Environ. 2012, 60, 375–382. [Google Scholar] [CrossRef]
- Gianelle, V.; Colombi, C.; Caserini, S.; Ozgen, S.; Galante, S.; Marongiu, A.; Lanzani, G. Benzo(a)pyrene air concentrations and emission inventory in Lombardy region, Italy. Atmos. Pollut. Res. 2013, 4, 257–266. [Google Scholar] [CrossRef] [Green Version]
- Liu, Y.; Tao, S.; Yang, Y.; Dou, H.; Yang, Y.; Coveney, R.M. Inhalation exposure of traffic police officers to polycyclic aromatic hydrocarbons (PAHs) during the winter in Beijing, China. Sci. Total Environ. 2007, 383, 98–105. [Google Scholar] [CrossRef]
- Li, Z.; Porter, E.N.; Sjodin, A.; Larry, L.; Need-Ham, L. Characterization of PM2.5 bound polycyclic aromatic hydrocarbons in Atlanta. Seasonal vari-ations at urban, suburban, and rural ambient air monitoring sites. Atmos. Environ. 2009, 49, 4187–4193. [Google Scholar] [CrossRef]
- Ludykar, D.; Westerholm, R.; Almen, J. Cold start emissions at +22, −7 and −20 degrees C ambient temperatures from a three-way catalyst (TWC) car: Regulated and unregulated exhaust components. Sci. Total Environ. 1999, 235, 65–69. [Google Scholar] [CrossRef]
- Teixeira, E.C.; Agudelo-Castañeda, D.M.; Fachel, J.M.G.; Leal, K.A.; de Oliveira Garcia, K.; Wiegand, F. Source identification and seasonal variation of polycyclic aromatic hydrocarbons associated with atmospheric fine and coarse particles in the Metropolitan Area of Porto Alegre, RS, Brazil. Atmos. Res. 2012, 118, 390–403. [Google Scholar] [CrossRef]
- Keyte, I.J.; Harrison, R.M.; Lammel, G. Chemical reactivity and long-range transport potential of polycyclic aromatic hydrocarbons—A review. Chem. Soc. Rev. 2013, 42, 9333. [Google Scholar] [CrossRef]
- Hůnová, I.; Bäumelt, V. Observation-based trends in ambient ozone in the Czech Republic over the past two decades. Atmos. Environ. 2018, 172, 157–167. [Google Scholar] [CrossRef]
- Hůnová, I.; Brabec, M.; Malý, M. Trends in ambient O3 concentrations at twelve sites in the Czech Republic over the past three decades: Close inspection of development. Sci. Total Environ. 2020, 746, 141038. [Google Scholar] [CrossRef] [PubMed]
- Škrdlíková, L.; Landlová, L.; Klánová, J.; Lammel, G. Wet deposition and scavenging efficiency of gaseous and particulate phase polycyclic aromatic compounds at a central European suburban site. Atmos. Environ. 2011, 45, 4305–4312. [Google Scholar] [CrossRef]
- Gocht, T.; Klemm, O.; Grathwol, P. Long-term atmospheric bulk deposition of polycyclic aromatic hydrocarbons (PAHs) in rural areas of Southern Germany. Atmos. Environ. 2007, 41, 1315–1327. [Google Scholar] [CrossRef]
- Kiss, G.; Varga-Puchony, Z.; Tolnai, B.; Varga, B.; Gelencsér, A.; Krivácsy, Z.; Hlavay, J. The seasonal changes in the concentration of polycyclic aromatic hydrocarbons in precipitation and aerosol near Lake Balaton, Hungary. Environ. Pollut. 2001, 114, 55–61. [Google Scholar] [CrossRef]
- Siudek, P.; Ruczynska, W. Simultaneous Measurements of PM2.5- and PM10-bound Benzo(a)pyrene in a Coastal Urban Atmosphere in Poland: Seasonality of Dry Deposition Fluxes and Influence of Atmospheric Transport. Aerosol Air Qual. Res. 2021, 21, 210044. [Google Scholar] [CrossRef]
- Wang, Q.; Liu, M.; Yu, Y.; Li, Y. Characterization and source apportionment of PM2.5-bound polycyclic aromatic hydrocarbons from Shanghai city, China. Environ. Pollut. 2016, 218, 118–128. [Google Scholar] [CrossRef]
- Van Jaarsveld, J.A.; van Pul, W.A.J.; de Leeuw, F.A.A.M. Modelling transport and deposition of persistent organic pollutants in the European region. Atmos. Environ. 1997, 31, 1011–1024. [Google Scholar] [CrossRef]
- EC. Council Decision 97/101/EC of 27 January 1997 Establishing a Reciprocal Exchange of Information and Data from Networks and Individual Stations Measuring Ambient Air Pollution within the Member States; OJEC L 35/14; EC: Brussels, Belgium, 1997. [Google Scholar]
- Brook, J.R.; Di-Giovanni, F.; Cakmak, S.; Meyers, T.P. Estimation of dry deposition velocity using inferential models and site-specific meteorology—Uncertainty due to siting of meteorological towers. Atmos. Environ. 1997, 31, 3911–3919. [Google Scholar] [CrossRef]
- Terzi, E.; Samara, C. Dry deposition of polycyclic aromatic hydrocarbons in urban and rural sites of Western Greece. Atmos. Environ. 2005, 39, 6261–6270. [Google Scholar] [CrossRef]
- Esen, F.; Cindoruk, S.; Tasdemir, Y. Bulk deposition of polycyclic aromatic hydrocarbons (PAHs) in an industrial site of Turkey. Environ. Pollut. 2008, 152, 461–467. [Google Scholar] [CrossRef] [PubMed]
- He, Q.; Zhang, L.; Cui, Y.; Cheng, M.; Guo, L.; Liu, M.; Chen, L. Particle dry deposition of polycyclic aromatic hydrocarbons and its risk assessment in a typical coal-polluted and basin city, northern China. Atmos. Pollut. Res. 2017, 8, 1081–1089. [Google Scholar] [CrossRef]
- Feng, G.-C.; Chang, K.F.; Lu, C.; Bai, H. Estimation of PAHs dry deposition and BaP toxic equivalency factors (TEFs) study at Urban, Industry Park and rural sampling sites in central Taiwan, Taichung. Chemosphere 2004, 55, 787–796. [Google Scholar] [CrossRef] [PubMed]
- Liu, J.; Jia, J.; Grathwohl, P. Dilution of concentrations of PAHs from atmospheric particles, bulk deposition to soil: A review. Environ. Geochem. Health 2022. [Google Scholar] [CrossRef]
- Chang, K.-F.; Fang, G.-C.; Lu, C.; Bai, H. Estimating PAH Dry Deposition by Measuring Gas and Particle Phase Concentrations in Ambient Air. Aerosol Air Qual. Res. 2003, 3, 41–51. [Google Scholar] [CrossRef] [Green Version]
- Nežiková, B.; Degrendele, C.; Čupr, P.; Hohenblum, P.; Moche, W.; Prokeš, R.; Vaňková, L.; Kukučka, P.; Martiník, J.; Audy, O.; et al. Bulk atmospheric deposition of persistent organic pollutants and polycyclic aromatic hydrocarbons in Central Europe. Environ. Sci. Pollut. Res. 2019, 26, 23429–23441. [Google Scholar] [CrossRef] [Green Version]
- Liu, L.-Y.; Kukučka, P.; Venier, M.; Salamova, A.; Klánová, J.; Hites, R.A. Differences in spatiotemporal variations of atmospheric PAH levels between North America and Europe: Data from two air monitoring projects. Environ. Int. 2014, 64, 48–55. [Google Scholar] [CrossRef]
- Settimo, G.; Soggiu, M.E.; Inglessis, M.; Marsili, G.; Avino, P. Persistent Organic Pollutants and Metals in Atmospheric Deposition Rates around the Port-Industrial Area of Civitavecchia, Italy. Appl. Sci. 2021, 11, 1827. [Google Scholar] [CrossRef]
- McVeety, B.D.; Hites, R.A. Atmospheric deposition of polycyclic aromatic hydrocarbons to water surfaces: A mass balance approach. Atmos. Environ. 1988, 22, 511–536. [Google Scholar] [CrossRef]


Publisher’s Note: MDPI stays neutral with regard to jurisdictional claims in published maps and institutional affiliations. |
© 2022 by the authors. Licensee MDPI, Basel, Switzerland. This article is an open access article distributed under the terms and conditions of the Creative Commons Attribution (CC BY) license (https://creativecommons.org/licenses/by/4.0/).