1. Introduction
There are three key factors that can influence and modify fire regimes at different temporal and spatial scales. The major ones are climate change, human activity, and vegetation [
1]. Some of the meteorological factors of heightened risk for wildfires are air and surface temperature, air and soil moisture, and atmospheric instability [
2]. Wind speed also has an impact on a fire behavior [
3]. Longer fire activity periods have been connected to meteorological trends that favor long periods of low fuel moisture [
4], such as an increase in rainless days [
5], earlier higher temperatures, and earlier snowmelt timing [
4]. Thunderstorms are a common cause of natural fire initiation [
6]. However, because thunderstorms are often accompanied by heavy rain, cloud-to-ground lightning strikes may not always result in a fire. On average, lightning is thought to be responsible for roughly 10% of all forest fires in Russia, but the actual share is likely closer to 30% [
7]. The ignition (fire triggering), survival (smoldering), and arrival (flaming combustion) of lightning-ignited wildfires (LIWs) [
8] are closely related to intense drought periods and high temperatures [
9]. LIWs account for 28% of all fires in Siberia [
10], and up to 37% in the Tomsk region [
11]. According to previous studies [
12,
13], lightning ignitions contribute the most to the burned area due to wildfires and CO
2 emissions into the atmosphere at subpolar latitudes, where lightning strikes are the most common cause of fires.
Thunderstorm activity and its role in fire occurrence has been the subject of a significant amount of research in different regions of the world: in boreal forests and permafrost zones [
13,
14,
15,
16], in mountain regions [
17], and in tropical and subtropical ecosystems [
18,
19,
20]. Notably, the contribution of dry thunderstorms to fire hazard is rarely discussed in Russian scientific papers. Most of the current research focuses on either describing the characteristics of certain wildfires and their impact on the atmosphere in specific regions or local spots, or estimating global trends through the building of climatic predictions [
21,
22,
23,
24]. Concurrently, landscape zones and their characteristics, which are distinctive of the Siberian and Arctic areas with a predominance of fire-hazardous tendencies, are practically ignored and not investigated as part of a single project.
Extreme climatic events are expected to become more frequent in the 21st century, based on current estimates. According to the high-emissions scenario RCP8.5, by the end of the century, climate change in different regions of Russia is predicted to result in a major increase in the period of fire danger [
25]. Concurrently, natural fires will occur and spread over much larger areas, including northern Russia. However, due to a current lack of understanding of natural fire processes, the outcomes of model calculations for both the recent period (including insufficiently excellent agreement with empirical data) and the future are vastly different [
12]. As a result, the regional response to global climate change exhibits significant regional and temporal heterogeneity.
Considering the lack of knowledge on natural fires in Western Siberia and the increasing attention to fire activity worldwide driven by global climate change, assessing the spatial and temporal variability of LIWs in different landscapes, appears relevant from this perspective. It will not only help deeper understanding of the current state of knowledge on lightning–fire association, but also specify global and regional climate models and find practical application in various sectors of the national economy in predicting the potential fire danger in different natural zones.
The present study’s goal is to analyze the spatial and temporal variability of lightning activity associated with natural fires in Western Siberia from 2016 to 2021.
The paper is organized as follows: In
Section 2, we present datasets and briefly describe the used methods and the procedure of data processing. In
Section 3, the results of spatial and temporal distribution of lightning and fires and their associations are presented. In
Section 4, we discuss the applied data and methods, obtained results, and make some comparisons with other studies. The conclusion, limitations, and future direction of the research are briefly summarized in
Section 5.
3. Results
3.1. Spatial Variability of Lightning and Hotspots
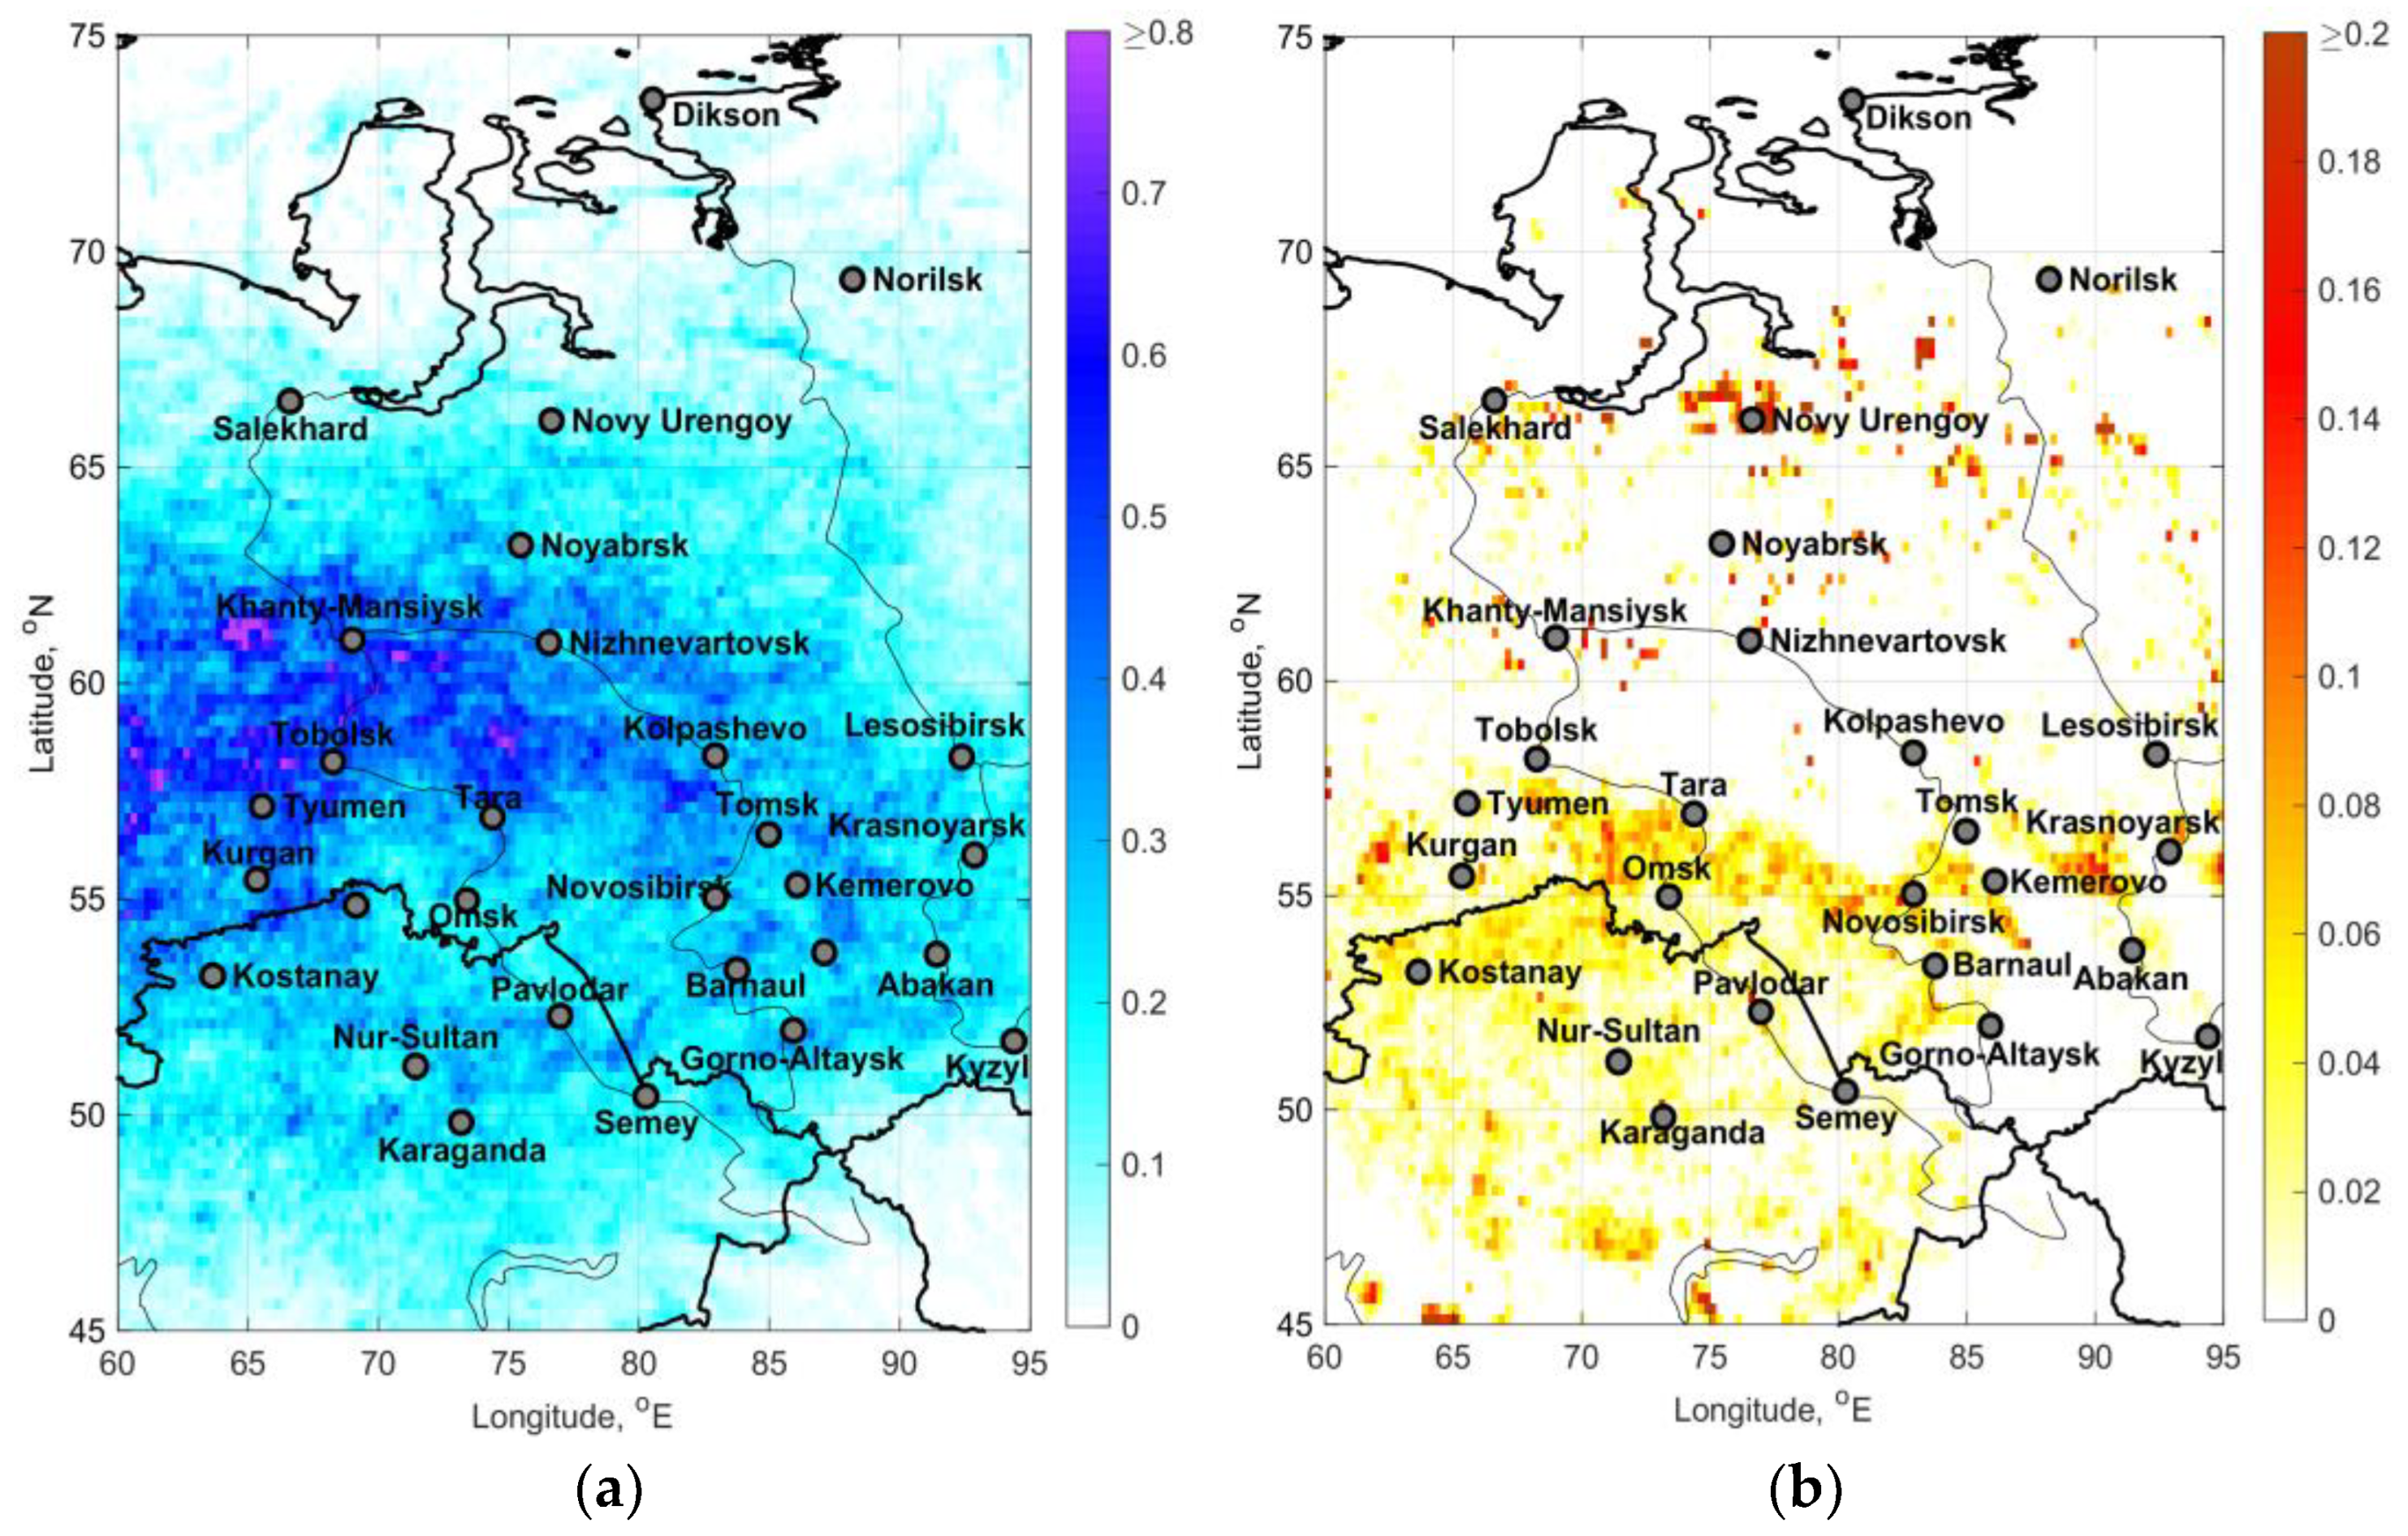
Analysis of the spatial distribution of lightning discharge density demonstrated that its activity is higher in the west, in comparison with other parts (
Figure 1a).
Maximum lightning activity is observed in the central part of the region, such as over Kondinskaya lowland, Sredneobskaya lowland, Ob-Irtysh interfluves, over the north of the Vasyugan plain, and the eastern periphery of the Southern Urals. Such a peculiarity in the distribution can be explained by several factors. The northern part of the highest lightning activity zone is located on a system of uplands, while the southern part is heavily swamped and includes a large system of small lakes. The highest density of discharges occurs near the Sredneobskaya lowland and the Ob-Irtysh interfluve. Moreover, the location of the center near the Ob-Irtysh agrees well with the outlines of the Great Vasyugan Mire, which is one of the largest swamps in the world [
32]. The maximum over the eastern periphery of the Southern Urals is explained mainly by the influence of the area’s orography. In general, the centers with the highest and lowest lightning activity agree with the results of lightning registration by the optical detector of the MicroLab-1 satellite, which recorded discharges over the studied territory from 1995–1999 [
33]. The level of registered lightning activity slightly differs, probably because of different registration methods.It was concluded that the maximum number of hotspots during the warm period is mainly observed in the southern part of Western Siberia, in the Tomsk, Novosibirsk, Omsk, and Kemerovo regions, and the Khanty-Mansiysk Autonomous District (
Figure 1b). Due to the high population density there compared to the northern part of the territory, the highest number of fires could be attributed to anthropogenic factors. In the northern part of Western Siberia, fires are localized only near the Gulf of Ob. Some of the fire events could have had anthropogenic heat sources (for instance, fuel and energy complex enterprises). In subsequent steps, additional research is needed to exclude these sources.
When comparing data on hotspots with lightning, it was revealed that the areas with the highest values of the indicated parameters coincided near Khanty-Mansiysk and Tyumen, in the foothills of Kuznetsk Alatau, in the Altai region, and in the northern part of Kazakhstan. It should be noted that at higher altitudes, the relative number of LIWs is increasing, which underlines the role of the inducing topographic and climatic factors [
34].
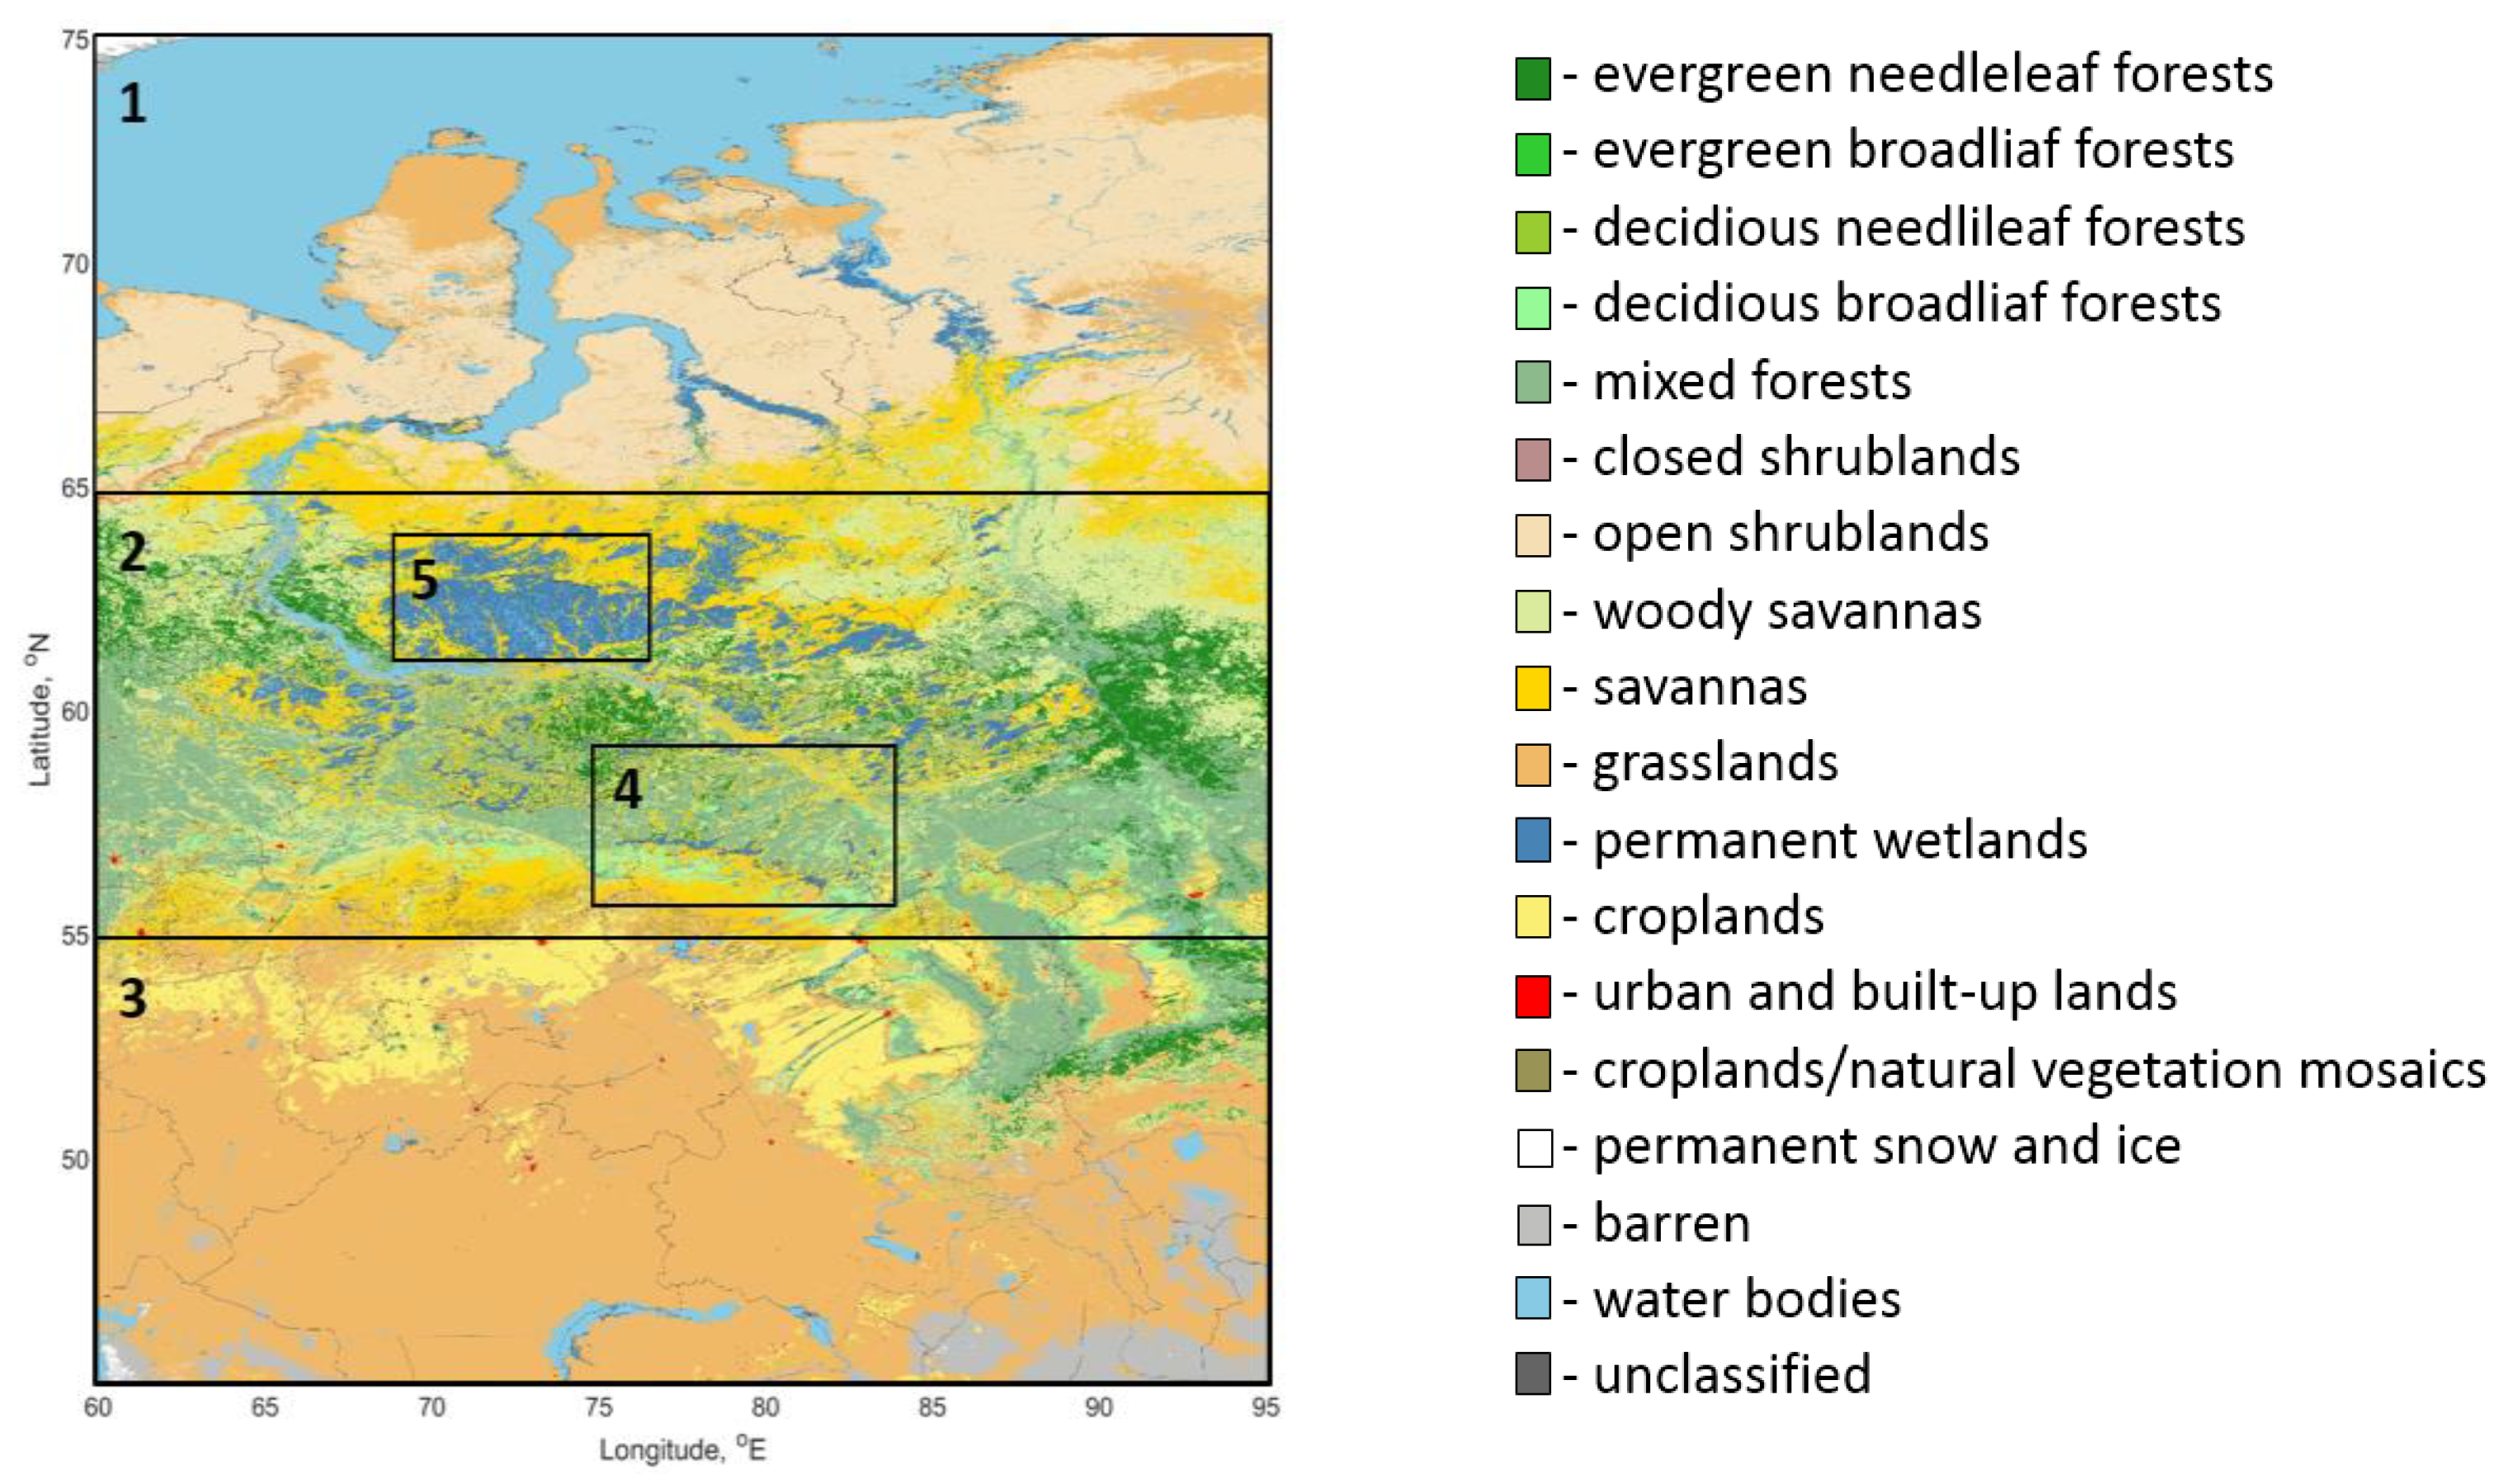
From the combined analysis of the spatial distribution of lightning discharge density, hotspot density, and vegetation types on the territory under study (
Figure 1 and
Figure 2), it is clearly demonstrated that the areas of the highest lightning activity are observed over the territories occupied by forests, while the areas of the lowest lightning activity are linked to grasslands and savannas in the north and south of the region (
Figure 2). The highest hotspot density, in contrast, is observed in croplands, savannas, and mixed forests.
We assume that relatively homogeneous natural zones form close conditions for the formation of such hazardous natural phenomena as wildfires, particularly because of lightning activity. Therefore, since the study area is unique in its geographical location and diverse natural-climatic features, it is advisable to conduct research not only for the territory as a whole, but also for its individual landscape zones. Therefore, in addition to forest and steppe zones, areas with swampy terrain were also singled out since they occupy a significant part of Western Siberia.
According to
Figure 2, we selected several natural zones with the most specific vegetation types for Western Siberia:
- −
Area 1 (65–75° N, 60–95° E). The northern part, dominated by shrubs and grasslands;
- −
Area 2 (55–65° N, 60–95° E). The central part, occupied to a greater extent by the mixed forest and savannah zones;
- −
Area 3 (45–55° N, 60–95° E). The southern part (including the northeastern Kazakhstan), dominated by grasslands, with cropland, savannah (in the western part) and mixed forest (in the eastern part) only near 53–55° N.
- −
Area 4 (56–59° N, 75–84° E). The Great Vasyugan Mire [
32].
- −
Area 5 (61–64° N, 69–77° E). Permanent wetlands.
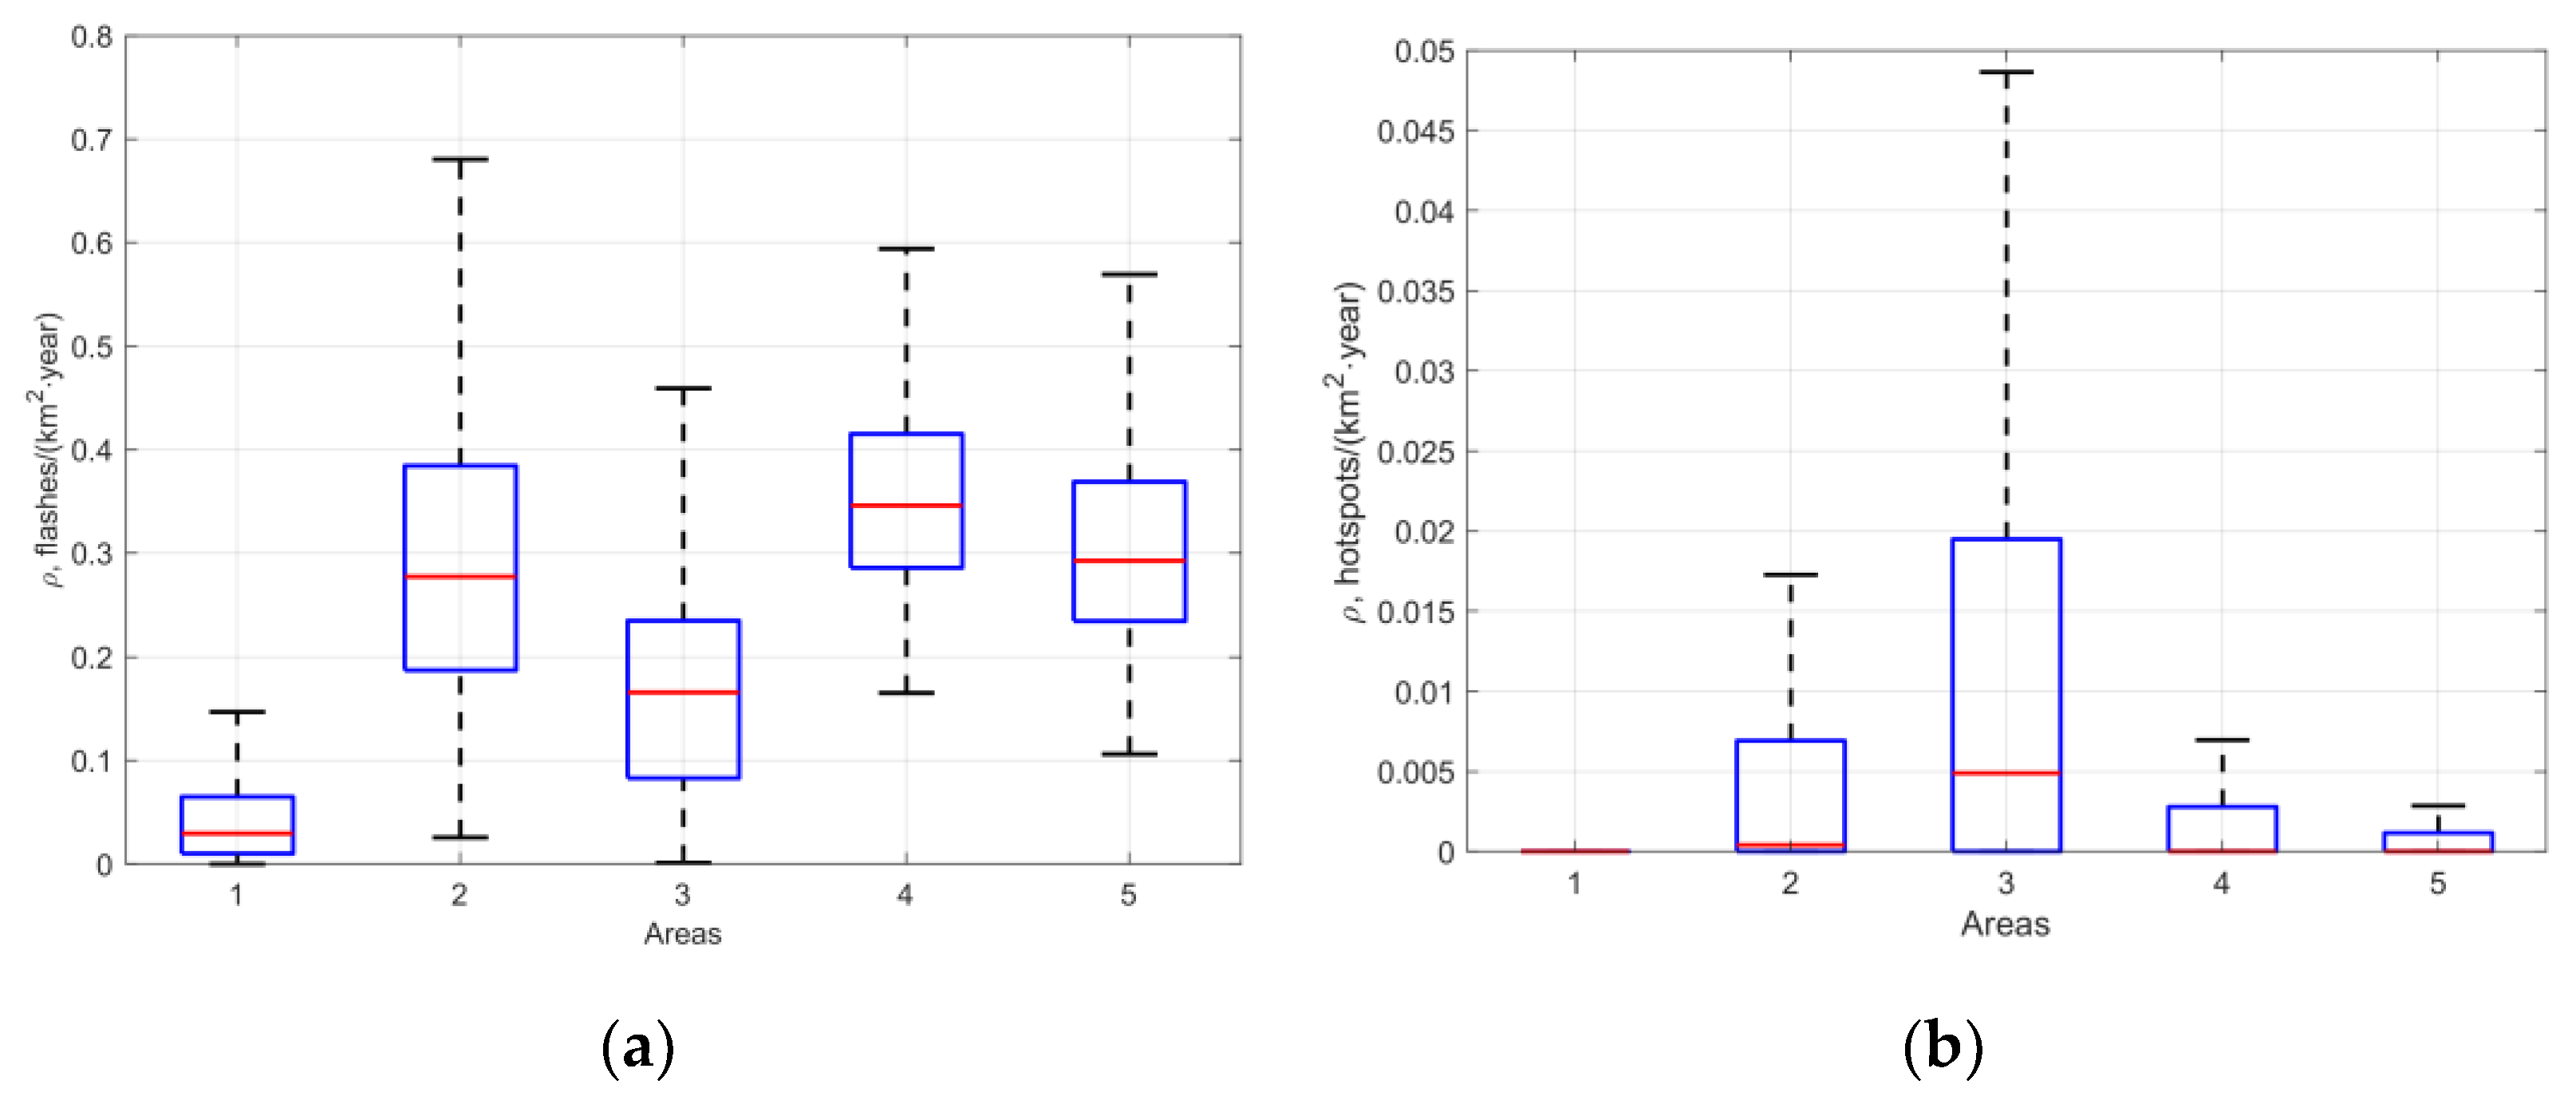
Figure 3 illustrates statistical characteristics of lightning and fires, where the box height is derived from the interquartile range and the horizontal line corresponds to the median values of the series. The values presented in this figure confirm our previous conclusion.
During the period from 2016 to 2021, the maximum density of lightning discharges was observed in the central part of Western Siberia, i.e., where boreal forests and mires are concentrated (0.28, 0.35, and 0.29 per km
2 per year in Areas 2, 4, and 5, respectively), and the minimum in the northern part (0.03 per km
2 per year) (
Figure 3a).
The maximum values of the number of hotspots (
Figure 3b) occur in the southern part of the territory (0.005 hotspots per km
2 per year), which is primarily due to the predominant role of the anthropogenic factors here. It should be noted that such a distribution pattern is caused by the extremely inhomogeneous location of fire hotspots over the territory; in this connection, this value varies according to the power law of distribution (with right-sided asymmetry of the distribution density).
3.2. Temporal Variability of Lightning and Fires
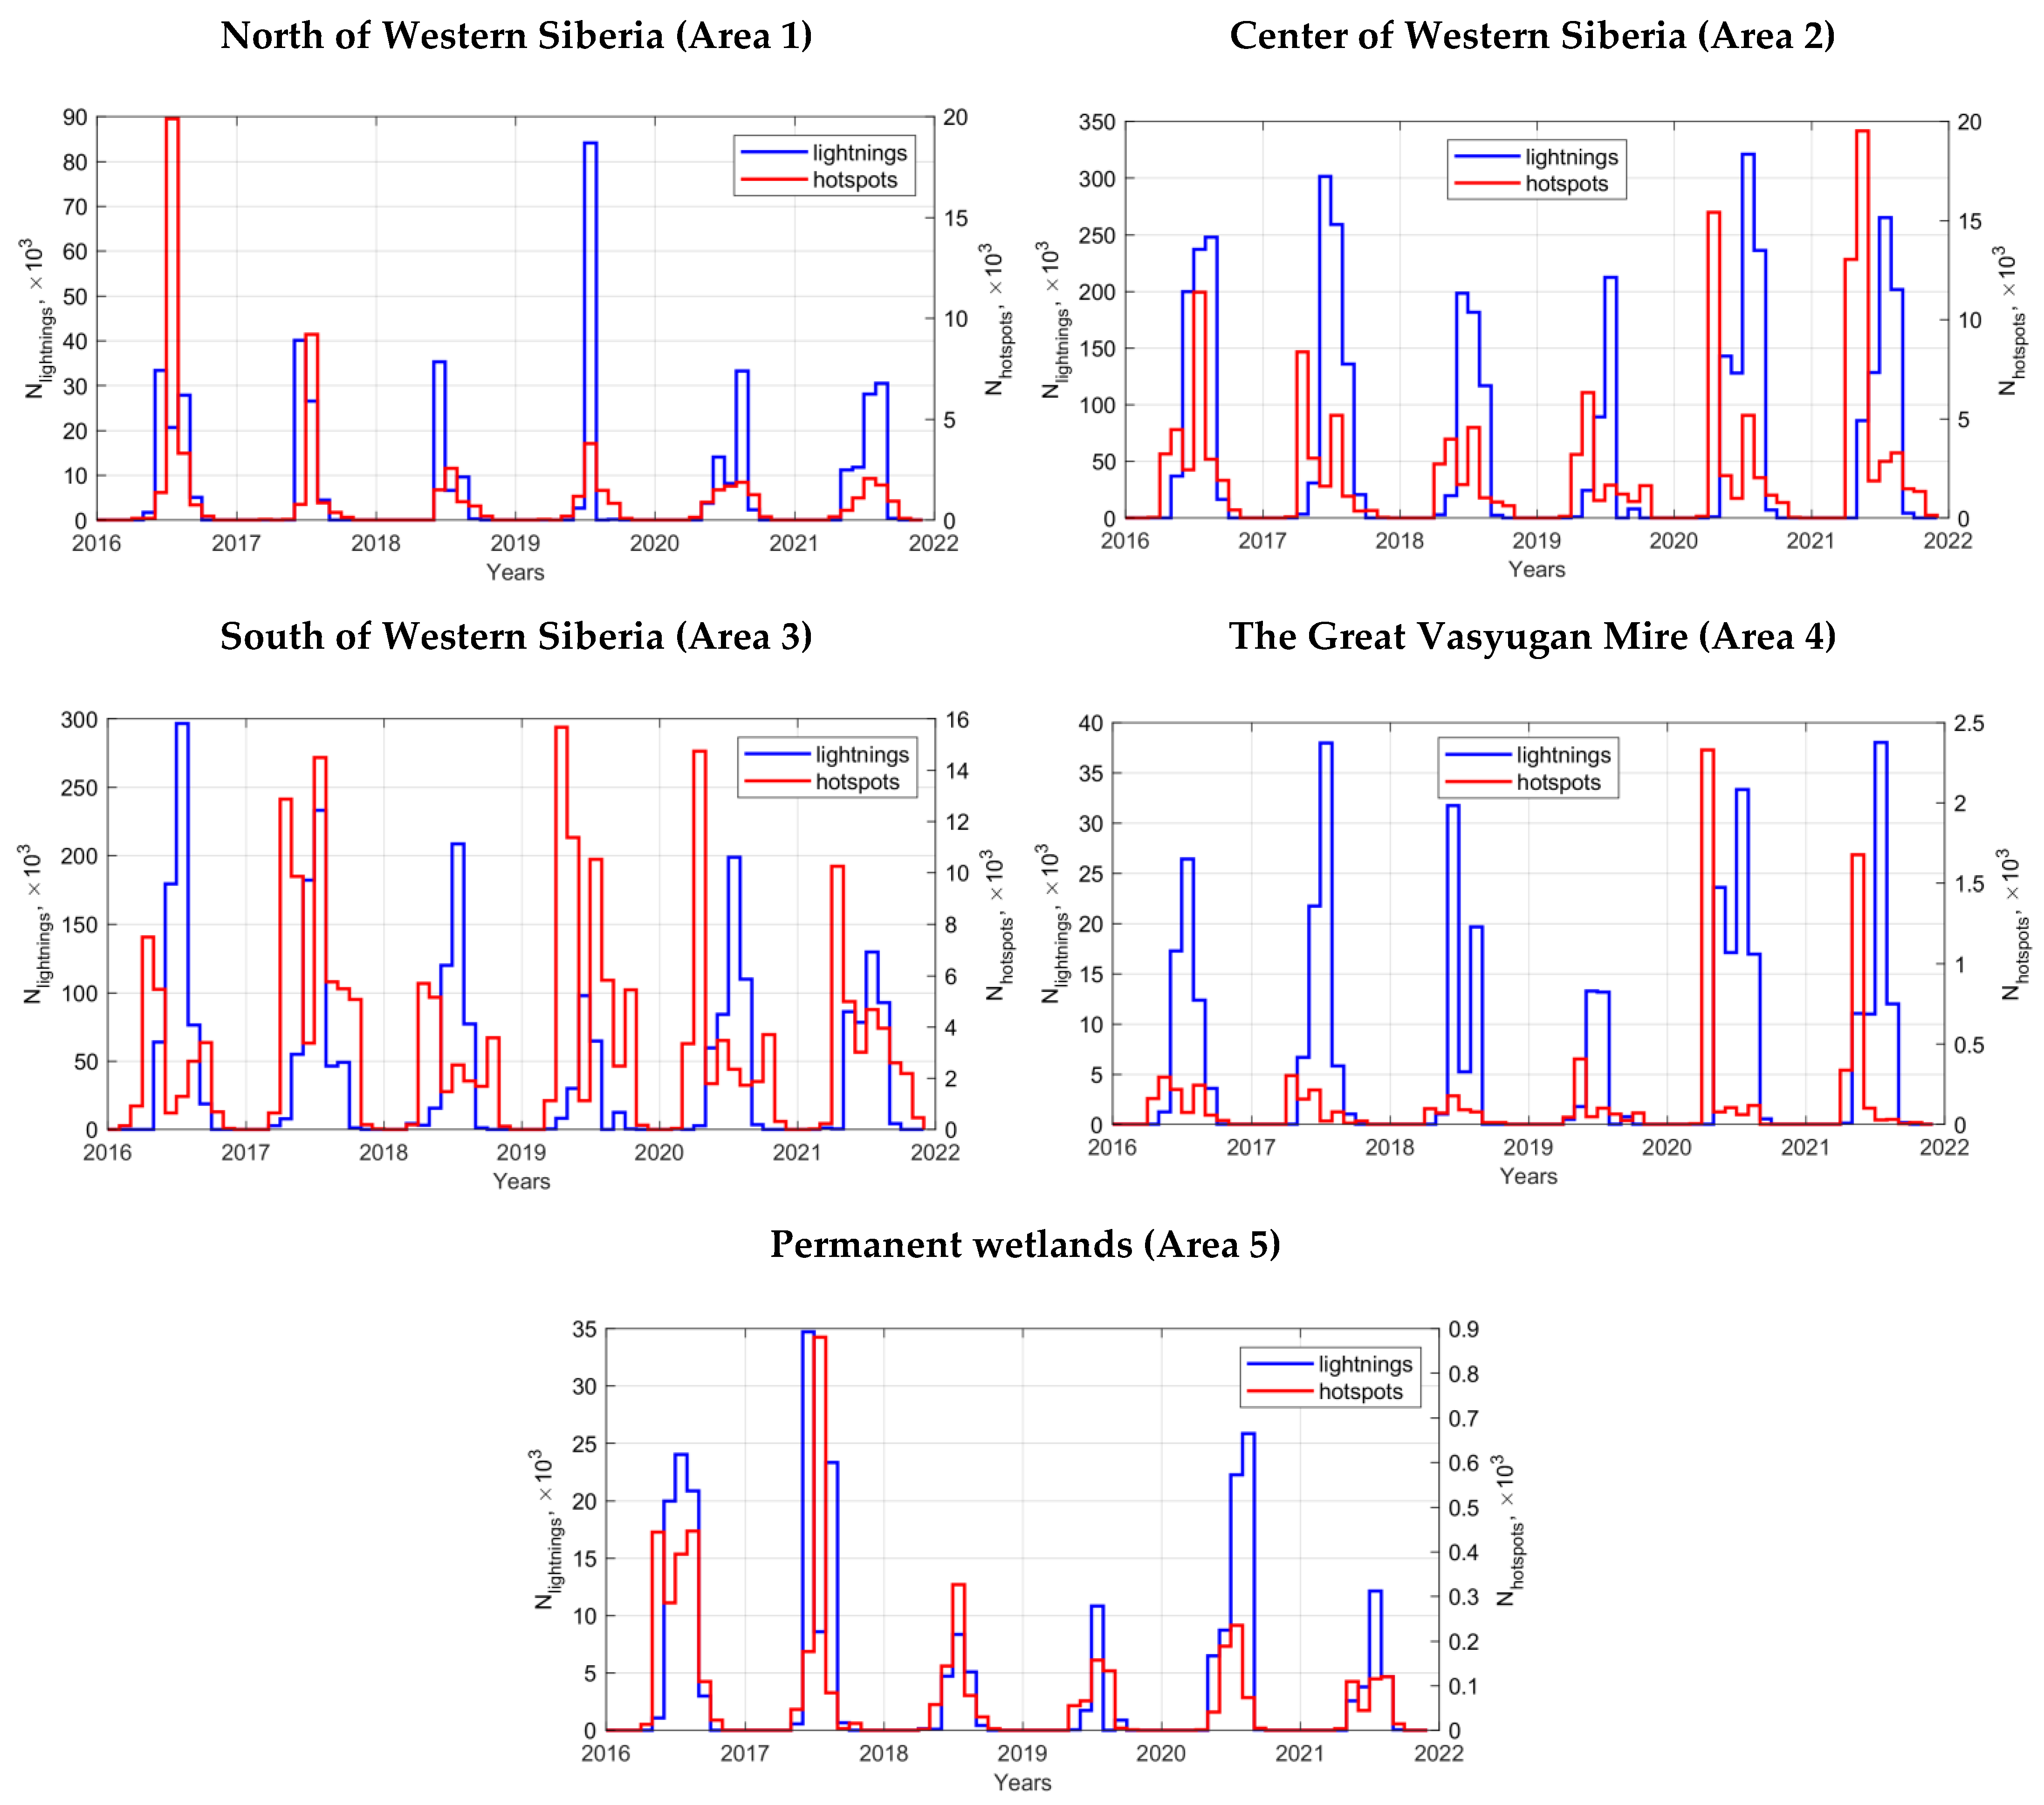
The greatest similarity of temporal variability in the total number of fires and lightning during the period of 2016–2021, as illustrated in
Figure 4, is observed in the northern part of Western Siberia (Area 1 and Area 5).
The largest number of lightning throughout the time interval is revealed in Area 2 and Area 3, in comparison with the other regions. However, their greatest similarity with hotspots is observed only in 2016, 2017, and 2018 for Area 2, and in 2017 for Area 3. Therefore, we can suppose that for these years, the LIW probability is high. Separately for Area 4, there are some similarities in certain years, such as 2017–2018.
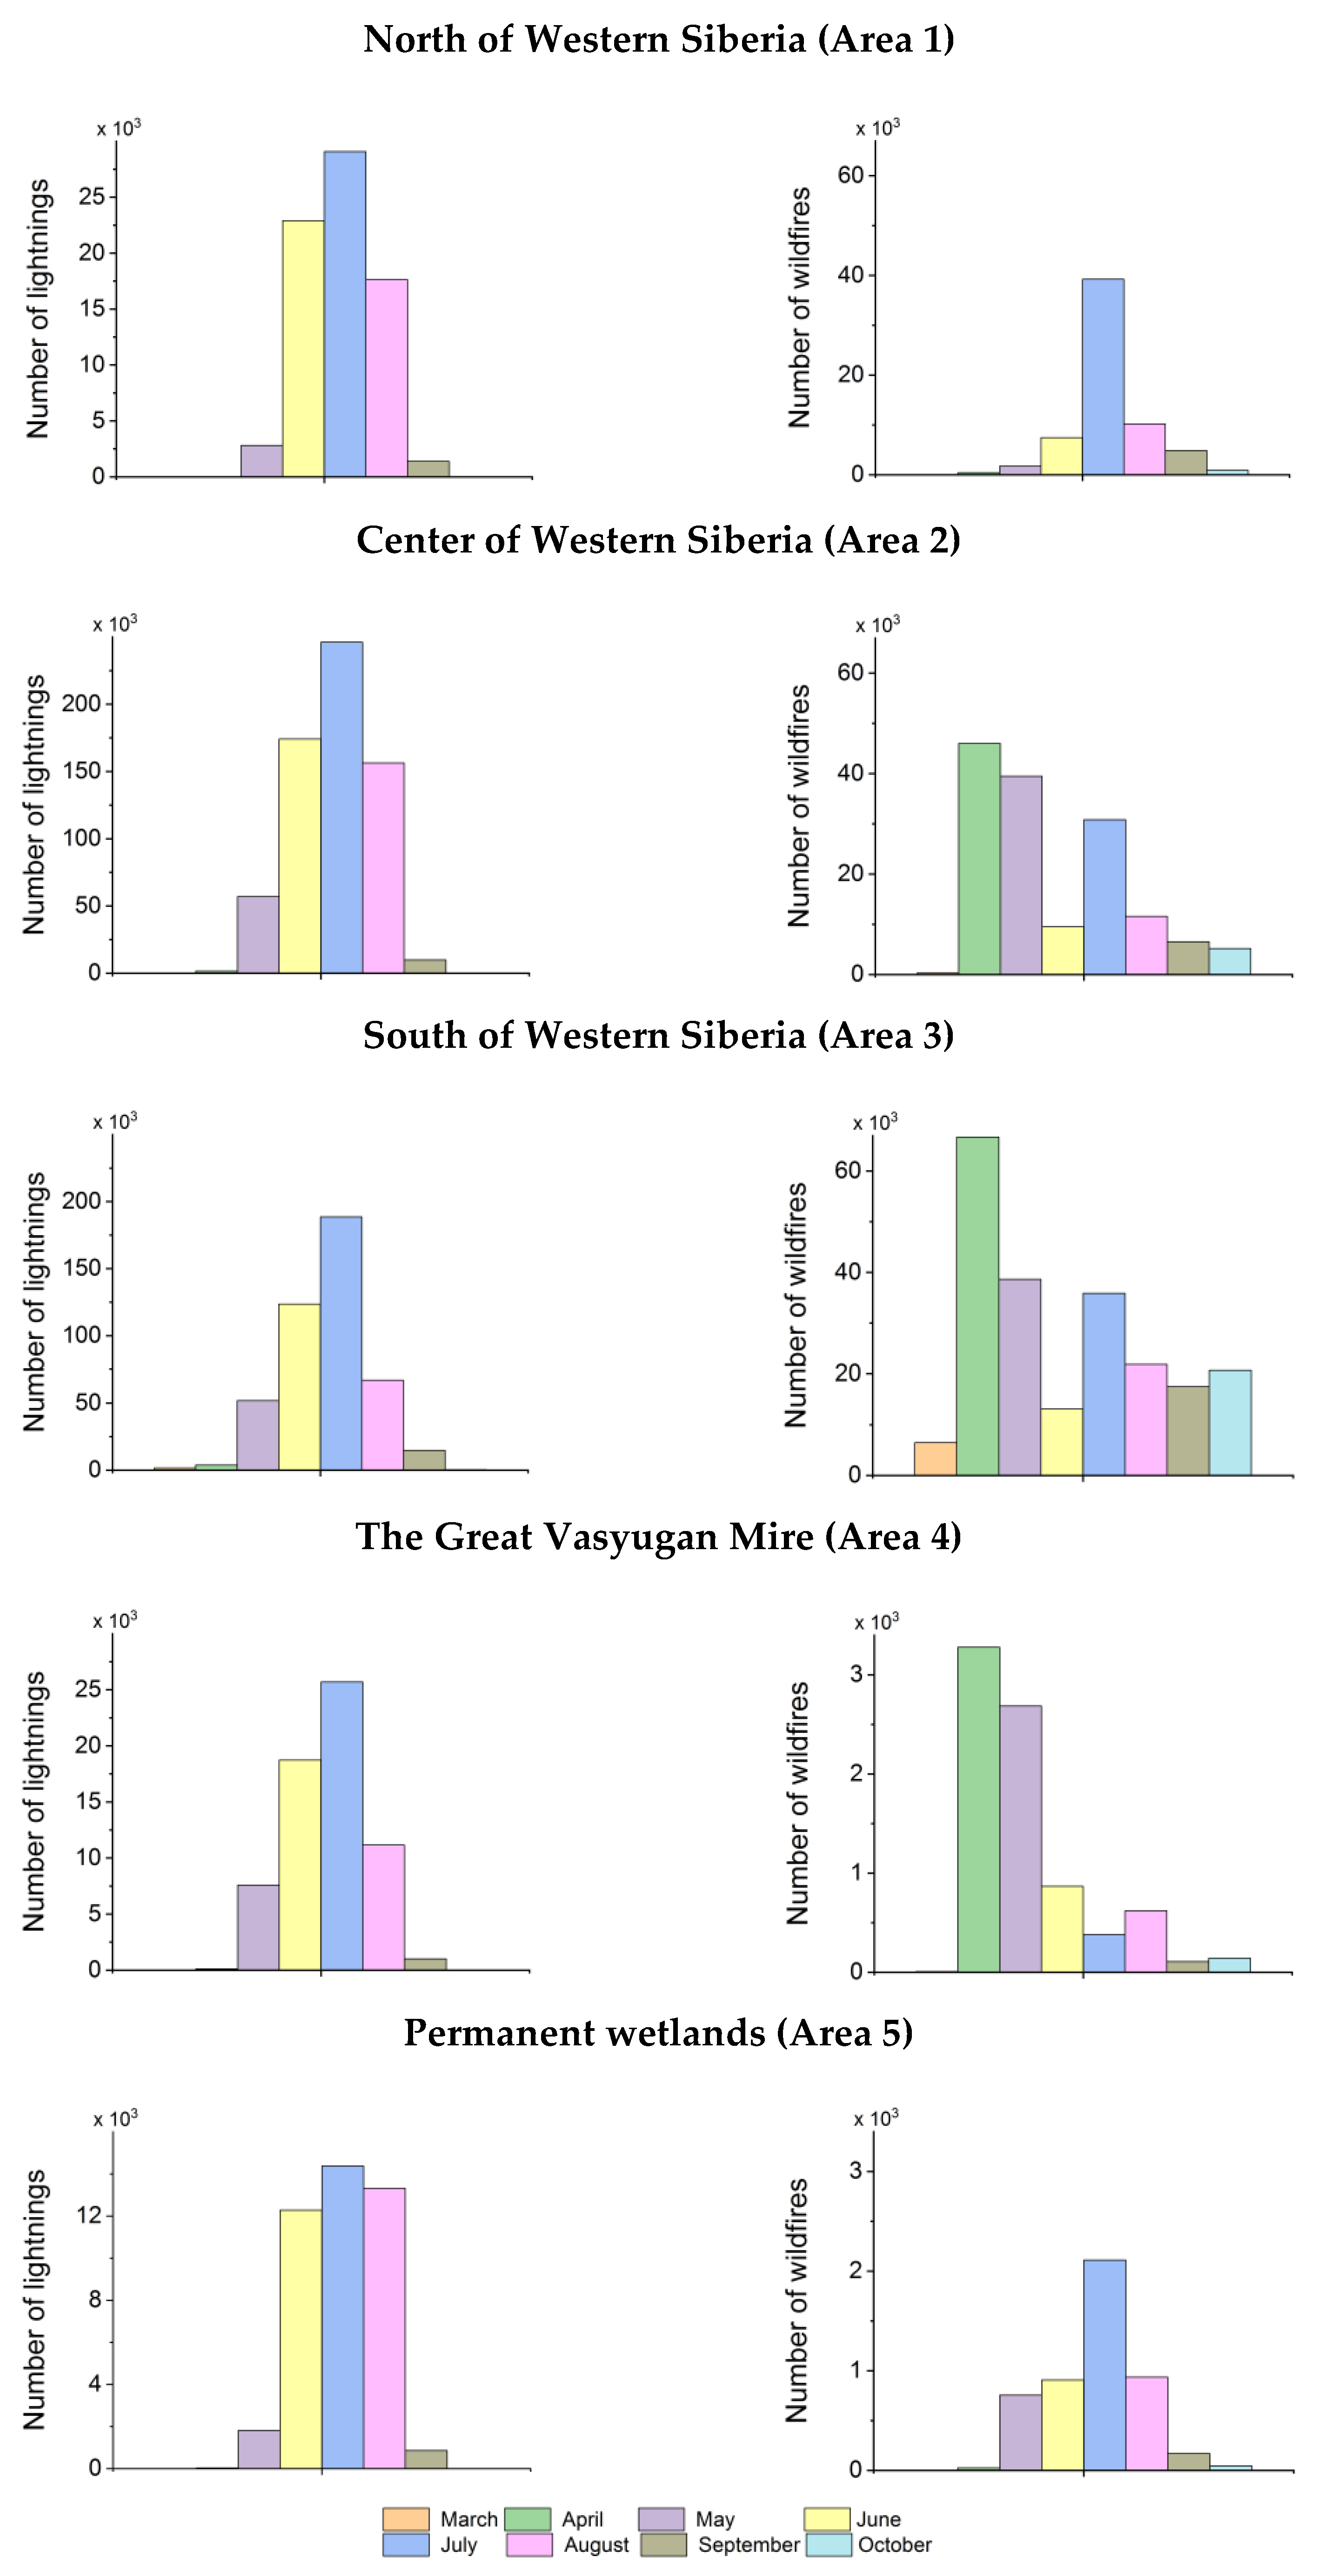
As for seasonal variability, the maximum values of lightning occur in July for the whole territory of western Siberia (
Figure 5). This is also confirmed by the results, derived in other studies, based on the WWLLN data [
35,
36] and the results of satellite data [
33].
The thunderstorm season in Western Siberia starts in late April or early May and lasts until late September. A similar situation is observed for hotspots only in Areas 1 and 5—the maximum is also observed in July. In Areas 2, 3, and 4, the greatest number of fires is reported in the spring months (April and May). It is also noteworthy that the number of fires in the southern part of the territory is about 1.5 times higher than in the northern part, and the fire season is longer. In March and September, for example, a disproportionately significant number of fires are reported in the south. The shift of the maximum fire hotspots to the spring months in the central and southern regions of Western Siberia may be due to the beginning of the agricultural season. Here fuel moisture (litter) characteristics also play an important role, that meteorological parameters such as air temperature, atmospheric precipitation, and snow cover duration, depth, and dates of its melting should be also taken into account [
10,
37].
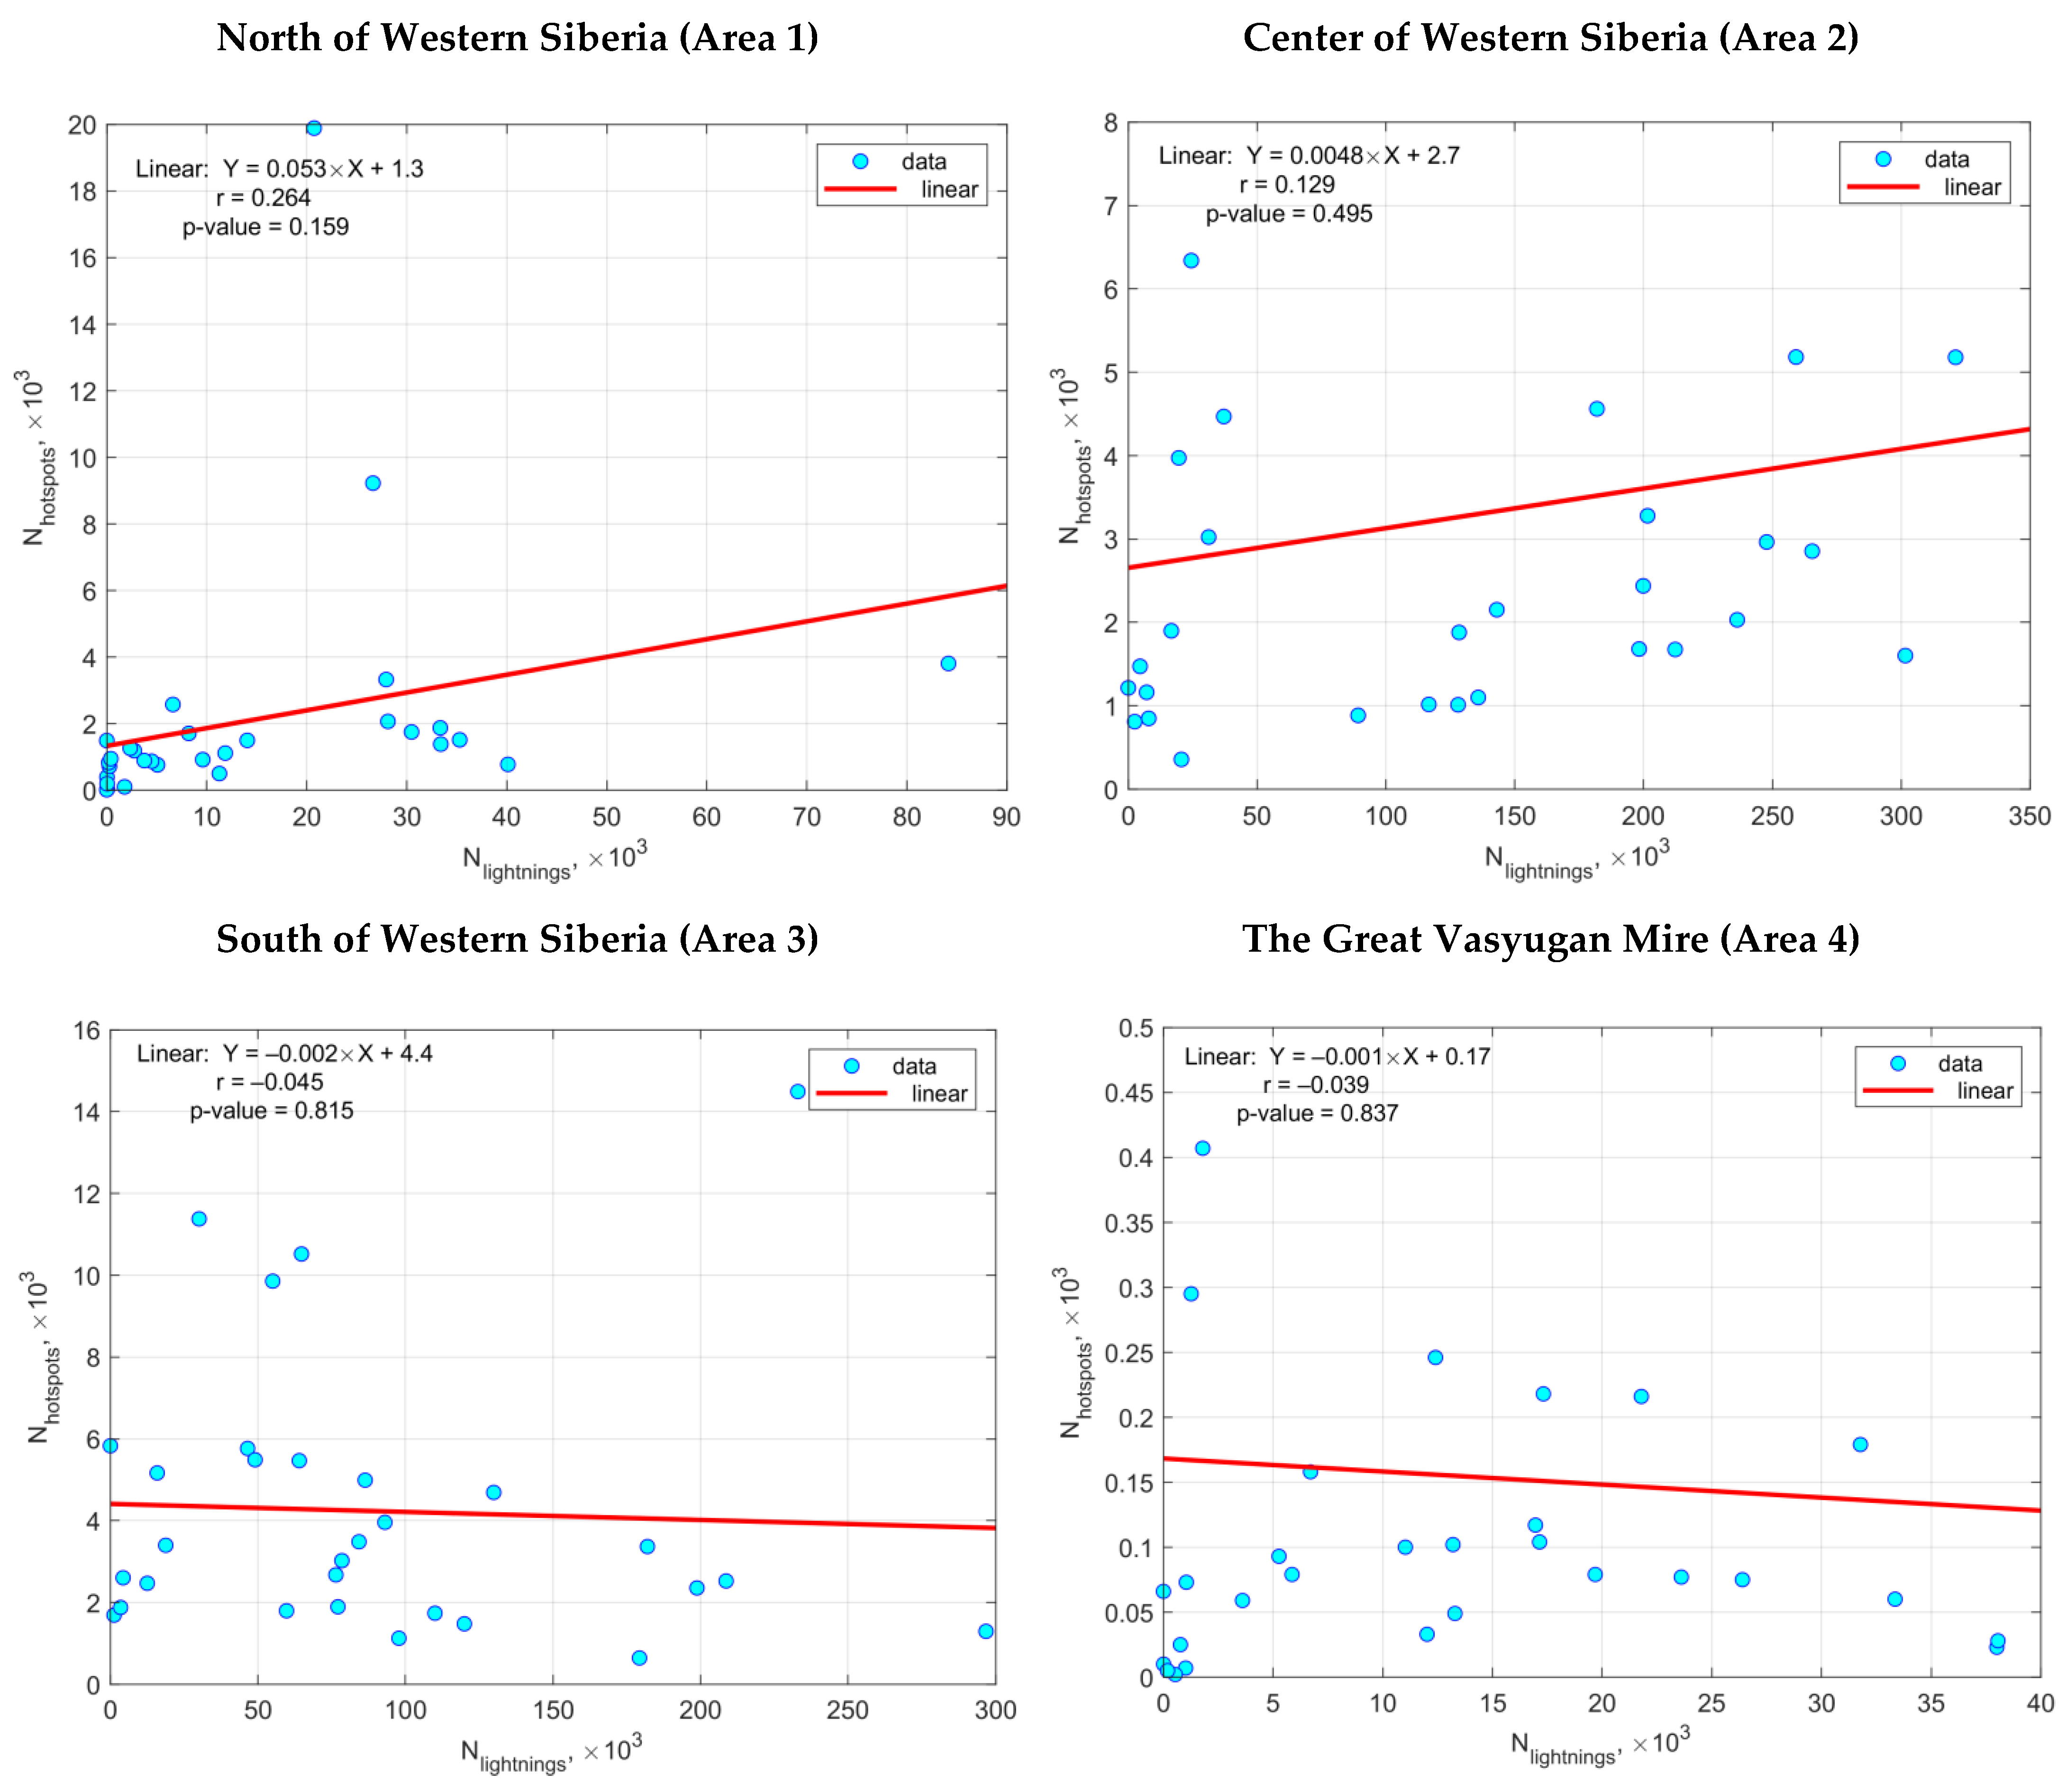
To assess the association between lightning and fire, we constructed scatter plots with the number of flashes and number of hotspots per warm season (May–September) over the period from 2016–2021 (
Figure 6). Here, each point represents the sum of the number of lightning strikes and the number of hotspots for each of the indicated months and years (30 points in total).
Practically, in most considered areas (besides Area 3 and Area 4) of Western Siberia, the relationship between lightning and hotspots is positive, however, values of correlation coefficients (r) are statistically insignificant (α = 0.05). The highest values (r varies up to 0.32) are observed in the northern part of the region (Areas 1 and 5).
We also note that without the formation of relevant weather conditions, fire will not be ignited even when lightning occurs. Thus, the relationship between number of lightnings and fires is only expected when we consider meteorological factors, fuel characteristics, and vegetation type.
In the south of Western Siberia (Area 3) the relationship between lightning and hotspots was not revealed, which can probably be explained by the large contribution of the anthropogenic factor to the fire behavior change in this territory. To obtain more accurate estimates of the correlation when identifying cases of fires due to thunderstorms, it is also worth using another approach based on a more thorough selection of cases of lightning and associated fires.
3.3. Fires Candidates to Be Ignited by Lightning
As a result of the foregoing investigation, similar patterns of spatial and temporal variability of lightning discharges and fire hotspots in different zones of Western Siberia were identified over 2016–2021. The study of the association between lightning and fires during the warm season (May–September) was also carried out based on calculation of LIW probability (
Figure 7), based on two methods (in the borders of each cell of 0.25°
0.25° according to (4) and applying
and
according to (6)).
It is noteworthy that a fire does not necessarily start immediately after a lightning strike; it might also start after some time has passed (called a “smolder period”). According to a previous study [
17], more than 60% of the natural fires were detected in less than 1 day. That is why the probability values (
P), derived from formula (4), represents likely LIWs with smolder period of 1 day in each cell (left panel on
Figure 7). The probability values (
B), derived from formula (6), represent likely LIWs with a smolder period of 10 day and radius of 10 km from the hotspot center (right panel on
Figure 7).
The locations of areas with fires that are likely caused by lightning strikes revealed from two methods generally coincides. Thus, in the northern regions (Area 1) of Western Siberia, these regions are located near Salekhard, Novy Urengoy, and the Gulf of Ob. In the central regions (Area 2), these areas are predominantly located meridionally along the western boundary of Western Siberia (60–70° E). The maximum probability (B > 0.8) of forest fires caused by lightning is observed in all natural zones (in some local points), however the majority number of events are in the southern part (on the territory of Northern Kazakhstan).
It should be noted that, despite the general similarity in the spatial distribution of the probability estimates obtained by these methods, the distance parameter makes it possible to obtain more accurate results. It could be due to the fact that the first approach (left panel on the
Figure 7) may not accurately represent some situations; some fires may be caused by a lightning strike hitting an adjacent cell, wherein the two cases would be unrelated. Conversely, when both the lightning and the hotspot are in the same cell, but due to the large distance between them (for example, near opposite cell boundaries), they are not related to each other, they will be defined as one process. However, qualitative comparison can be carried out based on any of the presented methods. To obtain more accurate results, it is preferable to use the probability estimates (
B) derived by the second method. Despite the limitations in the first method, the revealed results could be useful for the same purposes as the reanalysis data, for instance, in the field of climatic projections for different time scales.
Furthermore, we have calculated the relation of likely LIWs (
B > 0, when at least one lightning was within 10 km and 10 days from the hotspot center) to the total number of hotspots over the 6-year period (
Table 1).
From the analysis of this, it follows that the fire activity caused by lightning discharges in Western Siberia may vary from 5 to 43% from month to month. These maximum values are observed in the central part of the territory in July. However, generally over the entire warm season, the probability is the highest in the northern part, where it can reach to ~30%, while in the southern one, it reaches up to ~20%.
4. Discussion
This research compares the spatial and temporal variability of lightning activity and wildfires and their probability analysis in several natural-geographical zones of Western Siberia for 2016–2021.
It was revealed that the areas of the highest lightning activity were observed over the territories occupied by boreal forests and the highest hotspot density, in contrast, was observed in croplands, savannas, and mixed forests. The number of fires in the southern part of the territory was about 1.5 times higher than in the northern part, and the fire season is longer. Due to the high population density in the southern part, in comparison with the northern part of the territory, the highest number of fires could be caused by anthropogenic factors. However, for the territory of Western Siberia, there are areas where maximum values of indicated parameters coincided; for instance, they coincided in the southWestern part of the territory (near Khanty-Mansiysk and Tyumen), in the mountain regions (Kuznetsk Alatau, Altai), and in the northern part of Kazakhstan. Such distribution is mainly explained by topographic and climatic factors [
17,
34].
Although the northern regions in Western Siberia have the lowest values of the total number of fires and lightning, the greatest similarity of their temporal variability during the period of 2016–2021 is observed in this region. In the central and southern parts, this similarity is observed only in some years, for example in 2017. The lightning variability in this year can be explained by the maximum frequency (during the period of 2010–2019) of mesoscale convective complexes occurrence, where thunderstorms can develop [
38]. Similarly, since these complexes were predominantly formed in air mass genetic type, we can speak about the major role of regional features of atmospheric circulation in the formation of intense thunderstorm activity this year, which can lead to more fire occurrence.
Differences in lightning activity (with a maximum in July) and hotspots (with maximum in April) in the central and southern regions of Western Siberia could be due to the influence of human activity (the beginning of agricultural season, in particular) as the main cause of fires. Here fuel moisture (litter) characteristics also play an important role, also in addition to such meteorological parameters as air temperature, atmospheric precipitation and snow cover duration, depth, and its date of melting should also be considered [
10,
37]. Moreover, an increase in the number and duration of droughts in the spring contributes to an increase in forest fire danger [
10].
It is noteworthy that LIWs are the most dangerous for boreal forests and for the ecologically vulnerable region of the Arctic. However, there is difficulty in their timely detection. In the regard, thunderstorms are an underestimated threat to Russia’s forests in the mid-latitudes, and the precision with which the characteristics of lightning activity for the examined area are estimated is a matter of high importance [
39].
At the present time, there are several sources of data on lightning activity for the region of study: lighting detectors, satellite data, gridded data. Visual and instrumental observations with lightning detectors were the only sources of information about thunderstorms until the end of the 20th century, which made it impossible to obtain reliable estimates of the density of lightning discharges over a given area. Since the 1990s, meteorological satellites have been an additional source of information regarding thunderstorms: Optical Transient Detector (OTD) on the MicroLab-1 satellite, the Lightning Imaging Sensor (LIS) on the TRMM (Tropical Rainfall Measuring Mission) satellite [
33]. Satellite systems have been used to monitor the locations and extent of active fires and burned scars worldwide, such as AVHRR, MODIS, or VIIRS [
40]. However, to achieve the main goal of the article, datasets that cover the study area and provide reliable information on thunderstorm activity with high spatial and temporal resolution are required. Best of all, the criteria above correspond to the data of WWLLN. The network has been in operation since 2001, under the direction of the University of Washington (USA), and currently has over 70 sensors, including five in the Russian Federation [
28].
According to recent studies, the worldwide average efficiency of lightning detection for WWLLN is about 30% [
41]. Assessment of the WWLLN detection efficiency by comparison to the Lightning Imaging Sensor (LIS) illustrates that almost 70% of the strokes detected by WWLLN in the LIS field of view were matched with flashes detected by LIS with a mean (median) time difference and distance of 114 ms (24 ms) and 10 km (9 km), respectively. Around 30% of strokes detected by WWLLN in the LIS field of view were not assigned to any flash detected by LIS. These unmatched strokes correspond to cloud-to-ground lightning, given that LIS displays a lower detection efficiency for this type of discharge while WWLLN preferentially detects these kind of events [
42]. This feature of WWLLN is favorable for this study since cloud-to-ground lightnings are the cause of fires.
While the WWLLN does not capture every lightning stroke and underestimates stroke density at peak periods, it represents a unique, open-access global gridded data of lightning frequency, providing a basis for climatologies that resolve diurnal in addition to seasonal variations in lightning time series [
27,
43].
Based on the WWLLN data, studies on the variability of lightning activity and on the identification that forest fires to be caused by lightning were carried out for the following regions of Russia: Gorno-Altaisk [
35], Tomsk region [
21], Yakutia [
36]. Currently, the territory of Western Siberia with various natural landscapes (forest ecosystems, peat bog ecosystems, permafrost zones, and savannas) is understudied for this problem. Therefore, in our study, we attempt to assess the impact of lightning activity on the occurrence of fires in a vast region of Western Siberia using an integrated statistical approach.
Descriptive statistics, correlation, and regression analysis allow us to carry out the comparison analysis of hotspots and lightning based on gridded dataset. A probability analysis applied for different regions of the planet [
14,
19,
20] and based on the proximity index and the probability index calculation allows us to classify a fire as likely caused by lightning for western Siberia. The probability analysis applied in this article demonstrated that the fire activity caused by lightning discharges in Western Siberia may vary from 5 % to 43 % from month to month. Generally, over the whole warm season, the highest probability value is observed in the northern part (up to ~30%). It should be noted that these values nearly coincide with the values (up to 37 %) obtained in [
10,
11] for the Tomsk region using other methods. Despite the large number of fires in the south of the territory, the probability of ignition from lightning is higher in the central and in the northern parts of Western Siberia. This result is also in agreement with a previous study [
12].
Concepts such as hotspots and fires should be distinguished. Thus, as presented in
Table 1, proportions could not necessarily fit the actual number of fires caused by lightning. As a rule, only one or few hotspots from a wildfire would reveal the real fire location caused by a lightning, while the other hotspots have a probability B > 0, because they are close in space and time to the revealed fire point. Thus, our revealed proportions are a proxy of the LIW activity in Western Siberia. To obtain estimates that are more accurate, fire scar data should be also applied.
There are factors that have impacts on the probability of LIW occurrence and holdover duration. Among them, for instance, are fuel (e.g., litter depth, moisture, and flammability) and thunderstorm characteristics (e.g., timing and velocity) [
14]. Some lightning-caused fires may smolder (i.e., combustion without flaming) up to days depending on the fuel characteristics and weather conditions after ignition [
9,
20]. The duration of the smoldering survival phase is generally short (i.e., it decreases exponentially with increasing time, and most of the holdover fires last for less than 24 to 48 h) [
6,
17]. Conversely, holdover durations in boreal forests are longer [
44] than in tropical ecosystems [
17]. The fire in the forest fuel material caused by lightning can smolder inside the trunk for a certain time until favorable conditions for its development into a forest fire [
15]. Therefore, for boreal forests, it seems that 10 consecutive dry days is an important consideration for fire potential [
16].
Despite the fact that the choice of the distance parameter was based on the spatial accuracy of lightning data (~10 km), for some wildfires, more restrictive methods should be applied, such as a 5-km search radius or the individual radius approach [
17]. The calculation error (in the dependence of changes in the distance parameter) also should be derived, and that will be the future goal of this research.
Fire activity is also influenced by weather factors, such as the amount and duration of precipitation, air temperature, relative humidity, number of days since rain started, snow cover characteristics, etc. [
15]. This is important, because without the formation of relevant weather conditions, fire will not be ignited even when lightning occurs. A dry thunderstorm (i.e., when lightning is located without rain nearby) has a significant impact on the fire occurrence probability. For example, it was found that if less than 1 mm of precipitation fell during a thunderstorm, the risk of fire from lightning strikes was four times greater than if precipitation fell [
45]. Dry thunderstorms are a hazardous convective phenomenon that causes natural fires, and the study provided in this article is the first step toward identifying them, which is highly important against the background of climate extremality increase in Western Siberia projected to last until the end of the 21st century [
46]. To continue the research, the characteristics of atmospheric precipitation and fuel moisture content will be also included in the analysis; a comprehensive approach is required, considering all relevant elements.
5. Conclusions
This research compares the spatial and temporal variability of lightning activity and wildfires in several natural-geographical zones of Western Siberia from 2016–2021, based on the WWLLN and the MODIS data.
It was revealed that the highest lightning activity is observed over the areas with boreal forests, and the highest hotspot density, in contrast, is observed in croplands, savannas, and mixed forests. The number of fires in the southern part of the territory is about 1.5 times higher than in the northern part, and the fire season is longer, which could be caused by the enhanced influence of anthropogenic factors. However, the areas with maximum values of indicated parameters coincided in the southwestern part of the territory (near Khanty-Mansiysk and Tyumen), in the mountain regions (Kuznetsk Alatau, Altai), and in the northern part of Kazakhstan. This similarity in the central and southern parts is clearly pronounced in 2017, which could be explained by the regional atmospheric circulation variability.
As for seasonal variability, maximum values of lightning occur in July for the whole territory of Western Siberia, and maximum values of hotspots occur in April in the central and southern regions of Western Siberia.
It was established that in most considered areas of the region, the relationship between lightning and hotspots is positive. However, correlation coefficients are low and statistically insignificant.
The probability analysis, based on calculation in the borders of each cell and on proximity index calculation (applying distance parameters and temporal windows), had similar results. However, the second method makes it possible to obtain values that are more accurate; the probability analysis applied in this article illustrated that the fire activity caused by lightning discharges in Western Siberia may vary from 5 to 43% during the warm seasons over a 6-year period. Despite the largest number of fires in the south of the territory, the probability of ignition from lightning over the whole warm season is higher in the northern parts of Western Siberia (~20% in the south and ~30% in the north).
Thus, the findings in the study on the spatial and temporal variability of lightning activity, in addition to the number of hotspots, their associations, and the estimation of lightning-ignited fire probability allows us to better understand these events’ variability (particularly considering the lack of studies in this direction for the region) and to identify the areas with the greatest risk of fire danger from lightning. The results of this study will help to improve the assessment of fire regime in different Siberian regions. However, other climatic parameters, such as atmospheric precipitation, air and soil temperature-humidity characteristics, and fire scar data should be considered in the future to identify the phenomenon of dry thunderstorms and their influence on fire occurrence in more detail. It is important to assess the conditions that lead to the formation of dry thunderstorms in various natural zones across the Western Siberia, which will help specify climatic models and improve the fire prevention measures in the regions.
