Abstract
The south coast of Korea is vulnerable to coastal disasters, such as storm surges, high waves, wave overtopping, and coastal flooding caused by typhoons. It is imperative to predict such disastrous events accurately in advance, which requires accurate meteorological forcing for coastal ocean modeling. In this study, to acquire accurate meteorological data as important forcing variables for the prediction of storm surges and waves, we examined the forecast performance and applicability of a next-generation global weather/climate prediction model, the Model for Prediction Across Scales (MPAS). We compared the modeled surface pressure and wind with observations on the south coast of Korea for three typhoons that damaged Korea in 2020—Bavi, Maysak, and Haishen—and investigated the accuracy of these observations with the MPAS prediction. Those meteorological forcing variables were then used in the tightly coupled tide-surge-wave model, Advanced CIRCulation (ADCIRC) and the Simulating Waves Nearshore (SWAN) for the simulation of a typhoon-induced storm surge and wave. We also performed the hindcast of the wave and storm surges using a parametric tropical cyclone model, the best-track-based Generalized Asymmetric Holland Model (GAHM) embedded in ADCIRC+SWAN, to better understand the forecast performance and applicability of MPAS. We compared the forecast results of the typhoon-induced wave and storm surges with their hindcast in terms of the time-series and statistical indices for both significant wave height and storm surge height and found that wave and storm surge prediction forced by MPAS forecast provides a comparable accuracy with the hindcast. Comparable results of MPAS forcing with that of hindcast using best track information are encouraging because ADCIRC+SWAN forced by MPAS forecast with an at most four-day lead time still provides a reasonable prediction of wave and storm surges.
Keywords:
numerical weather prediction; MPAS; ADCIRC; SWAN; typhoons; storm surge; wave; the south coast of Korea 1. Introduction
The intensity of typhoons tends to be stronger due to climate change [1], which threatens human lives and properties needless to say. Typhoons, which normally affect Korea in the summer, have started to affect Korea in September and October, which are included in autumn, and the intensity of the typhoons is also on the rise [2]. Because of this prolonged typhoon season and growing intensity, it is necessary to monitor for typhoons long after summer, when people are usually relieved from the burden of damage caused by the high waves, storm surges, and the overlapping effect of the two caused by a typhoon. In fact, typhoon Chaba, recently occurring in October 2016, hit the south coast of Korea, especially Busan, the second-largest city in Korea, severely damaging the city by wave overtopping caused by high waves, while the storm surge was overlapping at high tide.
To prevent coastal disasters such as this, it is necessary to build disaster prevention facilities in advance in areas vulnerable to disasters and to accurately and quickly predict disasters before they occur [3]. For the construction of a breakwater, which is a representative disaster prevention facility, a design wave must be determined. Recently, the Korea Ministry of Oceans and Fisheries [4] has prioritized the method of directly obtaining the design wave using meteorological data; therefore, the reliability, accessibility, and applicability of the meteorological data have become more important. On the other hand, efforts should be made to predict coastal disasters accurately and quickly before disasters, such as extremely high waves and wave overtopping induced by typhoons occur; therefore, it is essential to develop a numerical model that can rapidly produce accurate and reliable weather data on the basis of high-performance computing. Furthermore, a storm surge, which is caused primarily by atmospheric pressure change associated with a storm and a storm’s winds pushing water onshore, leading to coastal flooding, must be accurately predicted. Therefore, the development of accurate and reliable meteorological data is necessary.
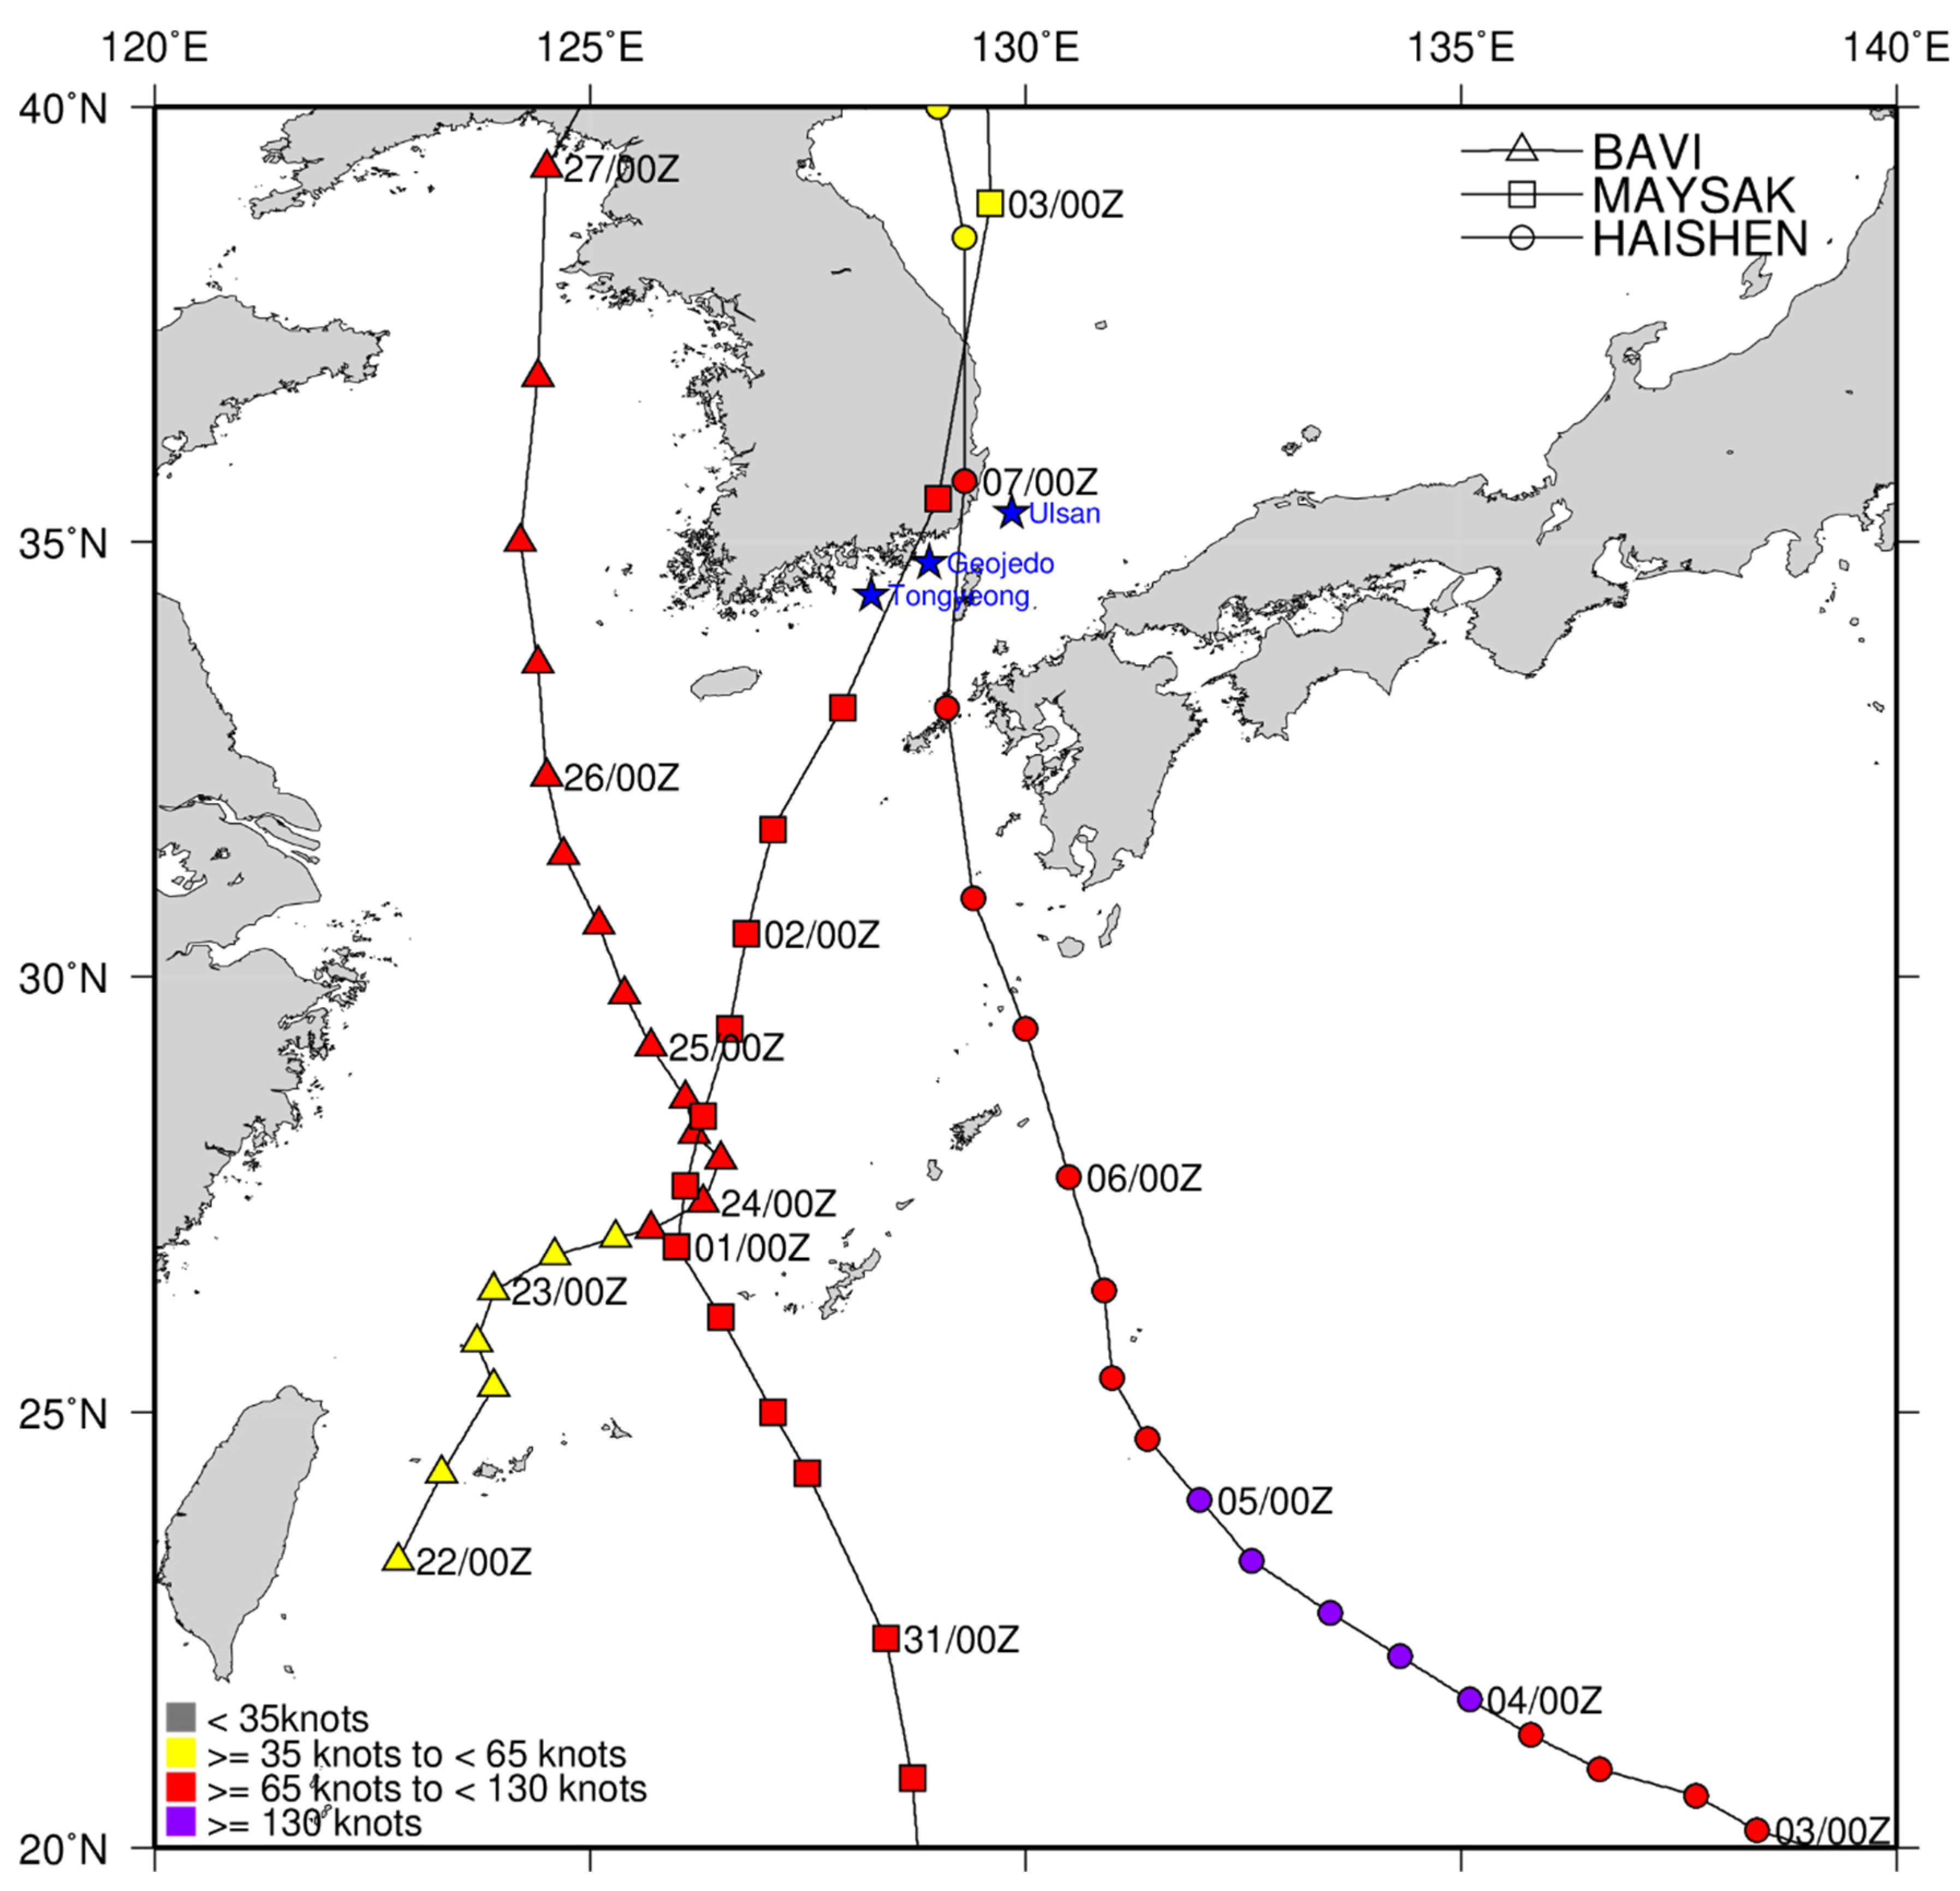
We chose three typhoons—Bavi, Maysak, and Haishen—that caused severe damage to Korea in 2020 and carried out a forecast of storm surges and waves due to those typhoons to evaluate the reliability and applicability of meteorological data through a simulation of past typhoon cases (Figure 1). The used and evaluated meteorological data were produced by a simulation of the next-generation global weather/climate prediction model, MPAS (Model for Prediction Across Scales) [5]. In addition, to more closely grasp the accuracy of MPAS’ weather prediction, a hindcast run based on the best track was performed and compared with the MPAS forecast run results. Here, the best track data are a diagnosis from observational records of past typhoons, which should be closer to the true state than the forecast model results. The storm surge-wave model utilized in the forecast and hindcast was ADCIRC+SWAN (ADvanced CIRCulation and the Simulating WAves Nearshore), and the domain/grid and configuration of that model followed those used for the examination of coastal flooding due to typhoon Chaba (2016) at the Suyeong River Area in Busan, Korea [6]. To assess the reliability and applicability of the weather prediction data, several case studies are necessary. The MPAS and ADCIRC+SWAN used in this study have already been verified by simulating typhoon Chaba in 2016 [6] and recent typhoons Lingling, Tapah, and Mitag in 2019 [7]; however, this study conducts in-depth research with typhoon cases in 2020. By verifying the forecast for recent extreme weather events, reliable meteorological data can be acquired and applied to the forecast system to establish coastal disaster prevention measures and disaster prediction systems for the south coast of Korea, including Busan.

Figure 1.
Typhoon tracks of Bavi, Maysak, and Haishen and the locations of wave observation buoys (blue stars). Here, time information of tracks is formatted as date/hour in UTC.
The following section introduces the coupled tide-surge-wave model, ADCIRC+SWAN, designed specifically for the south coast of Korea, the types of meteorological forcing to be input into ADCIRC+SWAN, their production methods, and experimental settings. In Section 3, the validation of the predicted variables during typhoons in 2020 is presented, and the applicability of MPAS for forecasting storm surges and waves in terms of developing future coastal risk prevention measures on the south coast of Korea is discussed.
2. Methodology
2.1. Tide-Surge-Wave Model
Recently, the tightly coupled models have been widely used to simulate storm surges and waves. A coupled model of ADvanced CIRCulation and the Simulating WAves Nearshore (ADCIRC+SWAN) is one of them, which we use in this study.
The two-dimensional (2D) depth-integrated version of the ADCIRC model [8,9] was used to simulate the water levels and currents. It basically solves generalized wave continuity equations on an unstructured triangular mesh with a continuous Galerkin finite element method. A third-generation spectrum wave model, the SWAN model [10,11], solves the wave action balance equation and gains wave parameters by integrating a 2D wave energy spectrum in the frequency and direction domain.
The integrated ADCIRC model and SWAN model, i.e., ADCIRC+SWAN, was developed by Dietrich et al. [12]. The ADCIRC model and SWAN model share the same unstructured grid, and both models are coupled fully by exchanging information with each other as follows: the input wind, water level, and currents processed by the ADCIRC model are passed to the SWAN model to obtain the wave spectrum by solving the wave action density balance equation. The radiation stress [13] is then passed to the ADCIRC model to calculate the water levels and currents. Since the ADCIRC+SWAN model was widely used in the world [14,15,16,17,18,19,20], the details of the model, such as the governing equation, are not described here.
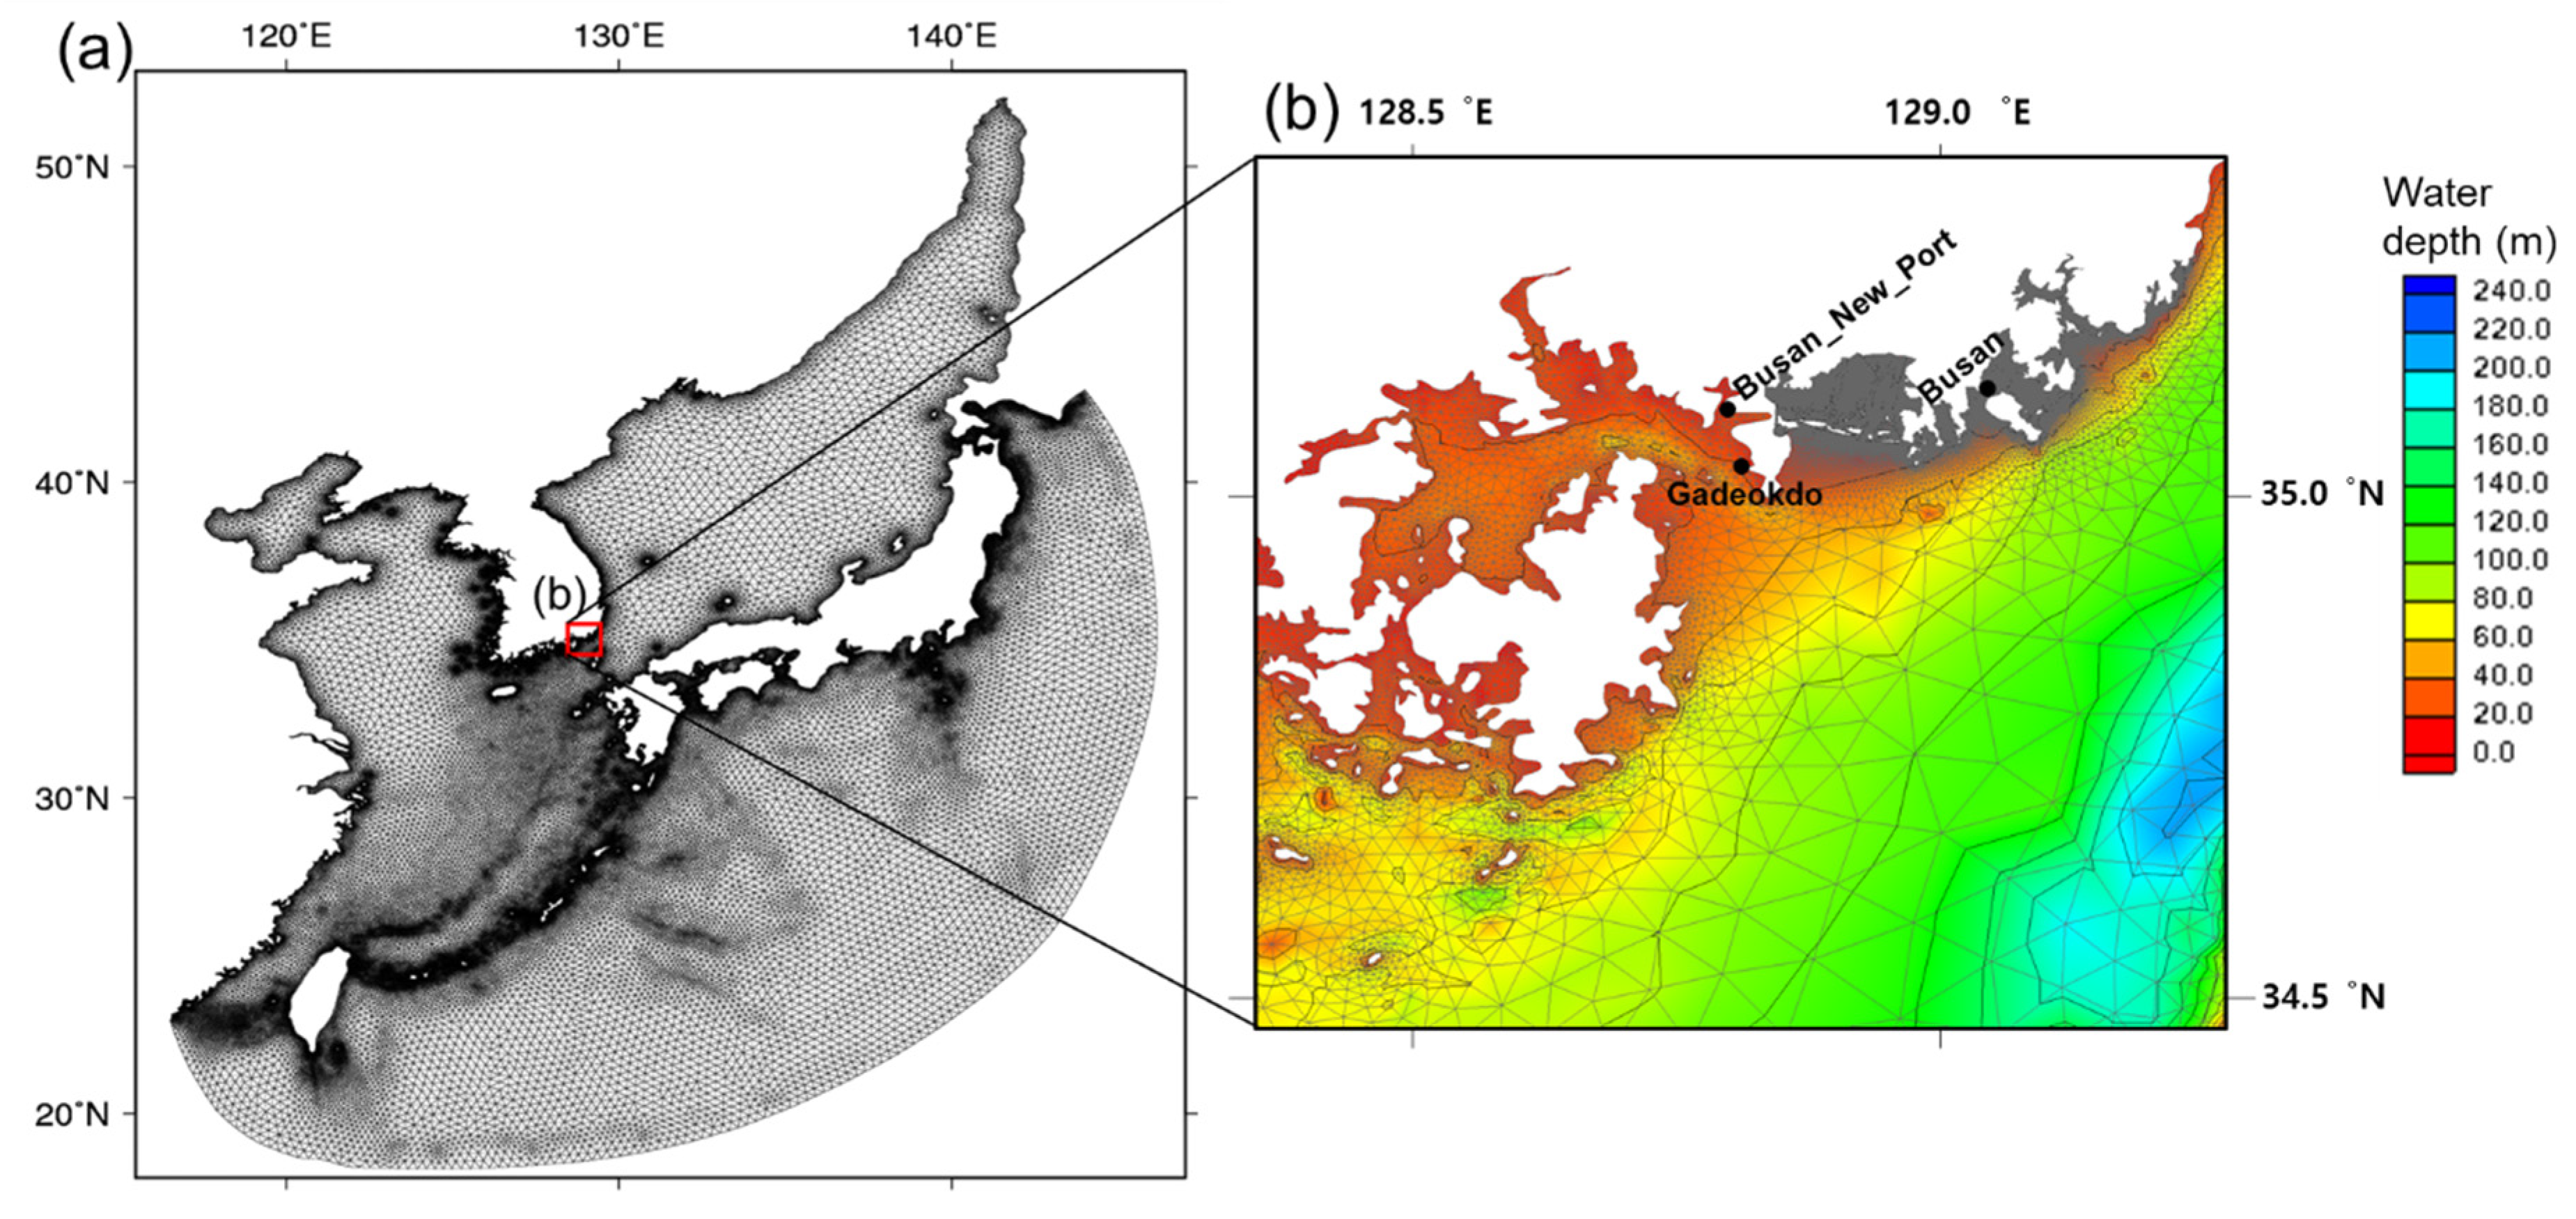
The model domain of ADCIRC+SWAN is composed of 469,421 nodes and 904,006 elements (Figure 2). The model grid is non-uniform, allowing desired areas to be fine and undesired areas to be coarse. Therefore, the study area of the south coast of Korea was created with a grid of at least 10 m, and the grid size was gradually increased to make an open boundary of about 30 km grid. Moreover, to improve the prediction of the storm surge and waves, this study used the topographic and bathymetric data provided by the National Geographic Information Institute (NGII), Korea Hydrographic and Oceanographic Agency (KHOA), and Busan.

Figure 2.
ADCIRC+SWAN grids: (a) model domain area and grids; (b) tide observation stations marked with black circles.
In the open boundary of the model domain, the amplitudes and phases of eight tidal constituents (M2, S2, K1, O1, N2, K2, P1, and Q1) obtained from Oregon State University (OSU) tidal databases [21] were given. The main settings of the SWAN model are as follows. The frequency increment factor, the first frequency, the number of frequencies, and the directions for all experiments were set to 1.1, 0.031384 Hz, 31, and 36, respectively. This study used the default model settings or parameters for the simulation of storm surges and waves.
2.2. Meteorological Forcing
Since storm surges and waves are generated by meteorological forcing, the ADCIRC+SWAN model requires wind at 10 m above the water surface and surface air pressure fields. ADCIRC+SWAN has been examined by various meteorological forcing input types of the wind and surface pressure fields to every node at a given time, Ocean Weather Inc., Stamford, CT 06901 USA (OWI)’s data, and the parametric tropical cyclone models (based on the Holland model [22] symmetric vortex model, dynamic asymmetric model, and generalized asymmetric Holland model). Thus, users can select the input type according to the purpose of the study or data format. In this study, for the forecast experiment, we selected the type of inputting wind and surface pressure fields to every node and at each specific time to use the output of the weather prediction model. For the hindcast experiment, to compare the prediction performance of the weather prediction model, we selected a type using the Generalized Asymmetric Holland Model (GAHM) based on the best track information such as the location and time of typhoon, maximum wind speed and radius, and central pressure.
We used MPAS as a weather prediction model. MPAS is a next-generation global weather/climate prediction model developed by the National Center for Atmospheric Research in the US [5,23,24]. Using MPAS with 60–15 km variable resolution meshes, we simulate typhoon cases that have strongly affected the Korean peninsula in 2020. More details on the MPAS configuration are listed in Table 1. All the simulations start from early analysis data from the NCEP GFS (National Center for Environmental Prediction Global Forecast System) [25]. Figure 3 shows the featured characteristics of MPAS variable resolution meshes used in this study. We have a finer resolution of 15 km over East Asia and the northeast of the Pacific (Figure 3a); therefore, we can see that there are 17,129 cells over Korea within a box of 15-degree latitude length and 20-degree longitude width (Figure 3b). A coarser resolution (60 km) area, such as Florida, has 1309 cells (Figure 3c), and we can clearly see transient mesh areas over Northern Australia (Figure 3d) with 2925 cells in the boxes with an equivalent size.

Table 1.
MPAS (version 7.0) model configurations.
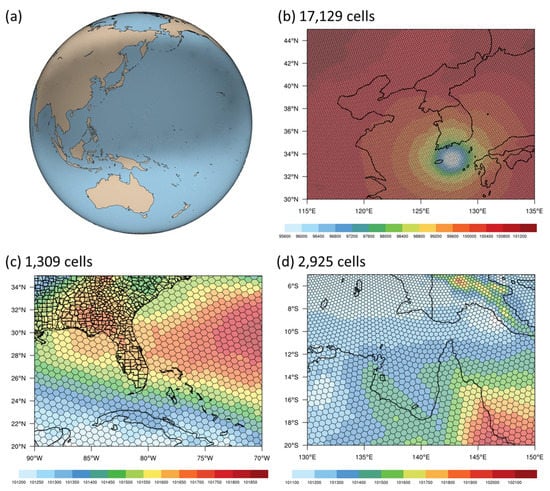
Figure 3.
MPAS meshes used in this study: (a) global view of variable resolution (60–15 km), where the gray zone over East Asia and the northeast Pacific region has a finer resolution of 15 km; (b) high resolution meshes over Korea where there are 17,129 cells within the plot; (c) coarse resolution meshes over Florida where there are only 1309 cells in the plot; (d) transient resolution meshes over northern Australia where there are 2925 cells in the plot. Shadings of (b–d) indicate the 36 h forecast of mean sea-level pressure valid at 12UTC on 2 September 2020.
GAHM [26,27] is an improved parametric model to realistically consider the asymmetric shape of a typhoon and its intensity and can directly use the typhoon information in Automated Tropical Cyclone Forecasting System (ATCF) format. The Joint Typhoon Warning Center (JTWC) produces typhoon best track and forecast data in ATCF format, where R34, R50, and R64 (radius of specified wind intensity, i.e., 34 kt, 50 kt, and 64 kt for any quadrant) are used in GAHM. The Asymmetric Holland Model (AHM), which is the previous model of GAHM, uses either R64, R50, or R34 as the strongest wind isotach to solve for a different maximum radius in each storm quadrant (NE, NW, SW, SE) (i.e., the single strongest isotach in each quadrant), while GAHM uses all available isotachs in the four quadrants (NE, SE, SW, NW).
As mentioned above, with regard to the three typhoons in 2020, we carried out the experiments using two types of meteorological forcing. The first is the hindcast simulation based on GAHM with the best track information of JTWC, and the second is the forecast simulation using the forecast output of MPAS as meteorological forcing. For the three typhoons, four or five forecast simulations using MPAS and a hindcast simulation using best track were performed (Table 2), but the simulation result of typhoon Bavi is not shown here. The hindcast/forecast simulation results of typhoon Bavi were reasonable but not shown here because Babi was the weakest typhoon among the three selected and moved to the west coast of Korea with less impact on the south coast of Korea.
Table 2.
Three selected typhoons in 2020 and their hindcast/forecast simulation cases and periods.
In the cases of typhoons Maysak and Haishen, five forecast runs using MPAS were performed at 12 h intervals. Three experiments starting at 00 UTC were selected and then used for wave and storm surge simulations. The initial times of the selected simulation denote 1–4 days before the typhoon reaches the south coast of Korea. To compare the prediction performance of the forecast experiment, a hindcast experiment using the best track was also performed for each typhoon. Here, we selected typhoon track information of JTWC, which provides R34, R50, and R64 required for GAHM values in each quadrant of the typhoon to operate the hindcast run. Therefore, one hindcast test and three forecast tests were conducted for each typhoon, and the results of the two types of experiments were compared.
3. Results and Discussion
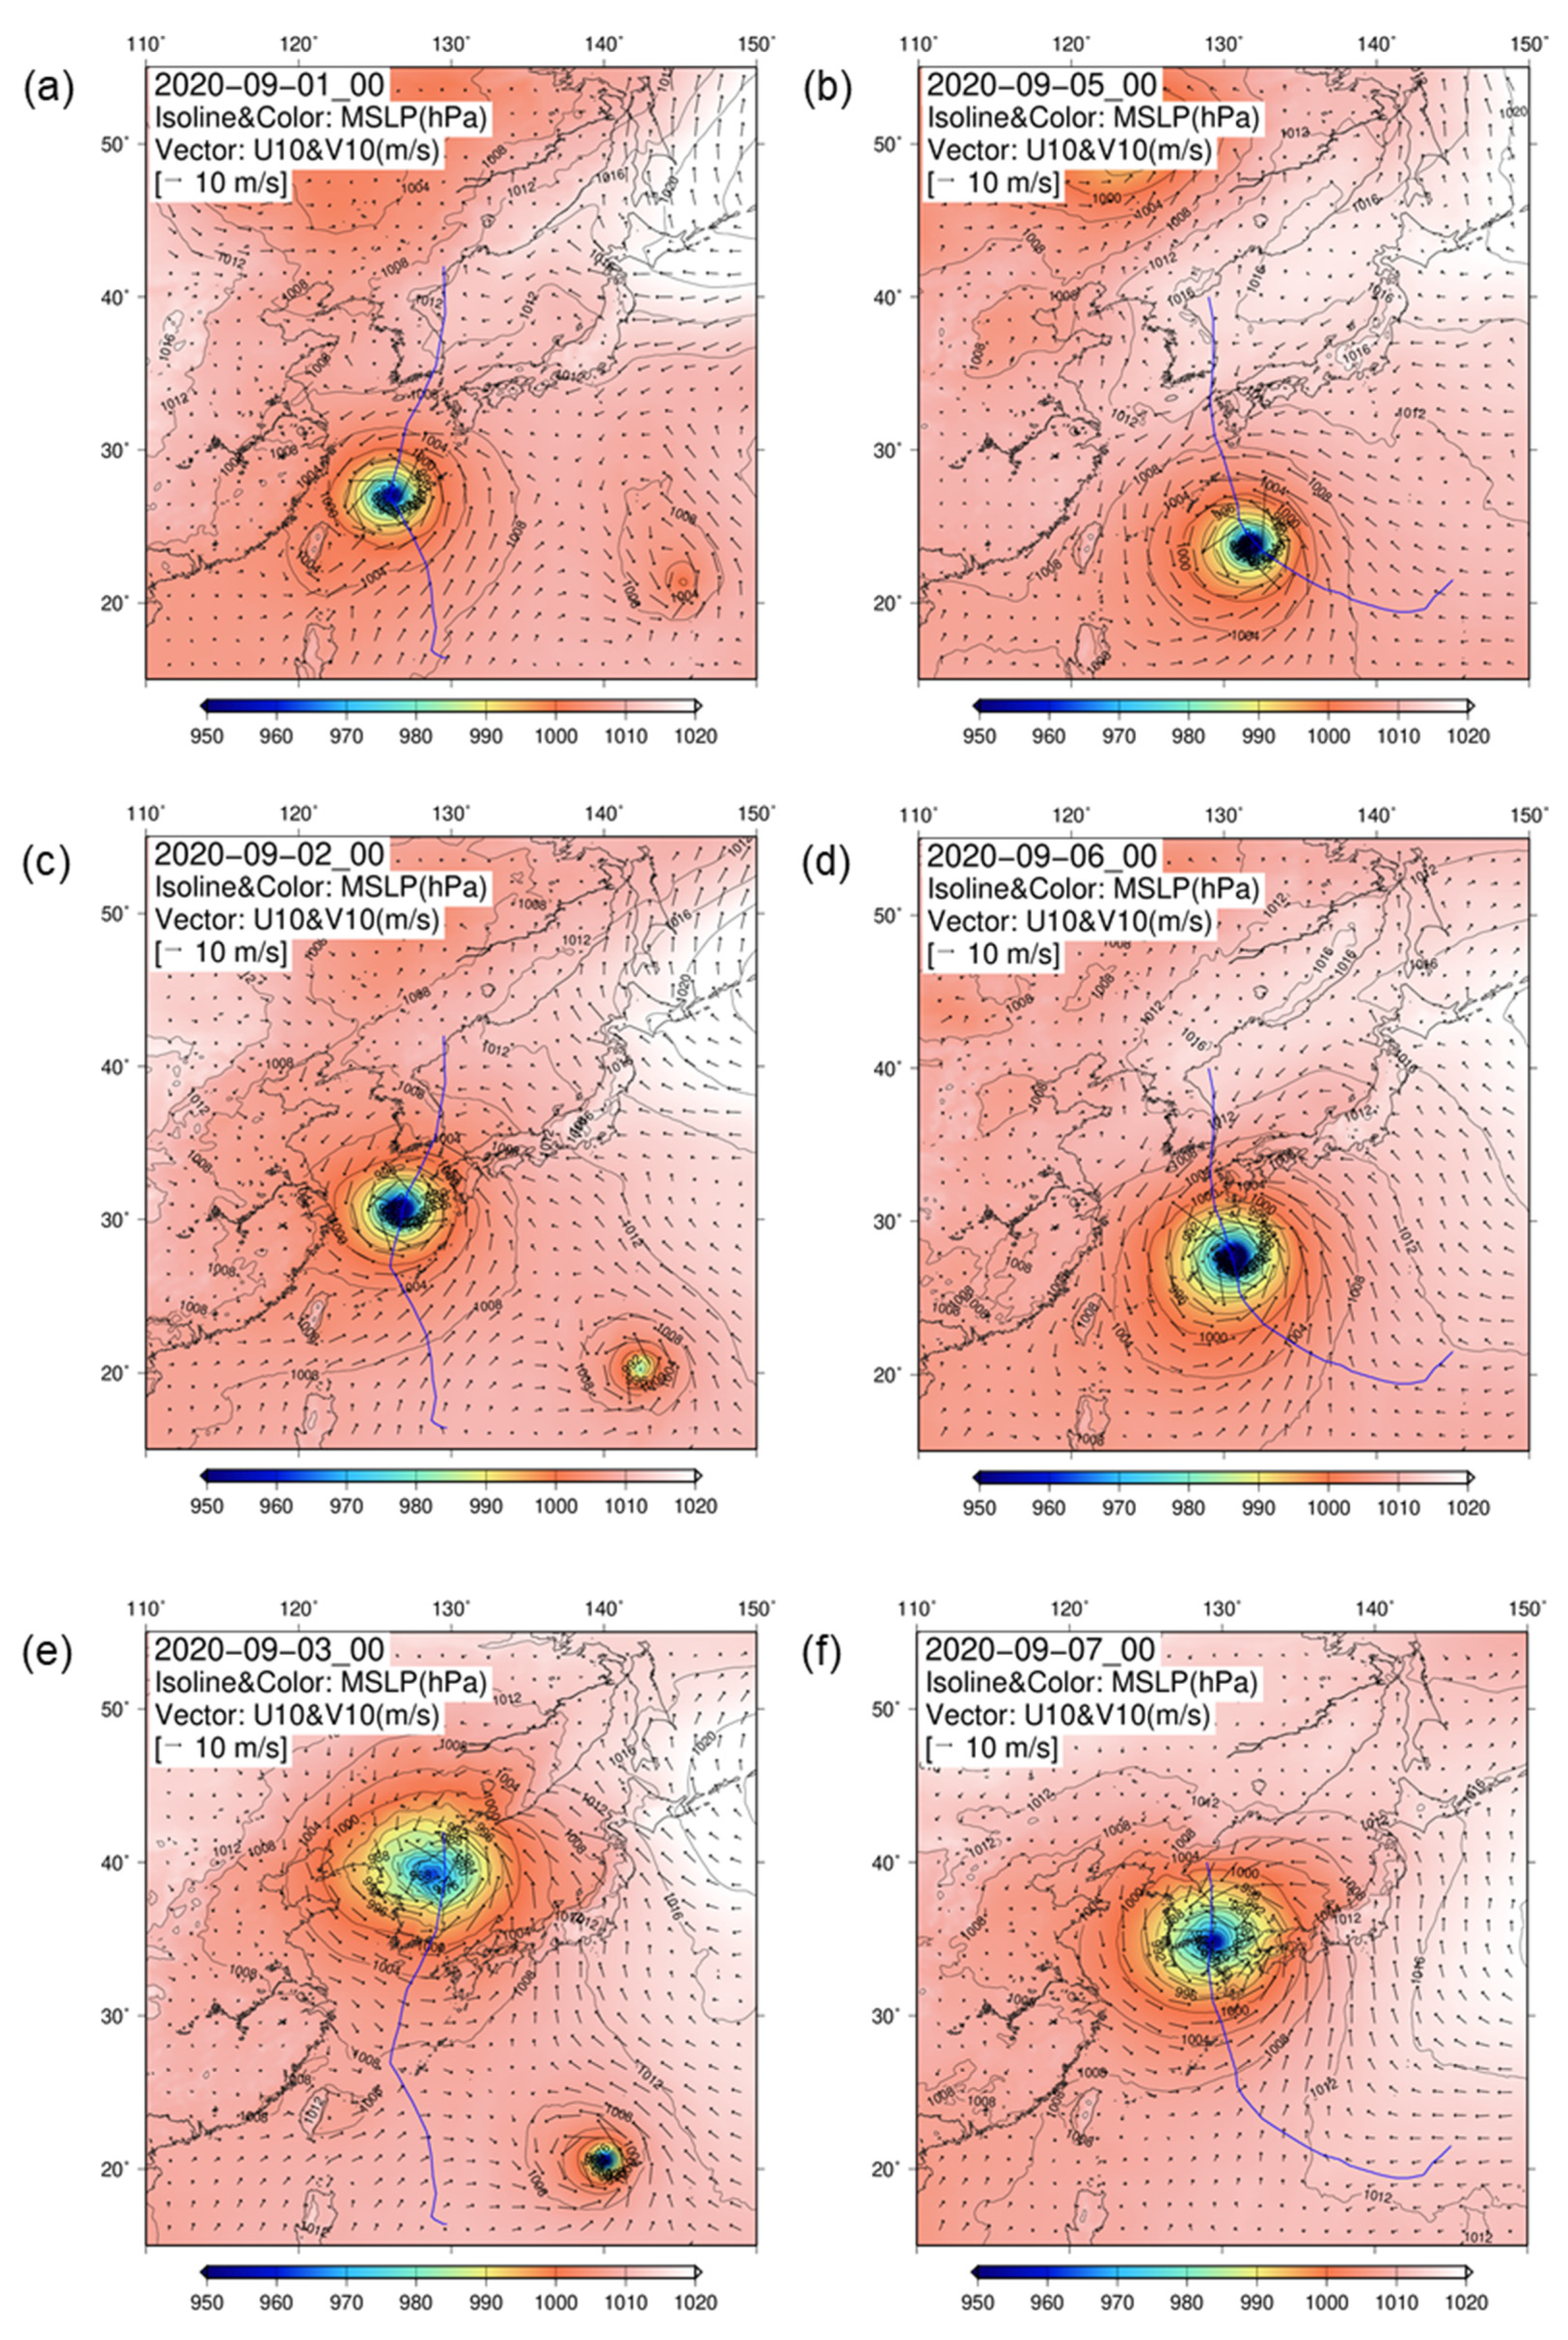
Figure 4 shows the results of forecasting the surface atmospheric pressure and 10 m wind using MPAS from about two days before typhoons Maysak and Haishen landed on the south coast of Korea. The left (a, c, and e) and right sides (b, d, and f) of Figure 4 show the forecast result of typhoon Maysak from 00 UTC on 1 September (name of simulation: 2020090100) and that of typhoon Haishen from 00 UTC on 5 September (name of simulation: 2020090500), respectively. Figure 4c,d shows the 1-day forecast results, and Figure 4e,f shows results of the 2-day forecast of the predicted typhoon landing on the south coast of Korea. Here, if the location of low pressure is considered as the typhoon center, in the 2-day forecasted track of typhoon Maysak (Figure 4e), the typhoon eye is slightly deviated from the best track. However, it is difficult to define the location of the typhoon eye when the typhoon center is tilted, and the intensity becomes significantly weak after landing; hence, it may not be clear to measure the exact distance between the tracks of a weakened typhoon over the land. Overall, the MPAS typhoon track follows the best track very closely; therefore, the typhoon forecasting performance of MPAS is adequate for use as input data to ADCIRC+SWAN. According to previous studies [6,28], MPAS forecasted typhoon tracks comparably well with similar forecasting agencies such as the Korea Meteorological Administration (KMA), Japan Meteorological Agency (JMA), and JTWC for typhoons that recently occurred in the Northwest Pacific.
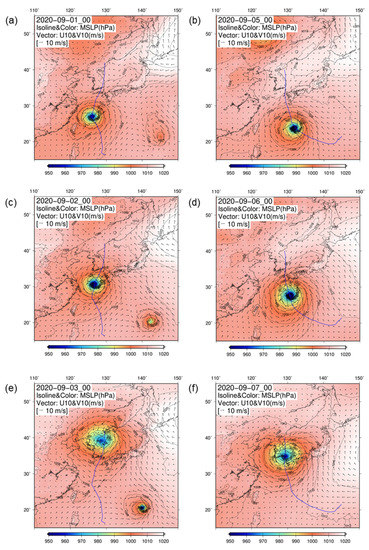
Figure 4.
Ten meter wind (arrows) and surface pressure fields (shadings) simulated by MPAS, and the typhoon best track of JTWC (thick blue lines). (a,c,e) the forecast result from 00 UTC on 1 September for typhoon Maysak, (b,d,f) that from 00 UTC on 5 September for typhoon Haishen.
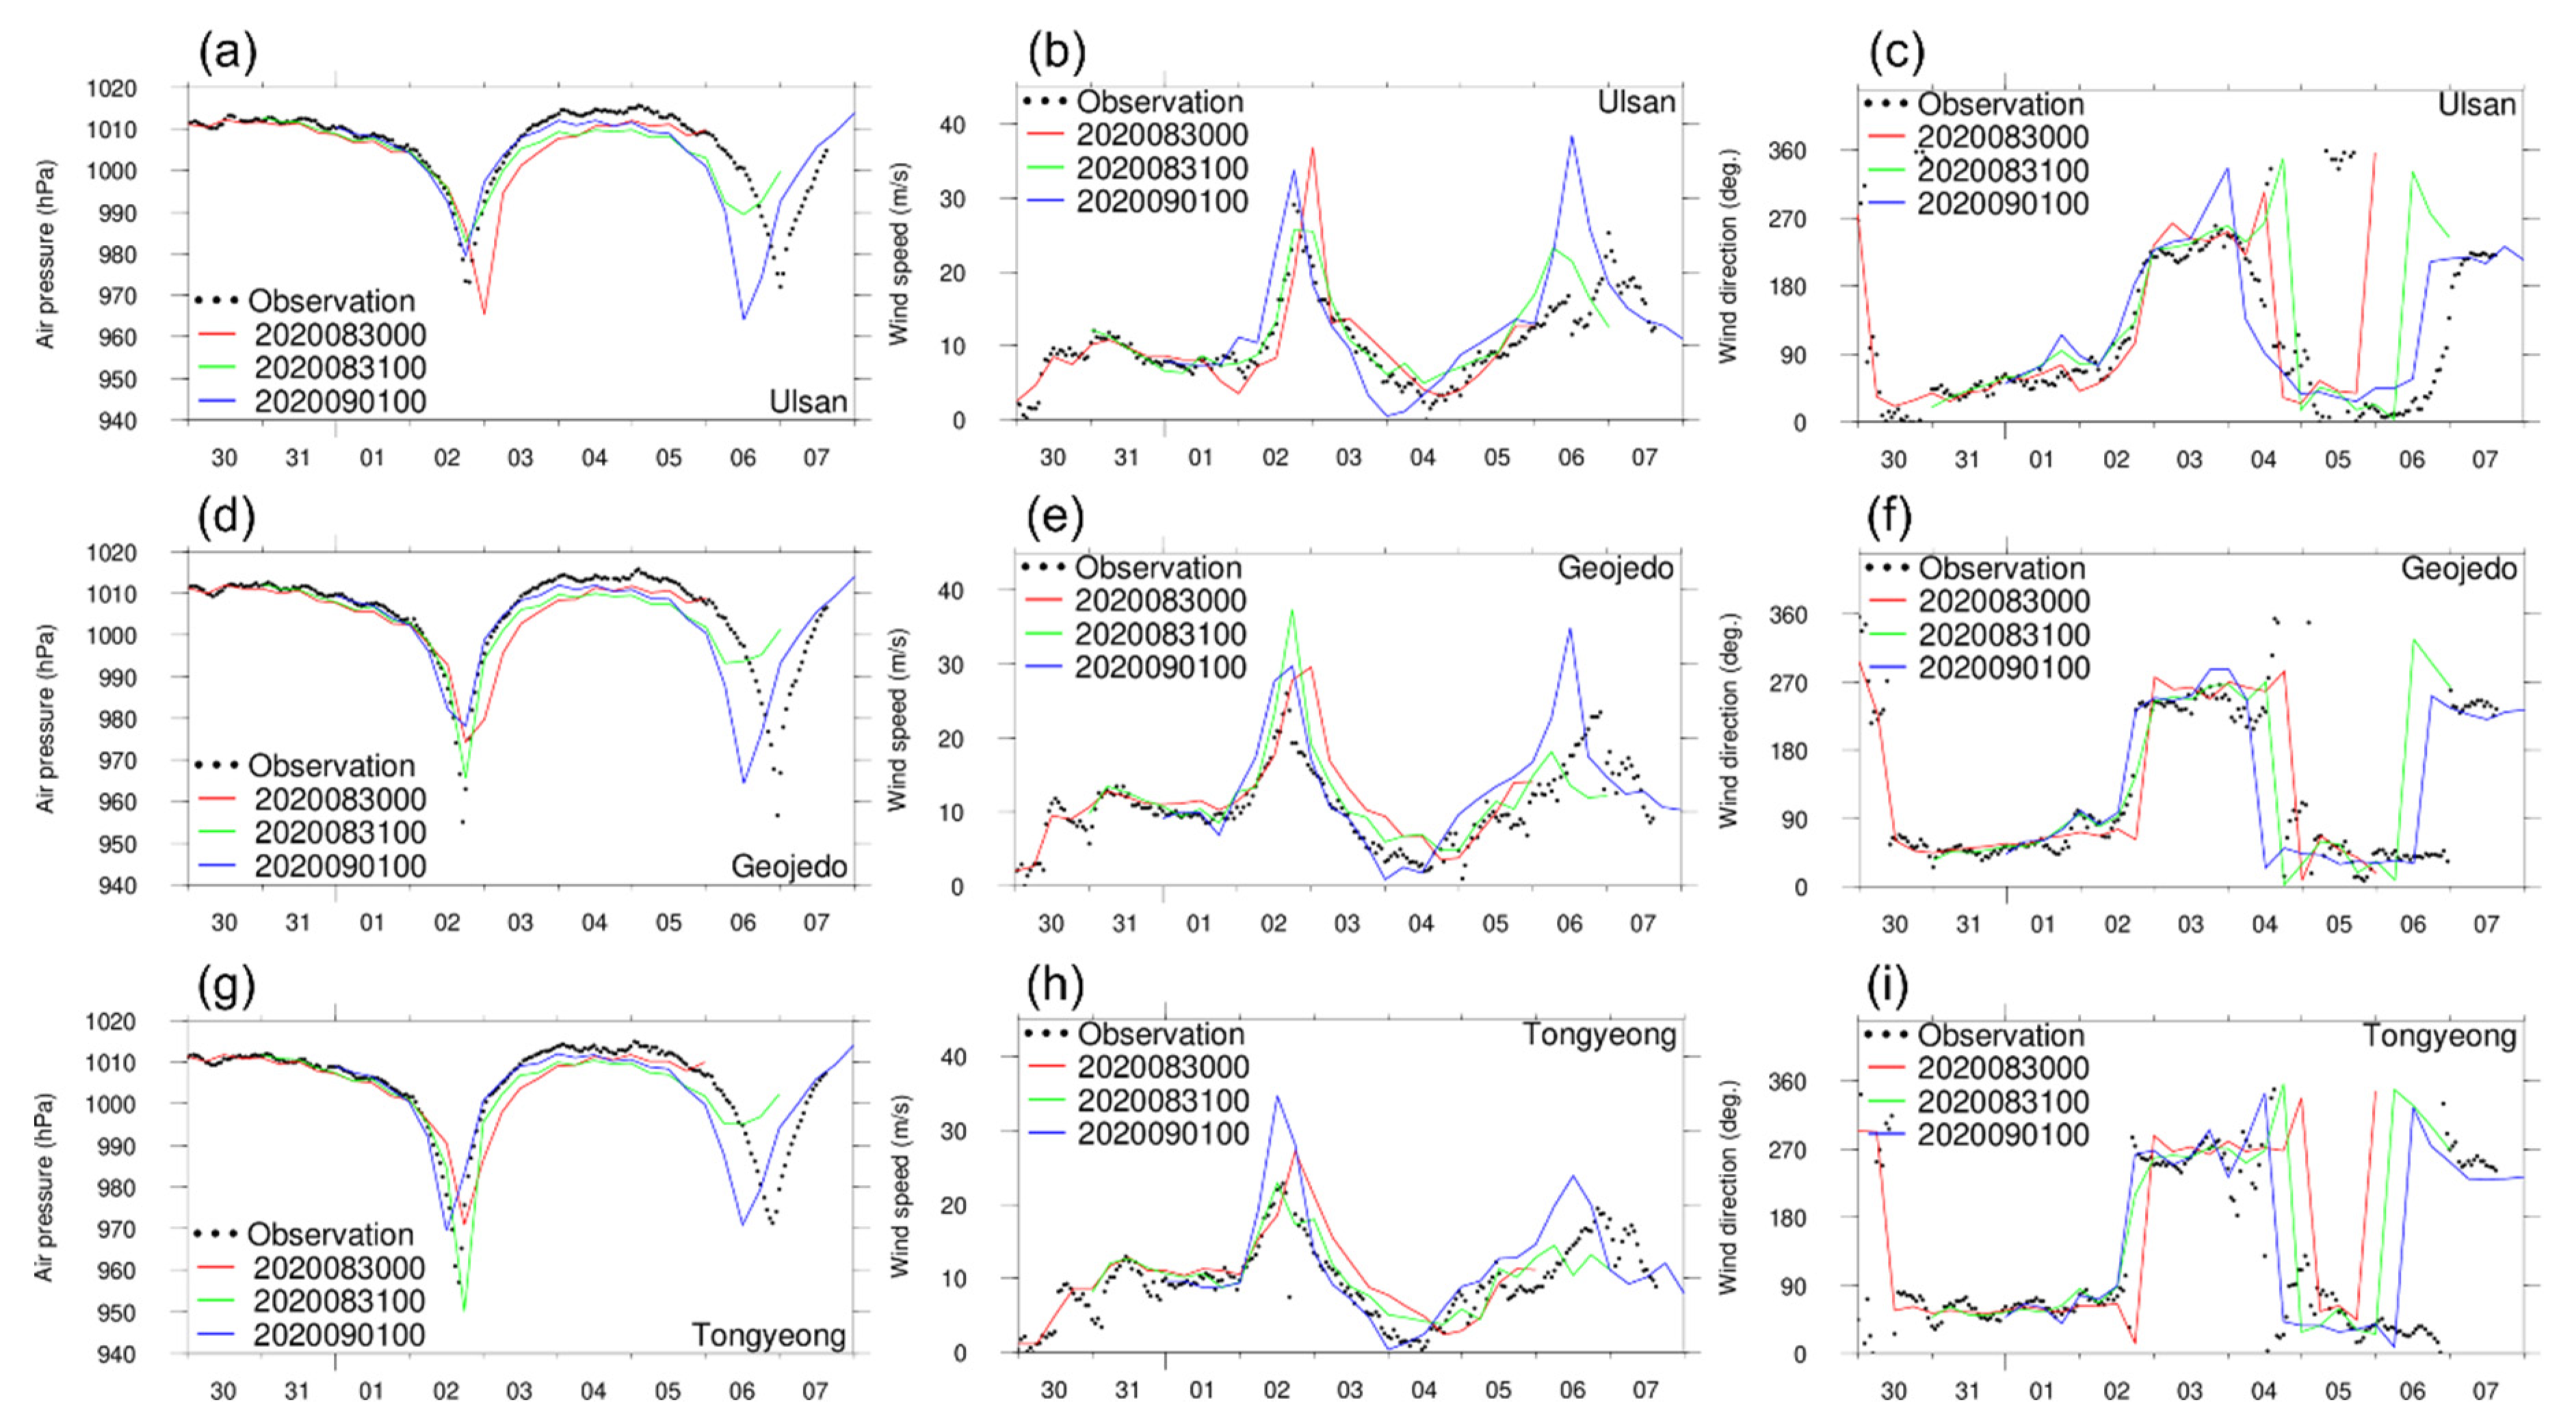
Figure 5 shows the validation results of surface pressure and wind during typhoon Maysak simulated by MPAS at three representative points of the south coast of Korea: Ulsan, Geojedo, and Tongyeong. The lowest surface pressure and highest wind speed shown on 6 September indicate the forecasted values of typhoon Haishen, which occurred immediately after typhoon Maysak. Thus, compared with the observations until 00 UTC on 5 September (time after 4 days from the latest forecast experiment ‘2020090100’), overall, all three MPAS forecast results were close to the observations, and the minimum and maximum values were also adequately predicted. Even the earliest forecast experiment, ‘2020083000’, which is the experiment that predicted approximately 4 days before the typhoon landed on the south coast of Korea, gave a good estimation of wind and surface pressure.
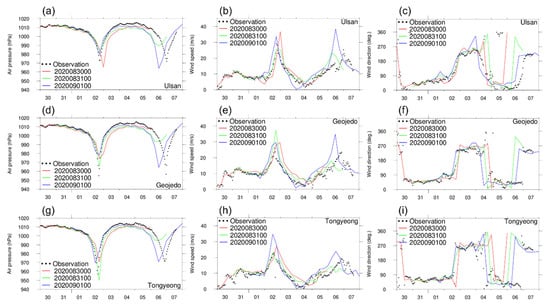
Figure 5.
Comparison of the MPAS forecast with the observations (Ulsan, Geojedo, and Tongyeong) for the case of Maysak in 2020. (a,d,g) surface pressure (hPa); (b,e,h) wind speed (m/s); (c,f,i) wind direction (degree). Here, the x-axis indicates the time with the date of the simulation period, and the interval of observation data is one hour.
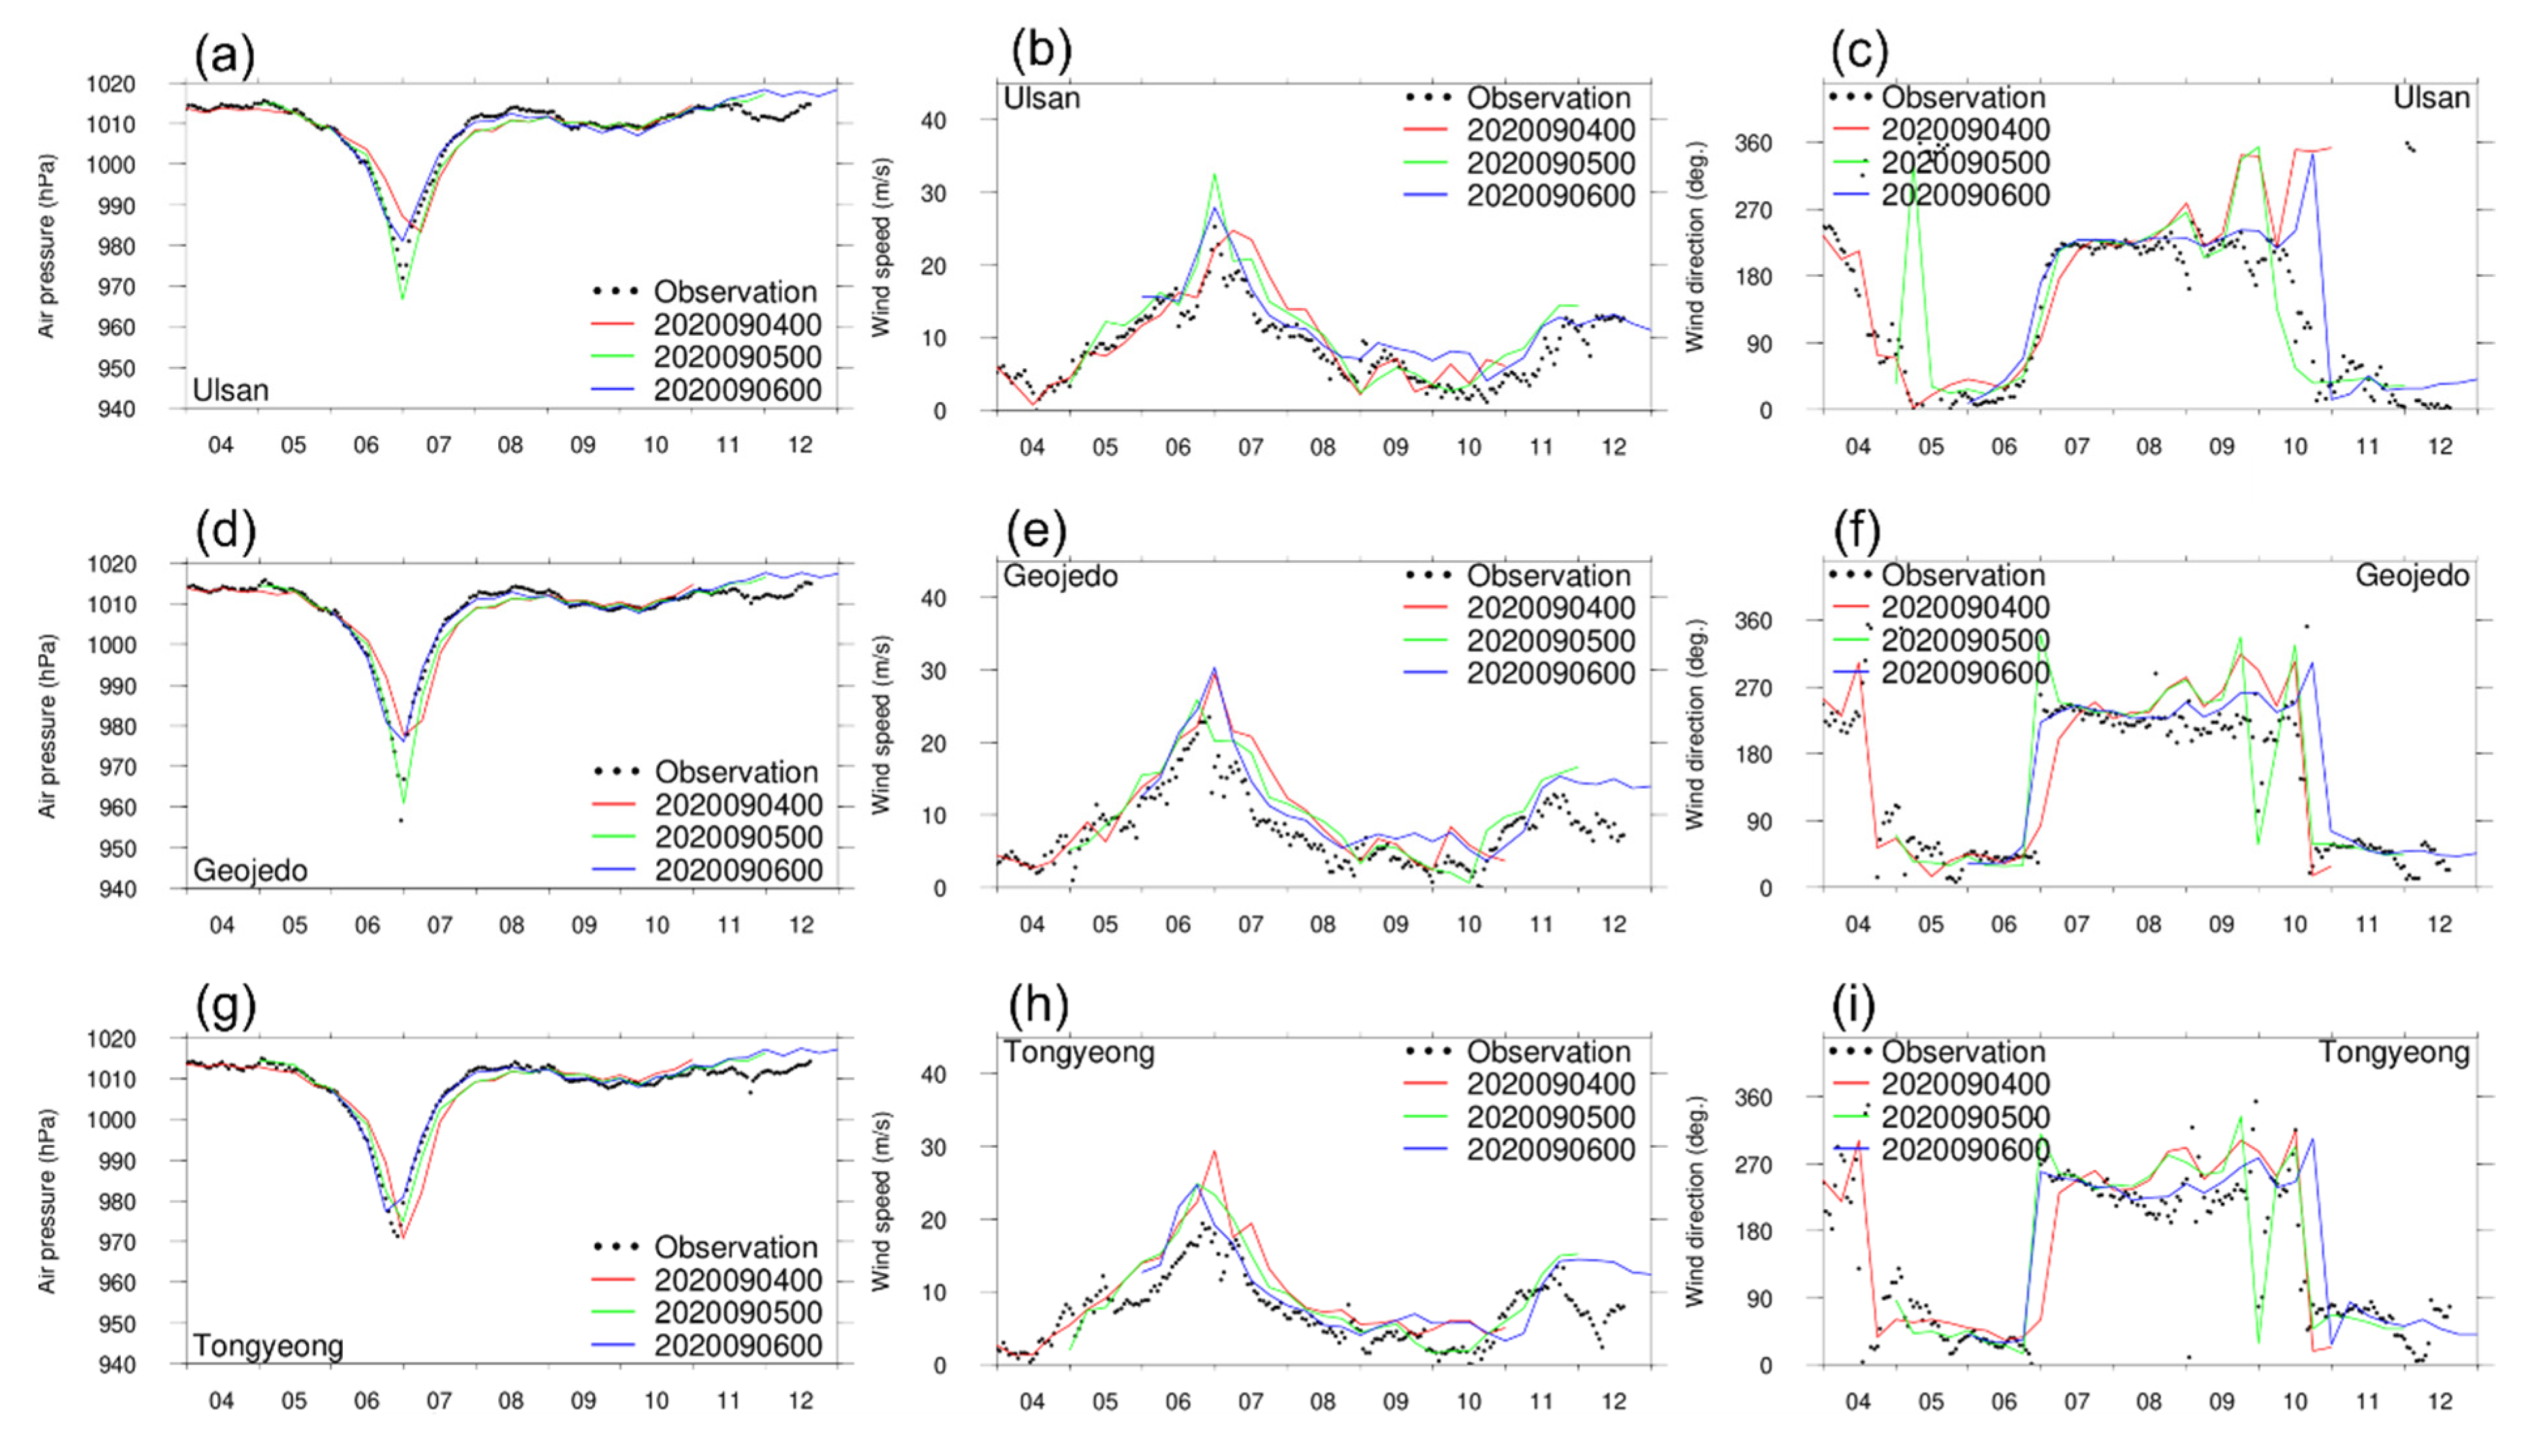
Figure 6 shows the verification of the MPAS simulation for typhoon Haishen. Accurate comparisons were also found at three wave buoys for typhoon Haishen; thus, the wind and surface pressure of typhoon Haishen were also accurately forecasted on the south coast of Korea. Even the earliest forecast case ‘2020090400’ (approximately 3 days before landfall) was adequately predicted, which is promising.
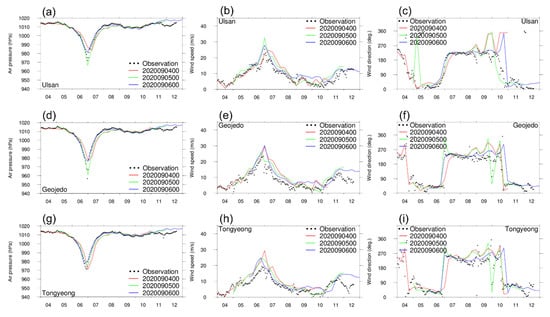
Figure 6.
Comparison of the MPAS forecast with the observations (Ulsan, Geojedo, and Tongyeong) for the case of Haishen in 2020. (a,d,g) surface pressure (hPa); (b,e,h) wind speed (m/s); (c,f,i) wind direction (degree). Here, the x-axis indicates the time with the date of the simulation period, and the interval of observation data is one hour.
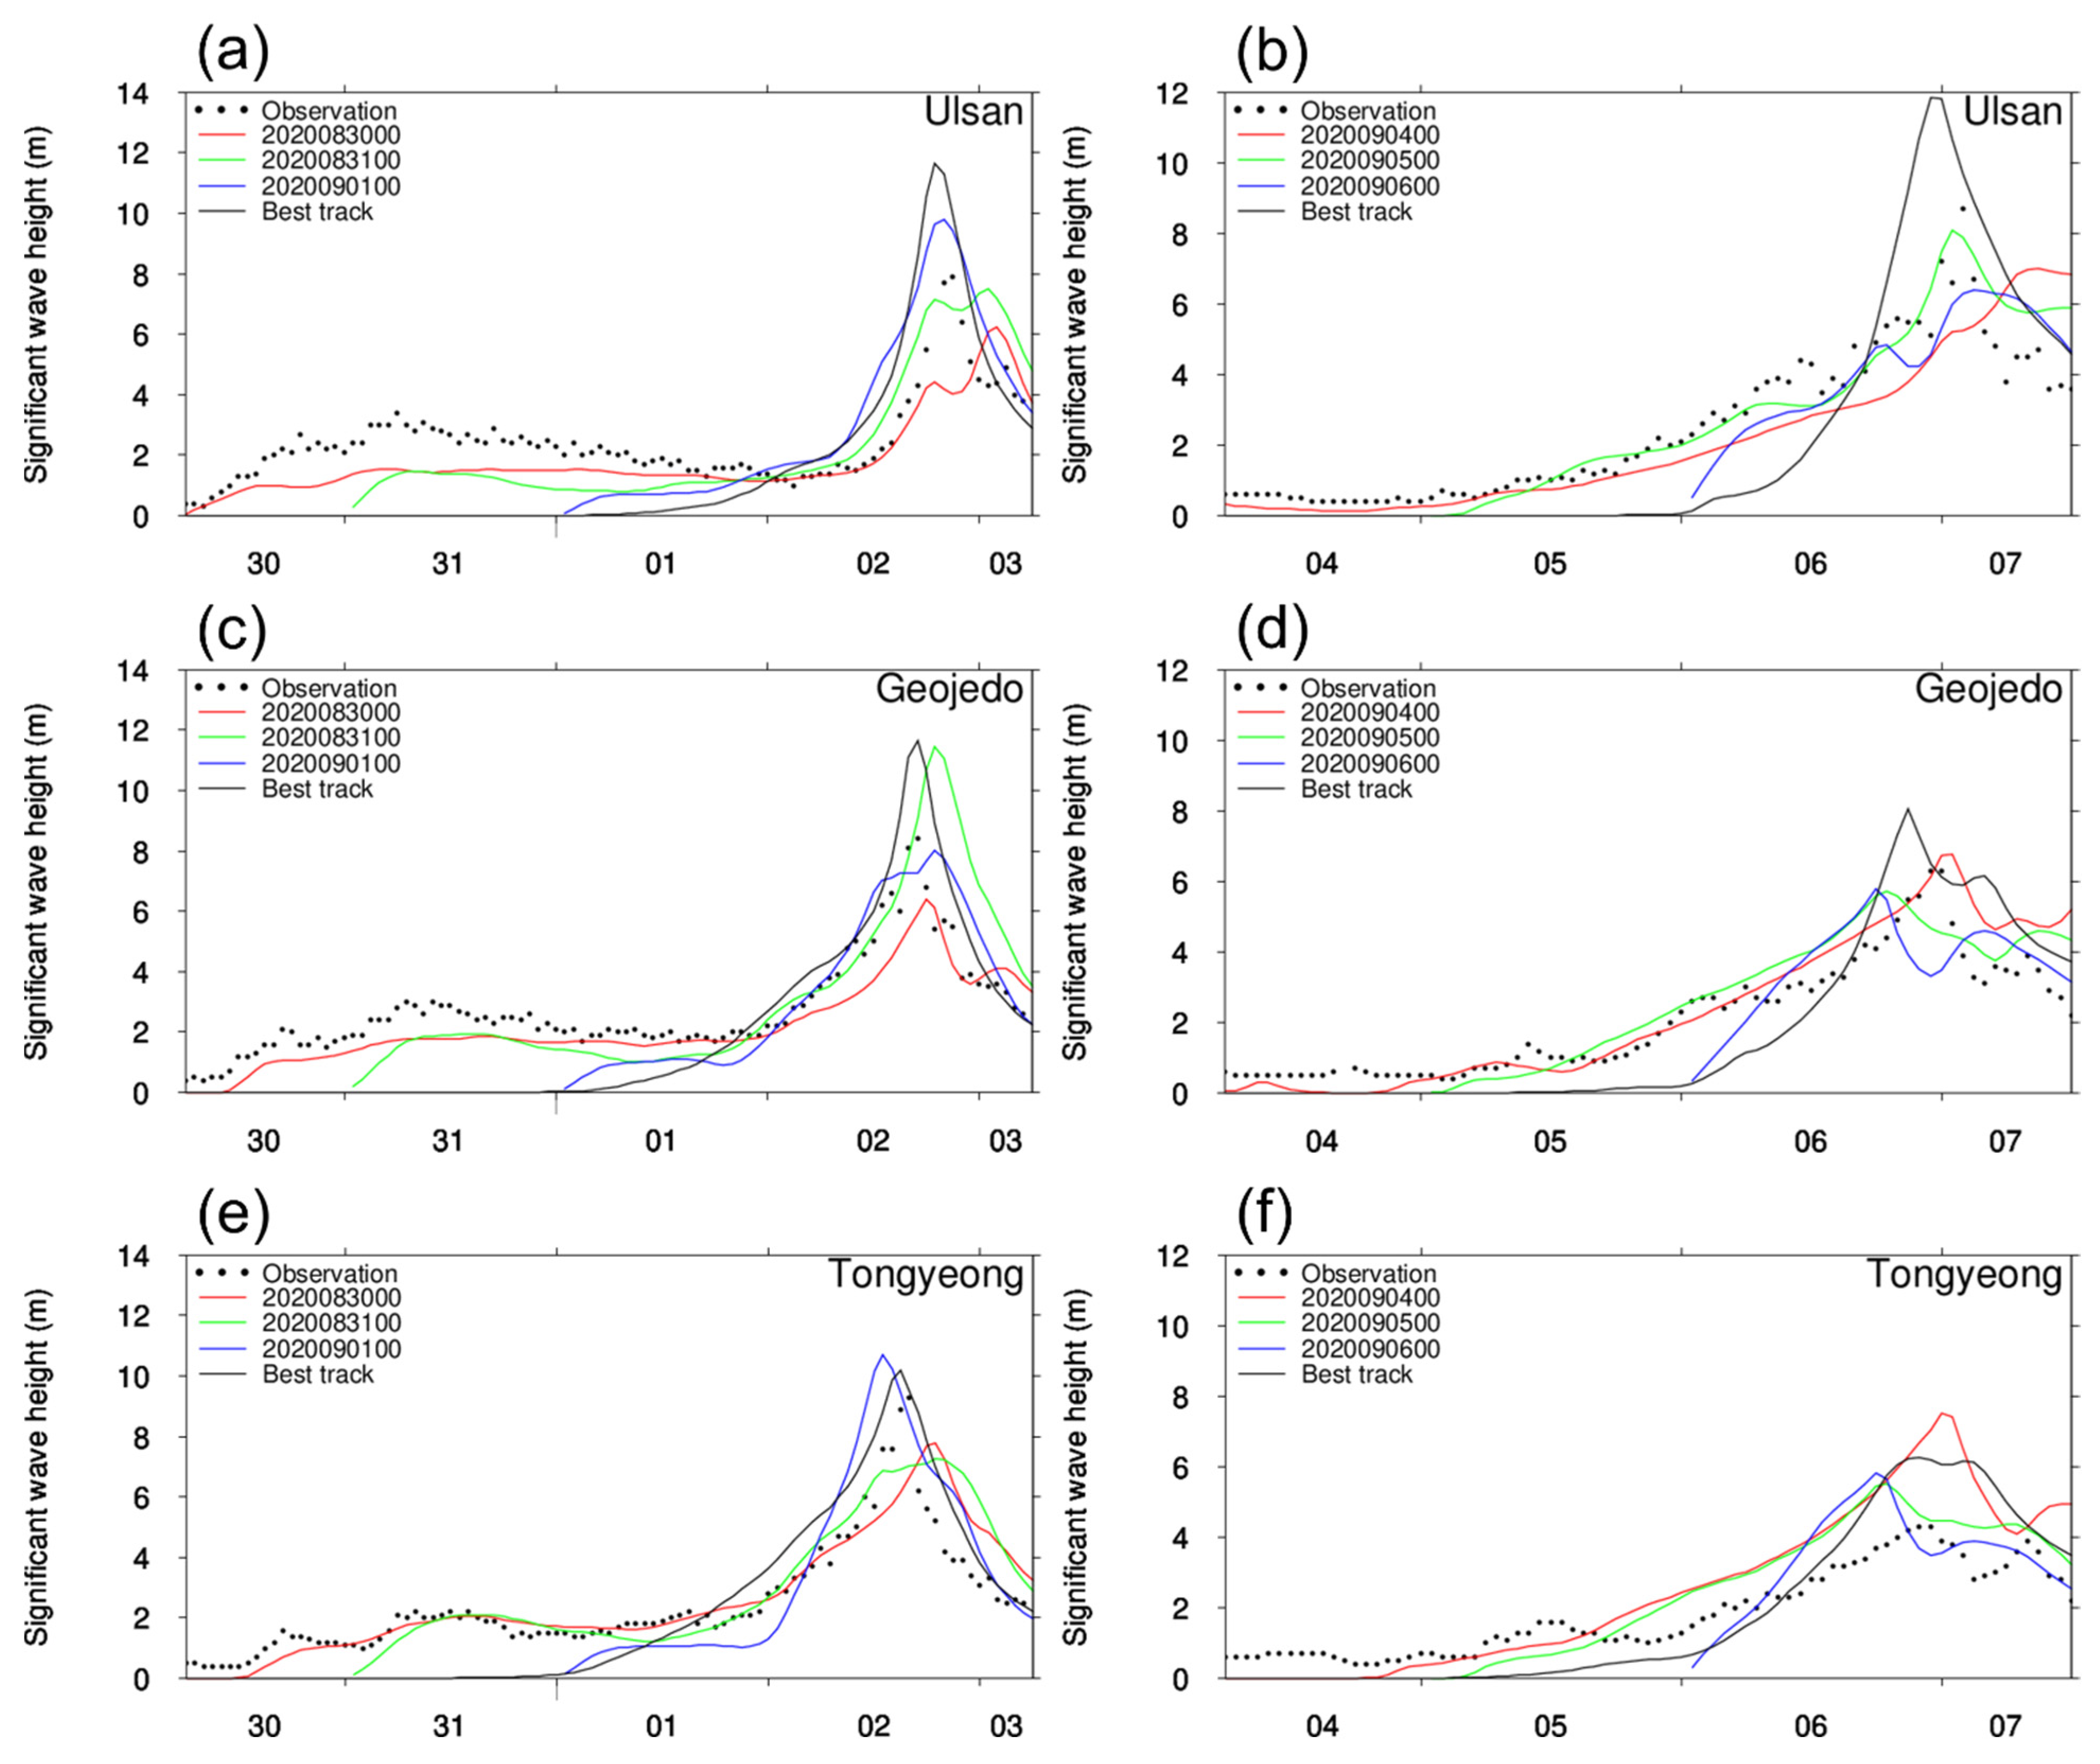
Figure 7 shows a comparison of significant wave heights simulated using ADCIRC+SWAN forced by three MPAS forecast experiments and one hindcast experiment for typhoons Maysak (Figure 7a,c,e) and Haishen (Figure 7b,d,f) at the three wave buoys. Table 3 shows the root mean square error (RMSE) of significant wave heights for each experiment and each wave buoy shown in Figure 7.
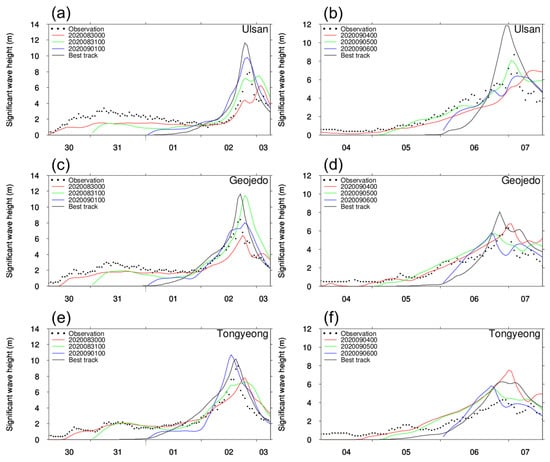
Figure 7.
Comparison of the MPAS forecast and the hindcast with the moored buoy observations (Ulsan, Geojedo, and Tongyeong) of significant wave height for typhoons Maysak (a,c,e) and Haishen (b,d,f). Here, the x-axis indicates the time with the date of the simulation period, and the interval of observation data is one hour.
Table 3.
Root mean square error (m) of significant wave heights from the MPAS forecast and the hindcast experiments for typhoons Maysak and Haishen. The number in parentheses indicates the number of samples. Here, better scores are indicated in bold.
In the prediction results of significant wave heights for the case of typhoon Maysak (Figure 7a,c,e), overall, all MPAS prediction results show similar temporal variations to the observation. In terms of the temporal change (Figure 7a,c,e) and the RMSE (Table 3), even the earliest test with about 4 days before landfall (‘2020083000′) reasonably predicted typhoon-induced waves. With two typhoon cases, we could find that the MPAS forcing needs some spin-up time to adjust such non-linear high-impact weather helping storm surge forecast. On the other hand, the hindcast experiment overestimated the significant wave height at two wave buoys, except for Tongyeong, under the influence of a typhoon. Furthermore, since the hindcast is based on a parametric tropical cyclone model, the meteorological fields have meaningful values within the area of influence of the typhoon. That is, the significant wave height cannot be simulated when the typhoon does not approach (until 00 UTC on 1 September).
Meanwhile, Figure 7b,d,f presents the results of typhoon Haishen. When the typhoon affected the three wave buoys, the hindcast experiment based on the best track was overestimated. On the other hand, for the MPAS based forecast experiments, the forecast ‘2020090500’ (forecast lead time of about 2 days) at the Ulsan buoy and the forecast ‘2020090400’ (forecast lead time of about 3 days) at the Geojedo buoy predicted the peak values well around 00 UTC 7 September. This can also be found in the RMSE results (Table 3). The three MPAS forecast experiments were slightly overestimated at Tongyeong station, and the hindcast also did not show good agreement with the observation. In Table 3, comparing the RMSEs of the forecast experiments and the hindcast experiment for each wave buoy and comparing those for all three wave buoys, it can be said that the wave forecast forced by the MPAS forecast gives reasonable results several days before the typhoon landing.
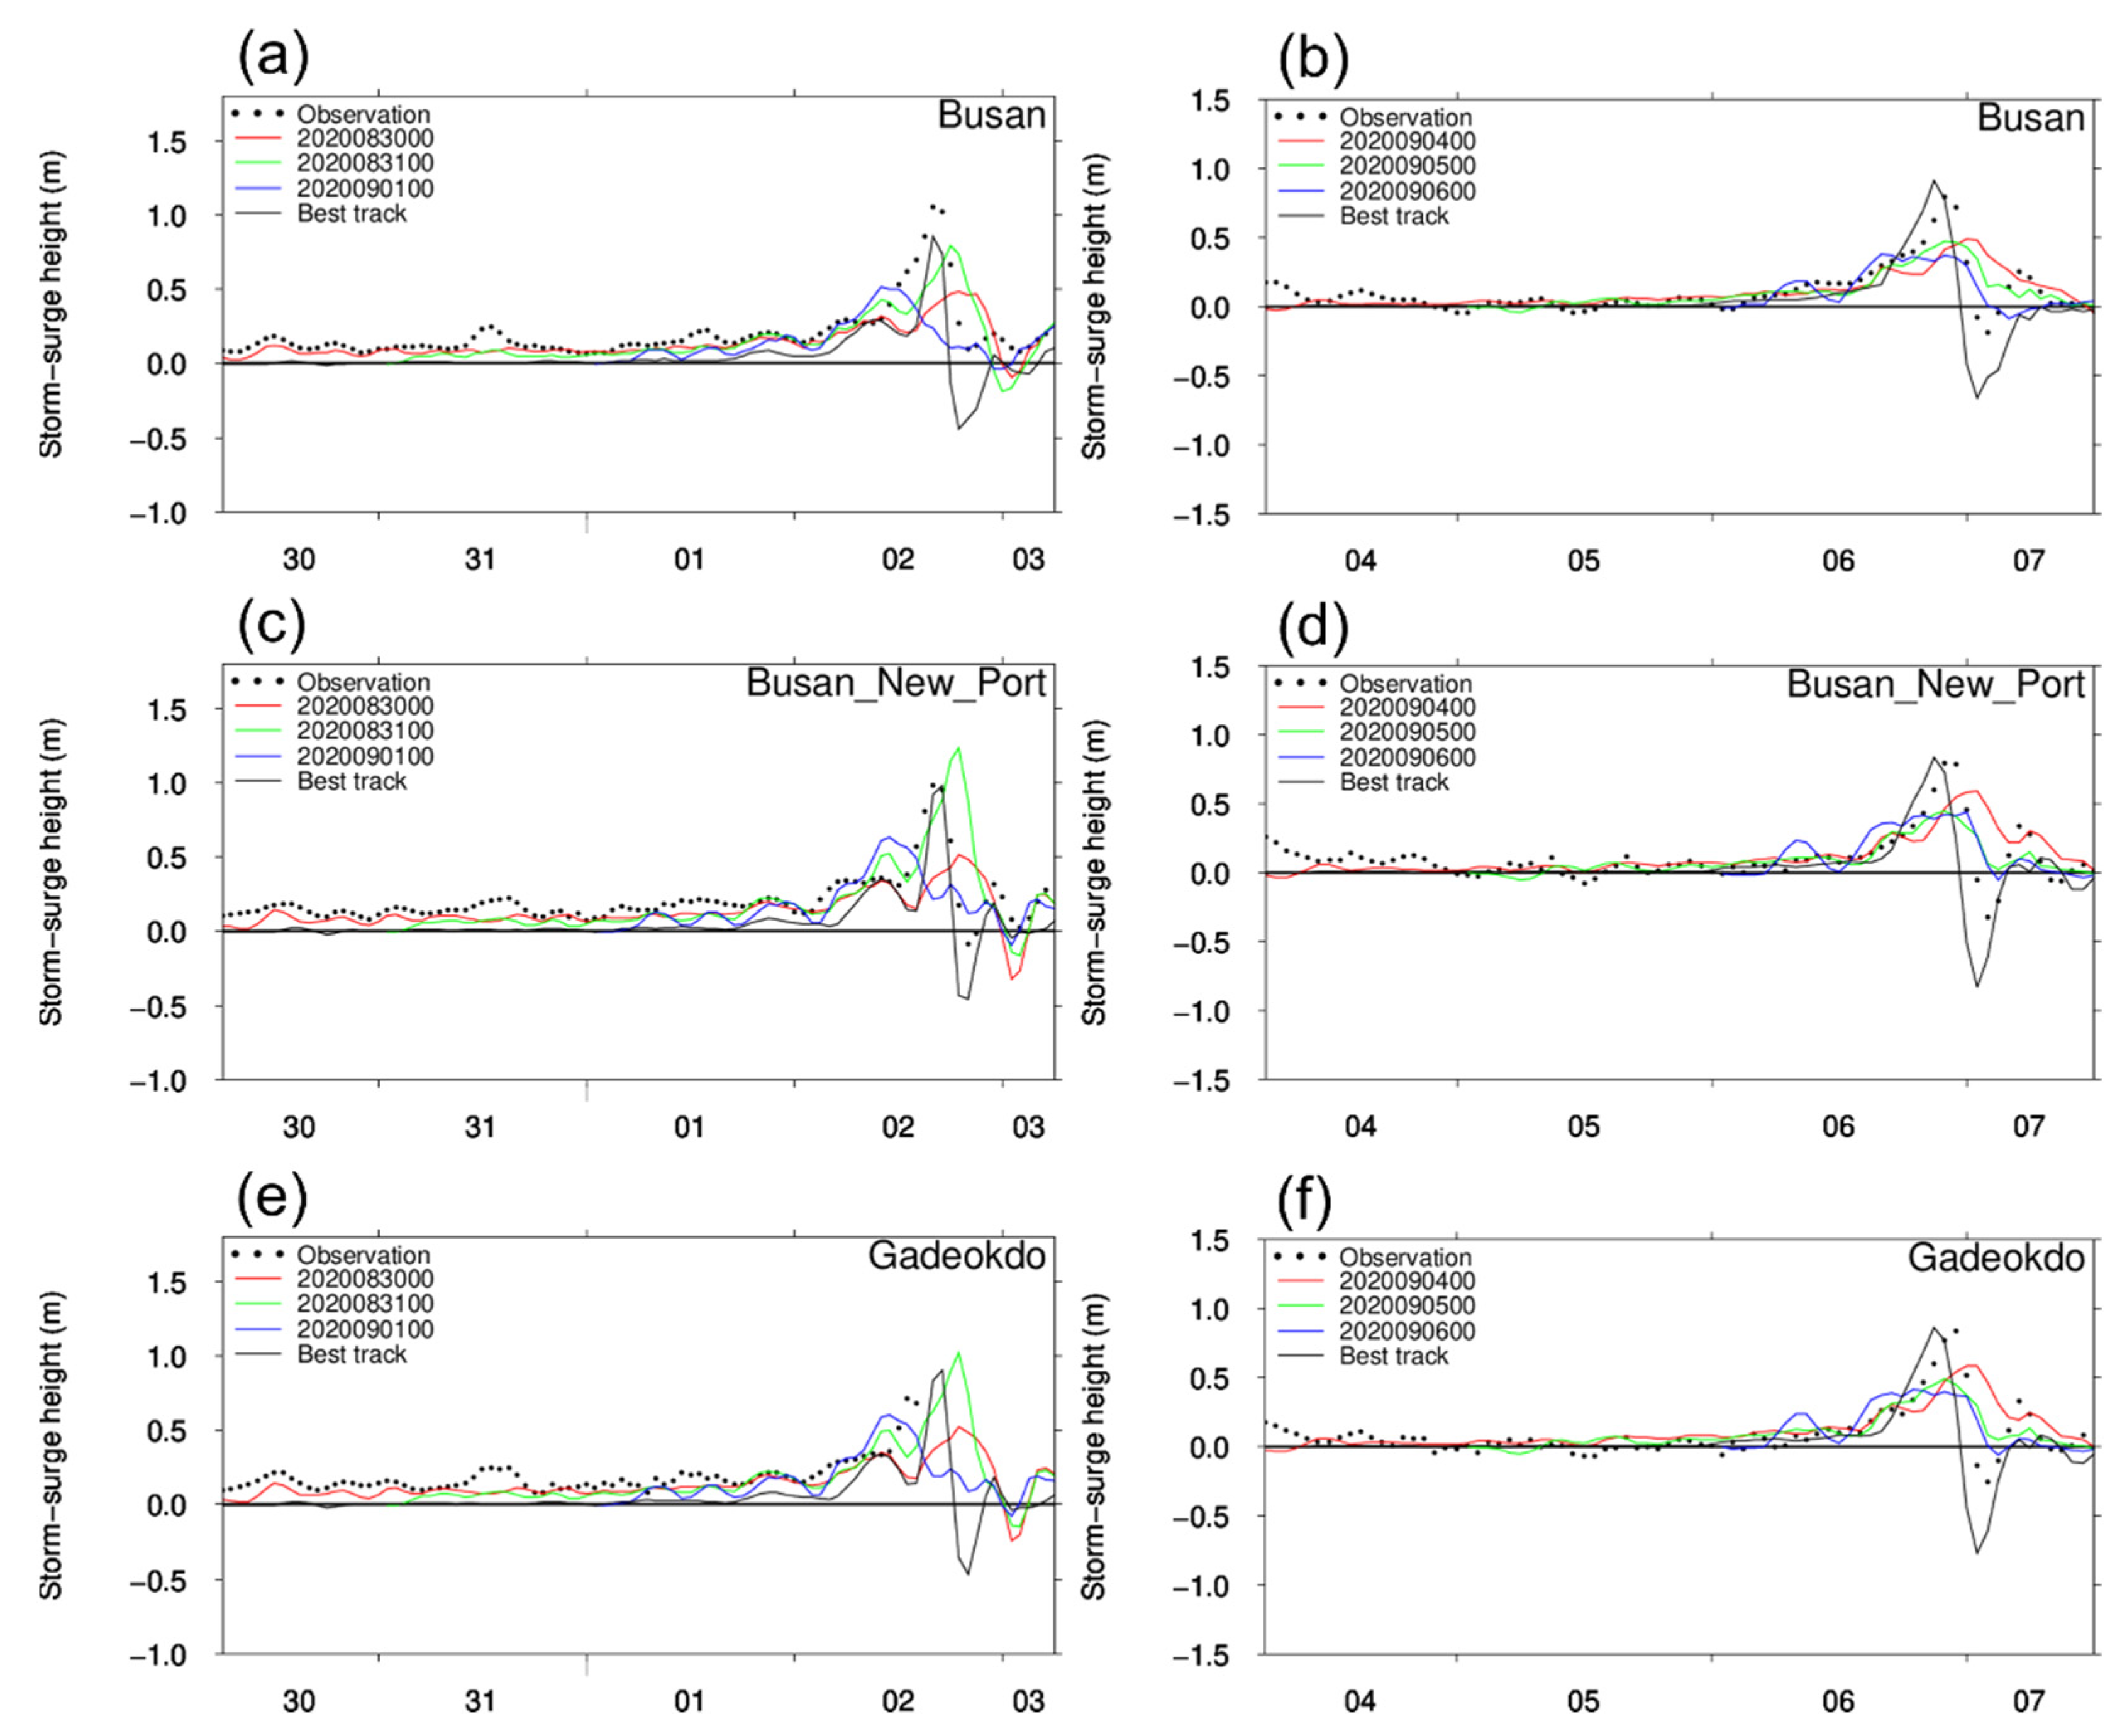
Figure 8 shows the comparison of the three MPAS forecast experiments and one hindcast experiment in terms of storm surge height during typhoons Maysak (Figure 8a,c,e) and Haishen (Figure 8b,d,f) at three tide observation stations. Overall, storm surges were less predictable than waves for the forecast and hindcast results of the two typhoons. Table 4 shows the RMSE of storm surge heights for each experiment and each tide observation station shown in Figure 8. The RMSE comparison results indicate that the MPAS has good prediction performance, even in the earliest case with the forecast lead time of about 4 days (‘2020083000’ for typhoon Maysak).
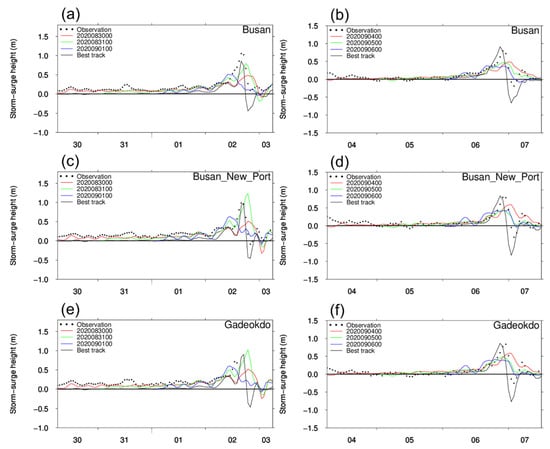
Figure 8.
Comparison of the MPAS forecast and the hindcast with the tide observation stations (Busan, Busan_New_Port, and Gadeokdo) of storm surge height for typhoons Maysak (a,c,e) and Haishen (b,d,f). Here, the x-axis indicates the time with the date of the simulation period, and the interval of observation data is one hour.
Table 4.
Same as Table 3, except for storm surge heights (cm).
These are very promising results of the MPAS forecast if one considers that the hindcast experiment includes best track information, which reflects the observed information the most.
To better understand the model prediction performance, according to Willmott [29] and Kerr et al. [17], we conducted the statistical method as follows: bias, normalized bias (meaning the relative difference, i.e., the difference normalized by observation, with an ideal value of zero), root mean square error (RMSE is a measure of the magnitude of error, with an ideal value of zero), standard deviation, scatter index (SI means the standard deviation normalized by the mean observed value, with an ideal value of zero), and coefficient of determination (R2 is a measure of how well observed outcomes are replicated by the model, with an ideal value of one):
where Oi and Si indicate the observed values and simulated values by the model at time i, respectively. N is the number of data used in the statistical method. We examined how accurately the MPAS predicts by statistically analyzing the hindcast results as well as the MPAS forecast results. Details of statistical analysis results are summarized in Table 5, Table 6, Table 7 and Table 8.
Table 5.
Statistics on significant wave heights from the MPAS forecast and the hindcast experiments for typhoon Maysak. Here, better scores are indicated in bold.
Table 6.
Same as Table 5, except for typhoon Haishen.
Table 7.
Same as Table 5, except for storm surge heights.
Table 8.
Same as Table 7, except for typhoon Haishen.
Table 5 and Table 6 show the statistical indices for the significant wave height induced by typhoon Maysak (Table 5) and Haishen (Table 6) at the three wave buoys. Here, for each typhoon, the combination of three forecast experiment results and one hindcast experiment result were analyzed at three wave buoys. Overall, although R2 was better in the hindcast studies than in the forecast studies, except for Ulsan station for typhoon Maysak, R2 did not show much difference between the hindcast and forecast. Most of the indicators, except for R2, were good in MPAS results. All MPAS forecasts were lower than the hindcasts, especially in the root mean square error (RMSE).
Table 7 and Table 8 show the results of the storm surge height caused by the same typhoons for the same statistical indicators as Table 5 and Table 6 at three tide observation stations. Unlike significant wave heights, the comparison of storm surge heights does not clearly suggest which experiment is better. Both the MPAS forecast and the hindcast experiments show comparable results. This means that the ADCIRC+SWAN forced by MPAS can give a reasonable forecast of storm surges.
For typhoon Maysak, the hindcast run results are better than the forecast at Busan_New_Port station. However, if we neglect R2 at Gadeokdo station, as the difference of R2 between the forecast and hindcast was not significant, it is difficult to determine the superiority and inferiority of the two experiments at Gadeokdo and Busan stations. On the other hand, for typhoon Haishen, the forecast results were better than the hindcast results at all three stations. The forecast results were better in terms of RMSE, whereas the hindcast results were better for R2. However, the difference in R2 between the two models was not very large. Therefore, our forecast results are as accurate as the hindcast using the best track ingested in GAHM. Although it is not fair to compare the forecast with the one-day or longer lead time with the hindcast based on the best track information that can be obtained long after the typhoon event ends, ADCIRC+SWAN forced by MPAS shows promising results.
The disagreements between simulations of ADCIRC+SWAN with MPAS and the observations are likely attributed to the coarse model grid, inaccurate water depth, the misapplication of the bottom friction coefficient, and effects of shallow water depths and imperfect meteorological forcing with the large time interval. Indeed, the MPAS has a 15 km resolution around the Korean Peninsula, and ADCIRC+SWAN has much finer grids over the target area of Busan (Figure 2b). In addition, the time at which the meteorological data were input to the ADCIRC+SWAN model was at 6 h intervals because we let the MPAS print output at 6 h intervals; nevertheless, MPAS provides a reasonable forecast. In particular, the previous study [7] dealing with typhoons that affected the Korean Peninsula in 2019 shows the best estimation for the two-day forecast lead time, and this study also produces reasonable forecast results starting from about two or three days before the typhoon landing.
4. Conclusions
In this study, the applicability of meteorological forcing, from the new-generation weather and climate numerical prediction model MPAS to the storm surge and wave prediction model ADCIRC+SWAN, was examined by comparing simulated waves and storm surges with observed values for typhoons that caused great damage to the south coast of Korea in 2020.
Variables such as surface pressure and wind produced by MPAS were utilized in the integrated tide-surge-wave model, ADCIRC+SWAN. In addition, a hindcast experiment based on the latest technology, GAHM with the best track of JTWC, was also carried out and compared to more accurately determine the prediction ability and applicability of MPAS. The surface pressure and wind obtained from the MPAS forecast were in good agreement with the observations, especially in the earliest forecast cases, which had a forecast lead time of 4 days for typhoon Maysak and about 3 days for typhoon Haishen before landfall.
The significant wave height and storm surge height generated by the output of MPAS and GAHM with the best track for typhoons Maysak and Haishen were simulated using ADCIRC+SWAN and compared by using statistical analysis to assess the role of MPAS as a driving force. In terms of the temporal trends of significant wave height simulated by the three forecasts and one hindcast, overall, the hindcast showed a tendency to overestimate the peak value for the two typhoons. On the other hand, the forecast for typhoon Maysak became more accurate than the hindcast, whereas that for typhoon Haishen gave a comparable result with the hindcast. The forecast was estimated more reasonably than the hindcast test. The results of the statistical analysis on the significant wave height also suggest that the forecast experiments show better accuracy compared to the hindcast. In addition, the forecast experiments with about 2 days preceding landfall, i.e., ‘2020090100’ for typhoon Maysak and ‘2020090500’ for typhoon Haishen, generally showed better simulation results than hindcasts, which is also consistent with the conclusion of the previous study [7].
Regarding the storm surge, it was difficult to determine the prediction performance intuitively and clearly from the figures showing the comparison of the time-series of storm surge height; therefore, we evaluated the predictive ability of the MPAS-forecast model and best track based hindcast model through statistical skill. For typhoon Maysak, the forecast test results were more reasonable at the two tide observation stations, except for Busan_New_Port; for typhoon Haishen, the forecast at all three stations was more reasonable than the hindcast. Therefore, it can be concluded that the MPAS-based forecast can provide us with accurate and reliable meteorological data.
In the earlier studies [7,28,30], MPAS predicted the track of typhoons that occurred in the last three years (2015–2017) in the Northwest Pacific more accurately than other forecasting agencies, such as KMA, JTWC, and JMA. In addition, typhoon track information in ATCF format was produced from MPAS. Therefore, in further studies, we will attempt to more accurately predict storm surges and waves on the south coast of Korea using the combination of the typhoon track information in the ATCF format of MPAS taken in GAHM and the meteorological fields produced from MPAS.
Author Contributions
Conceptualization, J.-H.Y.; methodology, J.-H.Y., J.-S.K. and H.M.; software, H.M.; validation, J.-H.Y.; formal analysis, J.-H.Y.; investigation, J.-H.Y., J.-S.K. and H.M.; resources, J.-H.Y. and J.-S.K.; data curation, J.-H.Y. and J.-S.K.; writing—original draft preparation, J.-H.Y.; writing—review and editing, J.-H.Y. and J.-S.K.; visualization, J.-H.Y. and J.-S.K.; supervision, J.-H.Y.; project administration, J.-H.Y.; funding acquisition, J.-H.Y. All authors have read and agreed to the published version of the manuscript.
Funding
This research was conducted with the support of the Data-Driven Solutions (DDS) Convergence Research Program funded by the National Research Council of Science and Technology ‘Development of solutions for region issues based on public data using AI technology—Focused on the actual proof research for realizing safe and reliable society’ (1711101951).
Institutional Review Board Statement
Not applicable.
Informed Consent Statement
Not applicable.
Data Availability Statement
Not applicable.
Acknowledgments
This work was made possible by the support of the National Supercomputing Center at KISTI. We appreciate two anonymous reviewers for their efforts to improve this manuscript.
Conflicts of Interest
The authors declare no conflict of interest.
References
- Knutson, T.R.; Chung, M.V.; Vecchi, G.; Sun, J.; Hsieh, T.L.; Smith, A.J.P. Science Brief Review: Climate change is probably increasing the intensity of tropical cyclones. In Critical Issues in Climate Change Science; Le Quéré, C., Liss, P., Forster, P., Eds.; Science Briefs: London, UK, 2021. [Google Scholar] [CrossRef]
- Na, H.; Jung, W.-S. Autumn typhoon affecting the Korean Peninsula—Past and present characteristics. J. Korean Soc. Atmos. Environ. 2020, 36, 482–491. (In Korean) [Google Scholar] [CrossRef]
- Yoon, S.B.; Jeong, W.M.; Joh, M.W.; Ryu, K.H. Analysis of reliability of weather fields for typhoon Maemi (0314). J. Korean Soc. Coast. Ocean Eng. 2020, 32, 351–362. (In Korean) [Google Scholar] [CrossRef]
- Ministry of Ocean and Fisheries. Report on the Estimation of Deep Water Design Waves of Korea; Ministry of Ocean and Fisheries: Seoul, Korea, 2019; pp. 117–149. (In Korean)
- Skamarock, W.C.; Klemp, J.B.; Duda, M.G.; Fowler, L.D.; Park, S.H.; Ringler, T.D. A multiscale nonhydrostatic atmospheric model using centroidal Voronoi tesselations and C-grid staggering. Mon. Weather Rev. 2012, 140, 3090–3105. [Google Scholar] [CrossRef] [Green Version]
- Yuk, J.-H.; Joh, M. Prediction of typhoon-induced storm surge, waves and coastal inundation in the Suyeong River Area, South Korea: A case study during typhoon Chaba. J. Coast. Res. 2019, SI91, 156–160. [Google Scholar] [CrossRef]
- Kang, J.-S.; Myung, H.; Yuk, J.-H. Examination of computational performance and potential applications of a global numerical weather prediction model MPAS using KISTI Supercomputer NURION. J. Mar. Sci. Eng. 2021, 9, 1147. [Google Scholar] [CrossRef]
- Luettich, R.A.; Westerink, J.J.; Scheffner, N.W. ADCIRC: An Advanced Three-Dimensional Circulation Model for Shelves, Coasts, and Estuaries—Report 1, Theory and Methodology of ADCIRC-2DD1 and ADCIRC-3DL; Coastal Engineering Research Center U.S.: Vicksburg, MS, USA, 1992. [Google Scholar]
- Westerink, J.J.; Luettich Jr, R.A.; Blain, C.A.; Scheffner, N.W. Adcirc: An Advanced Three-Dimensional Circulation Model for Shelves, Coasts, and Estuaries—Report 2 User’s Manual for Adcirc-2ddi; (No. WES/TR/DRP-92-6-2); Army Engineer Waterways Experiment Station: Vicksburg, MS, USA, 1994. [Google Scholar]
- Booij, N.R.R.C.; Ris, R.C.; Holthuijsen, L.H. A third-generation wave model for coastal regions: 1. Model description and validation. J. Geophys. Res. Ocean 1999, 104, 7649–7666. [Google Scholar] [CrossRef] [Green Version]
- Ris, R.C.; Holthuijsen, L.H.; Booij, N. A third-generation wave model for coastal regions: 2. Verification. J. Geophys. Res. Ocean 1999, 104, 7667–7681. [Google Scholar] [CrossRef]
- Dietrich, J.C.; Zijlema, M.; Westerink, J.J.; Holthuijsen, L.H.; Dawson, C.; Luettich, R.A., Jr.; Jensen, R.E.; Smith, J.M.; Stelling, G.S.; Stone, G.W. Modeling hurricane waves and storm surge using integrally-coupled, scalable computations. Coast. Eng. 2011, 58, 45–65. [Google Scholar] [CrossRef]
- Longuet-Higgins, M.S.; Stewart, R.W. Radiation stresses in water waves; a physical discussions, with applications. Deep Sea Res. Oceanogr. 1964, 11, 529–562. [Google Scholar] [CrossRef]
- Choi, B.H.; Min, B.I.; Kim, K.O.; Yuk, J.-H. Wave-tide-surge coupled simulation for typhoon Maemi. China Ocean Eng. 2013, 27, 141–158. [Google Scholar] [CrossRef]
- Choi, B.H.; Kim, K.O.; Yuk, J.-H.; Lee, H.S. Simulation of the 1953 storm surge in the North Sea. Ocean Dyn. 2018, 68, 1759–1777. [Google Scholar]
- Hope, M.E.; Westerink, J.J.; Kennedy, A.B.; Kerr, P.C.; Dietrich, J.C.; Dawson, C.; Bender, C.J.; Smith, J.M.; Jensen, R.E.; Zijlema, M.; et al. Hindcast and validation of Hurricane Ike (2008) waves, forerunner, and storm surge. J. Geogr. Res. Ocean 2013, 118, 4424–4460. [Google Scholar] [CrossRef] [Green Version]
- Kerr, P.C.; Donahue, A.S.; Westerink, J.J.; Luettich, R.A.; Zheng, L.Y.; Weisberg, R.H.; Huang, Y.; Wang, H.V.; Teng, Y.; Forrest, D.R.; et al. U.S. IOOS coastal and ocean modeling testbed: Inter-model evaluation of tides, waves, and hurricane surge in the Gulf of Mexico. J. Geophys. Res. Ocean 2013, 118, 5129–5172. [Google Scholar] [CrossRef] [Green Version]
- Lee, H.-Y.; Suh, S.-W. Application of EurOtop to improve simulations of coastal inundations due to wave overtopping. J. Coast. Res. 2016, SI75, 1377–1381. [Google Scholar] [CrossRef]
- Xie, D.; Zou, Q.; Cannon, J.W. Application of SWAN+ADCIRC to tide-surge and wave simulation in Gulf of Maine during Patriot’s Day storm. Water Sci. Eng. 2016, 9, 33–41. [Google Scholar] [CrossRef] [Green Version]
- Yuk, J.H.; Kim, K.O.; Choi, B.H. The simulation of a storm surge and wave due to typhoon Sarah using an integrally coupled tide-surge-wave model of the Yellow and East China Seas. Ocean Sci. J. 2015, 50, 683–699. [Google Scholar] [CrossRef]
- Egbert, G.; Ray, R. Semi-diurnal and diurnal tidal dissipation from TOPEXP/OSEIDON altimetry. Geophys. Res. Lett. 2003, 30, 1907. [Google Scholar] [CrossRef]
- Holland, G.J. An Analytic model of the wind and pressure profiles in hurricanes. Mon. Weather Rev. 1980, 108, 1212–1218. [Google Scholar] [CrossRef]
- Skamarock, W.C.; Park, S.-H.; Klemp, J.B.; Snyder, C. Atmospheric kinetic energy spectra from global high-resolution nonhydrostatic simulations. J. Atmos. Sci. 2014, 71, 4369–4381. [Google Scholar] [CrossRef]
- Park, S.-H.; Klemp, J.B.; Skamarock, W.C. A comparison of mesh refinement in the global MPAS-A and WRF models using an idealized normal-mode baroclinic wave simulation. Mon. Weather Rev. 2014, 142, 3614–3634. [Google Scholar] [CrossRef]
- National Centers for Environmental Prediction/National Weather Service/NOAA/U.S. NCEP GDAS/FNL 0.25 Degree Global Tropospheric Analyses and Forecast Grids; Department of Commerce: Boulder, CO, USA, 2015. [Google Scholar]
- Gao, J.; Luettich, R.; Fleming, J. Development and Initial Evaluation of a Generalized Asymmetric Tropical Cyclone Vortex Model in ADCIRC; ADCIRC users group meeting; US Army Corps of Engineers: Vicksburg, MS, USA, 2013.
- Musinguzi, A.; Akbar, M.K.; Fleming, J.G.; Hargrove, S.K. Understanding hurricane storm surge generation and propagation using a forecasting model, forecast advisories and best track in a wind model, and observed data—Case study Hurricane Rita. J. Mar. Sci. Eng. 2019, 7, 77. [Google Scholar] [CrossRef] [Green Version]
- Kang, J.-S.; Yuk, J.-H.; Joh, M. Performance of K-MPAS on typhoon track prediction with variable resolution grids focusing on Western Pacific Basin. J. Supercomput. Inf. 2017, 5, 5–11. [Google Scholar]
- Willmott, C.J. Some comments on the evaluation of model performance. Bull. Am. Meteorol. Soc. 1982, 63, 1309–1313. [Google Scholar] [CrossRef] [Green Version]
- Joh, M.; Yuk, J.-H.; Kang, J.S. Introduction of K-MPAS and verification of its typhoon track prediction. In Proceedings of the 15th Annual Meeting Asia Oceania Geosciences Society, Honolulu, HI, USA, 3–8 June 2018. [Google Scholar]

Publisher’s Note: MDPI stays neutral with regard to jurisdictional claims in published maps and institutional affiliations. |
© 2022 by the authors. Licensee MDPI, Basel, Switzerland. This article is an open access article distributed under the terms and conditions of the Creative Commons Attribution (CC BY) license (https://creativecommons.org/licenses/by/4.0/).