Article

The Use of the Novel Optical Method SEZO AM (WiRan Ltd.) for Measurements of Particulate Matter (PM10–2.5) in Port Areas-Case Study for Port of Gdynia (Poland)

1
Institute of Oceanography, University of Gdansk, Al. Marszałka J. Piłsudskiego 46, 81-378 Gdynia, Poland
2
WiRan Ltd., Al. Zwycięstwa 96/98, 81-451 Gdynia, Poland
3
ARMAAG (Regional Atmosphere Monitoring Agency in the Tricity Agglomeration), Brzozowa 15, 80-243 Gdańsk, Poland
*
Author to whom correspondence should be addressed.
Atmosphere 2022, 13(4), 590; https://doi.org/10.3390/atmos13040590
Submission received: 7 March 2022 / Revised: 1 April 2022 / Accepted: 4 April 2022 / Published: 6 April 2022

Abstract

:
From 1 March to 30 April and from 1 August to 30 September 2021, comparative studies of PM2.5 and PM10 concentrations were carried out in Gdynia. For intercalibration, a device was used that operates based on non-reference methodologies and without proven equivalence to the reference methodology (SEZO AM, WIRAN), and an EDM 180 analyzer (GRIMM) with certificates and approvals (US-EPA, UK-MCERTS, CN-CMA) was used. The aim of this research is to determine whether the SEZO AM device could be used in port areas for continuous PM2.5 and PM10 concentrations measurements. Two campaigns of two months allowed us to see a good agreement of the results achieved with both methods. The concordance of the results obtained from the SEZO AM and the EDM 180 methods amounted to between 78% and 94% for the PM2.5 and between 70% and 75% for the PM10. The comparison of two SEZO AM devices to a higher-class TSI OPS3330 reference in a measurement dust chamber showed a fit between 79% and 86% for the PM2.5 and between 81% and 86% for the PM10. This indicates the possibility of using this analyzer to measure the concentrations of PM2.5 and PM10 in the port atmosphere in which they were carried out. The preliminary analysis of meteorological parameters shows that the main potential impact on the concentration of the analyzed dust fractions measured by the SEZO AM method was relative humidity. The determination of the correction factor for the PM2.5 and PM10 concentrations and adding an inlet external cover contributed to a two-fold reduction in the analysis error and good concordance of the results, at a level of 93% for PM2.5 and 91% for PM10, without discarding any data.
Keywords:
PM10; PM2.5; Port Gdynia

1. Introduction

Sea transport, while contributing to the social and economic development of coastal areas, is also an environmental burden. The expansion of world trade and the resulting increase in demand for maritime transport services makes them one of the leading emitters of anthropogenic atmospheric pollutants [1]. The assessment of the degree of air pollution in ports requires considering many emission sources. In addition to the role of sea ships, one should take into account everyday activities related to, for example, the reloading of goods or trucks or trains used for their transport. Activities such as sandblasting and the painting of ships, which usually take place in the open air, are also important factors for the deterioration of air quality in port areas and their surroundings. This results in the release of toxic and hazardous substances, such as heavy metals (e.g., lead, arsenic, cadmium, nickel), polycyclic aromatic hydrocarbons (PAHs), or dioxins [2,3]. It has been estimated that the vast majority of the world’s fleet spends an average of 20% of their time at sea and the remaining 80% in or in the vicinity of a port. Research using data on geographical marine activity has shown that 70 to 80% of pollution from ships occurs within 400 km from land [4]. This leads not only to the deterioration of air quality in port areas and their surroundings, but also has a negative impact on sea water and soil, as well as rivers and lakes located in these areas [5].
The problem of air pollution in port areas may also be related to the use of poor-quality fuel. Generally, 50% of the operating costs in ports are oil costs. This is why many of the world’s ship operators use or have until recently used degraded heavy oils with a high content of asphalt, sulphur compounds, and carbon residues. Combustion of such fuel in marine diesel engines and boilers leads to the emission of significant amounts of particulate matter (PMx) and smoke, nitrogen oxides (NOx), sulphur oxides (SOx), carbon monoxide (CO), and carbon dioxide (CO2), as well as polycyclic hydrocarbons aromatics (PAHs) [6]. The release of these pollutants into the atmosphere can result in acid rainfall, an enhancement of the greenhouse effect and climate change. In addition to carbon dioxide, aerosols play an important role in shaping the climate [7]. A considerable proportion of aerosols consist of non-organic compounds such as sulphates, nitrates, chlorides, sodium, and ammonium ions. Aerosols rich in ammonium salts are known for their properties of reflecting and dispersing solar radiation in the atmosphere. This phenomenon has an influence on climate by the cooling down the air temperature. Similar, although even more important for cooling the climate, is organic carbon in aerosols. This is due to the fact that organic carbon may constitute up to 50–70% of the aerosols’ mass [8,9,10,11]). On the other hand, aerosol enrichment with elemental carbon, which, as with greenhouse gases, has the ability to absorb radiation and can have a warming effect on the climate [12]. In port regions, organic carbon from primary sources is the product of fossil fuel burning. Secondary organic carbon in the atmosphere results from the conversion of gasses into particles, the condensation of volatile organic compounds (VOCs), and physical or chemical adsorption [13,14]. Elemental carbon (EC) emitted from ships is a product of the incomplete combustion of biofuels and fossil fuels. It is seen as a direct indicator of atmospheric pollution by transportation, including marine [15]. The chemical composition of aerosols in the coastal zone of the Gulf of Gdansk (Baltic) shaped under different meteorological conditions originated from local, regional, and distance sources; this was described by Lewandowska et al. [16].
Pollutants emitted from ships also contribute to the deterioration of air quality and poses a direct threat to human health [17]. Particulate matter (PM) is emitted in ports and shipyards due to anthropogenic activity. PM is is most often classified as particles with a diameter of up to 10 µm (PM10), up to 2.5 µm (PM2.5), and up to 1 µm (PM1). These particles can be transported long distances from the source. Particularly dangerous for human health are small particles < 2.5 μm in diameter, which can penetrate deep into the lungs and be transported directly into the bloodstream [18]. Particulate matter may contain substances hazardous to human health and other living organisms. Health effects depend on the duration of the exposure to high concentrations of particles. Short-term exposure causes a rapid reaction, including cough, asthma attacks, and decreased lung function. Longer exposure leads to diseases such as asthma, chronic obstructive pulmonary disease (COPD), chronic bronchitis, emphysema, and even cancer [19]. The International Agency for Research on Cancer (IARC) has concluded that there is sufficient and compelling evidence that human exposure to air pollutants, especially those characterized by high concentrations of particulate matter, can lead to lung cancer. For this reason, particulate matter was included in the first risk group [20,21].
In recent years, a subject of scientific research has been the emission of particulate matter from ships and port activities that leads to a deterioration of the quality of human life [22,23,24,25,26]. It has been estimated that as a consequence of international ship traffic on the seas and oceans and the resulting PMx emissions, at the beginning of the 21st century, an average of 60,000 people per year died worldwide [27,28]. A number of measures have been taken over the years to reduce air pollution caused by maritime transport. The international shipping and port industry more and more often uses technologically modern marine engines and better-quality fuels [29]. Some of these changes resulted from the guidelines of the International Maritime Organization (IMO). Since the 1973 International Convention for the Prevention of Pollution from Ships (MARPOL), many efforts have been made to improve air quality. [30]. Given shipping’s significant contribution to global sulphur inventories (estimated to be 13% of total SOx emissions annually) [31], the IMO proposed new global standards to limit the sulphur in fuel oil to 0.5% as of 1 January 2020, from the previous limit of 3.5% [32]. In addition, it selected SOx Emission Control Areas (SECA), for which the limits of sulphur content in the fuel are more stringent. Such regions include, inter alia, the Baltic Sea. In 2007, the IMO additionally adopted regulations implementing the Energy Efficiency Design Index (EEDI) for new ships and vessels, which sets out the standards and technical norms imposed on shipyards. This is to reduce CO2 emissions by around 25–35% by 2030. Currently, shipping is responsible for around 3% of global anthropogenic CO2 emissions. In the light of IMO data, this emission would increase by 150–250% by 2050 if new regulations were not adopted [33,34]. With regard to air pollution by particulate matter, the most important findings were made in 2008, when Directive 2008/50/EC of the European Parliament and of the Council on ambient air quality and cleaner air for Europe (CAFÉ-PE Directive) [35] entered into force. It established the maximum allowable annual average concentration of PM10 dust in the air at 40 µg/m3, and the daily average at 50 µg/m3. Within a year, a maximum of 35 days may occur with the daily average being exceeded. For PM2.5, the CAFE Directive has established a standard for the average annual concentration, which is 25 µg/m3. In the case of particulate matter, there is no health-safe threshold below which no negative health effects are observed (www.who.int, accessed on 30 January 2022). Probably for this reason, in 2021, the World Health Organization lowered the normative values of permissible concentrations of suspended dust. In the case of PM10, the annual permissible concentration should not be higher than 15, and the concentration of PM2.5 should not be higher than 5 µg/m3 (in 2005, it was 20 µg/m3 and 10 µg/m3, respectively, for PM10 and PM2.5). On the other hand, the permissible daily concentration of PM10 was reduced from 50 (in 2005) to 45 µg/m3, and PM2.5 from 25 µg/m3 (2005) to 15 (2021).
Despite the introduced standards and restrictions, there is still a problem with air quality and its negative impact on human health in the world. However, according to Sofiev and co-authors (2018), cleaner marine fuels can reduce ship-related premature mortality and morbidity by 34 and 54%, respectively, representing a ~2.6% global reduction in PM2.5 cardiovascular and lung cancer deaths and a ~3.6% global reduction in childhood asthma. Despite these reductions, low-sulphur marine fuels will still account for ~250k deaths and ~6.4 M childhood asthma cases annually, and more stringent standards beyond 2020 may provide additional health benefits. Lower sulphur fuels will probably also reduce radiative cooling from ship aerosols by ~80%, equating to a ~3% increase in current estimates of total anthropogenic forcing. Therefore, stronger international shipping policies may need to achieve climate and health targets by jointly reducing greenhouse gases and air pollution. To achieve this, there is a need to conduct large-scale measurements at sea and in port areas using simple, cheap, and, at the same time, reliable methods that do not require the constant presence of the operator of the device. The aim of this research is to determine whether the newly designed SEZO AM device can be used in port areas for the continuous measurement of PM2.5 and PM10 concentrations. To estimate and later eliminate the measurement error for particulate matter concentrations for the 4 months of intercalibration with the EDM 180 analyser (GRIMM) with the certificates and approvals of US-EPA, UK-MCERTS, and CN-CMA was carried out. Distributed sensor networks are widely used in the world. The purpose of this publication, apart from that indicated above, was to determine to what extent results obtained with the use of SEZO AM are reliable in relation to the reference analysers. Such an approach will enable the correct interpretation of data from the sensor network, as well as the elimination of data from daily air quality monitoring that have not been intercalibrated with the reference methods.

2. Materials and Methods

Pilot measurements of the concentrations of suspended dust PM2.5 and PM10 in the atmospheric air were carried out in the area of the Port of Gdynia in the period from 1 March to 30 April and from 1 August to 30 September 2021. The AM4 station, belonging to the Foundation Agency for Regional Atmosphere Monitoring of the Gdańsk Agglomeration (ARMAAG-www.armaag.gda.pl, accessed on 5 April 2022), was selected as the measuring point. It is located in Gdynia Pogórze (φ: 18°29′36″ E; λ: 54°33′39″ N, 70 m a.s.l.), in the immediate vicinity of the Port of Gdynia (Figure 1).
The port and shipbuilding industry of the Tricity Agglomeration is one of the most dynamically developing in the South Baltic region (https://investinpomerania.pl/kluczowe-sektory/sektor-morsk; accessed on 15 January 2022). The main port and shipbuilding center in Gdynia, established in 1923 [36], is located in the northern part of the Pomeranian Voivodeship, in the eastern part of Gdynia (Figure 1). Currently, the port ranks 4th in the Baltic Sea in terms of the volume of transhipment of containers, and it records an increase in turnover every year [37]. Currently, the concept of expanding the port and creating the Outer Port has been developed, the construction of which is to begin in the coming years. There are two container terminals, a grain terminal, two bulk terminals, a general cargo, fuel, and gas terminal, as well as shipyard areas and a Navy area operating within the port’s boundaries. There are also various types of enterprises operating within the port, classified as major industries (e.g., electromechanical, metallurgical, furniture, chemical, fuel, and energy) [38].
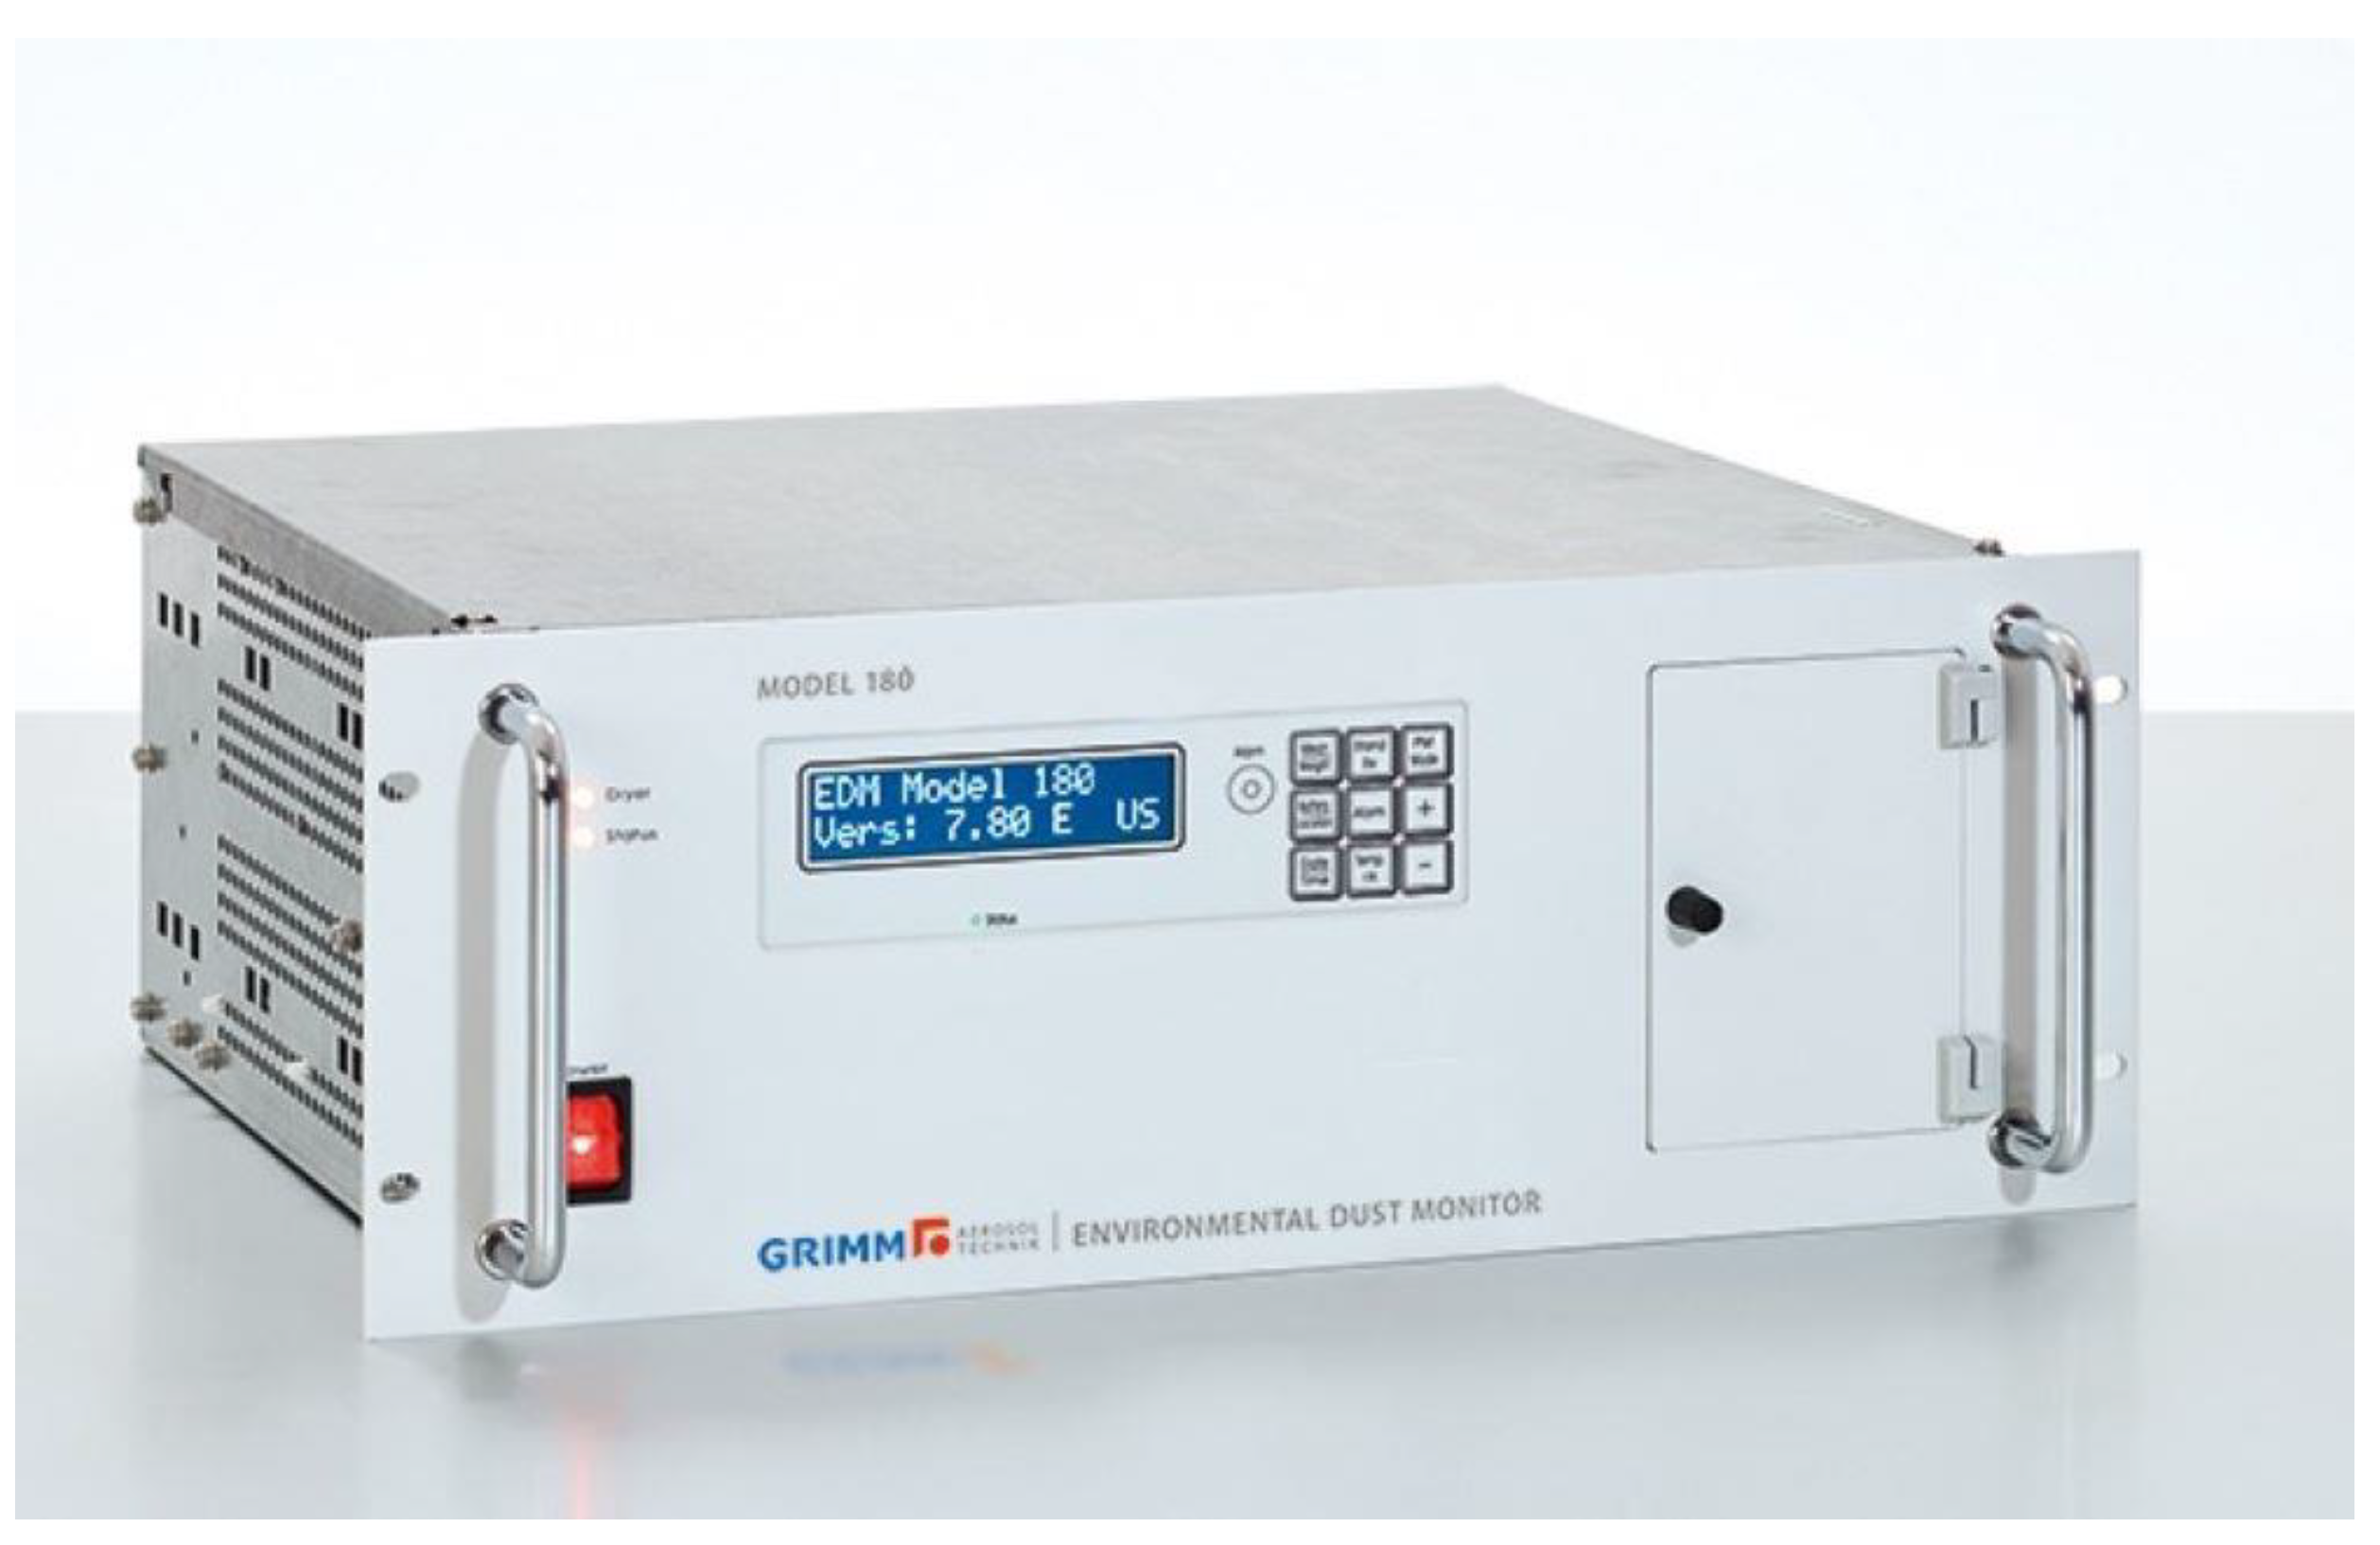
Measurements were carried out with the use of two analysers. The first one is GRIMM’s reference particulate matter analyser, model EDM 180 (Figure 2). It has been installed at the AM4 measuring station since 1997. The analyser is a stationary unit for the continuous measurement of aerosols in the air. The system measures particulate matter simultaneously in 31 size channels. The resolution was fixed at 0.1 µg/m3. Measurement results are reported for different size distribution channels. The Series 180 analyser uses a light radiation scattering technique to count individual particles. A semiconductor laser is used as the light source. The scattered signal from the particle passing through the laser beam is picked up at an angle of about 90° by the mirror and transferred to the diode-receiver. The signal from the diode, after appropriate amplification, passes through a multi-channel size classifier. The Pulse Size Analyzer then classifies the signal transmitted on each of the channels. The data are displayed on the device and also stored on the memory card. They can also be sent for further analysis. The instrument also has an internal memory of 80 KB for data storage. The analyser operates in the temperature range of −20 to +50 °C [39,40].
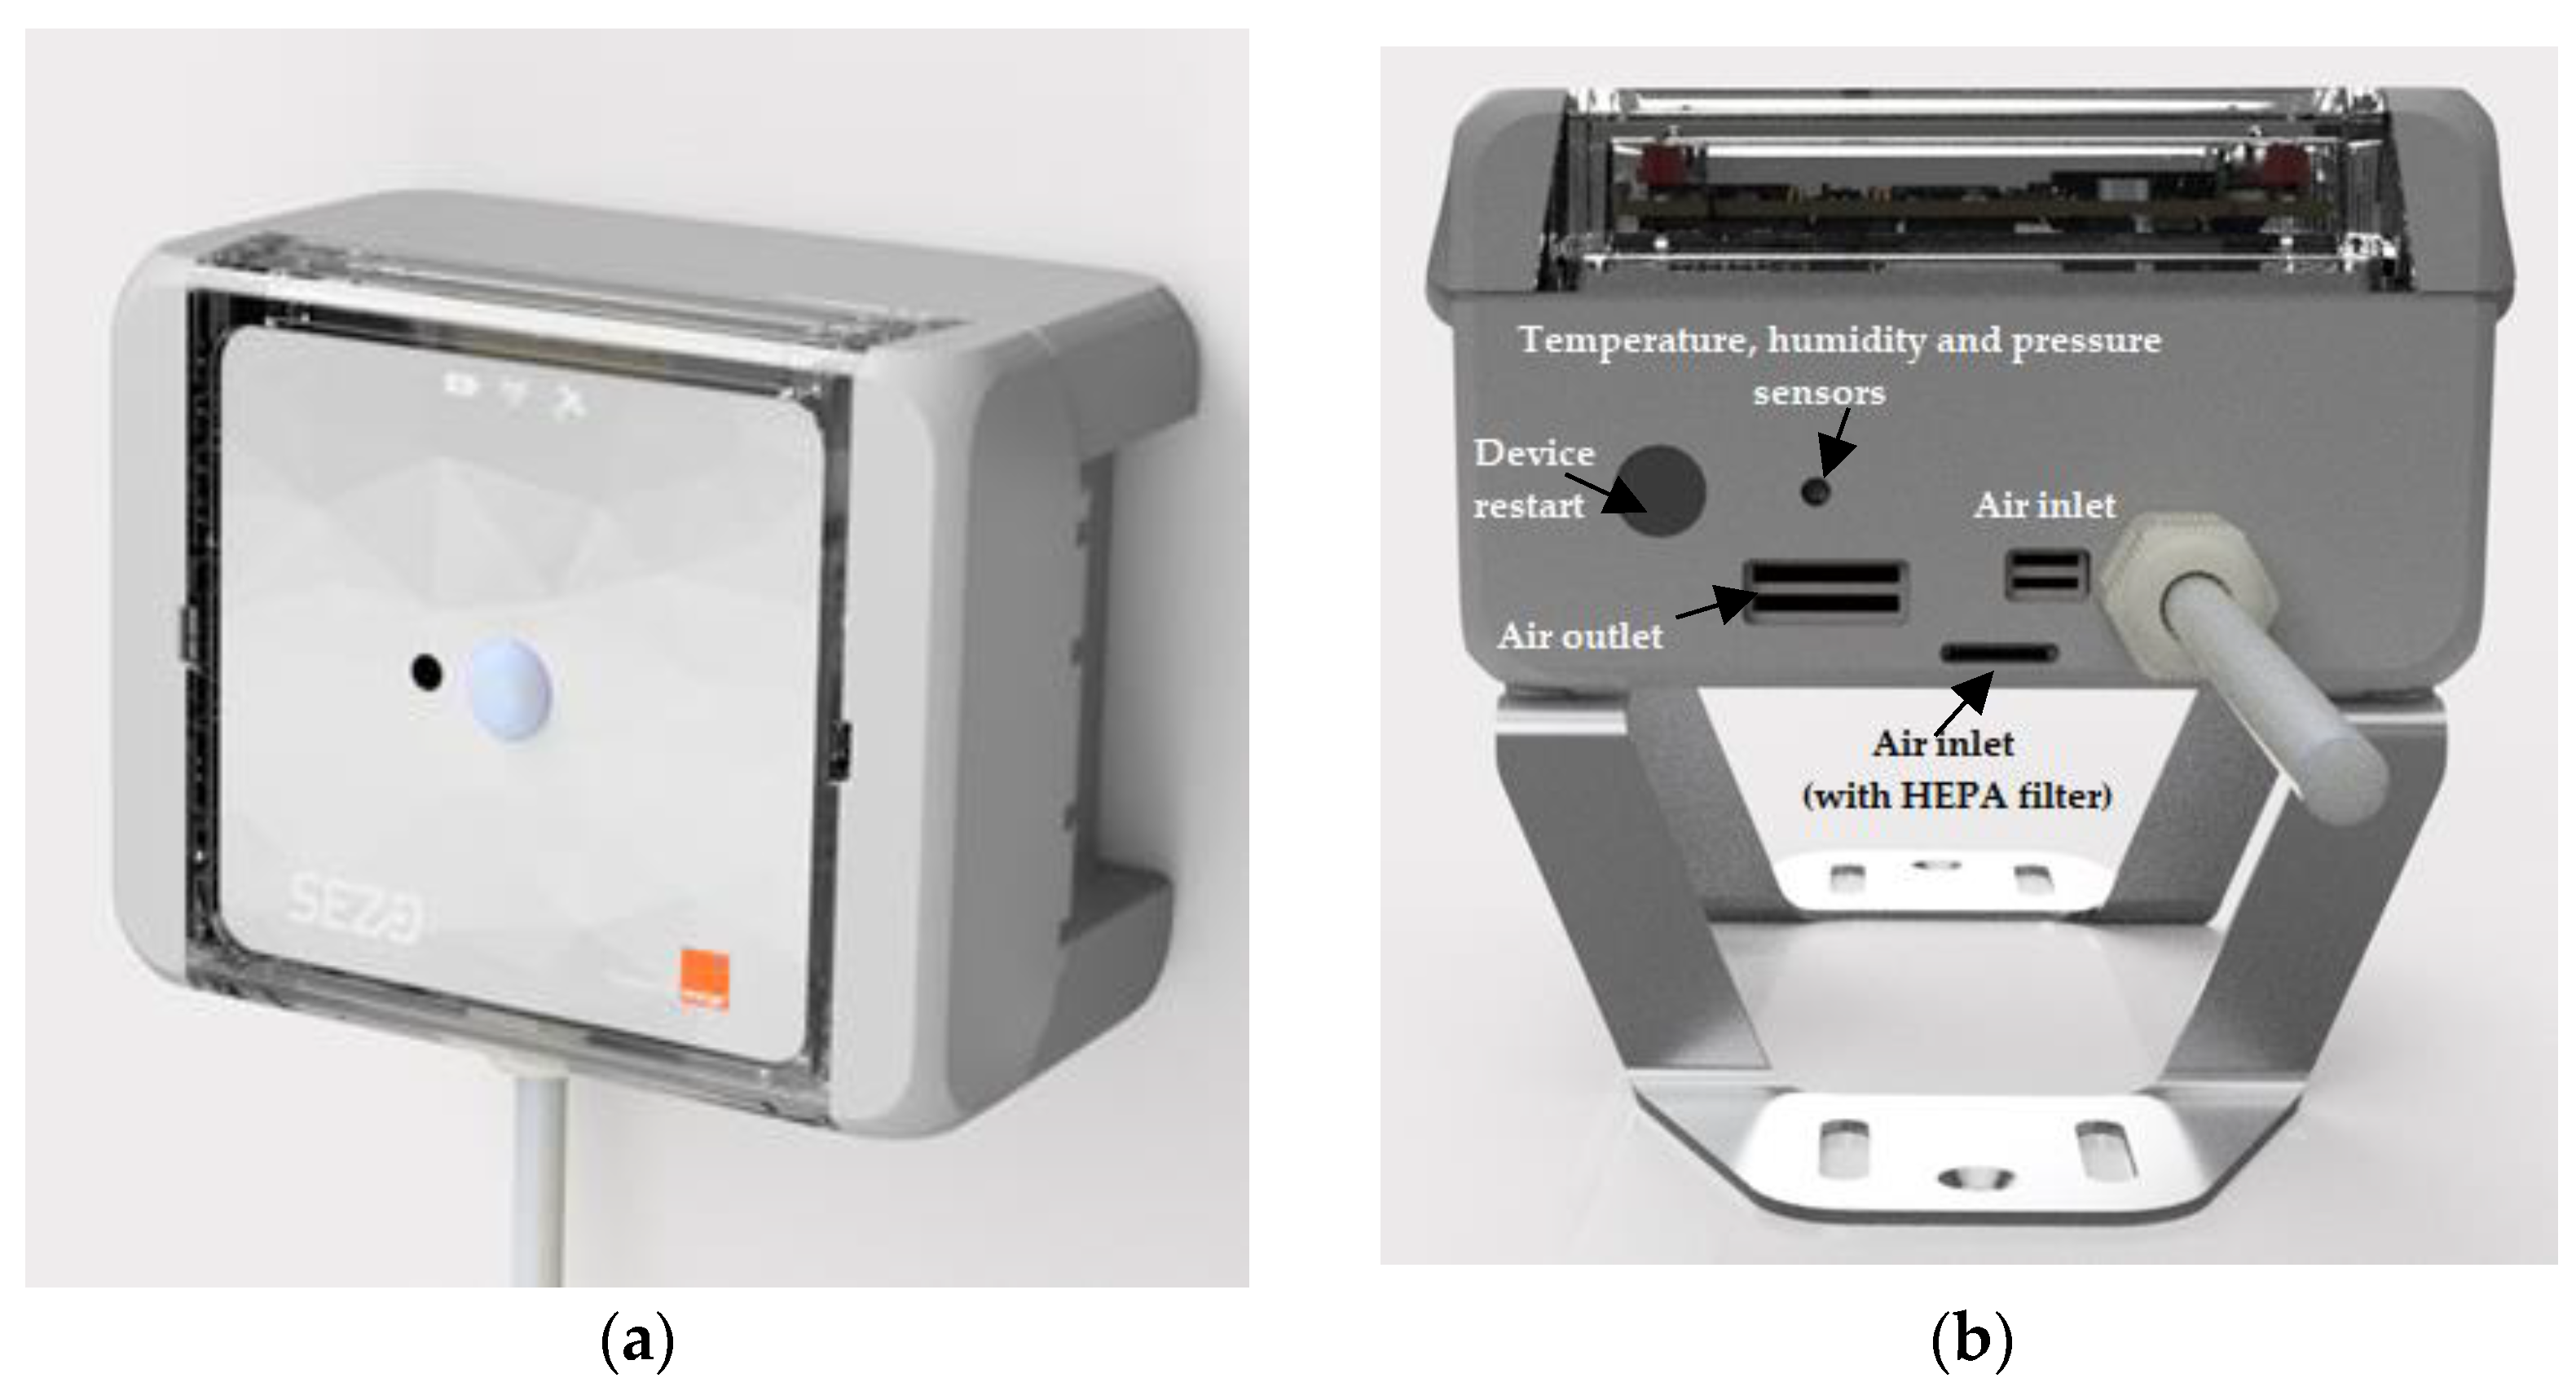
The second device, SEZO AM, tested for the purposes of this study, is an analyser operating on the basis of non-reference methodologies and without demonstrated equivalence to the reference methodology (Figure 3). Similar to the first of the analysers, it is used to measure the concentrations of suspended dust PM2.5 and PM10. The value added to the device is an indication of the PM1 concentration values. The device is covered by polycarbonate housing. Air is drawn in by the device continuously. The lower air inlet is equipped with a HEPA filter to vent the electronics, and a photosensor with clean atmospheric air. In this way, no impurities are deposited onto the sensors. The air flowing in through the upper inlet is analysed for the concentration of particulate matter. Additionally, the device is equipped with a temperature, humidity, and pressure sensor (Figure 3b).
The SEZO AM device has a built-in MCERTS-certified Sensirion SPS30 module, which is an optical Particle Matter Sensor for air quality monitoring and control. The PMx sensor is built in a metal outer case for additional rigidity and physical protection. These grates are used to either limit the amount of incoming airflow, and/or to protect against the ingress of larger particles or debris [42]. The module includes a fan, a laser diode, and a laser detector (Figure 4).
The Sunon, which is a miniature centrifugal fan, pulls the air in through the system. There is a small pocket underneath the fan that acts as its inlet; it has a distinctive shape that is used to create laminar flow in the airstream. This is important, because turbulent flow can cause backflow, which can introduce errors into the readings, such as particles going back and forth over the sensor. Turbulence can also cause dust particles to get stuck in the corners, which would degrade the performance of the unit over time. It is avoided thanks to the fact that the reduction in the cross-section is very gradual, and the radius of the curve around the corner is designed to prevent turbulent flow. An important feature of the module is automatic fan cleaning. When the module is in measuring mode, the fan auto clean routine starts after the specified cleaning interval. This allows the dust accumulated inside the fan to be removed and results in a more accurate measurement result.
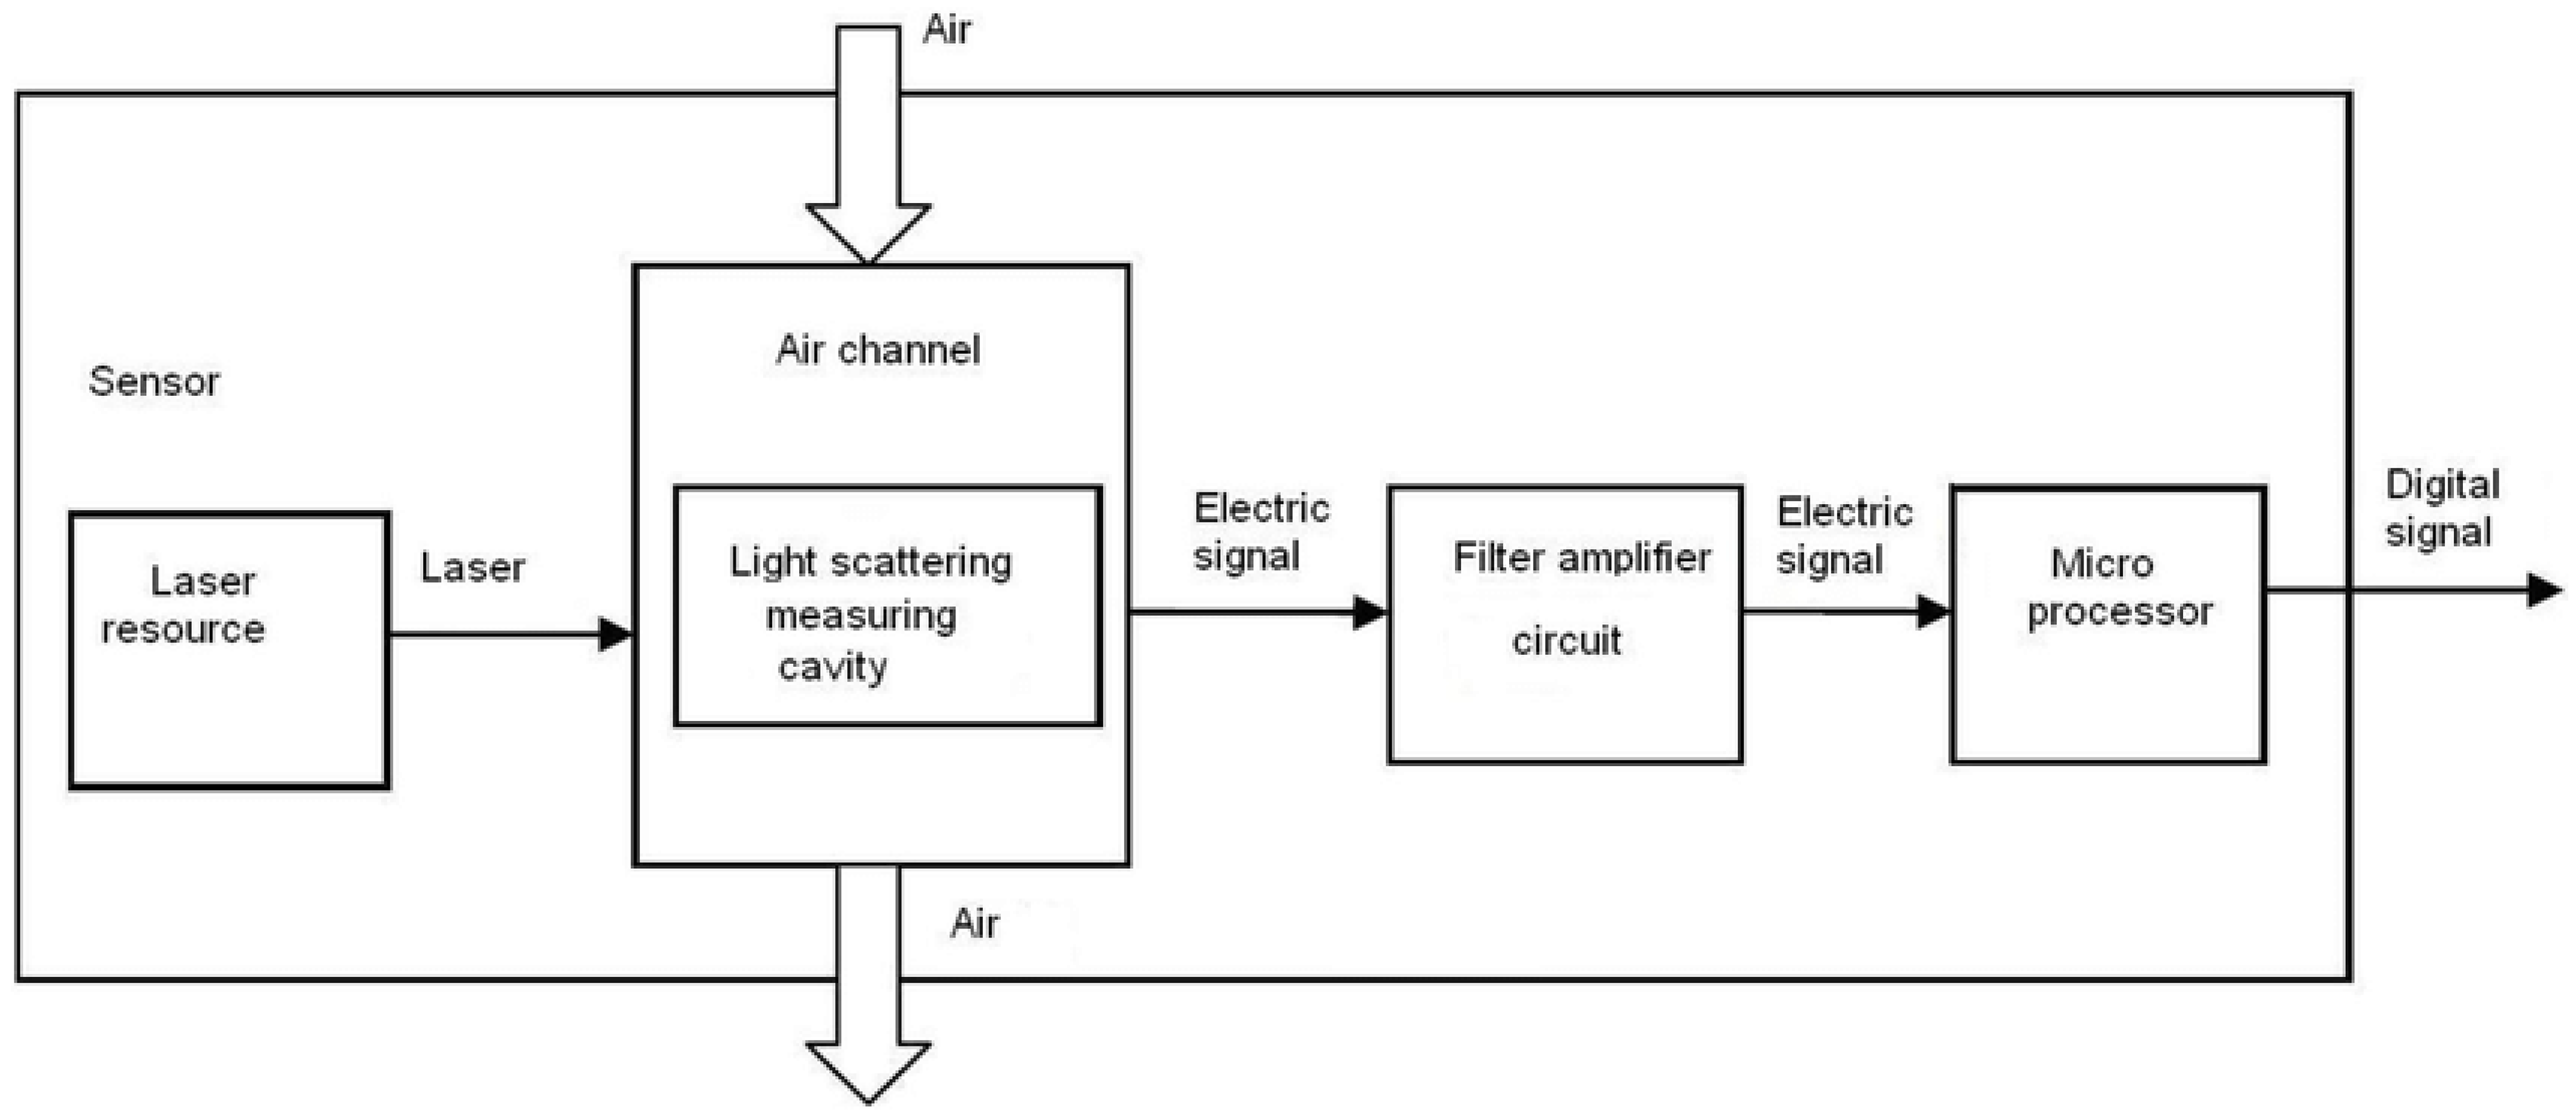
The device has one input channel. A stream of air is sucked in and then channelled across a laser light beam, and the laser reflects on any particles that are in the airstream. These bright spots can then be detected by the photoresistor underneath. By “counting the bright spots”, the sensor can give an indication of how many particles are in the incoming airstream [42].The laser is held in the enclosure by tight-tolerance crush rib features. These permanently deform as the laser barrel is installed. The light passes through a series of baffles, which helps reduce scatter and creates a clean focused beam that will pass over the photodetector. On the other side of the photodiode the beam dump feature takes place. Laser light enters this chamber and, due to all the sharp angles and the dull surface finish, bounces around and continues to scatter until it has safely dispersed [43]. The measuring principle is based on laser scattering (Figure 5).
The degree of scattering of the light beam in a certain direction is measured, which is then converted into an electrical signal. Its intensity depends closely on the size and concentration of the aerosol. The module is able to distinguish between PM1, PM2.5, and PM10 particles with a mass concentration accuracy from 0 to 1000 ± 10 µg/m3 [43]. The mass concentration precision for PM2.5 and PM10 when the concentration ranges from 0 to 100 µg/m3 equals 10 µg/m3 and 25 µg/m3, respectively. In the concentration range from 100 to 1000 µg/m3, the precision error for PM2.5 is 10%, and for PM10, 25% [40]. The device enables direct transmission of the results to the server in real time and monitoring of daily changes in the concentration of dust in the air. The temperature range in which the device is able to work spans between −10 and +60 °C. After exceeding −10 °C, the device is automatically turned off. The SEZO AM also monitors meteorological parameters, i.e., air temperature and humidity, as well as atmospheric pressure, sound intensity, and radiation level. Due to the size of the device, it is easy to install. It is powered from the mains (AC230V) [40].
Both of the discussed devices, the SEZO AM and the EDM 180, operate on the basis of the optical method, but the individual components and device specifications differ slightly from each other (Table 1).

3. Results and Discussion

3.1. SEZO AM and EDM 180: Comparison of PM2.5 and PM10 Concentrations Obtained during Two Campaigns

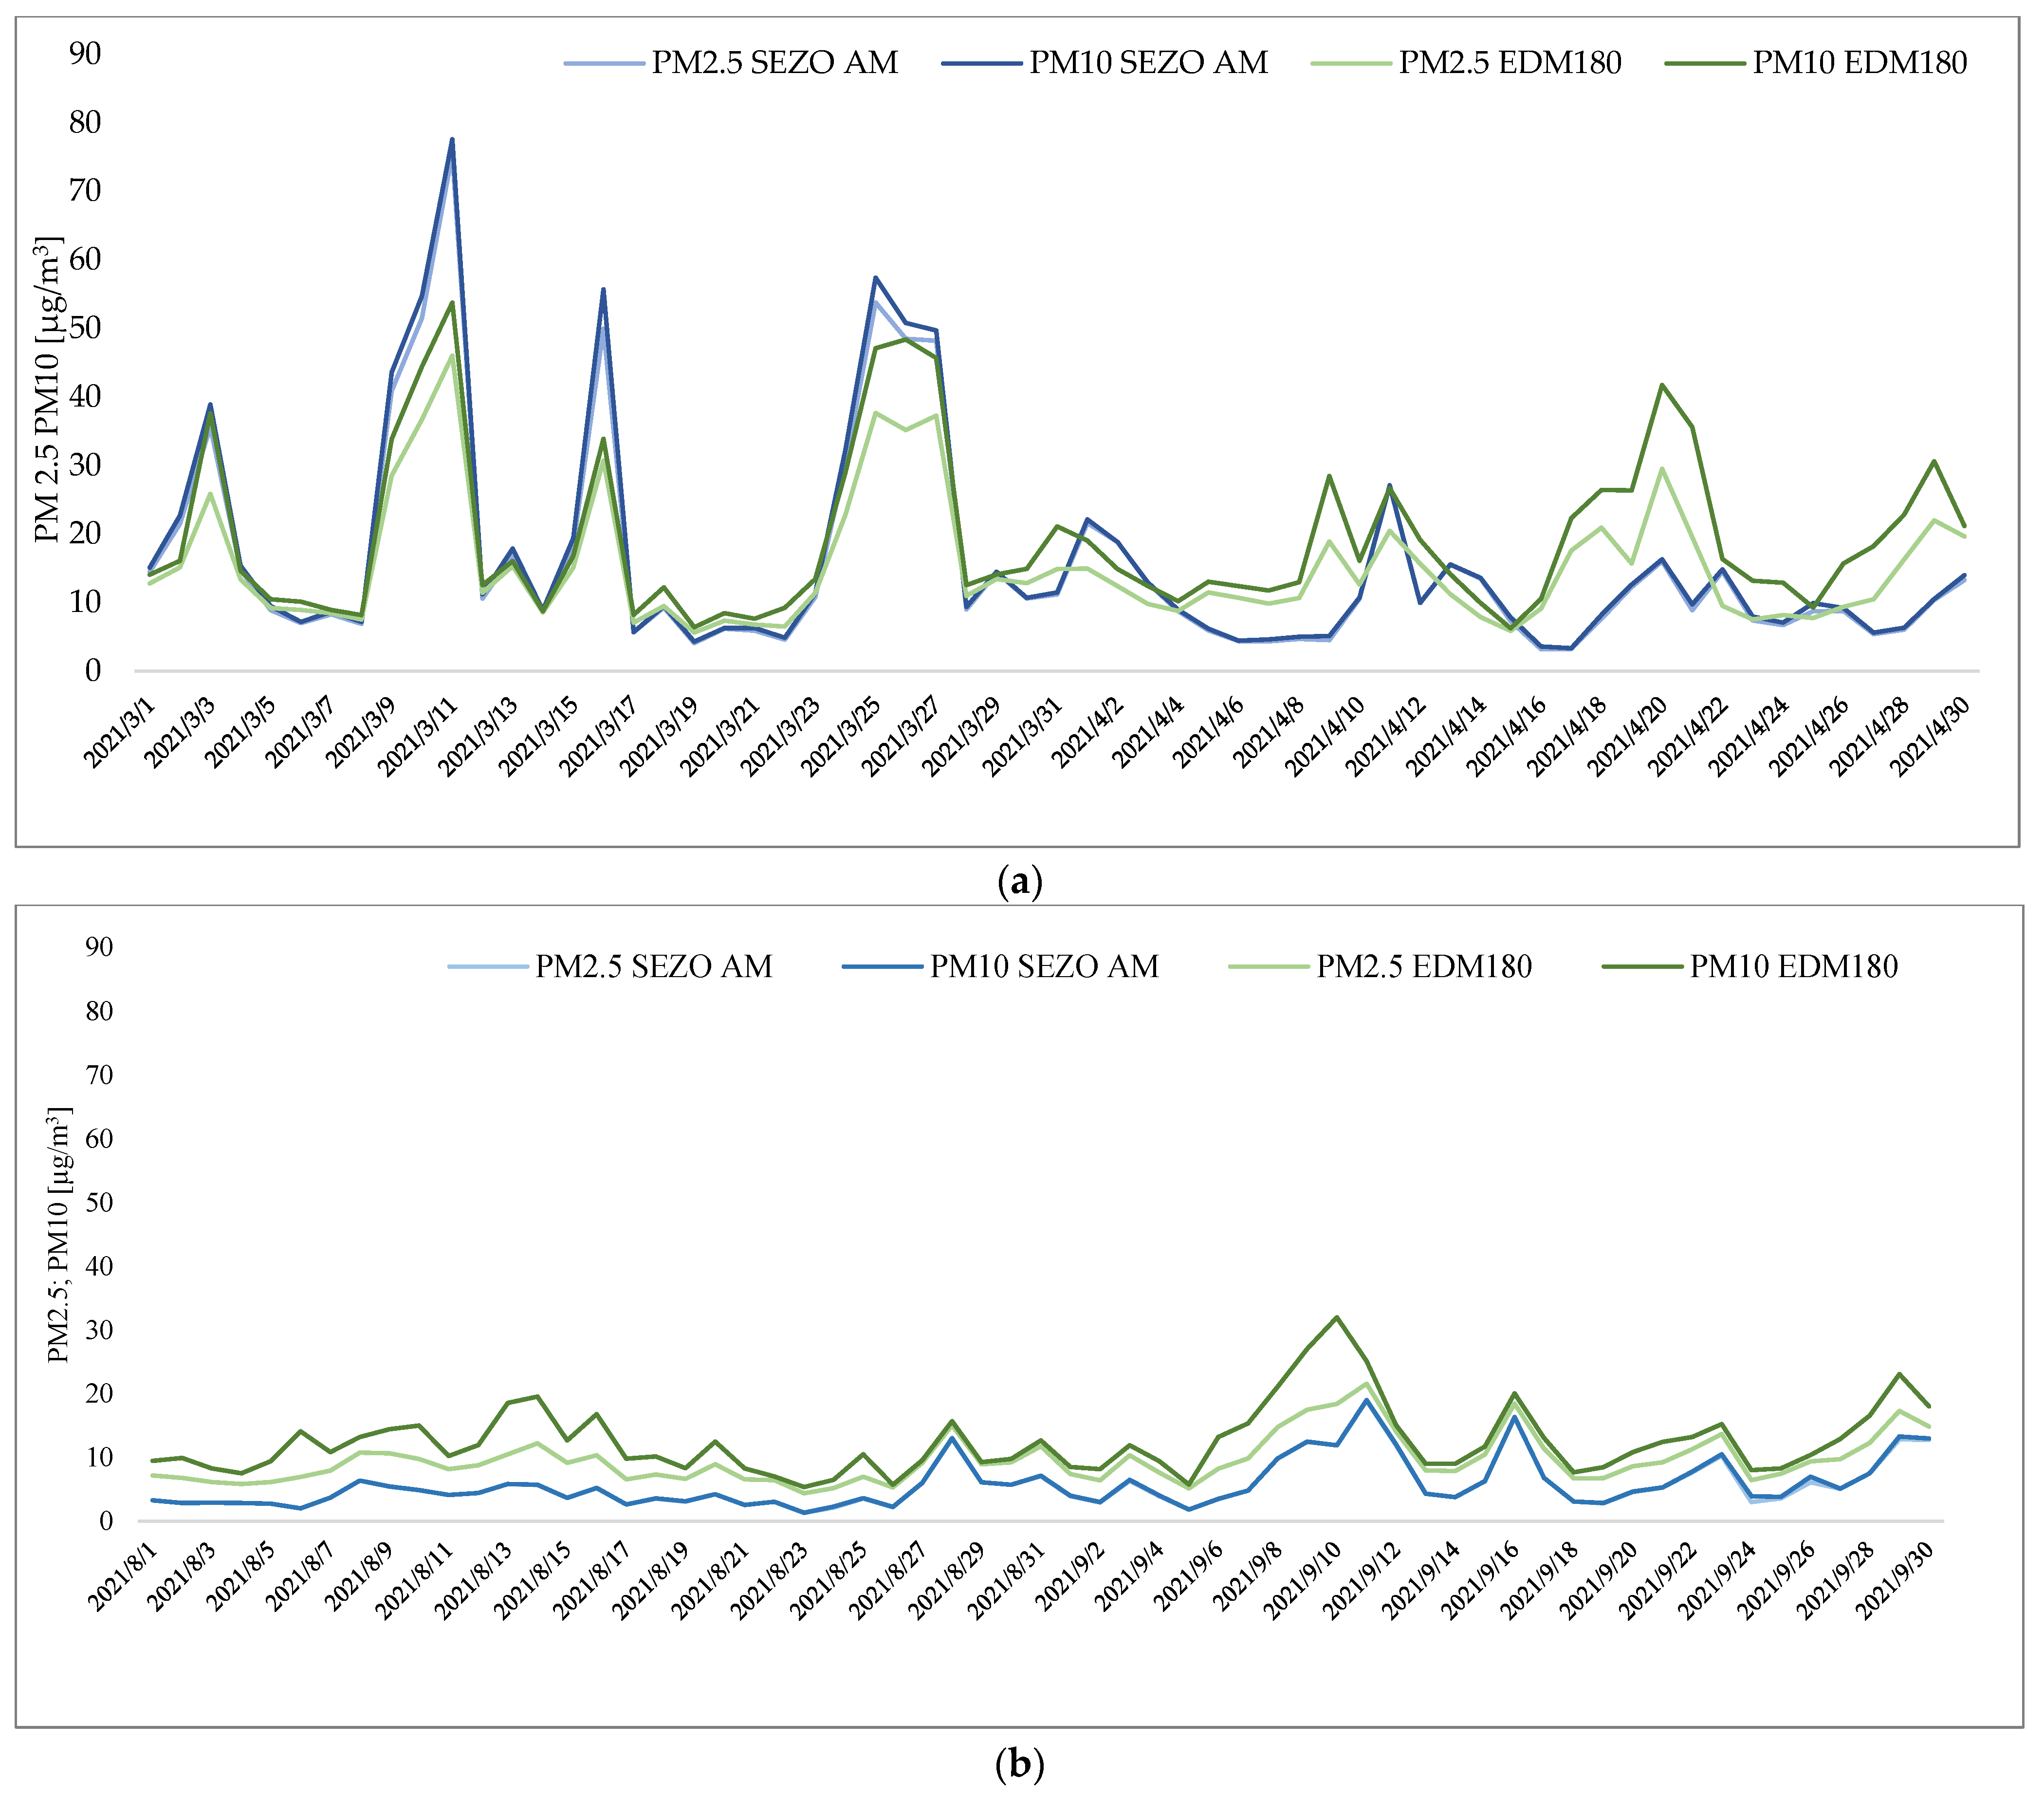
The variability of the daily average values of the PM2.5 and PM10 concentrations measured in the period from 1 March to 30 April (61 measurement days) and 1 August to 30 September in 2021 with the use of the SEZO AM and the EDM 180 m is shown in Figure 4. Measurements took place every second. In the first study period (March–April, 2021), they were averaged first to 5-min and then 24-h values (a total of 17,220 results). In the second period (August–September), data averaging was compacted. Before the 24-h value was determined, 1-min mean values were drawn (86,400 results in total). Due to air humidity values higher than 95%, the analyser was inoperative 0.7% of the time in the period from March–April and 0.6% of the time in the period from August–September (Table 2).
The obtained concentration variability showed a greater similarity in March than in April 2021 (Figure 6a). In the August–September period, the variability of the concentration obtained by both methods was very similar for both aerosol fractions, PM2.5 and PM10 (Figure 6b).
The average share of PM2.5 in the total mass of PM10 obtained by the SEZO AM method was 92.7% and 93.4% (in March–April and August–September, respectively), and with the EDM 180 method, it was 79.0% and 76.8% (in March–April and August–September, respectively). This showed differences in the obtained results in both measurement periods. In the first two-month study period, the mean concentration of PM2.5 obtained from the SEZO AM and the EDM 180 was the same and amounted to 15.4 µg/m3, but during the second campaign, the average concentration was already almost twice as high for the EDM 180 than for the SEZO AL method (Table 2). No concordance was found between the medians measured with the two analysers in March–April (9.7 µg/m3 and 12.4 µg/m3 for the SEZO AM and the EDM 180, respectively) and August–September (4.6 µg/m3 and 8.9 µg/m3 for the SEZO AM and the EDM 180, respectively). Differences were also noted in the case of the minimum concentration of PM2.5. The lowest value measured by the SEZO AM during the first period was more than two times, and during the second period more than three times lower than that obtained with the EDM 180 (2.6 µg/m3 and 5.6 µg/m3, and 1.3 µg/m3 and 4.4 µg/m3 III-IV and VIII_IX, respectively). The day on which these values were recorded was also different during the first campaign. The minimum value of the PM2.5 concentration measured by the SEZO AM was obtained on 16 April 2021, and by the EDM 180 on 19 March. During the second period of measurements, the minimum value was obtained in both cases on 23 August. The maximum value of the PM2.5 concentration was recorded with both analysers on the same measurement day during both campaigns (11 March 2021 and 11 September 2021): however, the maximum concentration measured by the SEZO AM was over 1.5 times higher than that obtained with the use of the EDM 180 (75.5 µg/m3 and 46.0 µg/m3, respectively) in March–April and 1.1 times higher in August–September (19.0 µg/m3 and 21.6 µg/m3, respectively) (Table 2).
The differences in the results were also noted for the larger fraction of aerosols during both campaigns. In March–April, the means concentration of PM10 measured by the SEZO AM was 16.4 µg/m3, whereas the result obtained with the EDM 180 was 19.5 µg/m3. Even greater differences in mean values were obtained in August–September (6.1 µg/m3 and 12.5 µg/m3, for the SEZO AM and the EDM 180, respectively). The median was below the mean concentration for both analysers. However, the measured value of the SEZO AM was nearly 30% lower than that of the EDM 180 during the first period (10.4 µg/m3 and 14.9 µg/m3, respectively) and 43% lower during the second one (4.7 µg/m3 and 10.9 µg/m3, respectively). The minimum value obtained from the SEZO AM during the first campaign was recorded on 16 April and amounted to 3.2 µg/m3. The minimum value of the EDM 180 was measured the day before, on 15 April, and was equal to 6.3 µg/m3. During the second campaign, the minimum value was noted on this same day (23 August 2021). However, it was lower for the SEZO AM (1.4 µg/m3) than for the EDM 180 (5.4 µg/m3) method. The maximum PM10 concentration for both devices were recorded, as for PM2.5, on March 11 (first campaign). The concentration measured by the SEZO AM was almost 1.5 times higher than that obtained by the EDM 180 analyser (77.6 µg/m3 and 53.8 µg/m3, respectively). In the period of August–September, the maximum concentration value was equal to 19.0 µg/m3 and 32.0 µg/m3, for the SEZO AM and the EDM 180, respectively. The first of these values was recorded on 11 September, and the second on 10 September 2021.
Statistical analysis (Statistica v.9, StatSoft) results of the PM2.5 and PM10 concentrations obtained from the two devices pointed out the statistical significant differences, confirmed by the Mann–Whitney U test (T U-W). In the case of both the PM 2.5 and the PM10, the p coefficient describing the statistical significance was below 0.05. This applies to both the March–April period (0.029 and 0.001, for PM 2.5 and for PM10, respectively) and the August–September period (0.018 and 0.025, for PM 2.5 and for PM10, respectively) (Figure 7). The extreme values for PM2.5 and PM10 were also noted, with the maximum equal to 75.5 and 77.6 µg/m3 (in the March–April period) and 19.0 µg/m3 (in the August–September period), obtained for PM2.5 and for PM10, respectively. No extreme values for the EDM 180 device were recorded during both campaigns.
Based on the results obtained by the two methods, a statistical analysis of their matching (Pearson correlation) was carried out (Figure 8). The results of the concentrations of both aerosol fractions measured over the first two-month period with the EDM 180 and SEZO AM analysers showed a match at the level of 78% for PM2.5 and 70% for PM10 (calculated on the basis of the coefficient of determination R2, with p < 0.05). During the second two-month period, the correlation between both methods was higher (94% for PM2.5 and 75% for PM10). However, we noted that in every case, there were deviations from the obtained Positive (Direct) Relationship of concentrations for both aerosols fractions.
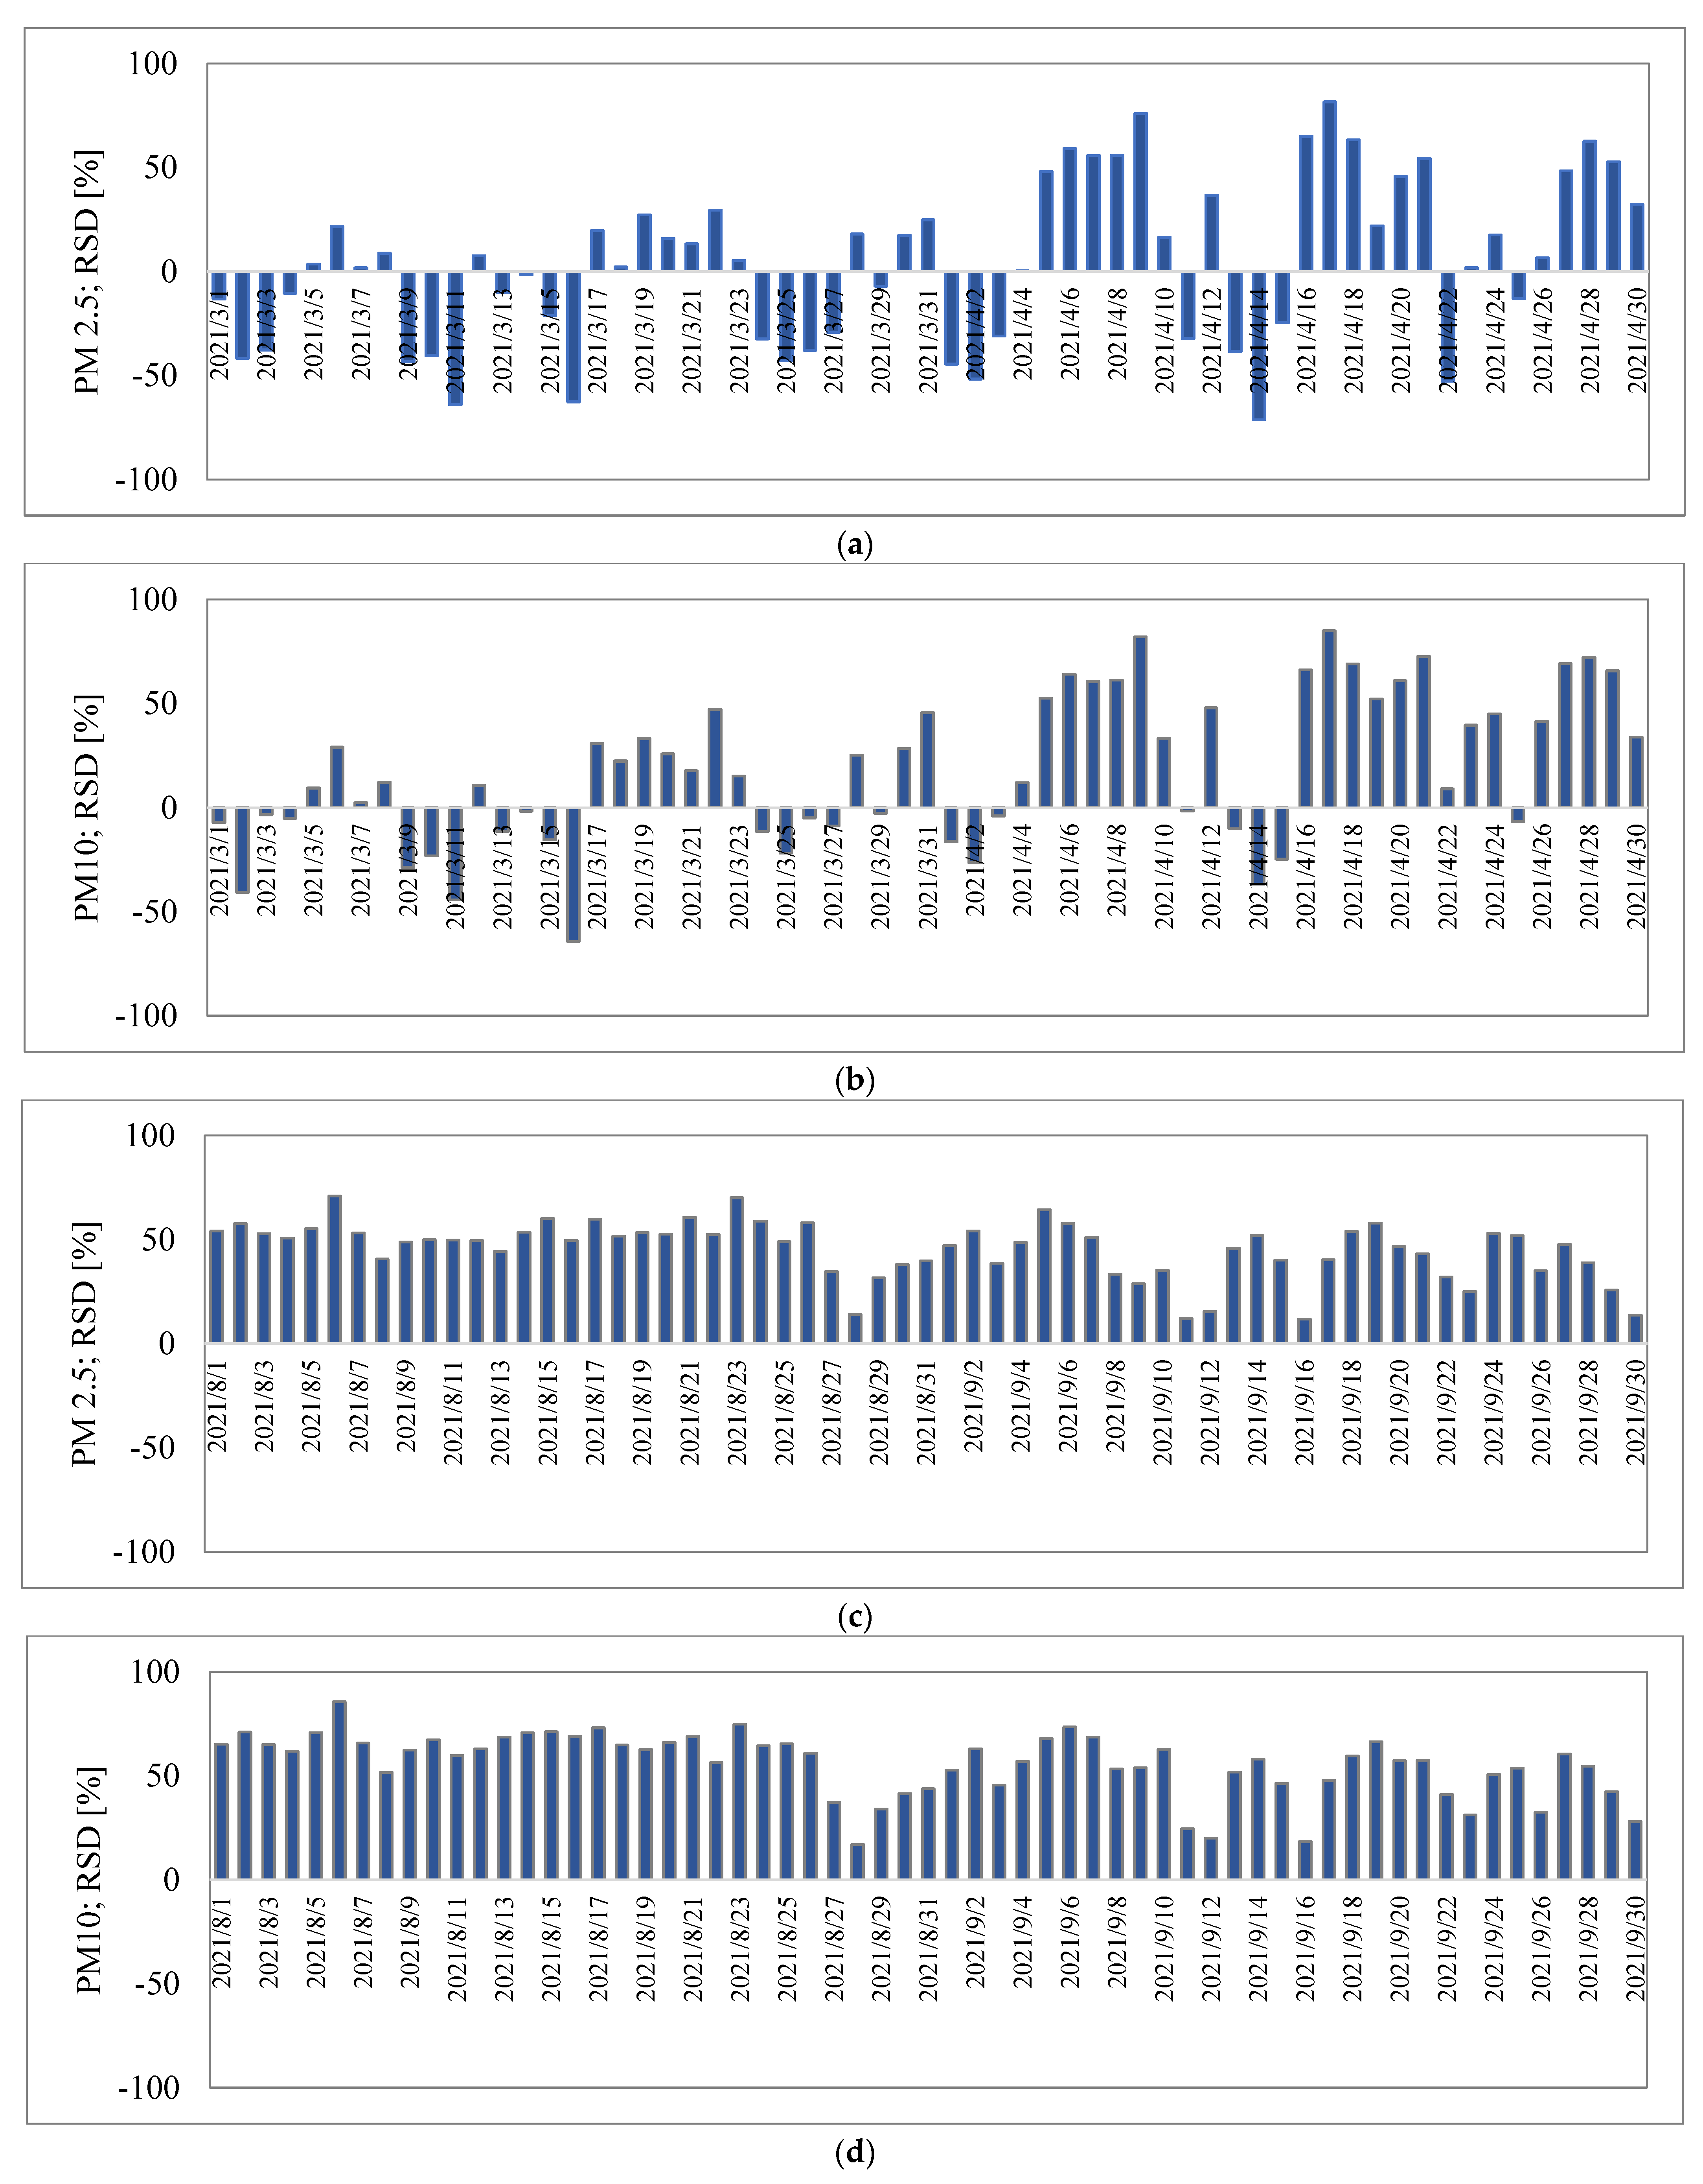
Conducting further statistical analysis, it was assumed that the real values are the results obtained from the reference device EDM 180, and the measured values are the results from the SEZO AM. Such an assumption allowed us to establish the relative standard deviation (RSD) of the results obtained by the SEZO AM method. In the March–April period, 41% of the PM2.5 concentration results measured with this analyser were higher, and 59% were lower than the results obtained with the EDM 180 (Figure 9a). As for the PM10 concentrations, 39% of the results were higher, and 61% were lower than that measured by the EDM 180 analyser. The average relative standard deviation (RSD) in the period from March–April 2020 was 4.9% for PM2.5 and 5.1% for PM10. The mean bias (MB) during the first measurement campaign was set at 2.9 µg/m3 and 3.4 µg/m3.. The Root Mean Square Error (RMSE), which is a standard way to measure the error of a model in predicting quantitative data, was calculated as well. During the first measurement campaign (March–April 2020), the RMSE was 8.1 µg/m3 for PM2.5 and 9.7 µg/m3 for PM10, respectively.
In August–September, all results obtained with the SEZO AM method were lower than those obtained by the EDM 180 method (Figure 9c,d). The average relative standard deviation (RSD) for PM2.5 was 5.9%, and for PM10 it was 7.2%. The mean bias for PM2.5 was 2.0 µg/m3, and for PM10 it was 3.2 µg/m3. The RMSE during the second measurement campaign was equal to 4.0 µg/m3 and 7.3 µg/m3 (for PM2.5 and PM10, respectively).
The research was carried out over a period of only four months and needs to be continued. However, the obtained results of the environmental intercalibration of the SEZO AM and with the reference EDM 180 analyser are already satisfactory. Similar research using two devices for PM10 concentration measurements were conducted in Rabka-Zdrój in 2017 by Rogulski and Badyda (2020) [44]. The authors compared an optical meter (DFRobot’s SEN0177 PM Sensor) with a reference device (SEQ47/50-RV CD-Sven Leckel) and obtained the agreement of the results equal to 90% in average. An error of analysis could result, in the authors’ opinion, from the occurrence of high concentration episodes. In such a case, the sensor showed values twice as high as those measured with the reference method [44]. An example of a study in which cheap sensors (Shinyei PPD42 and Shinyei PPD20V) were used for the measurement of the concentration of particulate matter in the air are the measurements carried out by EuNetAir in Portugal. In this case, the achieved compliance ranged from 36% to 60% for the PM10 and from 26% to 51% for the PM2.5 [45]. It indicates that the results described in this publication are really good, and the SEZO AM device could be used to measure the concentration of PM2.5 and PM10 in the port atmosphere in which they were carried out.

3.2. Influence of Meteorological Condition on PM2.5 and PM10 Concentrations Obtained by SEZO AM Device during Two Campaigns

During both measurement periods (III-IV and VIII-IX), a comparison of the meteorological parameters has been made in order to determine what factor most influenced the PM2.5 and PM10 concentration error (Table 2). It was found that the air temperature was three times higher in August–September (16 °C) than in March–April (5 °C). Additionally, the air humidity was higher during the second measurement campaign (34.3–90.9%) than during the first one (17.4–87.0%). In addition, the second period (VIII-IX) was characterized by a sum of four and a half times more rainfall (9.45 mm) compared to the first period (III-IV), when the sum of rainfall was equal to 42.7 mm. Thus, the second measurement period was warmer and much more humid than the first. It manifested in concentration values of PM2.5 and PM10 nearly three times lower obtained with both devices in the period VIII-IX as compared to the period III-IV (Table 2). This was a consequence of better aerosol removal from a more humid atmosphere [46,47,48,49]. In some areas of the globe, e.g., at moderate latitudes, this form of precipitation may remove as much as 80% of aerosol mass [49,50]. It was also found that in the second research period, the differences in the mean, minimum, and maximum PM2.5 and PM10 concentrations obtained with both analysers were higher than those obtained in March–April (Table 2). In August–September, all results obtained with the SEZO AM method were lower than those obtained by the EDM 180 method (Figure 9c,d). We hypothesize that during the period of increasing air humidity and/or in the periods when the volume of precipitation increases, the SEZO AM underestimates the concentration results, especially of larger PM10 particles. This may be due to the absence of an outer sheath of the air inlet and the washing away of the particles before they were measured on the analyser. Unfortunately, it was not possible to establish a statistically significant relationship between the concentration of PM2.5 and PM10 and air humidity (p > 0.05) for either of the two measurement periods. This also applies to the results that were characterised by the highest RSD values (Appendix A). However, some of these results had values higher than those obtained with the reference method (Figure 9). We are hypothesizing that this could be because of a misinterpretation of water particles in the air as dust. However, we cannot prove this. More research is required.
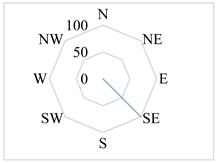
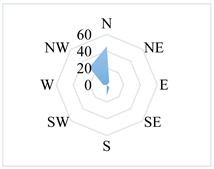
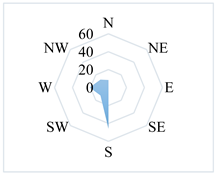
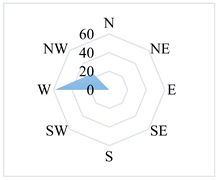
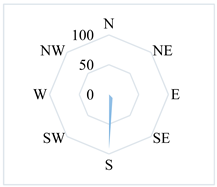
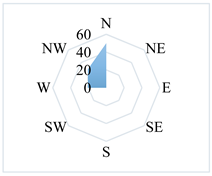
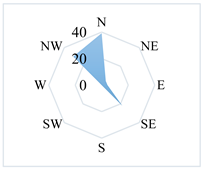
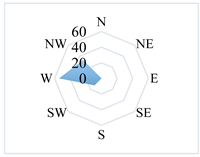
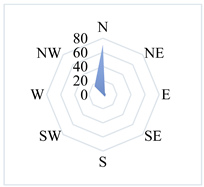
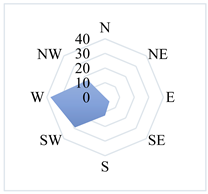
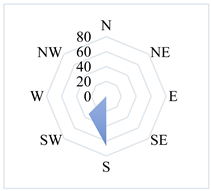
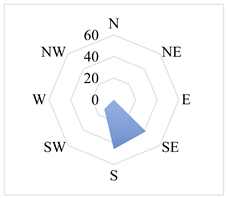
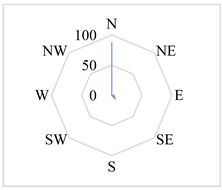
The average wind speed was at a similar level during both campaigns. It amounted to 5.8 m/s and 4.4 m/s in March–April and in August–September, 2021, respectively. The ranges in which the wind speeds occurred in both measurement periods were also similar (Table 2), indicating the dominance of local and regional sources of PM2.5 and PM10 emissions [11]. Exactly these same wind speed average values were noted for the highest RSD values (Appendix A). The dominant wind direction differed in both measurement periods (III-IV and VIII-IX). During the first campaign, the dominant wind direction was west (34% of the measurement time) and northwest (21% of the measurement time) (Table 2). Neither of these directions applied aerosols from the port area or the Gulf of Gdańsk, where the ship flow route is located (Figure 1). In the second research period, southwest (29.5% of measurement time) and south (19.7% of measurement time) wind directions dominated. To the west, south, and southwest of the measuring station, there is the Tricity Beltway with a large traffic flow. This generates the emission of pollutants and can lead to an increase in the concentration of aerosols, especially those with a diameter of less than 2.5 μm [51,52]. However, we did not observe such a rule while conducting our research. The average concentrations of PM2.5 and PM10 under westerly winds (first campaign) were smaller than during the entire period (Table 2) for both devices (10.0 µg/m3 and 12.6 µg/m3 for PM2.5 µg/m3 and 11.1 µg/m3 and 16.2 µg/m3 for PM10, respectively, for the SEZO AM and the EDM 180 methods). During the second campaign (VIII-IX), under the dominance of the southwest wind direction, the concentrations of aerosols measured with both devices were slightly higher or comparable to those obtained over the entire measurement period (5.9 µg/m3 and 10.0 µg/m3 for PM2.5 µg/m3 and 5.9 µg/m3 and 13.5 µg/m3 for PM10, respectively, for the SEZO AM and the EDM 180 methods).
The second prevailing wind direction during the March–April measurement period (NW) was while transporting pollutants from North Kashubia, where most of the arable land is located in the northern part of Poland [53]. In previous years, the influence of agriculture on PMx concentration and its chemical composition in the air over Gdynia as a result of transporting aerosols of agricultural origin was already noted. All episodes occurred in the spring, when agricultural activity related to fertilising farmland was the highest, and the average wind speed was lower than 5 m·s−1, which indicated a local to regional origin of aerosols and their compounds [53]. However, also in this case, concentrations of PM2.5 and PM10 were smaller than during the entire period (Table 2) for both devices (8.9 µg/m3 and 10.3 µg/m3 for PM2.5 µg/m3 and 9.3 µg/m3 and 13.4 µg/m3 for PM10, respectively, for the SEZO AM and the EDM 180 methods).
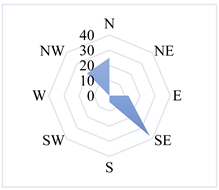
South-eastern winds, which could be responsible for the application of aerosols from over the Gdynia Port area, were noted only during the August–September campaign (14.8% of the research time; Table 2). Further, under this direction only, the concentration of PM2.5 and PM10 were slightly higher than over the entire measurement period. Such a tendency was noted for both devices (7.0 µg/m3 and 11.5 µg/m3 for PM2.5 µg/m3 and 7.3 µg/m3 and 15.9 µg/m3 for PM10, respectively, for the SEZO AM and the EDM 180 methods). The influence of maritime transport and port activity in increasing PMx concentration and its ingredients was noted in Gdynia in previous studies also [54,55,56].
The analysis of the concentrations of PM2.5 and PM10, which were characterised by the highest RSD values (Appendix A), did not allow us to draw any significant conclusions in terms of the origin of the aerosols at that time. Various wind directions were recorded in these days, without the dominance of any of them. Winds from the port blew three times in the period of March–April (11.03; 18.04 and 28.04) and three times in the period of August–September (5.09; 6.09 and 7.09). On none of these days was the influence of the wind direction on the concentration of the analysed aerosol fractions, as well as the obtained errors, in the comparative analysis of SEZO AM and EDM 180 established.

3.3. SEZO AM Comparison with TSI OPS3330 in Dust Chamber

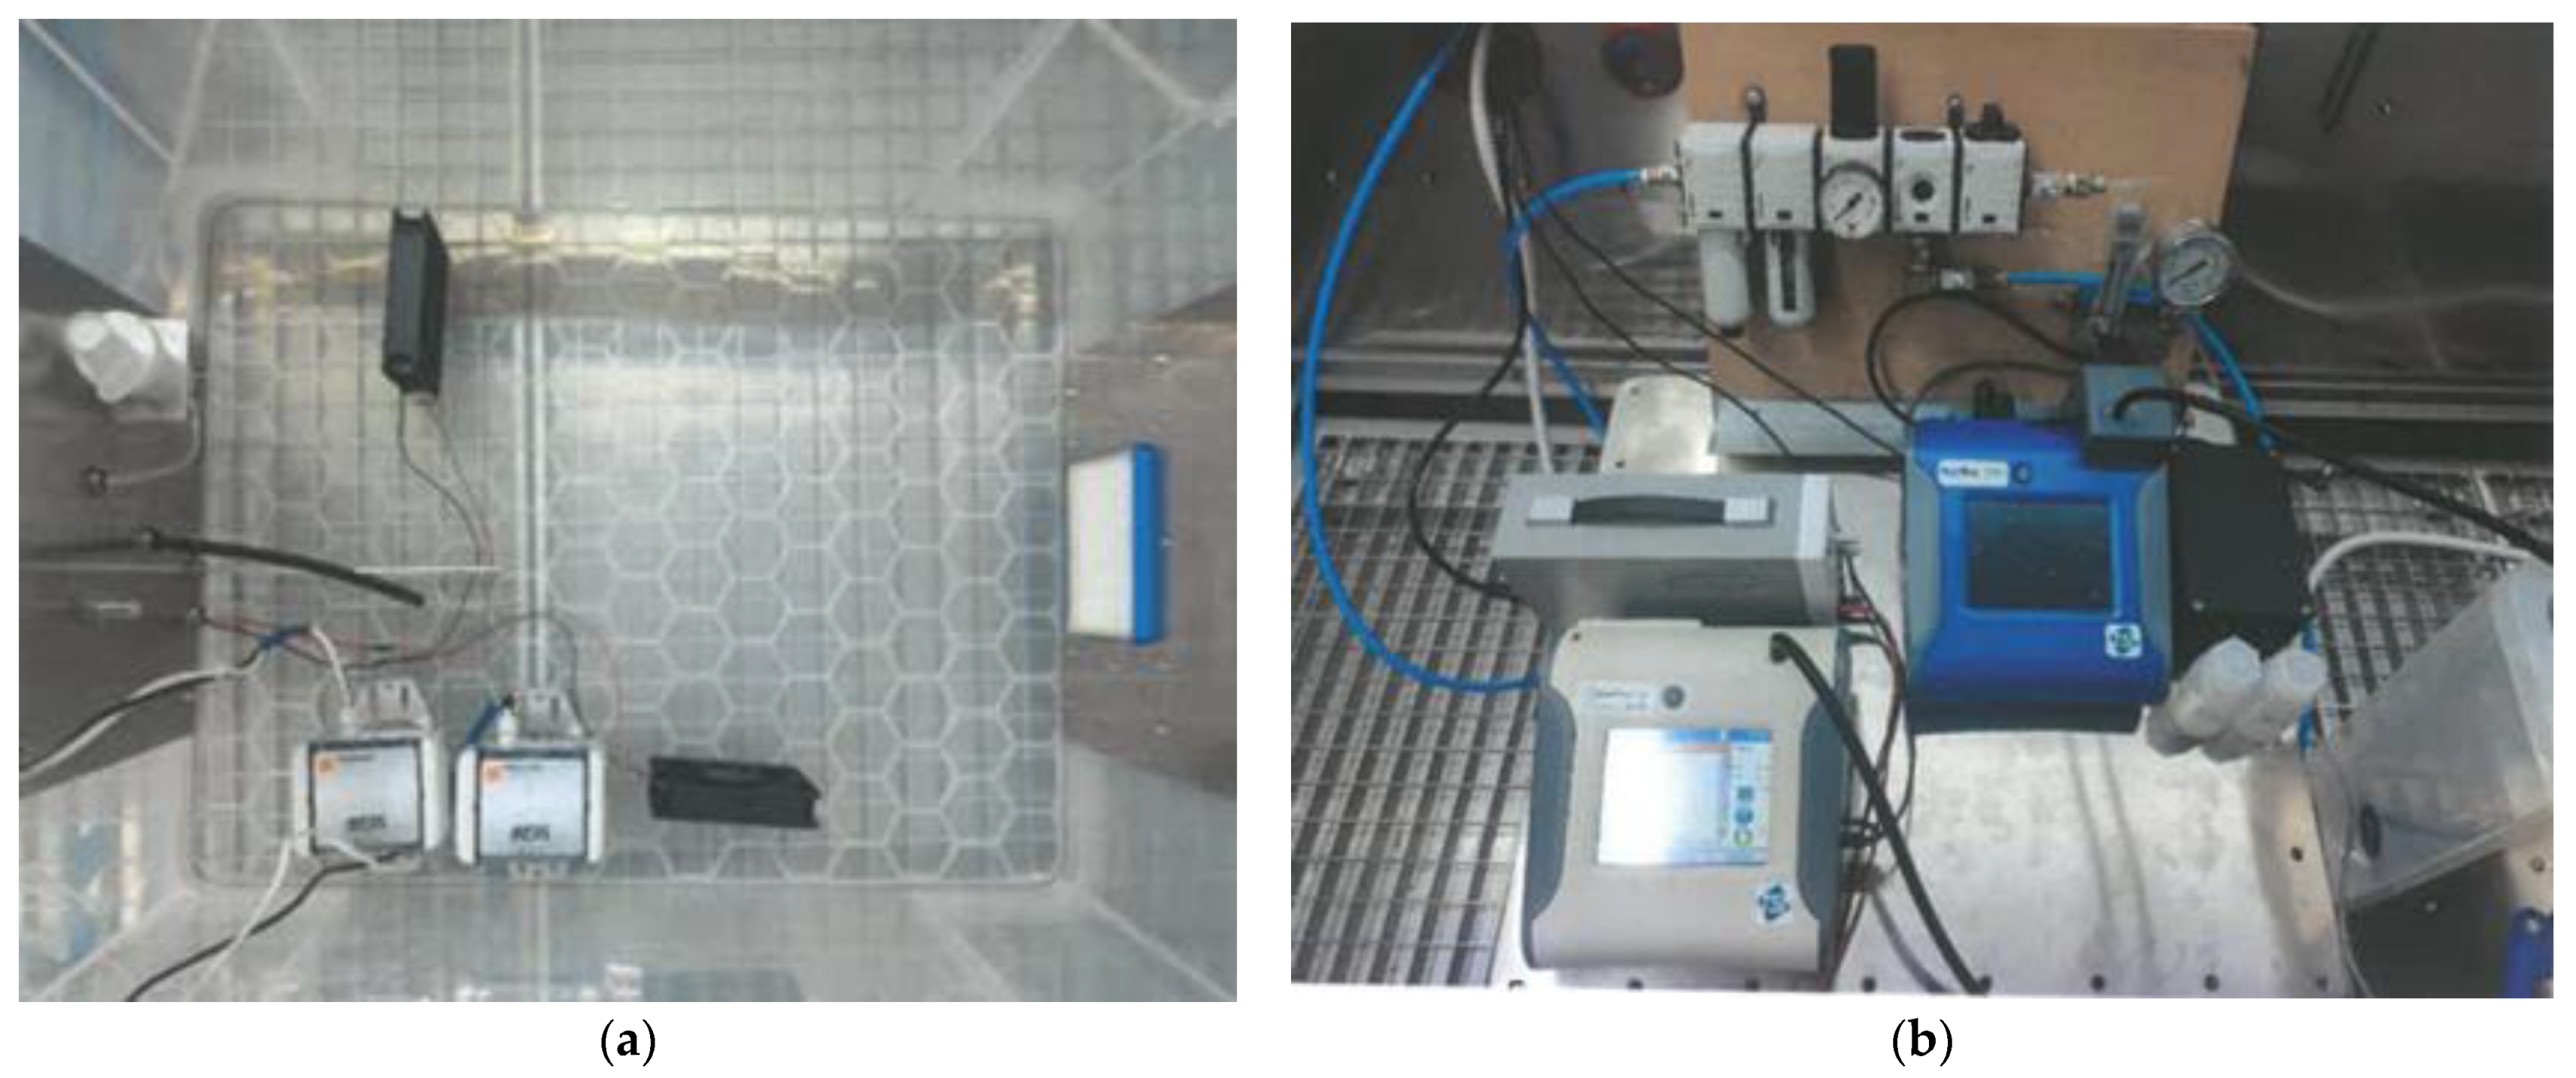
A comparison of two SEZO AM devices to a higher-class TSI OPS3330 reference was performed in August 2021 according to the formula described by TSI company [57], in a measurement dust chamber by SoftBlue SA Research and Development Centre [58] (Figure 10). The PSL particles of 0.75 μm and 3.00 μm were injected in three emission waves, and sensor readings were compared.
The TSI OPS3330 readings interval was 30 s, the SEZO readings interval was set to 1 s, and 30 s averages were calculated for comparison (Figure 11). The test was carried out for 2000 s (about 3.5 h). The course of the test was as follows: initial cleaning and drying of the chamber by supplying filtered air, first phase of dust emission (I), pause and stabilisation, second phase of dust emission (II), interruption and stabilisation, third phase of dust emission (III), stabilisation and free decrease indust concentration in the chamber, final cleaning of the chamber to the initial state (Figure 11).
The determination coefficient (R2), as well as the fit of both SEZO AM devices with the reference analyser TSI OPS3330, which were obtained during measurements in a dust chamber, were at a high level. For the SEZO 013-12A-0001, it was 86% for both PM2.5 and PM10. For the second device, the fit was a bit lower, 79% and 81%, for PM2.5 and PM10, respectively (Table 3).
Similar to the environmental tests, those carried out in the dust chamber also gave satisfactory results. This confirms the possibility of using the SEZO AM in the study of the variability of PM2.5 and PM10 concentrations in the future. However, further comparative studies in a dust chamber for several SEZO AM analysers used simultaneously with the reference method are suggested in order to improve the accuracy of the measurements. These studies should be carried out in several concentration ranges (from very low to very high).

3.4. SEZO AM Optimization

The results of the research conducted in the dust chamber in August 2021 by SoftBlue SA Research and Development Center [58] with the use of two SEZO AM analysers and the TSI OPS3330 reference method indicated the need to determine the correction factor for PM2.5 and PM10 concentrations. Its value was set at 1.2 for PM2.5 and 1.16 for PM10. They were determined on the basis of the mean analysis error in relation to the reference analyser. In order to determine the optimal factor in the future, further tests are planned in the dust chamber with the simultaneous use of more SEZO AM analysers and for a wide range of dust concentrations. In turn, the analysis of the concentration results obtained during the tests conducted in March–April and August–September 2021 forced the addition of an external inlet housing (made of polyethylene) to the analyzer in order to eliminate the influence of relative air humidity (Section 3.2) (Figure 12).
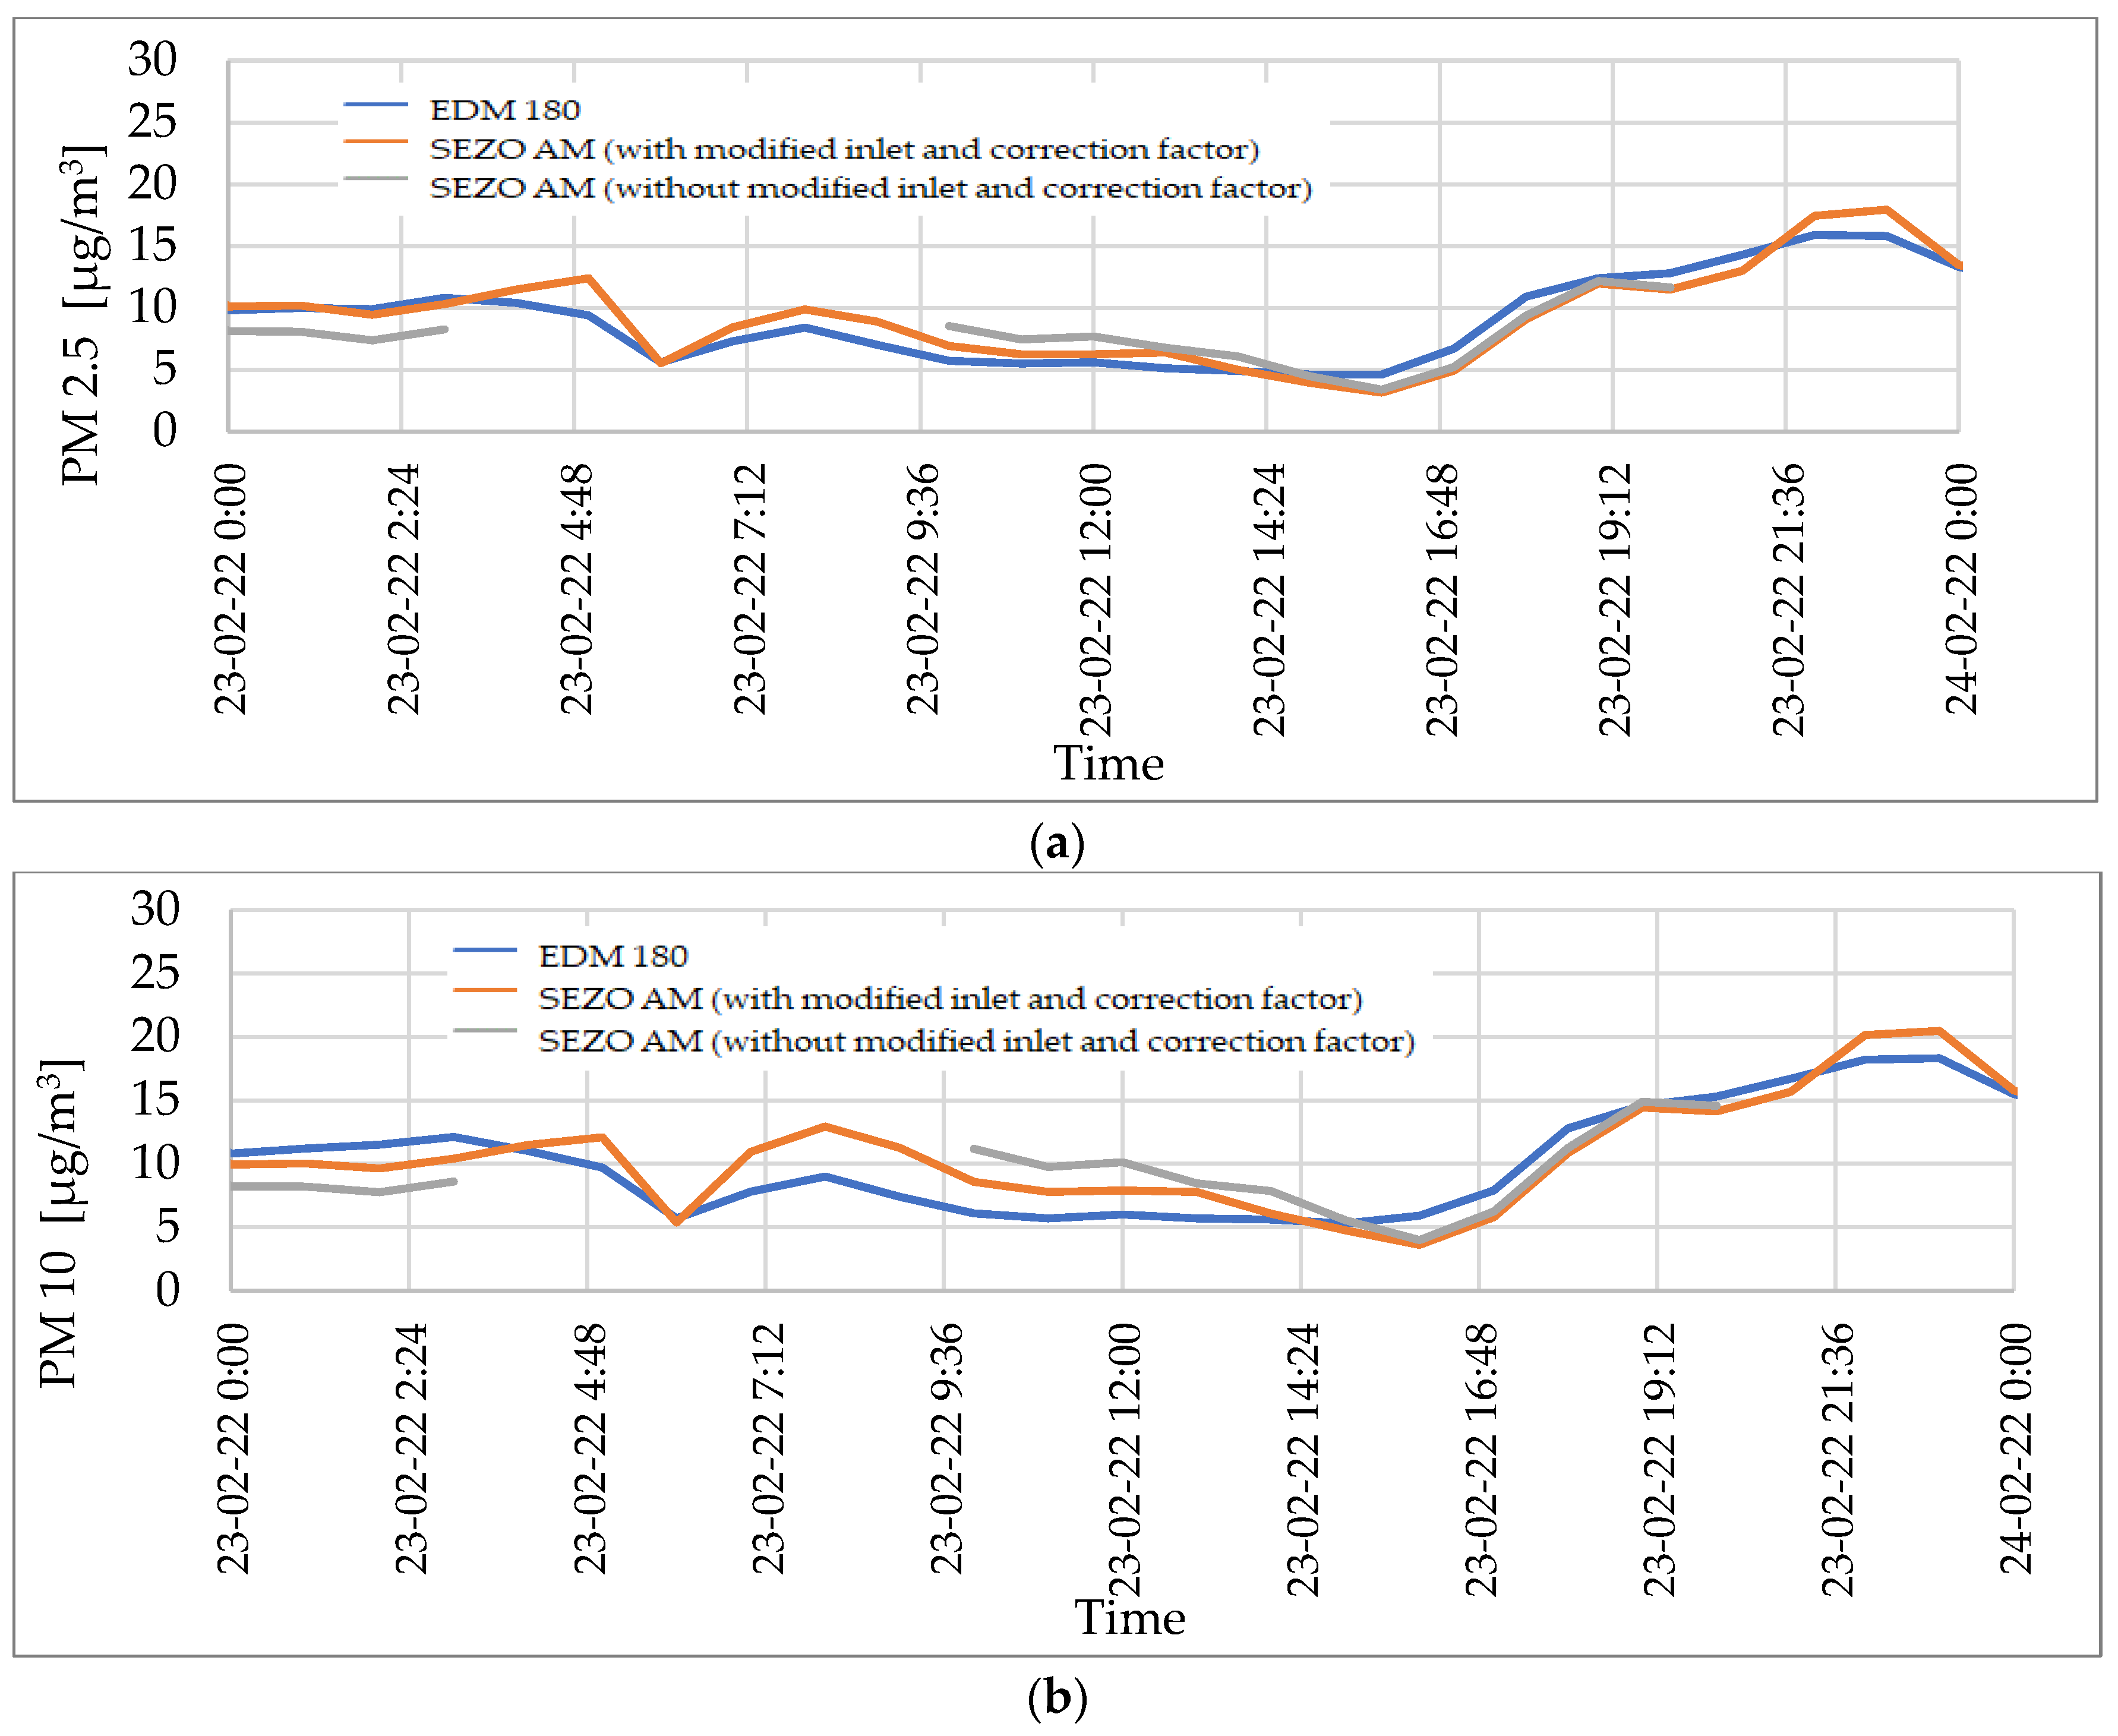
On 23 February, parallel daily measurements of PM2.5 and PM10 concentrations were carried out using the EDM 180 analyser and two SEZO AM analysers. One of the analysers was supplemented with an inlet external housing and the other worked unchanged. The results obtained from the analyser with the inlet housing were additionally multiplied by the correction factor (Figure 13). The aim of the research was to determine whether such a procedure will give positive results in relation to the obtained concentrations of PM2.5 and PM10. The mean concentration of PM2.5 for the EDM180 was 9.1 μg/m3, and for the SEZO AM it was equal to 8.6 μg/m3 (with the use of a correction factor and inlet external housing) and 7.7 (without the use of a correction factor and inlet external housing). The RSD of the average PM2.5 concentration obtained for the modified SEZO device was 5.5%, and for the regular one 15.4%. Concentration of PM10 measured with the EDM 180 method was in average equal to 10.3 μg/m3, and for the SEZO it was 10.0 μg/m3 and 9.1 μg/m3, respectively, for the device with and without the use of a correction factor and inlet external housing. The RSD of the average PM10 concentration obtained for the modified SEZO device was 2.9%, and for the regular one 11.7%.
The course of variability of the concentration of PM2.5 and PM10 was very similar for all the analysers used (Figure 12). However, as much as 38% of the results obtained from the SEZO AM analyser without the inlet external housing were excluded due to high air humidity. During the measurements, the air humidity was on average 76.56%; however, the rejected concentration values were always accompanied by humidity higher than 95%, at which the analyser was turned off. The addition of the outer inlet shell overcomes this inconvenience. Among the results obtained with the inlet sheath analyser, it was not necessary to discard any of the results of PM2.5 and PM10 concentrations due to high air humidity (Figure 12).
In addition, the average relative standard deviation for PM2.5 was relatively low and amounted to 9.6%. On the analysed day, 63% of the results of the SEZO AM with the inlet housing were lower than the concentrations measured by the EDM 180 (RSD 0.1–18.4%), and 37% of the results were higher (RSD 0.5–14.2%). For the results of PM2.5 concentrations obtained from the SEZO AM analyser, in which no correction factor and the addition of the inlet was applied, the RSD was more than two times higher and amounted to 22.1%.
The average relative standard deviation obtained for the PM10 measured using the SEZO AM device with the inlet sheath and the correction factor was 11.3. On the analysed day, 63% of the results of the SEZO AM with the inlet housing were lower than the concentrations measured by the EDM 180 (RSD 0.1–18.9%), and 37% of the results were higher (RSD 1.2–24.1%). The average RSD for PM10 concentrations measured by the SEZO AM in which no correction or new inlet was applied was equal to 27.5%. Moreover, it was found that the introduction of the outer inlet casing and the concentration correction factor of PM2.5 and PM10 allowed us to obtain a very similar share of PM2.5 in PM10, which was 88.0% for the EDM 180 and 87.0% for the modified SEZO AM.
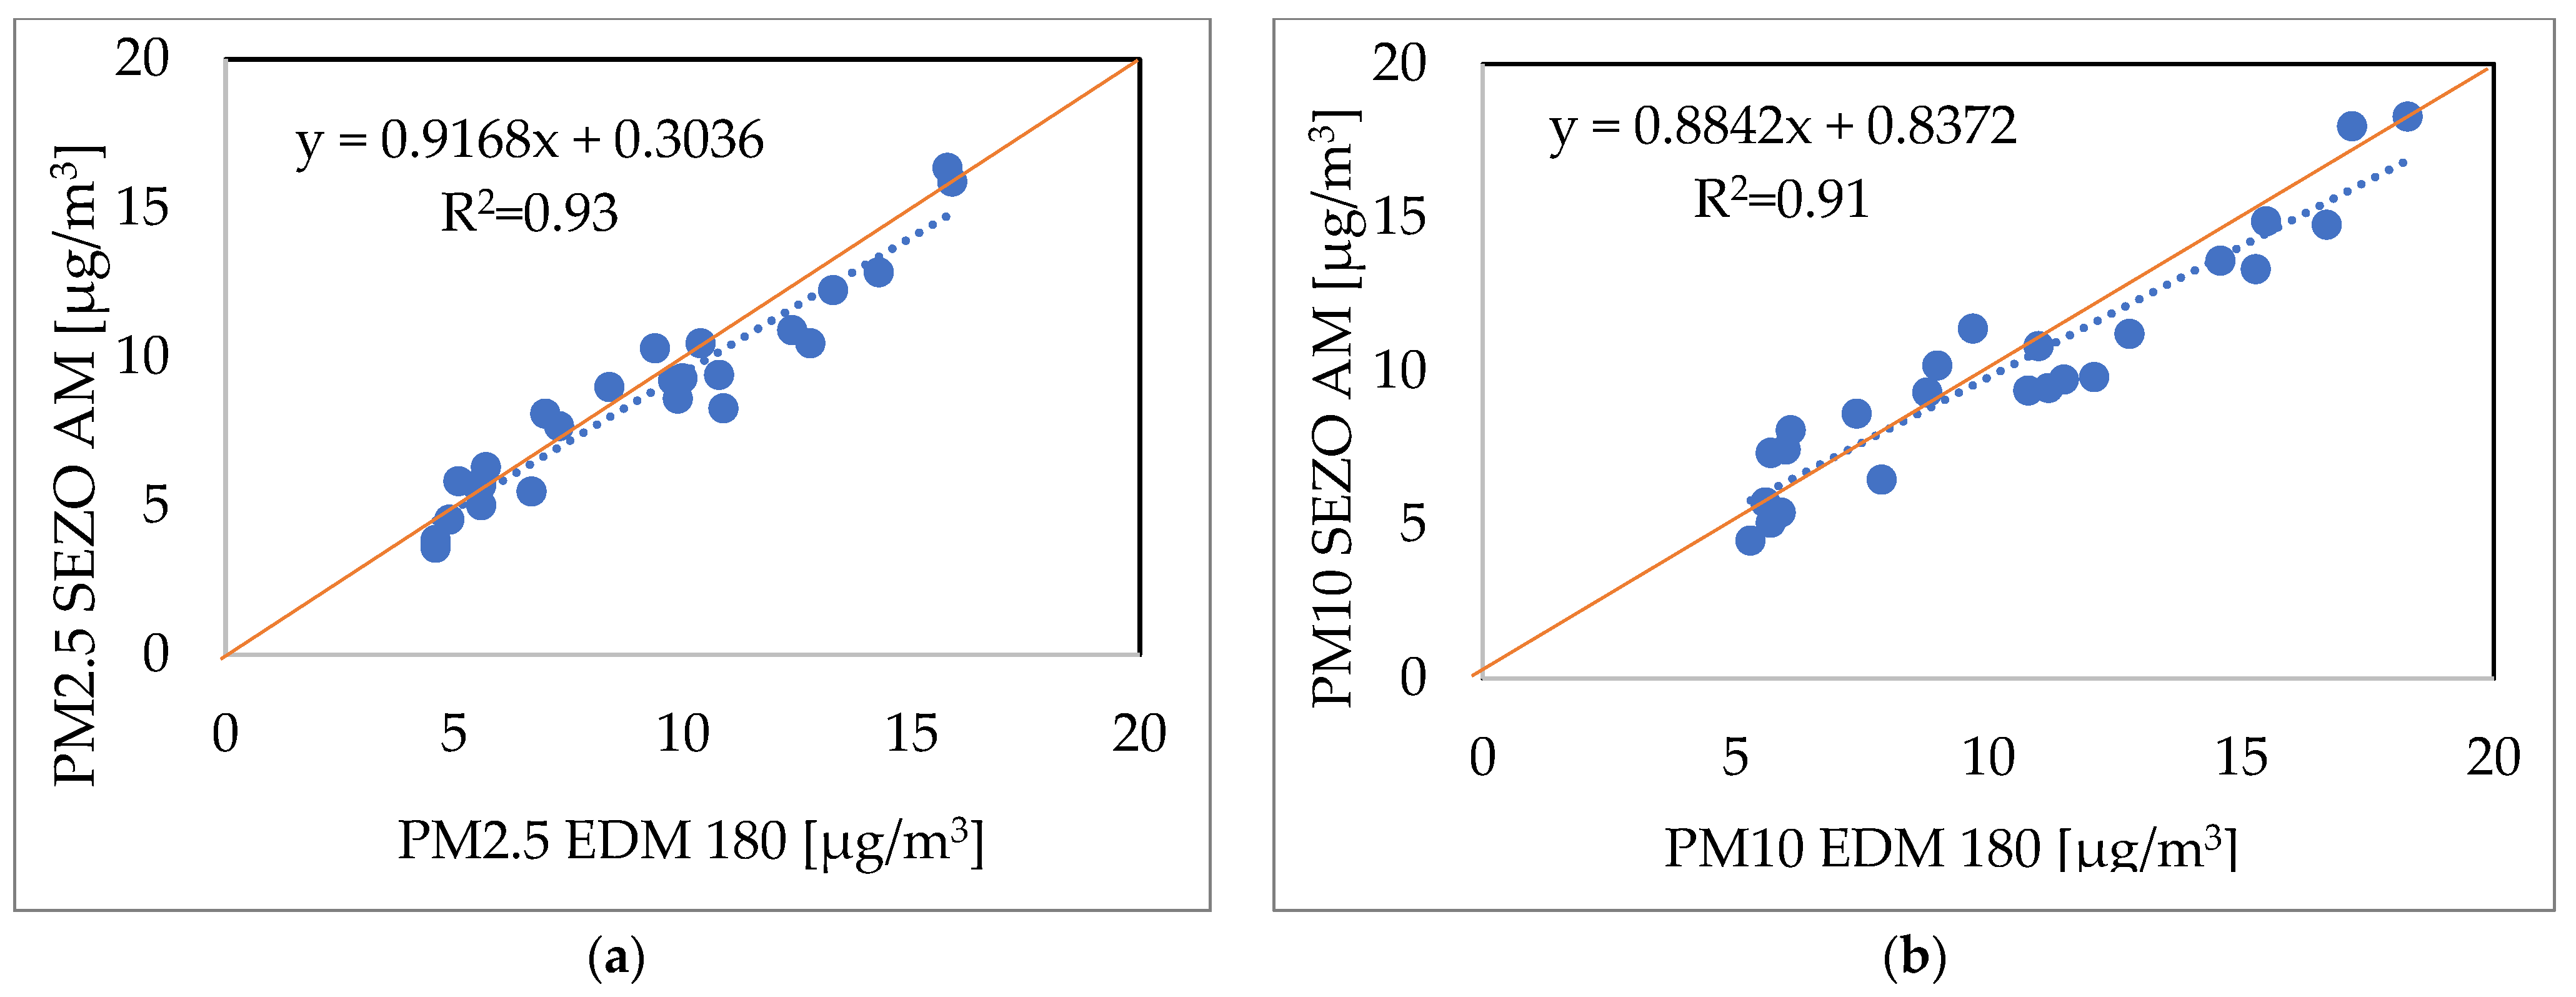
The application of the correction factor for PM2.5 and PM10 concentration measured with the SEZO AM analyser and the simultaneous addition of the outer inlet cover resulted in a very good match of the results with those obtained from the EDM 180 analyser (Figure 14). This contributed to the concordance of the results at the level of 93% for PM2.5 and 91% PM10, without discarding any results. The mean bias (MB) for PM2.5 was equal to 0.4 µg/m3, and for PM10 0.54 µg/m3. The Root Mean Square Error (RMSE) was 0.83 µg/m3 for PM2.5 and 1.17 µg/m3 for PM10, respectively.

4. Conclusions

The obtained results of intercalibration of the devices by SEZO (AM) and GRIMM (EDM 180) showed a statistically significant concordance, at the level of 78–94% for PM2.5 and 70–75% for PM10. The comparison of the two SEZO AM devices to a higher-class TSI OPS3330 reference in a measurement dust chamber showed a fit between 79% and 86% for PM2.5 and between 81% and 86% for PM10 and was satisfactory.
The relative standard deviation calculated for the SEZO AM method showed that during the wet period of the measurements (VIII-IX), the results obtained with the SEZO AM method were always lower than those obtained by the EDM 180 method. In the case of the drier period (III-IV), 59% of PM2.5 and 61% of PM10 concentration measured with the SEZO AM was lower than that obtained by the EDM 180 method. We hypothesize that during the period of increasing air humidity and/or in the periods when the volume of precipitation increases, the SEZO AM underestimates the concentration results, especially of larger PM10 particles. This may be due to washing away of the particles before they are measured by the analyser.
Some of the concentration results, especially in dry period, were higher than those obtained with the reference method (41% of PM2.5 and 39% of PM10). We hypothesise that this could be because of misinterpretation of water particles in the air as dust. However, this hypothesis requires confirmation in further measurements.
On the basis of the mean analysis error obtained thanks to the research conducted in the dust chamber with the use of the two SEZO AM analysers and the TSI OPS3330 reference method, the correction factor for PM2.5 and PM10 concentrations were determined (1.2 for PM2.5 and 1.16 for PM10). To prevent inlet against humid air, an inlet external cover has been added to the analyser housing. These two changes contributed to a two-fold reduction in the analysis error, both for PM2.5 (RSD 9.6%) and PM10 (RSD 11.3%). The concordance of the results was at the level of 93% for PM2.5 and 91% PM10, without discarding any data. The mean biases (MB) were also low, being 0.4 µg/m3 for PM2.5 and 0.54 µg/m3 for PM10. The Root Mean Square Error (RMSE) was 0.83 µg/m3 for PM2.5 and 1.17 µg/m3 for PM10, respectively.
Both intercalibrations, environment and laboratory, indicated the possibility of using the SEZO AM analyser to measure the concentration of PM2.5 and PM10 in the port atmosphere; however, further comparative analyses of the concentrations obtained simultaneously from several SEZO AM analysers are suggested in order to obtain better accuracy of the measurements. To improve the operation of the device in conditions of high air humidity, it would be reasonable to add an air heater track that would switch on, e.g., above 80% humidity.

Author Contributions

Conceptualisation, A.U.L.; data curation, M.M., M.K., B.L. and M.B.; formal analysis, M.M., M.B.; funding acquisition, A.U.L., M.K., B.L.; investigation, A.U.L., M.M., M.K., B.L., M.B.; methodology, M.K., B.L. and A.U.L.; project administration, A.U.L.; resources, A.U.L., M.K., B.L.; supervision, A.U.L.; validation, A.U.L. and M.K.; visualisation, M.M. and A.U.L.; writing—original draft, M.M., A.U.L.; writing—review and editing, A.U.L. All authors have read and agreed to the published version of the manuscript.

Funding

This research received no external funding.

Institutional Review Board Statement

Not applicable.

Informed Consent Statement

Not applicable.

Data Availability Statement

Not applicable.

Conflicts of Interest

The authors declare no conflict of interest.

Appendix A

Table A1. Outliers concentrations o PM2.5 and PM10 obtained with SEZO AM and EDM 180 methods which were rejected with the corresponding weather conditions.
DatePM2.5 (µg/m3)PM10 (µg/m3)T
(°C)
Rh
(%)
Ws (m/s)Dominant
Wind Directions
SEZO AMEDM 180SEZO AMEDM 180
11 March 202175.746.077.653.8−2.2–3.344.0–82.612.7 Atmosphere 13 00590 i001
16 March 202150.030.755.733.90.1–5.769.5–84.73.7 Atmosphere 13 00590 i002
25 March 202153.837.74.5–12.246.8–80.92.5 Atmosphere 13 00590 i003
31 March 202111.521.18.8–20.117.4–77.64.0 Atmosphere 13 00590 i004
9 April 20214.518.95.128.52.5–11.734.9–64.06.5 Atmosphere 13 00590 i005
14 April 202113.57.93.1–6.758.4–77.89.1 Atmosphere 13 00590 i006
17 April 20213.217.63.422.34.0–9.263.7–80.46.0 Atmosphere 13 00590 i007
18 April 20217.78.220.926.45.2–14.653.2–77.45.4 Atmosphere 13 00590 i008
21 April 20219.835.65.6–15.437.9–70.04.6 Atmosphere 13 00590 i009
28 April 202116.322.81.5–10.346.2–78.14.5 Atmosphere 13 00590 i010
6 August 20212.07.02.014.117.0–19.552.0–72.87.6 Atmosphere 13 00590 i011
15 August 20213.79.215.2–21.845.6–77.52.7 Atmosphere 13 00590 i012
17 August 20212.79.812.8–19.349.0–82.04.5 Atmosphere 13 00590 i013
23 August 20211.34.41.45.415.7–18.651.5–70.36.6 Atmosphere 13 00590 i014
5 September 20211.85.29.5–16.546.2–69.03.5 Atmosphere 13 00590 i015
6 September 20213.58.33.513.29.0–19.339.9–71.82.7 Atmosphere 13 00590 i016
7 September 20214.815.412.2–20.839.4–59.83.6 Atmosphere 13 00590 i017
19 September 20212.96.82.98.511.0–12.855.5–68.88.3 Atmosphere 13 00590 i018

References

  1. Eyring, V.; Isaksen, I.S.A.; Berntsen, T.; Collins, W.J.; Corbett, J.J.; Endresen, O.; Grainger, R.G.; Moldanova, J.; Schlager, H.; Stevenson, D.S. Transport impacts on atmosphere and climate: Shipping. Atmos. Environ. 2010, 44, 4735–4771. [Google Scholar] [CrossRef]
  2. Stockholm Convention on Persistent Organic Pollutants (POPs), 2011, UNEP/POPS/COP.5/INF/27. Available online: https://www.pops-gmp.org/res/file/UNEP-POPS-COP_5-INF-27.pdf (accessed on 6 March 2022).
  3. McLean, C.; Shao, G. Simulation in Shipyards: Simulation of Shipbuilding Operations; IIEE Computer Society: Washington, DC, USA, 2001; pp. 870–876. [Google Scholar] [CrossRef]
  4. Corbett, J.J.; Fischbeck, P.S.; Pandis, S.N. Global Nitrogen and Sulfur Emission Inventories for Oceangoing Ships. J. Geophys. Res. Atmos. 1999, 104, 3457–3470. [Google Scholar] [CrossRef]
  5. Puig, M.; Wooldridge, C.; Darbra, R.M. Identification and selection of Environmental Performance Indicators for sustainable port development. Mar. Pollut. Bull. 2014, 81, 124–130. [Google Scholar] [CrossRef] [PubMed]
  6. Bailey, D.; Solomon, G. Pollution Prevention at Ports: Clearing the Air. Environ. Impact Assess. Rev. 2004, 24, 751–752. [Google Scholar] [CrossRef]
  7. Wang, H.; Shi, G.Y.; Zhang, X.Y.; Gong, S.L.; Tan, S.C.; Chen, B.; Che, H.Z.; Li, T. Mesoscale modelling study of the interactions between aerosols and PBL meteorology during a haze episode in China Jing–Jin–Ji and its near surrounding region—Part 2: Aerosols’ radiative feedback effects. Atmos. Chem. Phys. 2015, 15, 3277–3287. [Google Scholar] [CrossRef] [Green Version]
  8. Lewandowska, A.; Falkowska, L.; Murawiec, D.; Pryputniewicz, D.; Burska, D.; Bełdowska, M. Elemental and organic carbon in aerosols over urbanized coastal region (southern Baltic Sea, Gdynia). Sci. Total Environ. 2010, 408, 4761–4769. [Google Scholar] [CrossRef] [PubMed]
  9. Duhl, T.R.; Clements, N.; Mladenov, N.; Cawley, K.; Rosario-Ortiz, F.L.; Hannigan, M.P. Natural and unnatural organic matter in the atmosphere: Recent perspectives on the high molecular weight fraction of organic aerosol. Am. Chem. Soc. 2014, 5, 87–111. [Google Scholar]
  10. Witkowska, A.; Lewandowska, A.; Falkowska, L.M. Parallel measurements of organic and elemental carbon dry (PM1, PM2.5) and wet (rain, snow, mixed) deposition into the Baltic Sea. Mar. Pollut. Bull. 2016, 104, 303–312. [Google Scholar] [CrossRef]
  11. Wiśniewska, K.; Lewandowska, A.U.; Staniszewska, M. Air quality at two stations (Gdynia and Rumia) located in the region of Gulf of Gdansk during periods of intensive smog in Poland. Air Qual. Atmos. Health 2019, 12, 879–890. [Google Scholar] [CrossRef] [Green Version]
  12. IPCC. Summary for Policymakers. In Global Warming of 1.5 °C. An IPCC Special Report on the Impacts of Global Warming of 1.5 °C above Pre-Industrial Levels and Related Global Greenhouse Gas Emission Pathways, in the Context of Strengthening the Global Response to the Threat of Climate Change, Sustainable Development, and Efforts to Eradicate Poverty; Mas-son-Delmotte, V., Zhai, P., Pörtner, H.-O., Roberts, D., Skea, J., Shukla, P.R., Pirani, A., Moufouma-Okia, W., Péan, C., Pidcock, R., et al., Eds.; IPCC: Geneva, Switzerland, 2018. [Google Scholar]
  13. Cavalli, F.; Facchini, M.C.; Decesari, S. Advances in characterization of size-resolved organic matter in marine aerosol over the North Atlantic. J. Geophys. Res. Atmos. 2004, 109, 1–14. [Google Scholar] [CrossRef]
  14. O’Dowd, C.D.; de Leeuw, G. Marine aerosol production: A review of the current knowledge. Philos. Trans. R. Soc. A 2007, 365, 1753–1774. [Google Scholar] [CrossRef] [Green Version]
  15. Hienola, A.I.; Pietikainen, J.P.; Jacob, D.; Pozdun, R.; Petaj, T.; Hyvarinen, A.P.; Sogacheva, L.; Kerminen, V.M.; Kulmala, M.; Laaksonen, A. Black carbon concentration and deposition estimations in Finland by the regional aerosol–climate model REMO-HAM. Atmos. Chem. Phys. 2013, 13, 4033–4055. [Google Scholar] [CrossRef] [Green Version]
  16. Lewandowska, A.U.; Falkowska, L. High concentration episodes of PM10 in the air over the urbanized coastal zone of the Baltic Sea (Gdynia-Poland). Atmos. Res. 2013, 120–121, 55–67. [Google Scholar] [CrossRef]
  17. US EPA. Integrated Science Assessment for Particulate Matter, Includes Errata Sheet Created on 2/10/2010; Raport EPA/600/R-08/139F; United States Environmental Protection Agency, Research Triangle Park: Durham, NC, USA, 2009; pp. 2–30.
  18. Hassanvand, M.S.; Naddafi, K.; Faridi, S.; Nabizadeh, R.; Hossein Sowlat, M.; Momeniha, F.; Gholampour, A.; Arhami, M.; Kashani, H.; Zare, A.; et al. Characterization of PAHs and metals in indoor/outdoor PM10/PM2.5/PM1 in a retirement home and a school dormitory. Sci. Total Environ. 2015, 527–528, 100–110. [Google Scholar] [CrossRef] [PubMed]
  19. Kennedy, I.M. The health effects of combustion-generated aerosols. Proc. Combust. Inst. 2007, 31, 2757–2770. [Google Scholar] [CrossRef]
  20. IARC. Outdoor Air Pollution a Leading Environmental Cause of Cancer Deaths, Press Release; International Agency for Research on Cancer, World Health Organization: Lyon, France, 2013; No. 221; pp. 1–4. [Google Scholar]
  21. Loomis, D.; Grosse, Y.; Lauby-Secretan, B.; El Ghissassi, F.; Bouvard, V.; Benbrahim-Tallaa, L.; Guha, N.; Baan, R.; Mattock, H.; Straif, K. The carcinogenicity of outdoor air pollution. Lancet Oncol. 2013, 14, 1262–1263. [Google Scholar] [CrossRef]
  22. Saxe, H.; Larsen, T. Air pollution from ships in three Danish ports. Atmos. Environ. 2004, 38, 4057–4067. [Google Scholar] [CrossRef]
  23. Sorte, S.; Rodrigues, V.; Borrego, C.; Monteiro, A. Impact of harbour activities on local air quality: A review. Environ. Poll. 2020, 257, 113542. [Google Scholar] [CrossRef]
  24. Chatzinikolaou, S.D.; Oikonomou, S.D.; Ventikos, N.P. Health externalities of ship air pollution at port—Piraeus port case study. Transp. Res. Part D Transp. Environ. 2015, 40, 155–165. [Google Scholar] [CrossRef]
  25. Gillingham, K.; Huang, P. Racial Disparities in the Health Effects from Air Pollution: Evidence from Ports; National Bureau of Economic Research: Cambridge, MA, USA, 2021; Volume 29108, pp. 5–8. [Google Scholar] [CrossRef]
  26. Wang, X.; Shen, Y.; Lin, Y.; Pan, J.; Zhang, Y.; Louie, P.K.K.; Li, M.; Fu, Q. Atmospheric pollution from ships and its impact on local air quality at a port site in Shanghai. Atmos. Chem. Phys. 2019, 19, 6315–6330. [Google Scholar] [CrossRef] [Green Version]
  27. Corbett, J.J.; Winebrake, J.J.; Green, E.H.; Kasibhatla, P.; Eyring, V.; Lauer, A. Mortality from Ship Emission: A Global Assessment. Environ. Sci. Technol. 2007, 41, 8512–8518. [Google Scholar] [CrossRef] [PubMed]
  28. Bin, L.; Cherng-Yuan, L. Compliance with international emission regulations: Reducing the air pollution from merchant vessels. Mar. Policy 2005, 30, 221–224. [Google Scholar] [CrossRef]
  29. Han, C.-H. Strategies to Reduce Air Pollution in Shipping Industry. Asian J. Shipp. Logist. 2010, 26, 7–29. [Google Scholar] [CrossRef] [Green Version]
  30. Harrison, D.; Radov, D.; Patchett, J.; Klevnas, P.; Lenkoski, A.; Reschke, P.; Foss, A. European Commission, Directorate General Environment. In Economic Instruments for Reducing Ship Emissions in the European Union; Nera Economin Consulting: London, UK, 2005; pp. 4–78. [Google Scholar]
  31. Smith, T.W.P.; Jalkanen, J.P.; Anderson, B.A.; Corbett, J.J.; Faber, J.; Hanayama, S.; O’Keeffe, E.; Parker, S.; Johansson, L.; Aldous, L.; et al. Third IMO GHG Study 2014; International Maritime Organization: London, UK, 2014; pp. 2, 117–124. [Google Scholar]
  32. Sofiev, M.; Winebrake, J.J.; Johansson, L.; Carr, E.W.; Prank, M.; Soares, J.; Vira, J.; Kouznetsov, R.; Jalkanen, J.-P.; Corbett, J.J. Cleaner fuels for ships provide public health benefits with climate tradeoffs. Nat. Commun. 2018, 9, 406. [Google Scholar] [CrossRef] [PubMed] [Green Version]
  33. Attah, E.E.; Bucknall, R. An analysis of the energy efficiency of LNG ships powering options using the EEDI. Ocean Eng. 2015, 110, 62–74. [Google Scholar] [CrossRef]
  34. Lindstad, E.; Ingebrigtsen, B.T. Potential power setups, fuels and hull designs capable of satisfying future EEDI requirements. Transp. Res. Part D Transp. Environ. 2018, 63, 276–290. [Google Scholar] [CrossRef]
  35. Holnicki, P.; Kałuszko, A.; Stankiewicz, K. Supporting the Management of Atmospheric Air Quality in the City; Research Report; Polish Academy of Science, Systems Research Institute: Warsaw, Poland, 2014; pp. 26–39. [Google Scholar] [CrossRef]
  36. Bouzarovski, S. Retrofitting the City: Residential Flexibility, Resilience and the Built Environment; Tauris, I.B., Ed.; Bloomsbury Publishing: London, UK, 2015; p. 288. [Google Scholar]
  37. Bocheński, T.; Palmowski, T.; Studzieniecki, T. The Development of Major Seaports in the Context of National Maritime Policy. The Case Study of Poland. Sustainability 2021, 13, 12883. [Google Scholar] [CrossRef]
  38. Port of Gdynia Authority. Available online: https://www.wnp.pl/tematy/zarzad-morskiego-portu-gdynia,12967.html (accessed on 9 January 2022).
  39. Spielvogel, J.; Hartstock, S.; Grimm, H. New methods and standards for fine dust. J. Phys. Conf. Ser. 2009, 170, 012024. [Google Scholar] [CrossRef]
  40. Gilliam, J.; Hall, E. Reference and Equivalent Methods Used to Measure National Ambient Air Quality Standards (NAAQS) Criteria Air Pollutants; U.S. Environmental Protection Agency: Washington, DC, USA, 2016; EPA/600/R-16/139; Volume I, p. 28.
  41. SEZO AM. Available online: https://sezo.pl/ (accessed on 15 January 2022).
  42. MISTYWEST. Available online: https://www.mistywest.com/posts/teardown-sensirion-particle-matter-sensor/ (accessed on 30 January 2022).
  43. Masic, A.; Pikula, B.; Bibić, D. Mobile Measurements of Particulate Matter Concentrations in Urban Area. In Proceedings of the 28th International DAAAM Symposium, Zadar, Croatia, 8–11 November 2017. [Google Scholar]
  44. Rogulski, M.; Badyda, A. Investigation of low-cost and optical particulate matter sensors for ambient monitoring. Atmosphere 2020, 11, 1040. [Google Scholar] [CrossRef]
  45. Borrego, C.; Costa, A.M.; Ginja, J.; Amorim, M.; Coutinho, M.; Karatzas, K.; Sioumis, T.; Katsifarakis, N.; Konstantinidis, K.; De Vito, S.; et al. Assessment of air quality microsensors versus reference methods: The EuNetAir joint exercise. Atmos. Environ. 2016, 147, 246–263. [Google Scholar] [CrossRef] [Green Version]
  46. Siudek, P.; Falkowska, L.; Lewandowska, A.; Pryputniewicz, D.; Bełdowska, M.; Gic, P. Chosen anions and cations in the precipitation over coastal zone of the Gulf of Gdańsk. Oceanol. Hydrobiol. Stud. 2006, 35, 39–53. [Google Scholar]
  47. Cerqueira, M.; Pio, C.; Legrand, M.; Puxbaum, H.; AnneKasper-Giebl, A.; Afonso, J.; Preunkert, S.; Gelencsér AFialho, P. Particulate carbon in precipitation at European background sites. J. Aerosol Sci. 2010, 41, 51–61. [Google Scholar] [CrossRef] [Green Version]
  48. Yang, F.; Mitra, P.; Zhang, L.; Prak, L.; Verhertbruggen, Y.; Kim, J.S.; Sun, L.; Zheng, K.; Tang, K.; Auer, M.; et al. Engineering secondary cell wall deposition in plants. Plant Biotechnol. J. 2013, 11, 325–335. [Google Scholar] [CrossRef] [PubMed] [Green Version]
  49. Pan, Y.P.; Wang, Y.S. Atmospheric wet and dry deposition of trace elements at 10 sites in Northern China. Atmos. Chem. Phys. 2015, 15, 951–972. [Google Scholar] [CrossRef] [Green Version]
  50. Loosmore, G.A.; Cederwall, R.T. Precipitation scavenging of atmospheric aerosols for emergency response applications: Testing an updated model with new real-time data. Atmos. Environ. 2004, 38, 993–1003. [Google Scholar] [CrossRef]
  51. Skalska, K.; Lewandowska, A.U.; Staniszewska, M.; Reindl, A.; Witkowska, A.; Falkowska, L. Sources, deposition flux and carcinogenic potential of PM2.5-bound Polycyclic Aromatic Hydrocarbons in the coastal zone of the Baltic Sea (Gdynia, Po-land). Air Qual. Atmos. Health 2019, 12, 1291–1301. [Google Scholar] [CrossRef] [Green Version]
  52. Buch, J.K.; Lewandowska, A.U.; Staniszewska, M.; Wiśniewska, K.A.; Bartkowski, K.V. The influence of transport on PAH’s and other carbonaceous species’ (OC, EC) concentration in aerosols in the coastal zone of the Gulf of Gdansk (Gdynia). Amosphere 2021, 12, 1005. [Google Scholar] [CrossRef]
  53. Malinowska, M.; Lewandowska, A.U.; Bielawska, M. The influence of agriculture on the chemical composition of aerosols in the coastal zone of the Southern Baltic Sea (Gdynia). Ecocycles 2021, 7, 23–34. [Google Scholar] [CrossRef]
  54. Lewandowska, A.U.; Bełdowska, M.; Witkowska, A.; Falkowska, L.; Wiśniewska, K. Mercury bonds with carbon (OC and EC) in small aerosols (PM1) in the urbanized coastal zone of the Gulf of Gdansk (southern Baltic). Ecotoxicol. Environ. Saf. 2018, 157, 350–357. [Google Scholar] [CrossRef]
  55. Lewandowska, A.U.; Staniszewska, M.; Witkowska, A.; Machuta, M.; Falkowska, L. Benzo(a)pyrene parallel measure-ments in PM1 and PM2.5 in the coastal zone of the Gulf of Gdansk (Baltic Sea) in the heating and non-heating seasons. Environ. Sci. Pollut. Res. 2018, 25, 19458–19469. [Google Scholar] [CrossRef] [Green Version]
  56. Ravindra, K.; Sokhi, R.; Van Grieken, R. Atmospheric polycyclic aromatic hydrocarbons: Source attribution, emission factors and regulation. Atmos. Environ. 2008, 42, 2895–2921. [Google Scholar] [CrossRef] [Green Version]
  57. TSI Inc. Estimation of Mass with the Model 3321 APS Spectrometer; Application Note APS-001. Available online: https://tsi.com/getmedia/0896095e-3b06-4fb2-a421-837a51a1962a/APS-001_Estimation_of_Mass_with_Model_3321_APS-A4?ext=.pdf (accessed on 6 March 2022).
  58. SOFTBLUE. Available online: https://softblue.pl/en/products/research-and-development-center/ (accessed on 30 January 2022).
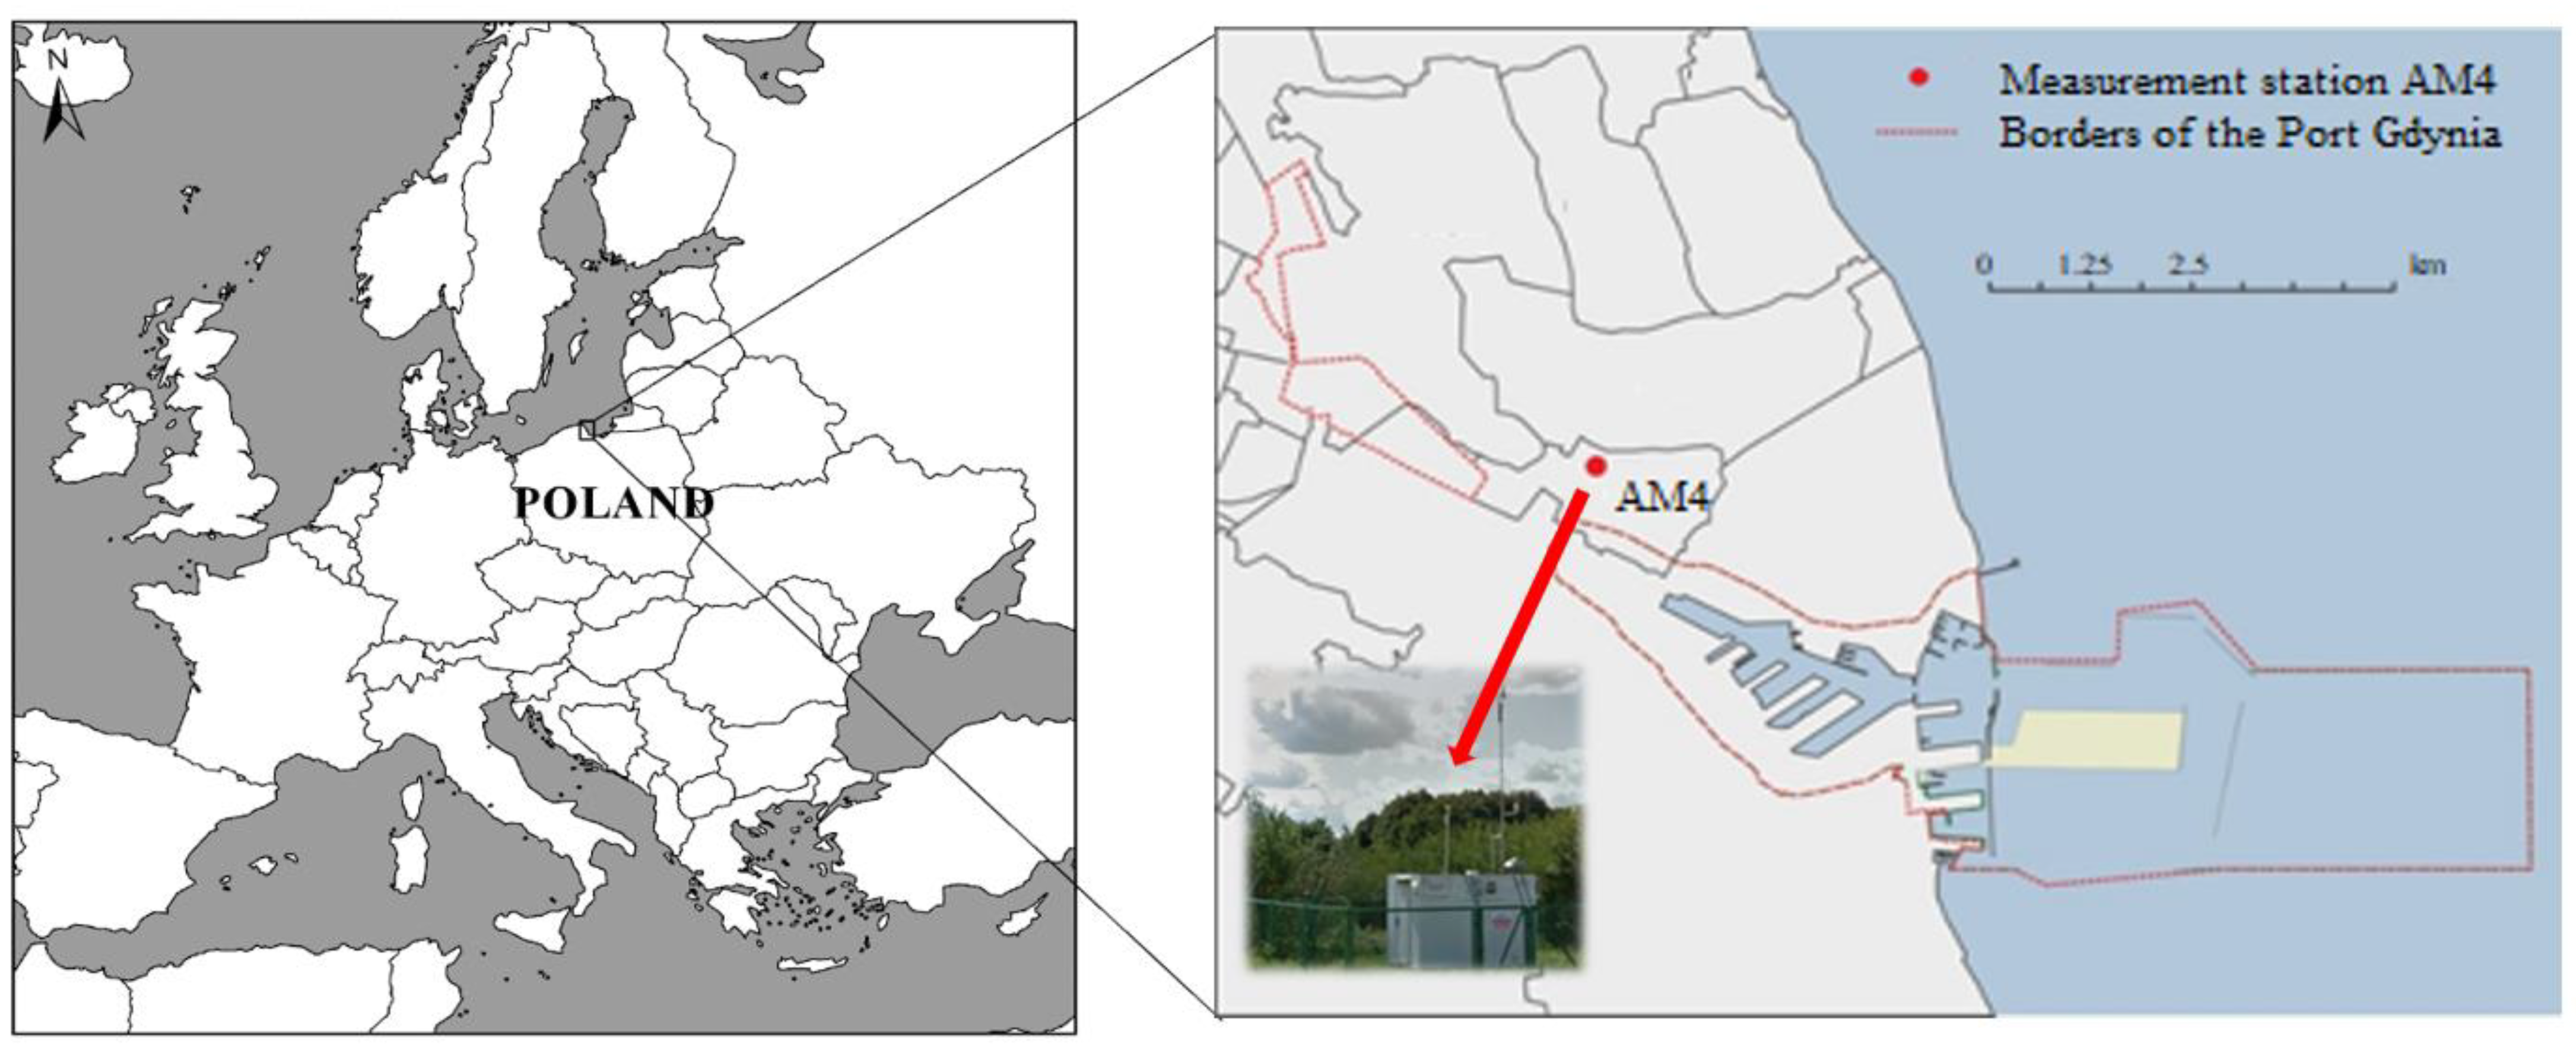
Figure 1. Location of the measurement point in Gdynia Pogórze and the boundaries of the port in Gdynia (www.dziennikbaltycki.pl, accessed on 15 January 2022).
Atmosphere 13 00590 g001
Figure 2. EDM 180 GRIMM (www.grimm-aerosol.com, accessed on 3 April 2022).
Atmosphere 13 00590 g002
Figure 3. General appearance of the SEZO AM device in polycarbonate housing [41] (a) and device without housing, presenting the air inlet/outlet (b).
Atmosphere 13 00590 g003
Figure 4. Sensirion SPS30 module scheme [42].
Atmosphere 13 00590 g004
Figure 5. Functional block diagram of the optical PM sensor [43].
Atmosphere 13 00590 g005
Figure 6. The variability of the daily concentration values of PM2.5 and PM10 in the period from 1 March to 30 April 2021 (a) and from 1 August to 30 September 2021 (b). The green colour represents the concentrations measured with the EDM 180 analyser, and the blue colour the concentrations obtained from the SEZO AM.
Atmosphere 13 00590 g006
Figure 7. Statistical characteristics of the results of (a) PM2.5 and (b) PM10 concentrations measured in the period from 1 March to 30 April 2021 and for (c) PM2.5 and (d) PM10 in August–September at the AM4 station in Gdynia using the SEZO AM and EDM 180 methods.
Atmosphere 13 00590 g007
Figure 8. Relationship between the concentration values measured with the SEZO AM and EDM 180 analysers for (a) PM2.5 and (b) PM10 in March–April and for (c) PM2.5 and (d) PM10 in August–September. Positive (Direct) Relationship is marked with the red line.
Atmosphere 13 00590 g008
Figure 9. Relative standard deviation RSD (%) calculated for (a) PM2.5 and (b) PM10 concentration in March–April and for (c) PM2.5 and (d) PM10 concentration in August–September calculated assuming that the real value are the results obtained from the reference device EDM 180, and the measured values are the results from SEZO AM.
Atmosphere 13 00590 g009
Figure 10. SEZO AM sensors in the dust chamber (a) and pneumatic track, reference device, and necessary accessories for the test in the dust chamber (b).
Atmosphere 13 00590 g010
Figure 11. Variability of the concentration of PM2.5 (a) and PM10 (b) as a function of time (s) obtained using the SEZO AM method and the reference TSI OPS3330 method during tests in a dust chamber.
Atmosphere 13 00590 g011
Figure 12. SEZO AM with installed outer sheath of the air inlet (photo from WIRAN resources).
Atmosphere 13 00590 g012
Figure 13. The variability of the hourly concentration values of PM2.5 (a) and PM10 (b) obtained on 23 February 2022 for EDM 180 analyser, and for two SEZO AM analysers (with and without modified inlet and correction factor).
Atmosphere 13 00590 g013
Figure 14. Relationship between the hourly concentration values measured on 23 February 2022 with the SEZO AM with modified inlet and correction factor and EDM 180 analyser for (a) PM2.5 and (b) PM10. Positive (Direct) Relationship is marked with the red line.
Atmosphere 13 00590 g014
Table 1. Basic specification of AM and EDM 180 devices.
ParameterAM by SEZOEDM 180 by GRIMM
Particle size ranges (µm)0.30 to 100.25 to 32
Optical cell (nm)Diode laser; 660Diode laser; 660
Minimum interval sampling1 s1 s
Temperature ranges (°C)−10 to +60−20 to +50
Humidity ranges (%)0 to 9520 to 80
Dimensions (cm)11.3 × 8.0 × 6.026.6 × 48.3 × 36.4
Table 2. Estimators of PM2.5 and PM10 concentrations (µg/m3) and meteorological parameters measured by SEZO AM and EDM 180 in Gdynia Port in the period 1 March–30 April 2021 and 1 August–30 September 2021.
MonthCharacteristic of ParametersSEZO AMEDM 180Meteorological Parameters
PM2.5PM10PM2.5PM10Temperature (°C)Relative Humidity (%)Wind Speed (m/s)Dominant Wind Direction
March–AprilNumber of measurements (N)17,10014405.0 (−3.8–20.1)64.9 (17.4–87.0)5.8 (2.2–16.0) Atmosphere 13 00590 i019
Average (Min–Max) (µg/m3)15.4 (2.6–75.5)16.6 (3.2–77.6)15.4 (5.6–46.0)19.5 (6.3–53.8)
Median (g/m3)9.710.512.414.9
August-SeptemberNumber of measurements (N)85,859146416.0 (8.3–27.8)70.1 (34.3–90.9)4.4 (1.8–13.6) Atmosphere 13 00590 i020
Average (Min–Max) (µg/m3)5.7 (1.3–19.0)6.1 (1.4–19.0)9.6 (4.4–21.6)12.5 (5.4–32.0)
Median (µg/m3)4.64.78.910.9
Table 3. Determination coefficient (R2) for each of the SEZO sensors against the reference analysers in the dust chamber.
FractionSEZO 013-12A-0001SEZO 013-12A-0003
PM2.50.860.79
PM100.860.81
Publisher’s Note: MDPI stays neutral with regard to jurisdictional claims in published maps and institutional affiliations.