Article

The Benefits of the Clean Heating Plan on Air Quality in the Beijing–Tianjin–Hebei Region

1
Policy Research Center for Environment and Economy, Ministry of Ecology and Environment of the People’s Republic of China, Beijing 100029, China
2
Research Center for Environmental & Ecology Strategic Planning and Regional Development, Policy Research Center for Environment and Economy, Ministry of Ecology and Environment of the People’s Republic of China, Beijing 100029, China
3
Laboratory for Climate and Ocean-Atmosphere Studies, Department of Atmospheric and Oceanic Sciences, School of Physics, Peking University, Beijing 100069, China
4
State Key Laboratory of Severe Weather & Key Laboratory of Atmospheric Chemistry of CMA, Chinese Academy of Meteorological Sciences, Beijing 100081, China
5
National Institute of Natural Hazards, Ministry of Emergency Management of China, Beijing 100085, China
*
Author to whom correspondence should be addressed.
Atmosphere 2022, 13(4), 555; https://doi.org/10.3390/atmos13040555
Submission received: 3 March 2022 / Revised: 25 March 2022 / Accepted: 29 March 2022 / Published: 30 March 2022
(This article belongs to the Special Issue Advances in Air Pollution Meteorology)

Abstract

:
Coal-to-gas/electricity conversion (hereafter referred to as CTGC/CTEC) as the core project of a clean heating campaign has been widely adopted to replace and reduce the combustion of residential coal in Northern China since 2017. In this study, simulations based on the WRF-Chem model were carried out to quantitatively assess the impacts of the CTGC/CTEC project on air quality in the Beijing–Tianjin–Hebei (BTH) region. It was found that the CTGC/CTEC projects exert a remarkable effect on improving the air quality in the BTH region, especially in the plain area. The maximum decrease in the concentrations of PM2.5 and PM10 averaged during January can reach 30 and 40 μg/m3, respectively. In addition, the spillover effects due to CTGC/CTEC projects are rather small; that is, the local reduced emissions tend to provide more benefit to the local air quality but less for its surrounding regions. It is also noteworthy that the effects due to meteorological condition changes are comparable with, or even larger, than those due to CTGC/CTEC projects, which are not spatially uniform for the BTH region among various cities. Overall, these results not only demonstrate the effectiveness of CTGC/CTEC projects on air-quality improvement in the BTH region, but also indicate the importance of meteorological conditions in modulating the local air quality. To sustain better air quality in the future, residential coal replacement, all over China, can be further promoted. In addition, continued policy refinement can be essential for the nationwide implementation of clean heating projects.

1. Introduction

With the rapid pace of industrialization and urbanization in China, air pollution has become an environmental challenge during the past several decades, especially for the Beijing–Tianjin–Hebei (BTH) region. In particular, the seriously deteriorated air quality tends to increase the risk of airborne diseases and bring a series of socioeconomic problems (e.g., the rise of death and disease burden, the loss of life expectancy [1], and a reduction in labor supply [2], impeding the sustainable development of China [3,4]. In recent years, the prevention and control of air pollution has been a national priority [5], and a tremendous improvement in air quality has been achieved with the firm implementation of various measures [6,7,8,9] that were formulated in the public documents (e.g., the “Three-year Action Plan for defending blue sky”) released by the State Council. For the BTH region, evident improvements have been reported, with a sharp decline in fine particulate matter (PM2.5) from 2015 to 2019; the annual mean mass concentration of PM2.5 for Beijing has decreased from 80.6 μg/m3 to 42 μg/m3 in the meantime, but is still beyond the secondary class standard in China’s new National Ambient Air Quality Standards (NAAQS, GB3095-2012).
It is believed that the occurrence of severe air pollution is mainly caused by the accumulation of heavy anthropogenic emissions and unfavorable synoptic conditions. Considering the controllability of anthropogenic emissions and the importance of heat planning [10], China has been improving air quality by mitigating coal burning, reconstructing key industries, accelerating vehicle-related pollutant control, and widening the use of clean energy, etc. [11,12]. Among those stringent emission-control strategies, mitigating the coal consumption of various emission sectors is one of the most significant ways to cut down air pollutants, since China is a typical coal-intensive country and coal combustion is responsible for the emissions of major air pollutants; as reported in Ma et al. [13], coal accounts for 79, 54, 40, 35, 40, and 17% of the SO2, NOx, PM10, PM2.5, black carbon (BC), and organic carbon (OC) emissions in China, respectively.
In particular, coal used to be the dominant fuel source for residential winter heating in northern China, contributing a large number of local pollutant emissions [14]. Thus, residential coal combustion (RCC) is recognized as a major contributor to PM2.5 during the winter season for northern cities. Different from the industry and power-related coal combustion, the inefficiency of RCC, low emission height (i.e., air pollutants are more likely to be emitted near ground level), lack of pollutant-abatement facilities, and varied coal and stove types tend to result in heavier emissions and larger adverse environmental and health effects for per-unit standard coal consumption; the PM2.5 emission rates per gram of coal can be 100 times larger than those of coal-fired power plants [15,16]. More importantly, household coal burning can cause severe indoor-air pollution, which tends to pose stronger health damage compared with outdoor-air pollution [14]. A series of studies have identified the potential effect of RCC on air quality in China. It was reported that RCC contributed 46% of the monthly averaged concentration of PM2.5 over the BTH region, and Langfang was the city that was most affected based on the WRF-CMAQ simulations [16]. Xue et al. [17] pointed out that the RCC emissions in Beijing during the heating season of 2012 accounted for 11.6, 27.5, 2.8, and 7.3% of the mass concentrations of local PM10, SO2, NOx, and CO, respectively. Using the WRF-Chem model, Li et al. [18] confirmed that RCC emissions play an important role in the haze formation in BTH, contributing about 23.1% of PM2.5 and 42.6% of SO2 during a persistent air-pollution episode from 9 to 25 January 2014. Also noticed was that the fractional contributions of residential sources on PM2.5 for 25 Chinese provincial capitals and municipalities range between 9.6–27%, which are comparable with those for industrial sources (i.e., 25–38.6%) [19]. In general, the above-mentioned results emphasize the necessity of mitigating RCC emissions to improve the air quality in China.
Since the impacts of the residential sector on ambient air quality in northern China have been well-recognized, a series of actions have been implemented to mitigate RCC-related emissions. In 2017, the China State Council, the National Development and Reform Commission, the Ministry of Environment and Ecology, and other related departments issued a series of governmental documents related to clean heating. Specifically, the campaign, i.e., Clean Heating Plan for Northern China in Winter (2017–2021), was launched to replace and reduce the combustion of residential coal; the coal-to-gas/electricity conversion (CTGC/CTEC, referring to the substitution of pipeline-based natural gas (electricity)) has been the most widely adopted measure for clean heating (note that alternative fuels, e.g., biomass [20] and hydrogen [21], are not adopted), focusing on the “Atmospheric Pollution Transmission Channel City” (2 + 26 cities, including two province-level municipalities, i.e., Beijing and Tianjin, with an additional 26 prefecture-level cities). Clean heating penetration was targeted to reach 50% by 2019 and increase to 70% by 2021 for the northern China. In addition, “The 3-Year Action Plan for Defending the Blue Sky” announced by the State Council also emphasized the importance of CTGC and CTEC projects. It was reported that the concentration of PM2.5 can be reduced significantly with a 60% substitution of residential solid fuels in 2021, as inferred from the statistical regression model [22]. Based on questionnaire surveys, interviews, and field tests, Li et al. [23] pointed out that improving thermal efficiency through natural-gas utilization and implementing an energy-saving retrofit of rural housing can yield benefits for people and the environment in rural areas of northern China. It should also be noted that the CTGC policy tends to reduce SO2, NO2, PM10, PM2.5, and CO by 12.08%, 4.89%, 13.07%, 11.94%, and 11.10% per year, respectively, based on difference-in-difference analysis [24]. Overall, the benefits of the clean heating campaign have been investigated mainly based on statistical analyses, and there have been few studies focusing on the efficiency of the above-mentioned policies for improving the air quality based on the physicochemical models. In general, this study aims not only to evaluate the effectiveness of CTGC/CTEC projects on air-quality improvement in the BTH region, but also to indicate the importance of meteorological conditions in modulating the local air quality. Thus, the practical reduction in residential coal combustion in the BTH region was quantified based on the panel data generated by the mid-term assessment of the Clean Heating Plan for Northern China in Winter led by the National Energy Administration. The WRF-Chem model was then used to assess the contribution of the relevant policy on improving the air quality in the BTH region during the winter season. More importantly, this study tries to propose some helpful advice on the implementation of the CTGC/CTEC project. Data and methodology, including the WRF-Chem model’s configuration and design, are described in Section 2. Section 3 presents the simulation results. Finally, conclusions and discussions are given in Section 4.

2. Data and Methodology

2.1. WRF-Chem Model and Configurations

WRF-Chem is a commonly used online coupled air-quality numerical model, which was developed and supported by the National Oceanic and Atmospheric Administration (NOAA), National Center for Atmospheric Research (NCAR), and other organizations or institutions. Version 3.9.1 of the WRF-Chem model was employed to interpret the practical contributions of CTGC/CTEC policy to the mitigation of air pollution in the BTH region. In this study, three nested domains were configured and simulated. A coarse-grid domain with a horizontal resolution of 30 km × 30 km, covering most of China and part of Asia, was adopted. The middle domain aimed to cover northern China with a resolution of 10 km × 10 km. At a regional level, a fine-grid domain with a resolution of 3.3 km × 3.3 km was used and covered the BTH region and some surrounding areas (see Figure 1 for more details). Note that all of the following analyses were based on the outputs from the inner domain simulations. In the vertical direction, 35 vertical levels extending from the surface to 50 hPa, with 12 levels in the lowest 1 km, were employed. The meteorological initial and lateral boundary conditions were obtained from the FNL (Final) Operational Global Analysis datasets (https://rda.ucar.edu/datasets/ds083.2/, accessed on 23 March 2022); horizontal resolution 1° × 1°, 6 h interval). Chemical initial fields used a default idealized profile obtained from WRF-Chem. The time steps of the three nested domains were 30 s, 10 s, and 3.3 s, respectively. For meteorological parameterization schemes, Morrison 2-moment, Grell 3D, rapid radiative-transfer model, Goddard, Yonsei University, and Noah were adopted for the microphysics, cumulus, longwave radiation, shortwave radiation, planetary boundary layer, and land-surface model schemes, respectively. The above-mentioned parameterization schemes have been widely used in previous studies [25]. For the gas-phase chemical mechanism, the second-generation regional acid-deposition model (RADM2) was used, accompanying the modal aerosol dynamics model for Europe/secondary organic aerosol model (MADE/SORGAM) for aerosol chemistry. Moreover, the photolysis rates were calculated using the fast radiation-transfer model (FTUV), including the aerosol and cloud effects on photolysis [26].
Biases in air-quality simulations can largely stem from the uncertainty in emission inventory, which is an important factor for achieving reasonable simulation results. In this study, the Multi-resolution Emission Inventory for China (MEIC, http://www.meicmodel.org, accessed on 23 March 2022) and the MIX inventory [27], at a 0.25° × 0.25° resolution in 2016, were used as the domestic and Asian emission inventories, respectively. MEIC provides a grid-enabled anthropogenic emission from five source sectors, i.e., power plant emissions, industry emissions, traffic emissions, resident emissions, and agriculture emissions, which is one of the most widely used emission inventories for Chinese air-quality studies [12]. The biogenic emissions were calculated online using the Model of Emissions of Gases and Aerosol from Nature (MEGAN) developed by Guenther et al. [28].

2.2. Simulation Design

In April 2019, the National Development and Reform Commission, together with the Ministry of Finance, the Ministry of Ecology and Environment, and the Ministry of Housing and Urban-Rural Development, organized a mid-term assessment of clean heating in northern China, and entrusted relevant consulting agencies from relevant departments to jointly carry out this work. A comprehensive assessment on the progress and completion of the clean heating projects was reported after a series of field surveys, which ensure the data availability for assessing this energy transition [29]. In this study, the details of CTGC/CTEC projects in the BTH region, collected during the mid-term assessment, were obtained to realistically interpret the efficiency of residential clean heating implementation (see Table 1). It was shown that the clean heating rates for the cities in BTH reached the mid-term target (i.e., larger than 50% by the year 2019) except Zhangjiakou, with an increase in clean heating area during the period of 2016–2018 (Table 1). Here, a mitigation rate can be defined as one minus the ratio between non-clean heating area in 2018 and 2016 for the cities in BTH. Note that the majority of emissions for all species from the residential sector were from burning coal [16]. Thus, the emissions from the MEIC residential sector, times the mitigation rate, can be estimated as the reduced emissions due to CTGC/CTEC projects (see Figure 2c,d for the corresponding mitigated PM2.5 and PM10 emission). It is noted that the particulate matter was reduced evidently in the BTH region, especially for Beijing and Langfang.
To further assess the effectiveness of CTGC/CTEC projects for improving air quality over the BTH region, three sets of WRF-Chem simulations were conducted. The baseline scenario included all the anthropogenic and biogenic sources (hereafter referred to as the Base case); results from the Base case were compared with observational results in the BTH region to validate the model’s performances. In particular, Figure 2a,b depict the spatial distribution of anthropogenic PM2.5 and PM10 emissions as input for the Base case, respectively. It is clear that the local-level emissions in the BTH region are relatively higher than its surrounding area, except for the cities Zhangjiakou and Chengde, and thus might lead to severe pollution episodes locally. The other two sets of simulations correspond to the Sensitivity cases, for which the reduced emissions due to CTGC/CTEC projects as mentioned above (see again Figure 2c,d for details) were excluded in the MEIC inventory (hereafter referred to as Sen_coal case) and the meteorological field was changed to the conditions in 2019 (hereafter referred to as Sen_2019 case), respectively. The differences between the Base case and Sen_coal case can be used to evaluate the accumulated impacts of residential coal mitigation during the period of 2017–2018, and those between the Base case and Sen_2019 case can explain how the meteorological background changes might influence the air quality in the BTH region at the meantime. Note that the analysis simulation focused on the period from 1 January to 1 February 2016 (2019), during which air pollution days (i.e., Air Quality Index exceeds 100) were relatively frequent for northern China. In addition, six extra days for each run were simulated as the spin-up time to decrease the impact of the chemical initial fields. The output time interval of WRF-Chem was set as 1 h.

2.3. Observational Data and Model Evaluation

To evaluate the model’s performance in simulating air quality in the BTH region, the near-surface meteorological observations, including 2 m temperature (T2), 2 m relative humidity (RH2), and 10 m wind speed (WS10), were obtained from the National Meteorological Information Centre (NMIC), respectively; the time periods of 1 January 2016 (2019) to 1 February 2016 (2019) were used. Accordingly, hourly concentrations of six air pollutants (i.e., PM2.5, PM10, SO2, NO2, CO, and O3), were acquired from the China National Environmental Monitoring Centre (CNEMC). In the present study, three statistical indices [30], i.e., index of agreement (IOA), root mean square error (RMSE), and mean bias (MB), were calculated to compare the modeled meteorological conditions with observational counterparts (see Equations as follows):
IOA = 1 i = 1 N ( S i O i ) 2 i = 1 N ( | S i O ¯ | + | O i O ¯ | ) 2
RMSE = 1 N i = 1 N ( S i O i ) 2
where S ( S ¯ ) and O ( O ¯ ) represent the (time mean) simulated and observed variables, respectively, and N corresponds to the number of samples.

3. Results and Discussion

3.1. Performances of Model

The performance of meteorological-field simulation plays a key role in determining the formation, transformation, diffusion, transport, and removal of the air pollutants simulated by WRF-Chem [18]. Figure 3 depicts the diurnal variations of observed and simulated temperature, relative humidity, wind speed, and wind direction at the meteorological station in Beijing (station number 54511) during the simulation period. Compared with the observational results, the WRF-Chem can reproduce the diurnal variations of these meteorological variables well. In particular, the WRF-Chem model can yield a reasonable temporal variation in the temperature in Beijing with an IOA of 0.91. Note that the model is skillful in capturing the variations of RH when compared with observations, but it tends to underestimate the high RH (e.g., RH exceeding 80%). The temporal variations in the wind speed and direction in Beijing can also be well reproduced, even though the model biases are still rather large. In general, the above-mentioned results indicate that the temporal-spatial variations of meteorological fields in the inner domain can be reasonably captured by the WRF-Chem model, providing a solid basis for air-quality evaluation.
Figure 4 presents the spatial distribution of the simulated near-surface mass concentrations of PM2.5, PM10, NO2, SO2, and O3 along with their observed counterparts averaged from 1 to 31 January 2016 in the BTH region. Generally, the simulated patterns of air pollutants are consistent with their observational results based on ambient air-quality-monitoring sites in the BTH region. It was found that a high PM2.5 concentration lay in the plains of the BTH region, specifically the south of Yan Mountains and the east of Taihang Mountains, covering the cities of Langfang, Xingtai, and Handan. High concentrations of PM2.5 were also found in the coastal cities (i.e., Tianjin and Tangshan), which might be due to the dense distribution of energy-intensive industries and their related emission of air pollutants in this region. More importantly, the simulated PM2.5 concentrations, especially over the worse-polluted regions, are in good agreement with observations. For the spatial distribution of PM10 concentration, it highly resembles the pattern of PM2.5. In addition, WRF-Chem tends to underestimate the magnitude of PM2.5 and PM10 pollution compared with the observational results. It was also noted that the elevated NO2, SO2, and CO concentrations were located in the plain regions of BTH based on both observations and simulations. In contrast, the observed and simulated O3 concentrations, however, were rather low in the regions with high concentrations of PM2.5, which might be due to the unfavorable photochemical reaction condition during the simulation period [18].
To further evaluate the model’s performance in simulating the temporal variations of PM2.5, the diurnal profiles of observed and simulated near-surface PM2.5 mass concentrations over three kinds of monitoring sites (i.e., urban station Dongsi, suburban station Changpingzhen, and rural station Dingling) in Beijing during the period of January 2016 are shown in Figure 5. Significantly, the diurnal variations in PM2.5 mass concentrations can be well reproduced based on the WRF-Chem model compared with observations during the simulation period for all these three sites; the IOAs for Dongsi, Changpingzhen, and Dingling stations are 0.62, 0.66, and 0.82, respectively. It is also noteworthy that the developing stage of the persistent haze episode is generally consistent with observations, but the dissipation stage of PM2.5 concentration tends to be underestimated against its counterparts; this might be related to the uncertainty of the simulated meteorological fields, which determine the formation, transformation, diffusion, transport, and removal of air pollutants in the atmosphere [30]. In addition, the uncertainties in emission inventory, considering its confined spatial-temporal resolution, might also be responsible for the biases of simulated PM2.5 concentrations. To sum up, the good agreements of the simulated mass concentrations of air pollutants with observations in the BTH region indicate that the simulated meteorological conditions and the inputted emission inventory are generally reasonable.

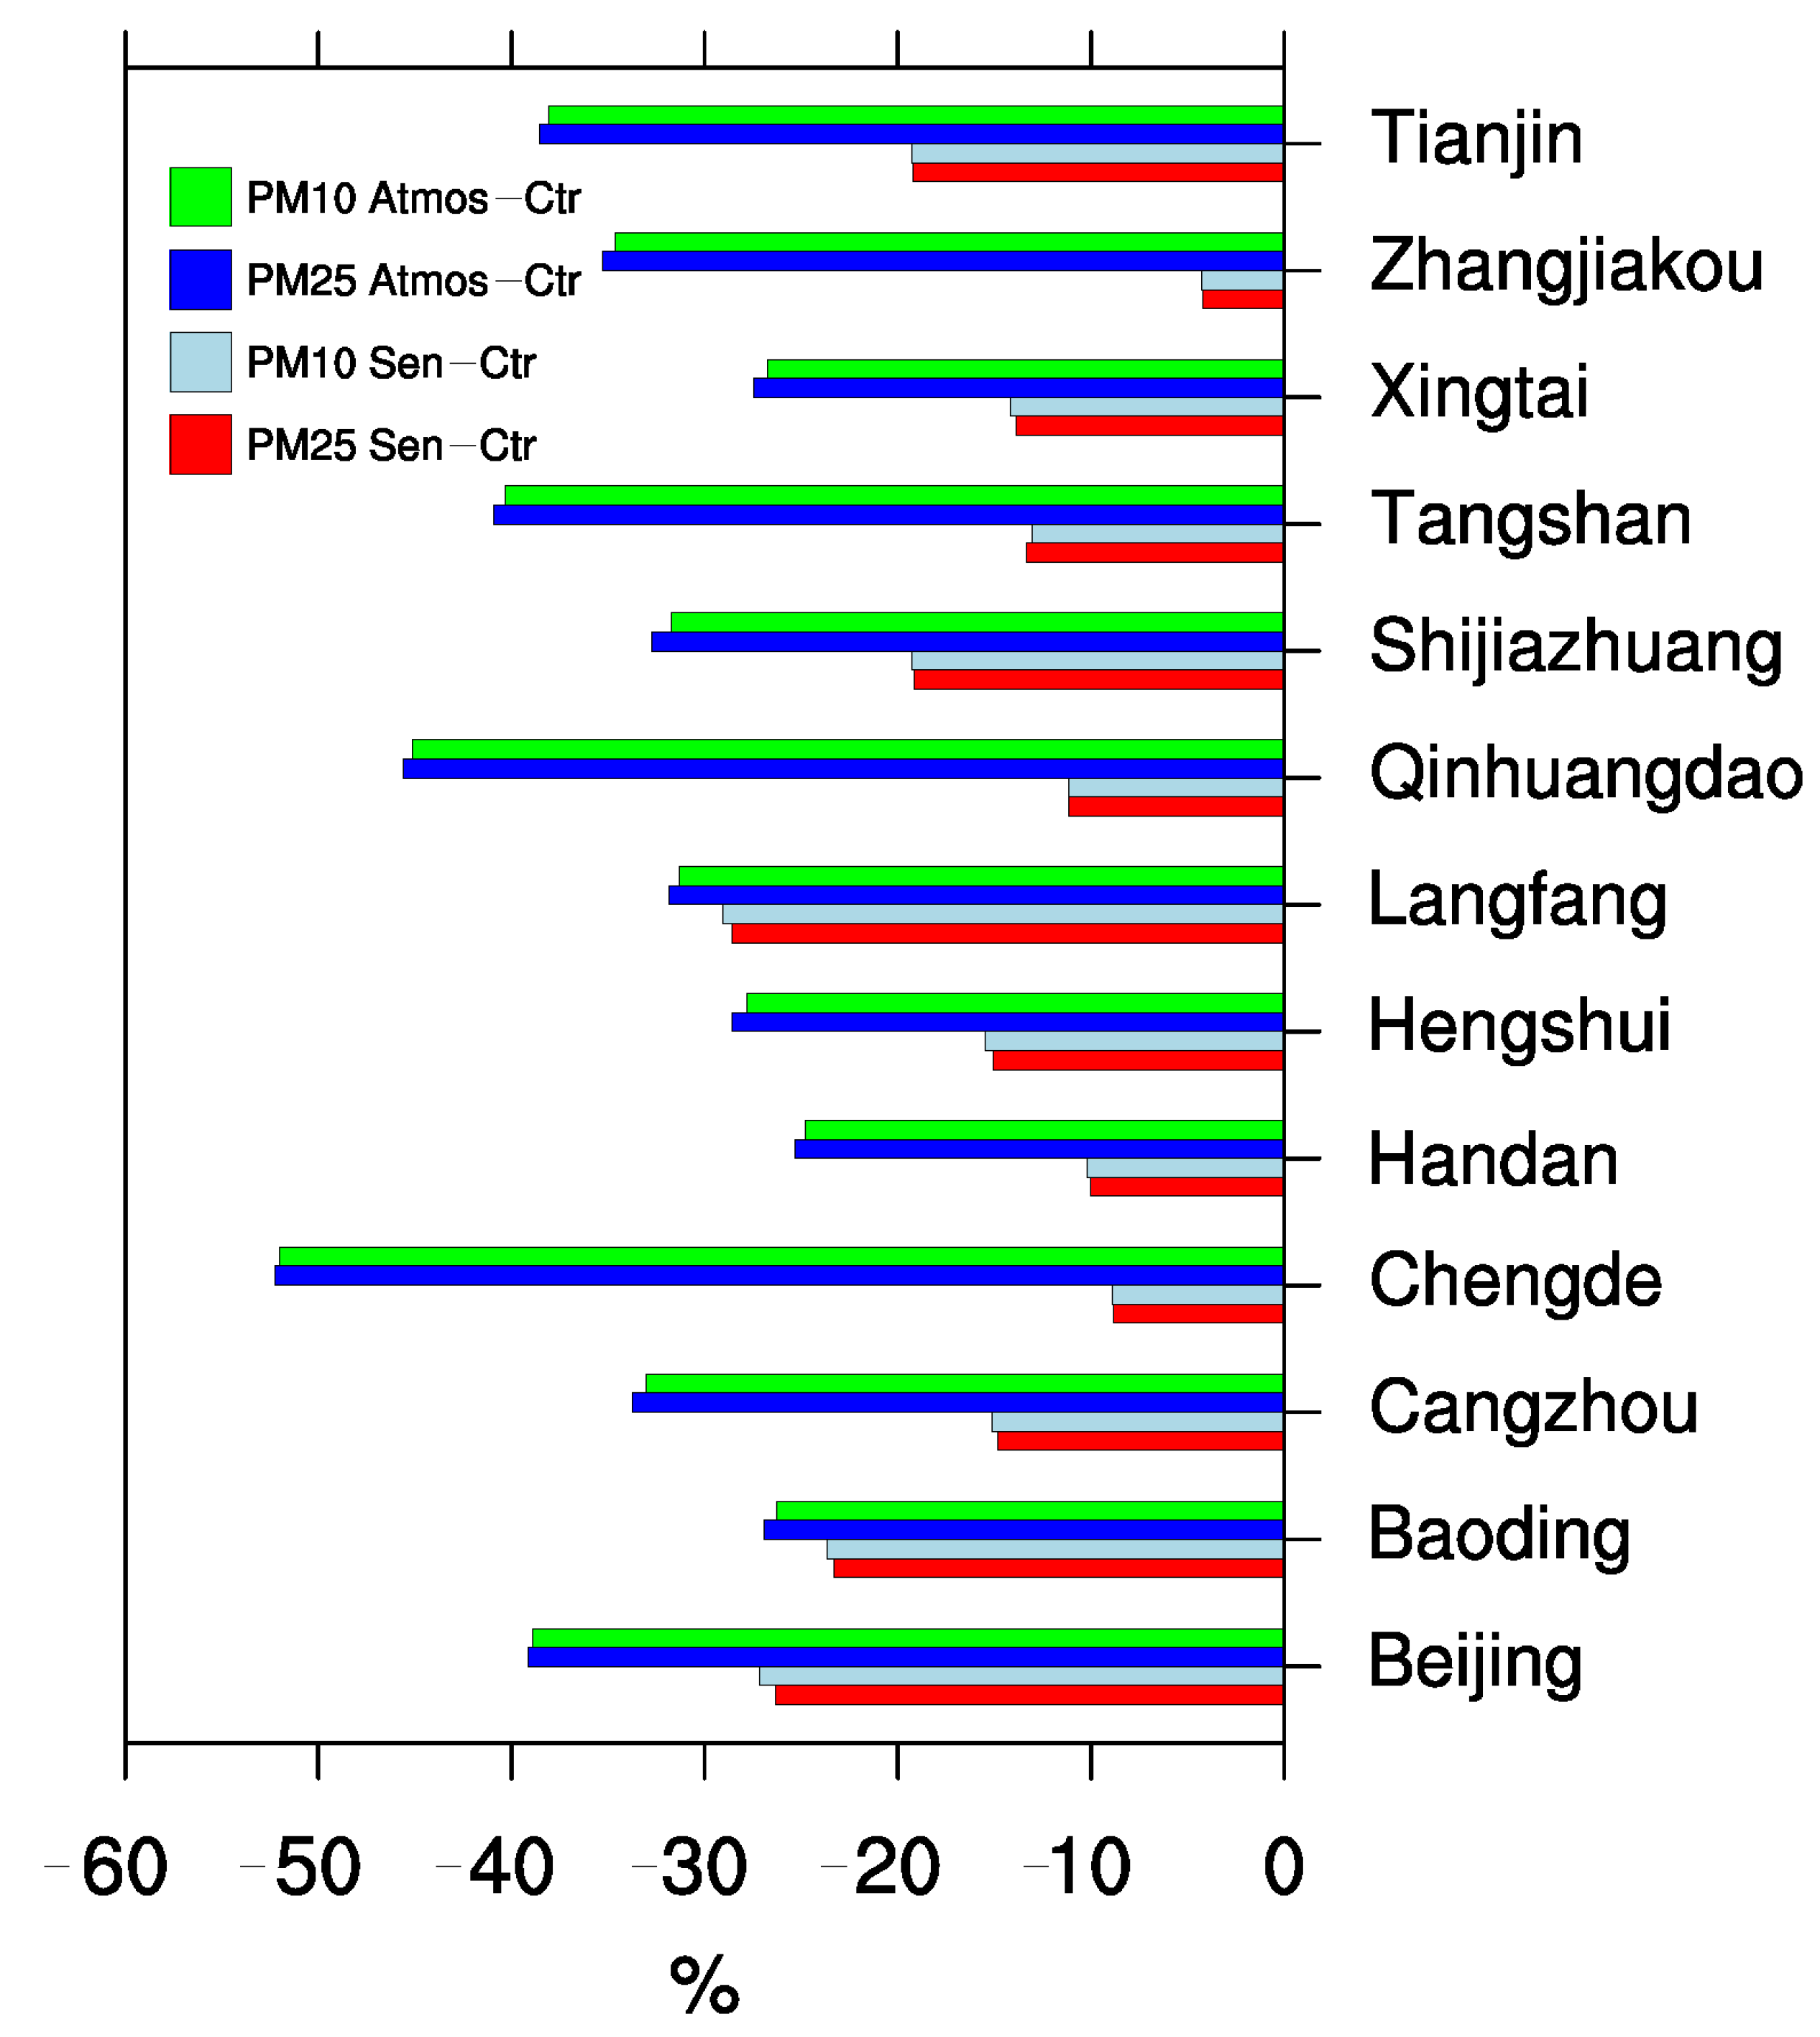
3.2. Contributions of CTGC and CTEC Projects and Meteorology

To investigate the contributions of CTGC and CTEC projects to the air-quality improvement in the BTH region, PM2.5 and PM10 concentrations resulting from the scenario of Sen_coal, in which the mitigated emissions were fully removed, were compared to the Base simulation. Figure 6a,b depict the spatial distribution of the reduced PM2.5 and PM10 concentrations due to CTGC and CTEC projects (Sen_coal–Base). In general, the CTGC and CTEC projects exert similar impacts on the concentrations of PM2.5 and PM10, for which the related spatial patterns resemble the pattern of reduced emissions (see Figure 2) as well. Even though the coal-related emissions in Beijing were reduced most significantly, the concentrations of PM2.5 and PM10, however, were decreased even more in the plain regions of Hebei province, covering Shijiazhuang, Baoding, and Langfang. In particular, it is evident that the CTGC and CTEC projects play an important role in improving air quality in the plain area of BTH, with a peak decrease of more than 30 (40) μg/m3 for PM2.5 (PM10). Over the mountain areas of BTH, the contribution of CTGC and CTEC projects to the PM2.5 and PM10 mass concentration is generally less than 10 μg/m3. It is also noticed that the spillover effects due to CTGC and CTEC projects are rather small; that is, the local reduced emissions tend to provide more benefit to the local air quality but less for its surrounding regions.
Figure 6c,d describe the changes of PM2.5 and PM10 mass concentration due to the meteorological background changes (Sen_2019–Base). Again, meteorological conditions in the Sen_2019 case correspond to the year 2019, but with identical anthropogenic emissions as the Sen_coal case. It was found that the concentrations of PM2.5 and PM10 during 2016 were higher than their counterparts in 2019. Thus, meteorological conditions in 2019 were less conducive to poor air quality than in 2016. It was also noticed that some cities (e.g., Beijing, Tangshan, and Qinhuangdao) were more affected by the change of meteorological conditions which indicates that the effects of meteorological condition changes are not spatially uniform in the BTH region. In particular, the meteorological conditions are uncontrollable but predictable. Thus, it is necessary to take meteorological conditions into account when formulating air-quality-related governmental supervision and control measures.
To further compare the influences of the CTGC/CTEC project and meteorological condition changes on air quality in the BTH region, Figure 7 shows the change rates for each city in the BTH region, which are ratios between the spatially integrated concentrations of PM2.5 and PM10 (units: μg/m3) based on the maps of Sen_coal (Sen_2019 cases) minus Base cases and Base case. The corresponding change rates for PM2.5 and PM10 are in the same order of magnitude as given by Liu et al. [23]. Also consistent with the above-mentioned results, the CTGC/CTEC projects tend to decrease the mass concentrations of particulate matter in the BTH region, but vary among different cities, among which the change rates are relatively high for Beijing, Shijiazhuang, Langfang, Baoding, and Tianjin. It is even more intriguing to notice that the impacts of meteorological condition changes can be comparable to, or even higher than, those due to the CTGC/CTEC projects, which is accordant with the results in Figure 6.
To sum up, the abovementioned results have emphasized the necessity to further reduce the residential coal combustion in China, which tends to bring air-quality benefits. However, there exists the issue that some families cannot afford long-term clean heating and might reuse coal in their daily life, since a permanent lump-sum subsidy along with the CTGC/CTEC projects is unrealistic for local governments. In addition, the supply of natural gas or electricity might also be insufficient for some regions. Thus, a continued policy refinement is essential for the implementation of clean heating projects; effective regulative and fiscal policy should be implemented in case a relapse of residential coal appears in some regions, especially rural areas. In addition, the construction of local natural gas pipelines and power grids can be strengthened to ensure the supply of natural gas and electricity, but their related cost and benefits warrant further analyses.

4. Conclusions

In this study, the effects of CTGC/CTEC projects and meteorological condition changes on air quality in the BTH region were quantitatively assessed based on WRF-Chem simulations. In general, the WRF-Chem model is capable of simulating the temporal variations and spatial distributions of the mass concentrations of air pollutants compared with observations in the BTH region. Sensitivity simulations reveal that the CTGC/CTEC projects can significantly benefit the air quality in the BTH region, especially in the plain area. In addition, the local reduced emissions tend to provide more benefit to the local air quality but not for its surrounding regions, which implies a weak spillover effect of CTGC/CTEC projects. It was also found that the impacts of meteorological condition changes are comparable with, or even larger than, those due to the CTGC/CTEC projects; the related changes of PM2.5 and PM10 concentrations are spatially uneven in the BTH region. In sum, it is necessary to further mitigate the residential coal combustion in China to sustain better air quality in the future. However, policy refinement of the CTGC/CTEC projects warrants further studies.

Author Contributions

P.W. and Y.W. (Yongli Wang) initiated the study, conducted the simulation and drafted the manuscript; M.W. and M.Z. conducted the data analysis and interpretation. J.H. and X.F. reviewed the manuscript. X.D. and Y.W. (Yu Wang) conducted the data curation. All authors contributed to checking and proofreading. All authors have read and agreed to the published version of the manuscript.

Funding

This work was supported by the National Natural Science Foundation of China (42107502), the National Key R&D Program of China (2018YFC1507801 and 2018YFC0213706). This work was also partially supported by the project from the Ministry of Ecology and Environment.

Institutional Review Board Statement

Not applicable.

Informed Consent Statement

Not applicable.

Data Availability Statement

The data presented in this study are openly available at: https://quotsoft.net/air/ (accessed on 23 March 2022).

Acknowledgments

The authors would like to thank the editor and anonymous reviewers for their valuable comments and suggestions to this paper. We thank the China National Environment Monitoring Centre for providing the observational air-quality data.

Conflicts of Interest

The authors declare no conflict of interest.

References

  1. Yin, P.; Brauer, M.; Cohen, A.J.; Wang, H.; Li, J.; Burnett, R.T.; Stanaway, J.D.; Causey, K.; Larson, S.; Godwin, W.; et al. The effect of air pollution on deaths, disease burden, and life expectancy across China and its provinces, 1990–2017: An analysis for the global burden of disease study 2017. Lancet Planet. Health 2020, 4, e386–e398. [Google Scholar] [CrossRef]
  2. Hanna, R.; Oliva, P. The effect of pollution on labor supply: Evidence from a natural experiment in mexico city. J. Public Econ. 2015, 122, 68–79. [Google Scholar] [CrossRef] [Green Version]
  3. Yang, Y.; Luo, L.; Song, C.; Yin, H.; Yang, J. Spatiotemporal assessment of PM2.5-related economic losses from health impacts during 2014–2016 in China. Int. J. Environ. Res. Public Health 2018, 15, 1278. [Google Scholar] [CrossRef] [PubMed] [Green Version]
  4. Maji, K.J.; Ye, W.F.; Arora, M.; Shiva Nagendra, S.M. PM2.5-related health and economic loss assessment for 338 Chinese cities. Environ. Int. 2018, 121, 392–403. [Google Scholar] [CrossRef]
  5. Wang, M.; Wang, Y.; Feng, X.; Zhao, M.; Du, X.; Wang, Y.; Wang, P.; Wu, L. The effects of intensive supervision mechanism on air quality improvement in China. J. Air Waste Manag. Assoc. 2021, 71, 1102–1113. [Google Scholar] [CrossRef] [PubMed]
  6. Feng, Y.; Ning, M.; Lei, Y.; Sun, Y.; Liu, W.; Wang, J. Defending Blue Sky in China: Effectiveness of the “air pollution prevention and control action plan” on air quality improvements from 2013 to 2017. J. Environ. Manag. 2019, 252, 109603. [Google Scholar] [CrossRef] [PubMed]
  7. Song, Y.; Li, Z.; Yang, T.; Xia, Q. Does the expansion of the joint prevention and control area improve the air quality?—Evidence from China’s Jing-Jin-Ji region and surrounding areas. Sci. Total Environ. 2020, 706, 136034. [Google Scholar] [CrossRef]
  8. Wang, T.; Xue, L.; Brimblecombe, P.; Lam, Y.F.; Li, L.; Zhang, L. Ozone pollution in china: A review of concentrations, meteorological influences, chemical precursors, and effects. Sci. Total Environ. 2017, 575, 1582–1596. [Google Scholar] [CrossRef] [PubMed]
  9. Yu, M.; Zhu, Y.; Lin, C.J.; Wang, S.; Xing, J.; Jang, C.; Huang, J.; Huang, J.; Jin, J.; Yu, L. Effects of air pollution control measures on air quality improvement in Guangzhou, China. J. Environ. Manag. 2019, 244, 127–137. [Google Scholar] [CrossRef]
  10. Stremke, S.; van den Dobbelsteen, A. Sustainable Energy Landscapes: Designing, Planning, and Development; CRC Press: Boca Raton, FL, USA, 2012; pp. 1–497. [Google Scholar] [CrossRef]
  11. Ding, D.; Xing, J.; Wang, S.; Liu, K.; Hao, J. Estimated contributions of emissions controls, meteorological factors, population growth, and changes in baseline mortality to reductions in ambient PM2.5 and PM2.5-related mortality in China, 2013–2017. Environ. Health Perspect. 2019, 127, 067009. [Google Scholar] [CrossRef] [PubMed]
  12. Zhang, Q.; Zheng, Y.; Tong, D.; Shao, M.; Wang, S.; Zhang, Y.; Xu, X.; Wang, J.; He, H.; Liu, W.; et al. Drivers of improved PM2.5 air quality in China from 2013 to 2017. Proc. Natl. Acad. Sci. USA 2019, 116, 24463–24469. [Google Scholar] [CrossRef] [PubMed] [Green Version]
  13. Ma, Q.; Cai, S.; Wang, S.; Zhao, B.; Martin, R.V.; Brauer, M.; Cohen, A.; Jiang, J.; Zhou, W.; Hao, J.; et al. Impacts of coal burning on ambient PM2.5 pollution in China. Atmos. Chem. Phys. 2017, 17, 4477–4491. [Google Scholar] [CrossRef] [Green Version]
  14. Yun, X.; Shen, G.; Shen, H.; Meng, W.; Chen, Y.; Xu, H.; Ren, Y.; Zhong, Q.; Du, W.; Ma, J.; et al. Residential solid fuel emissions contribute significantly to air pollution and associated health impacts in China. Sci. Adv. 2020, 6, eaba7621. [Google Scholar] [CrossRef] [PubMed]
  15. Li, Q.; Jiang, J.; Wang, S.; Rumchev, K.; Mead-Hunter, R.; Morawska, L.; Hao, J. Impacts of household coal and biomass combustion on indoor and ambient air quality in China: Current status and implication. Sci. Total Environ. 2017, 576, 347–361. [Google Scholar] [CrossRef] [PubMed] [Green Version]
  16. Zhang, Z.; Wang, W.; Cheng, M.; Liu, S.; Xu, J.; He, Y.; Meng, F. The contribution of residential coal combustion to PM2.5 pollution over China’s Beijing-Tianjin-Hebei region in winter. Atmos. Environ. 2017, 159, 147–161. [Google Scholar] [CrossRef]
  17. Xue, Y.; Zhou, Z.; Nie, T.; Wang, K.; Nie, L.; Pan, T.; Wu, X.; Tian, H.; Zhong, L.; Li, J.; et al. Trends of multiple air pollutants emissions from residential coal combustion in beijing and its implication on improving air quality for control measures. Atmos. Environ. 2016, 142, 303–312. [Google Scholar] [CrossRef]
  18. Li, X.; Wu, J.; Elser, M.; Feng, T.; Cao, J.; El-Haddad, I.; Huang, R.; Tie, X.; Prévôt, A.S.H.; Li, G. Contributions of residential coal combustion to the air quality in Beijing-Tianjin-Hebei (BTH), China: A case study. Atmos. Chem. Phys. 2018, 18, 10675–10691. [Google Scholar] [CrossRef] [Green Version]
  19. Qiao, X.; Ying, Q.; Li, X.; Zhang, H.; Hu, J.; Tang, Y.; Chen, X. Source apportionment of PM2.5 for 25 Chinese provincial capitals and municipalities using a source-oriented community multiscale air quality model. Sci. Total Environ. 2018, 612, 462–471. [Google Scholar] [CrossRef] [PubMed]
  20. Mäki, E.; Kannari, L.; Hannula, I.; Shemeikka, J. Decarbonization of a district heating system with a combination of solar heat and bioenergy: A techno-economic case study in the northern european context. Renew. Energy 2021, 175, 1174–1199. [Google Scholar] [CrossRef]
  21. Nastasi, B.; Lo Basso, G.; Astiaso Garcia, D.; Cumo, F.; de Santoli, L. Power-to-gas leverage effect on power-to-heat application for urban renewable thermal energy systems. Int. J. Hydrog. Energy 2018, 43, 23076–23090. [Google Scholar] [CrossRef]
  22. Meng, W.; Zhong, Q.; Chen, Y.; Shen, H.; Yun, X.; Smith, K.R.; Li, B.; Liu, J.; Wang, X.; Ma, J.; et al. Energy and air pollution benefits of household fuel policies in northern China. Proc. Natl. Acad. Sci. USA 2019, 116, 16773–16780. [Google Scholar] [CrossRef] [PubMed] [Green Version]
  23. Li, L.; Zheng, Y.; Zheng, S.; Ke, H. The new smart city programme: Evaluating the effect of the internet of energy on air quality in China. Sci. Total Environ. 2020, 714, 136380. [Google Scholar] [CrossRef]
  24. Liu, Z.; Chen, X.; Cai, J.; Baležentis, T.; Li, Y. The impact of “coal to gas” policy on air quality: Evidence from Beijing, China. Energies 2020, 13, 3876. [Google Scholar] [CrossRef]
  25. Wang, Y.; Feng, J.; Luo, M.; Wang, J.; Qiu, Y. Uncertainties in simulating central Asia: Sensitivity to physical parameterizations using weather research and forecasting model. Int. J. Climatol. 2020, 40, 5813–5828. [Google Scholar] [CrossRef]
  26. Tie, X.; Madronich, S.; Walters, S.; Zhang, R.; Rasch, P.; Collins, W. Effect of clouds on photolysis and oxidants in the troposphere. J. Geophys. Res. Atmos. 2003, 108, 4642. [Google Scholar] [CrossRef]
  27. Li, M.; Zhang, Q.; Kurokawa, J.I.; Woo, J.H.; He, K.; Lu, Z.; Ohara, T.; Song, Y.; Streets, D.G.; Carmichael, G.R.; et al. MIX: A mosaic asian anthropogenic emission inventory under the international collaboration framework of the MICS-Asia and HTAP. Atmos. Chem. Phys. 2017, 17, 935–963. [Google Scholar] [CrossRef] [Green Version]
  28. Guenther, A.; Karl, T.; Harley, P.; Weidinmyer, C.; Palmer, P.I.; Geron, C. Edinburgh research explorer estimates of global terrestrial isoprene emissions using MEGAN (model of emissions of gases and aerosols from nature) and physics estimates of global terrestrial isoprene emissions using MEGAN (model of emissions of gases an). Atmos. Chem. Phys. 2006, 6, 3181–3210. [Google Scholar] [CrossRef] [Green Version]
  29. Manfren, M.; Nastasi, B.; Groppi, D.; Astiaso Garcia, D. Open data and energy analytics—An analysis of essential information for energy system planning, design and operation. Energy 2020, 213, 118803. [Google Scholar] [CrossRef]
  30. Emery, C.; Liu, Z.; Russell, A.G.; Odman, M.T.; Yarwood, G.; Kumar, N. Recommendations on statistics and benchmarks to assess photochemical model performance. J. Air Waste Manag. Assoc. 2017, 67, 582–598. [Google Scholar] [CrossRef] [Green Version]
Figure 1. (a) Three nested domains for WRF-Chem model simulations with topography (in units of m); (b) map showing the cities in BTH region with CTGC and CTEC implemented.
Atmosphere 13 00555 g001
Figure 2. The spatial distribution of (a,c) PM2.5 and (b,d) PM10 emission intensity (units: μg/m2s) in the inner domain for (a,b) the baseline simulation and (c,d) the mitigated counterparts (units: μg/m2s) due to the implementation of CTGC and CTEC projects from 2016 to 2018.
Atmosphere 13 00555 g002
Figure 3. Comparisons between observed (black dots) and simulated (solid purple line) diurnal profiles of (a) near-surface temperature, (b) relative humidity, (c) wind speed, and (d) wind direction at meteorological sites in Beijing from 1 to 31 January 2016.
Atmosphere 13 00555 g003
Figure 4. The spatial distribution of simulated (shading) and observed (dots) concentrations for (a) PM2.5, (b) PM10, (c) NO2 (d) O3 (e) SO2 and (f) CO averaged in January 2016 (in units of μg/m3, except mg/m3 for CO).
Atmosphere 13 00555 g004
Figure 5. The simulated (red curve) and observed (black curve) temporal evolution of PM2.5 concentrations (units: μg/m3) over (a) urban, (b) suburban, and (c) rural stations.
Atmosphere 13 00555 g005
Figure 6. The spatial distribution of (a,c) PM2.5 and (b,d) PM10 (units: μg/m3) based on Base case and its difference with Sen_coal (a,b) and Sen_2019 cases (c,d).
Atmosphere 13 00555 g006
Figure 7. The change rates between spatially integrated concentrations of PM2.5 and PM10 (units: μg/m3) among each city based on the Base case and its difference with Sen_coal and Sen_2019 cases.
Atmosphere 13 00555 g007
Table 1. Statistical results of heating and clean heating areas in 2016 and 2018 for the BTH region, and the residential coal-mitigation rate due to CTGC/CTEC projects.
20182016Mitigation Rate (%)
Heating Area (Billion m2)Clean Heating Area (Billion m2)Clean Heating Rate (%)Heating Area (Billion m2)Clean Heating Area (Billion m2)Clean Heating Rate (%)
Beijing0.980.9496.020.960.8387.0070.03
Tianjin0.640.4875.000.570.3154.0038.46
Shijiazhuang0.450.3577.930.420.2251.0452.21
Tangshan0.300.2066.560.290.1449.6130.73
Langfang0.200.2097.340.180.0424.2596.04
Baoding0.340.2571.890.320.0826.6158.88
Cangzhou0.220.1358.240.240.0624.8649.22
Hengshui0.110.1088.660.140.0644.4882.67
Xingtai0.180.1158.030.080.0672.3341.90
Handan0.160.1380.810.100.0983.2441.90
Zhangjiakou0.140.0638.540.140.0430.736.54
Chengde0.120.0756.970.100.0549.322.53
Qinhuangdao0.110.0651.740.080.0338.5241.90
Publisher’s Note: MDPI stays neutral with regard to jurisdictional claims in published maps and institutional affiliations.

