Article

Vorticity Budget and Formation Mechanisms of a Mesoscale Convective Vortex in a Heavy-Rainstorm Episode

1
Nanjing Meteorology Bureau, Nanjing 210019, China
2
State Key Lab of Severe Weather, Chinese Academy of Meteorological Sciences, Beijing 100081, China
3
Nanjing Joint Institute for Atmospheric Sciences, Chinese Academy of Meteorological Sciences, Nanjing 210000, China
4
School of Atmospheric Sciences, Nanjing University, Nanjing 210023, China
*
Authors to whom correspondence should be addressed.
Atmosphere 2022, 13(4), 556; https://doi.org/10.3390/atmos13040556
Submission received: 7 March 2022 / Revised: 27 March 2022 / Accepted: 29 March 2022 / Published: 30 March 2022
(This article belongs to the Special Issue Meteorological Extremes in China)

Abstract

:
Mesoscale convective vortices (MCVs) often cause rainstorms. To deepen our understanding of MCV formation mechanisms, reanalysis data from the National Centers for Environmental Prediction and the Weather Research and Forecasting model were used to simulate MCV activity in East China in August 2009. The simulations could reproduce the MCV and associated convective activities well. The vorticity budget and MCV formation mechanisms were then analyzed. The results show that the planetary vorticity advection is much smaller than other terms of the vorticity equation. The MCV initiates in the convective precipitation region and below 800 hPa. When the MCV initiates, there are vorticity-variation couplets within the vortex, and the MCV moves towards the positive vorticity-variation direction. In positive vorticity-variation areas, the divergence term and the tilting term are the vorticity source. The equilibrium response to diabatic heating is one of the forming mechanisms of this MCV. The latent-heating level is relatively low in this MCV case, and the MCV-forming level is also relatively low. Another forming mechanism of this MCV is the tilting of the horizontal vortex tube caused by the upward motion. At the MCV initiation, the perturbation scale of the vortex is found to be larger than the Rossby deformation radius, and thus the MCV could have a long duration.

1. Introduction

The mesoscale convective vortex (MCV) is one of the weather systems that can cause rainstorms and floods [1], and is often accompanied with the development of tropical cyclones [2,3]. Some studies have found that in the Mei-Yu season in East China, a series of MCV activities occur on the Mei-Yu front [4,5,6,7]. In recent years, many studies on MCVs have been carried out, focusing on its basic characteristics, the triggering effect on secondary convection, and the MCV formation mechanisms. Regarding the basic characteristics, Bartels et al. [8] indicated that the MCV is a cyclonic vortex initiating within the stratiform precipitation region of mesoscale convective systems (MCSs), and often appears in the maturity and dissipation stages of the parent MCS. The diameter of an MCV is about 100–300 km [9]. The main part of an MCV is usually located in the middle and lower troposphere, and its vertical thickness can reach several kilometers [9,10,11]. In addition, MCVs can sometimes extend to the surface, for instance, when the MCV vertically overlaps with the line-end vortex near the surface [9,12]. In some cases, the diabatic heating in middle levels could reduce the weight of the entire air column, making the low-pressure perturbation approach near the ground, and then the near-surface cyclonic wind field is established by the gradient wind balance [13]. Considering the vertical structure, an MCV is embedded between two anticyclonic circulations at its upper and lower layers [9]. Because of their high inertia stability, MCVs can last for several hours or even several days [10,14]. Furthermore, if an MCV triggers new convection, a series of convective activities and long-term disastrous weather could occur [15].
With regard to the triggering effect of MCVs on secondary convection, Raymond et al. [16] firstly explained why MCVs can trigger new convection, and they considered MCVs as an important self-sustaining mechanism of MCS and proposed two conceptual models on how MCVs trigger new convection, which were further improved by Fritsch et al. [10]. Based on the observational data, Davis et al. [12] verified the relative position between MCV and the vertical movement necessary for secondary convection. They pointed out that the direct cause of upward motion is the upgliding airflow along the isentropic surface in the downshear direction. Trier et al. [17] studied five MCV cases and suggested that two MCVs in strong wind shear did not generate any deep convection; two MCVs in moderate to strong vertical shear triggered local deep convection; whereas the MCV in weak shear triggered widespread secondary convection. The right side of the downshear, i.e., the southeast of the MCV, is the region most conducive to the formation of deep convection. Lai et al. [18] also suggested that the southerly airflow related to MCVs contributes to generate the local potential instability in the downshear direction, thus being beneficial to convection development. Rogers et al. [19] found that Hurricane Hermine (2016) began to steadily intensify once a low-level MCV developed within a region of deep convection.
As for the formation mechanisms of MCVs, Raymond et al. [16] first presented a theoretical framework for the generation of MCVs. They believed that the vertical diabatic heating anomaly caused by MCS is the main cause for the formation of a mid-level mesoscale cyclonic circulation. Chen et al. [20] verified the conclusions of Raymond et al. [16] using an ideal numerical simulation, and presented a conceptual model for the generation of MCVs. Fritsch et al. [10] further verified and completed the theoretical model for the MCV generation with observational data, and found that MCVs develop in the stratiform-cloud region of MCS. A study on MCVs during the Meiyu season in 2003 by Sun et al. [21] also noted that an MCV forms during the development of the parent MCS. The convergence term, tilting term, and vertical advection term of the vorticity equation are the main vorticity sources at the MCV initiation. They also proposed a conceptual model for the Meiyu front and the embedded MCS and MCV. Yu et al. [22] analyzed the dynamic characteristics of the mesoscale vortices moving eastward in the Meiyu front, and pointed out that land–sea distribution plays a critical role in the evolution of the Meiyu front vortex. Xu et al. [23] showed that the latent-heat release by parent convection is the main energy source for the vortex development, and there is a positive feedback interaction between convection and the vortex. Bartels et al. [8] and Trier et al. [24] generalized the large-scale environments favoring the MCV formation as the long-wave ridge in the middle-upper levels, the short-wave trough in the middle level, the weak vertical wind shear, the warm-moist inflow brought by the low-level jet, the large CAPE value, and the surface front. Fu et al. [25] claimed that the low-level jet is very important in the formation of MCVs in the Dabie Mountain area. The low-level jet can cause intense lower-level convergence around its northern terminus, and this convergence can directly produce cyclonic vorticity through vertical stretching.
In a word, the in-depth studies of MCVs could deepen the understanding of researchers and operational weather forecasters on this disastrous weather system, and improve the forecast ability. However, each MCV case has its own unique surrounding environments and dynamic processes. Furthermore, the MCVs in China are quite different from those in the US and European countries [14]. Therefore, it is necessary and essential to conduct more specific case studies on MCVs. A heavy-precipitation episode with a long duration occurred in eastern China from 16 to 18 August 2009, which is referred as the 8.17 heavy rainfall by Chinese scholars. This episode caused great economic losses, and the accumulated precipitation in some stations broke history records [26]. The preliminary analysis has shown that the MCV had a significant impact on this episode. In this study, the Weather Research and Forecasting (WRF) model is used to simulate and analyze this MCV event. The remainder of this paper is organized as follows: Section 2 describes the dataset and numerical simulation schemes used in this study; Section 3 introduces the synoptic background and verifies the results of numerical simulations; Section 4 analyzes the vorticity budget at the MCV initiation; Section 5 discusses the formation mechanisms of MCV; Section 6 presents the conclusions and discussions.

2. Data and Model Setup

The dataset used in this paper included the 1° × 1° reanalysis data from the National Centers for Environmental Prediction (NCEP), the Regional Spectral Model_Global Reanalysis (RSM_GANAL) data, the precipitation observation data, and the satellite data from the Multifunctional Transport Satellite-1R. The reanalysis data of RSM_GANAL data was provided by the Far East limited-area regional spectral model of the Japan Meteorological Agency. The horizontal resolution was 20 km, and the western boundary of the data started from 110° E. The study employed the Weather Research and Forecasting (WRF, version 3.8) model. The NCEP reanalysis data with a 6 h interval were used as the initialization and boundary conditions. As this study aimed to analyze the vorticity source when the MCV forms, the simulation was integrated from 12:00 UTC on 16 August to 06:00 UTC on 17 August 2009, which covered the early stages of the MCV lifecycle. Three two-way nested domains were used at horizontal resolutions of 45 km (121 × 111 grid points), 15 km (235 × 229 grid points), and 5 km (391 × 361 grid points) (Figure 1). There were 28 levels in the vertical direction, and the model top was 50 hPa.
The parameterization schemes used in the simulation are as follows. The cloud microphysical parameterization was the WRF Single Moment 5-class scheme [27], which is often used in the mesoscale simulations. The boundary-layer parameterization scheme was the YSU scheme that considers the involvement of the boundary-layer top and produces the wind profiles of the boundary layer by adding nonlocal momentum mixing [28]. The land-surface process was parameterized by the thermal diffusion scheme. The cumulus-convection parameterization used in domains 1 and 2 was the Kain–Fritsch scheme [29], whereas in domain 3, no convection parameterization scheme was employed because only the explicit convection was dealt with. The advantage of Kain–Fritsch scheme is that it fully retains the processing strategies on the cloud physical processes in current convection parameterization schemes, while considering the parameterization of the downward-airflow process. Compared with other parameterization schemes, the Kain–Fritsch scheme can better simulate the mesoscale response [30]. The Monin–Obukhov scheme was adopted for the near-surface-layer parameterization [31,32,33]. The RRTM scheme [34] and Dudhia scheme [35] were used for long-wave-radiation parameterization and short-wave-radiation parameterization, respectively. The time integration employed the third-order Runge–Kutta scheme [36]. The detailed model settings were summarized in Table 1.

3. The Rainstorm Episode and the Verification of Simulation Results

3.1. The Rainstorm Episode and Synoptic Background

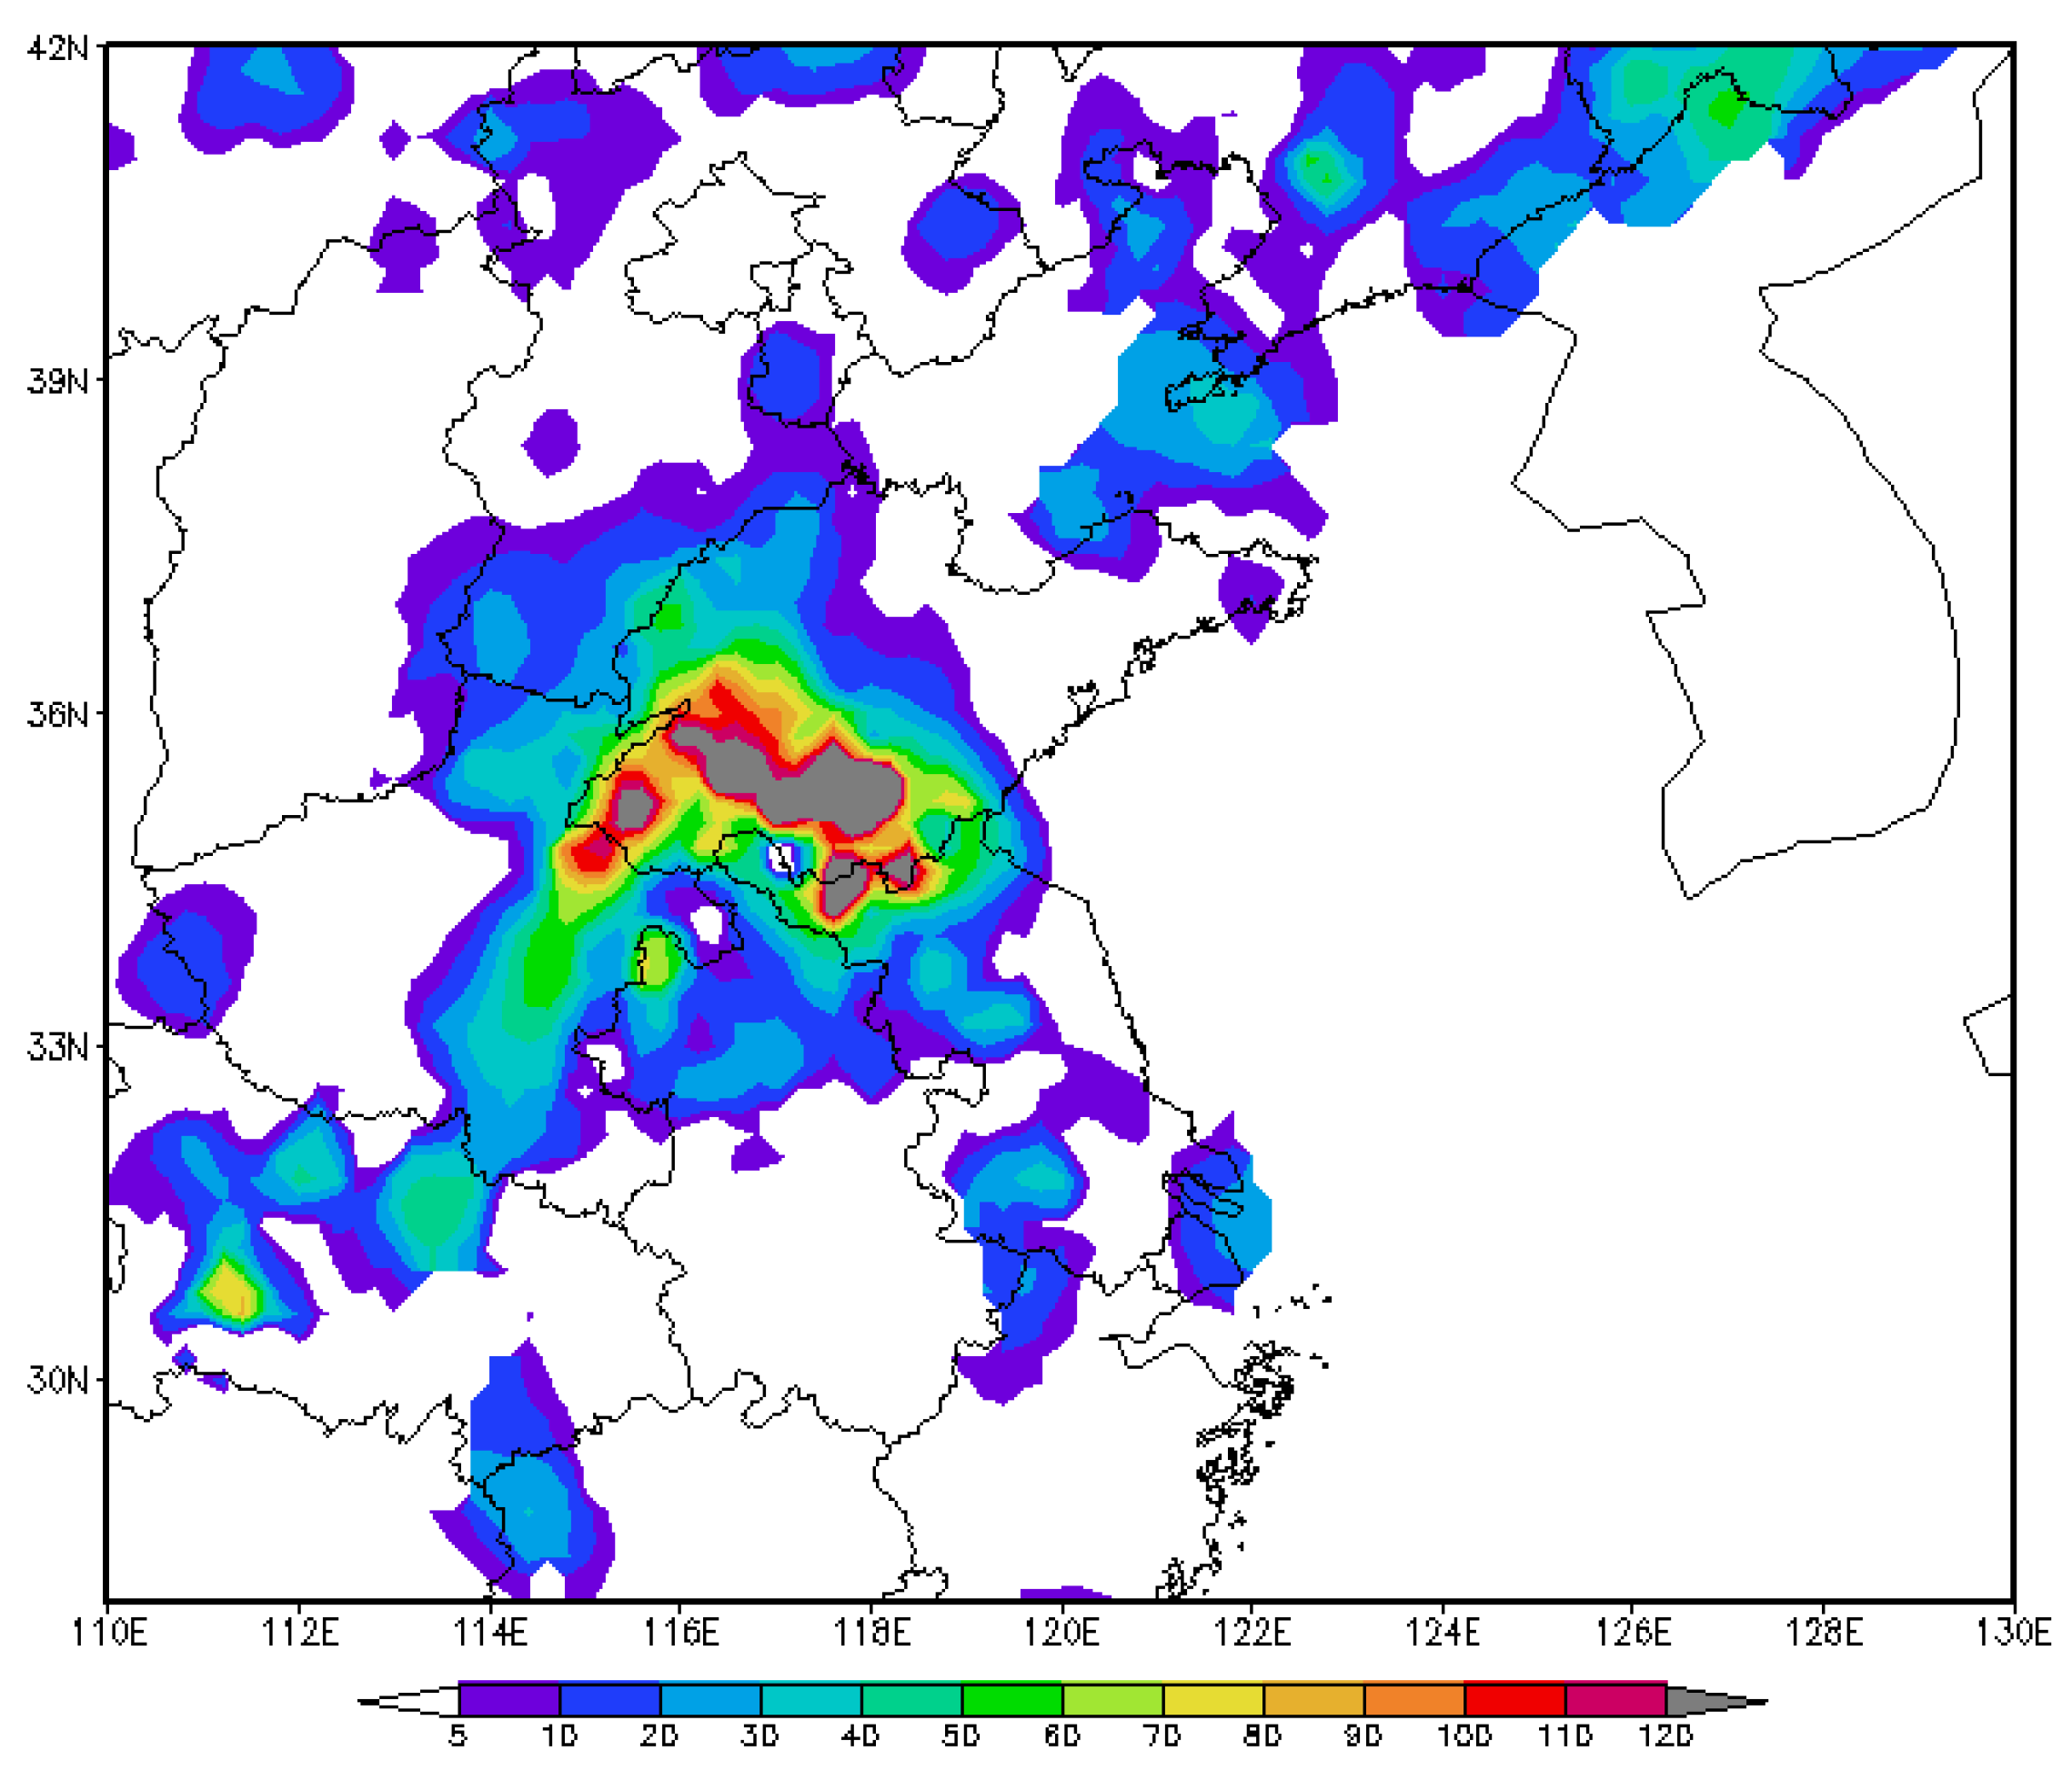
During 16–18 August 2009, the mid-latitude low vortex and the western Pacific subtropical high (WPSH) jointly caused a regional heavy-rainstorm episode in Henan, Jiangsu, and Shandong Provinces in China. The spatial and temporal distributions of this rainstorm episode were uneven, with the maximum precipitation recorded on 17 August. Figure 2 shows the accumulated precipitation observed during 00:00 UTC 17th to 00:00 UTC 18th. During this period, the rainfall in most of the junction regions of the three provinces exceeded 120 mm, while the daily precipitation in southern Shandong was up to 300 mm, which broke historic records in some stations [26]. Terrain effects were important in the formation and maintenance of this heavy-rainstorm episode. Gao et al. [26] pointed out that the mountainous topography enhanced the heavy precipitation in southern Shandong.
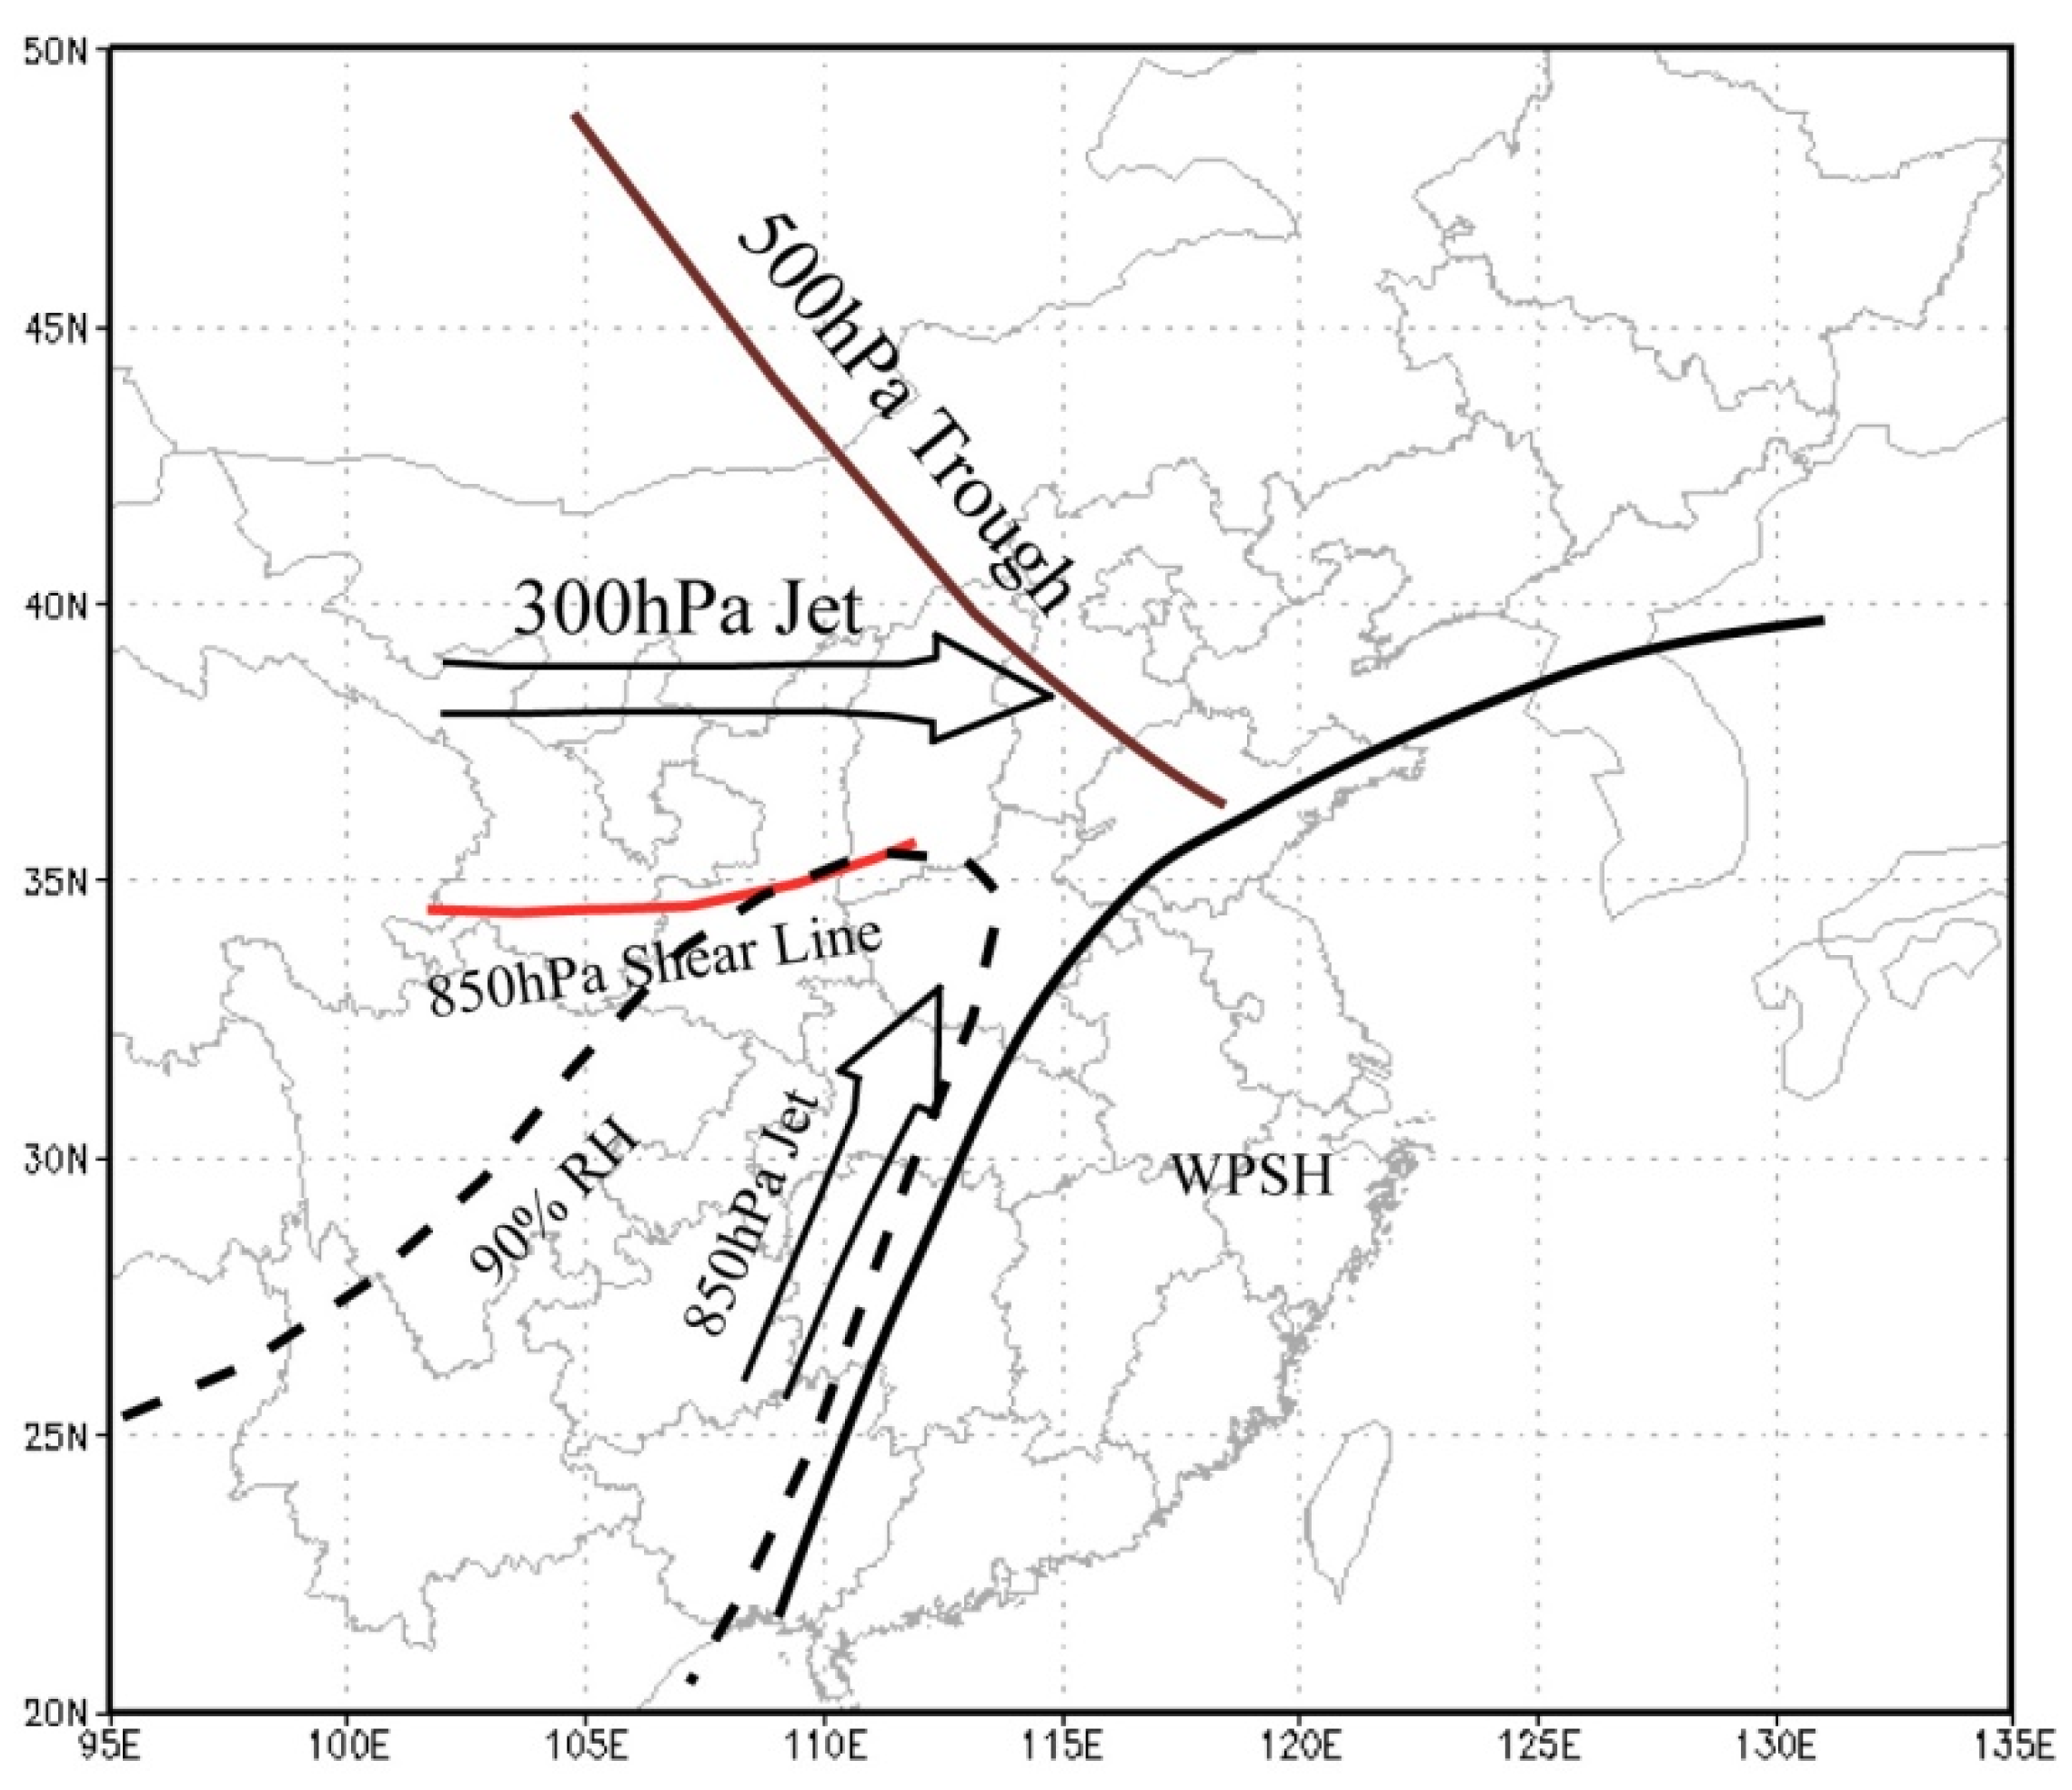
Figure 3 illustrates the synoptic background at 00:00 UTC on 16 August 2009. At 300 hPa the upper-level jet was located to the northwest of Jiangsu, Shandong, and Henan Provinces. The right-rear side of the jet stream was the high-level divergence area, where the development of convection was favored. At 500 hPa, there were two troughs and one ridge to the north of 40° N over the Asian continent, and the circulation to the south of 40° N was meridional. The Hetao trough covered a vast area between 110° E and 120° E and the cold air behind it moved southward continuously. The WPSH controlled large areas of eastern China. The southerly warm airflow on the west of the WPSH could frequently meet with the northerly cold air on the junction areas of the three provinces. From 16 to 17 August, the WPSH stabilized over eastern China, and the Hetao trough moved slowly eastward. At the low levels, a west–east-oriented cold shear line appeared at 700 hPa and 850 hPa near 35° N. To the south of the shear line, there was a low-level southwest jet and a wet tongue (with relative humidity greater than 90%), which transported a huge amount of warm-moist air to the junction areas of the three provinces and provided favorable water-vapor conditions to this rainstorm episode. Overall, the westward advance of WPSH and the sustaining maintenance of the 500 hPa trough and low-level shear line jointly resulted in the convergence of the cold and warm airflows at the junction of the three provinces, and provided a favorable large-scale background for the initiation and development of MCSs and MCVs.

3.2. MCV Activities

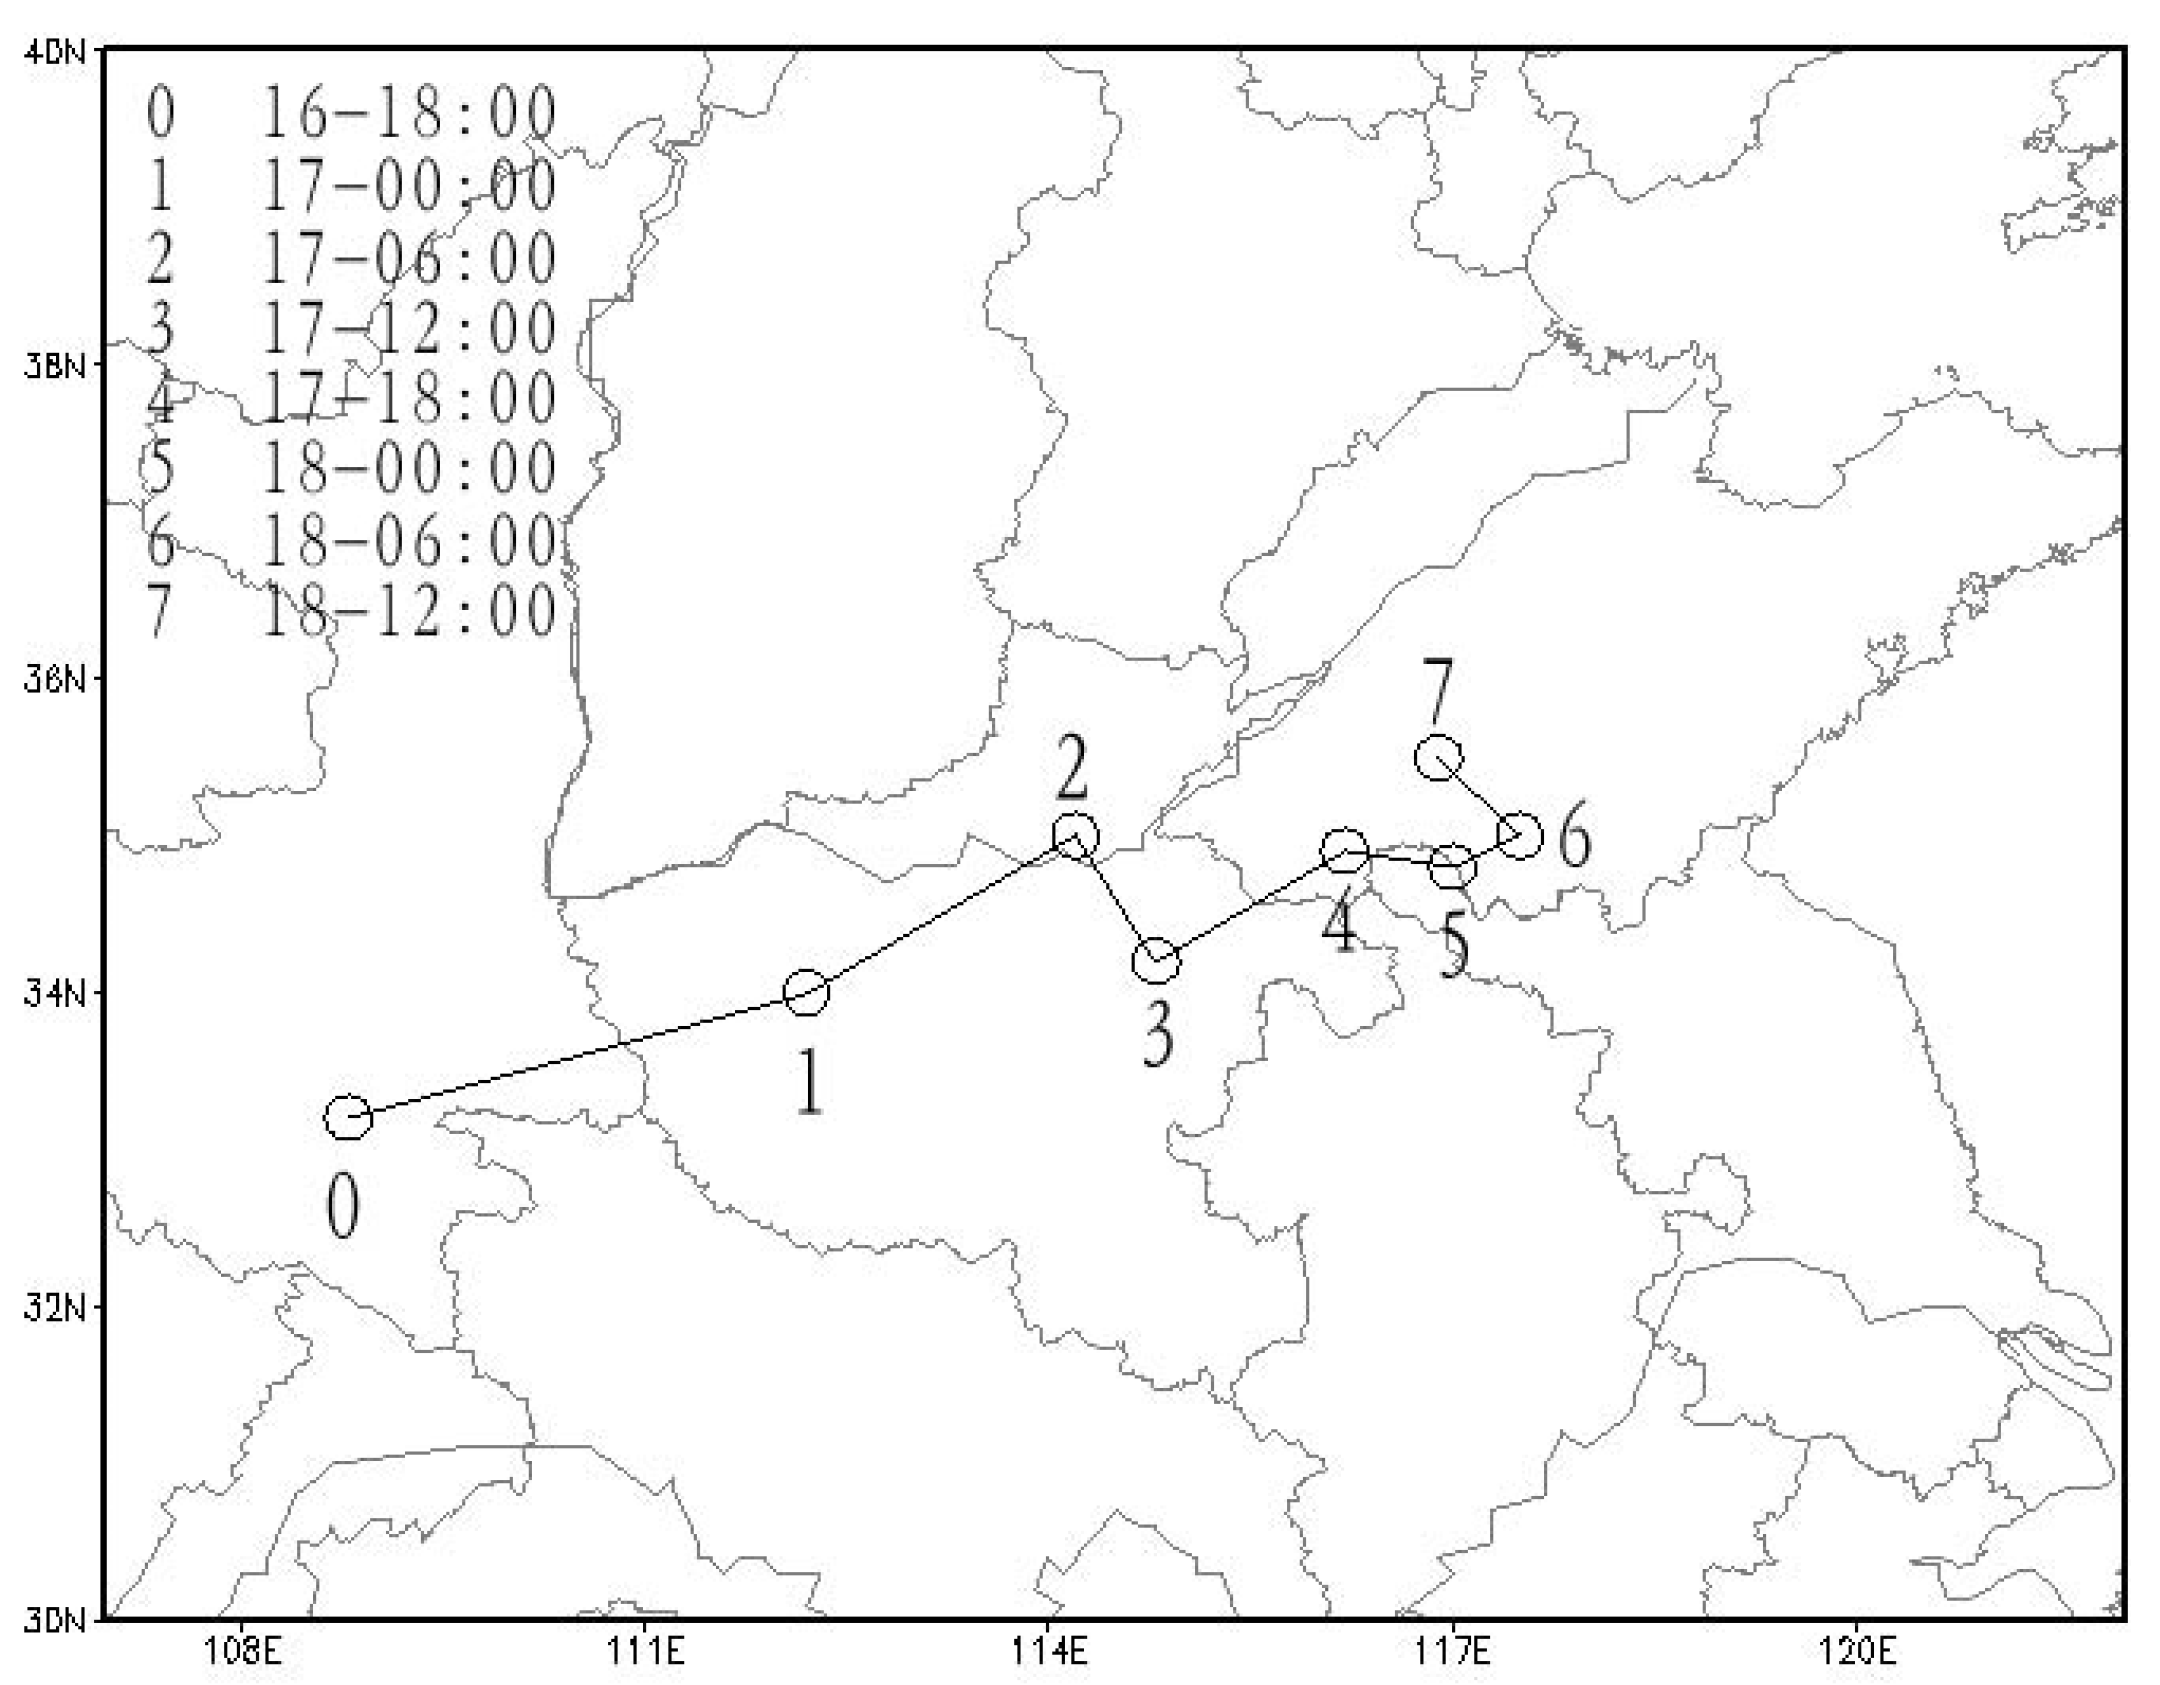
The MCV activities in this rainstorm episode were most intense at 850 hPa, so in this study the vortices at 850 hPa were used to represent the MCV activities. We defined the time when the closed streamline was first identified as the formation of the vortex, and the time when the closed streamline disappeared was defined as the dissipation of the vortex. Figure 4 gives the tracks of the vortex center from 16 to 18 August 2009, which were analyzed with the RSM_GANAL reanalysis data. At 18:00 UTC on 16 August, the vortex was already formed to the west of 110° E, 33° N. Zhang et al. [6] showed that MCVs tend to form in the morning hours over the leeside of the central China mountain ranges, which is consistent with the results of our study. In the following hours, the vortex moved east by north. At 00:00 UTC on 17 August, the MCV appeared in the west of Henan Province, and two adjacent small vortices constituted a large vortex. Afterwards, due to the block of the subtropical high and the weakening of the steering flow, this MCV moved slowly to the east when it reached the plain areas, which enhanced the precipitation accumulation in local areas. At 12:00 UTC on 18 August, the vortex almost disappeared. From its formation to dissipation, the MCV lasted for at least 42 h. It interacted with the MCS activities, and jointly caused extraordinarily heavy rainfall on 17 August. This MCV mainly moved eastward in its lifecycle, following the steering flow of the middle-low levels. It moved fast in its early stages, but it slowed down and revolved in the dissipation stage. It is worth mentioning that the MCV triggered a new convection to its southeast at its dissipation stage. The convection and MCV were coupled together for quite a long time; the latent-heat release caused by heavy precipitation promoted the development and maintaince of the MCV, while the MCV could in turn enhance the convection and precipitation. As a result, a long-lasting MCV and heavy-rainfall event occurred.

3.3. Verification of the Numerical Simulation

3.3.1. Verification of Convective Activities on Infrared Satellite Images

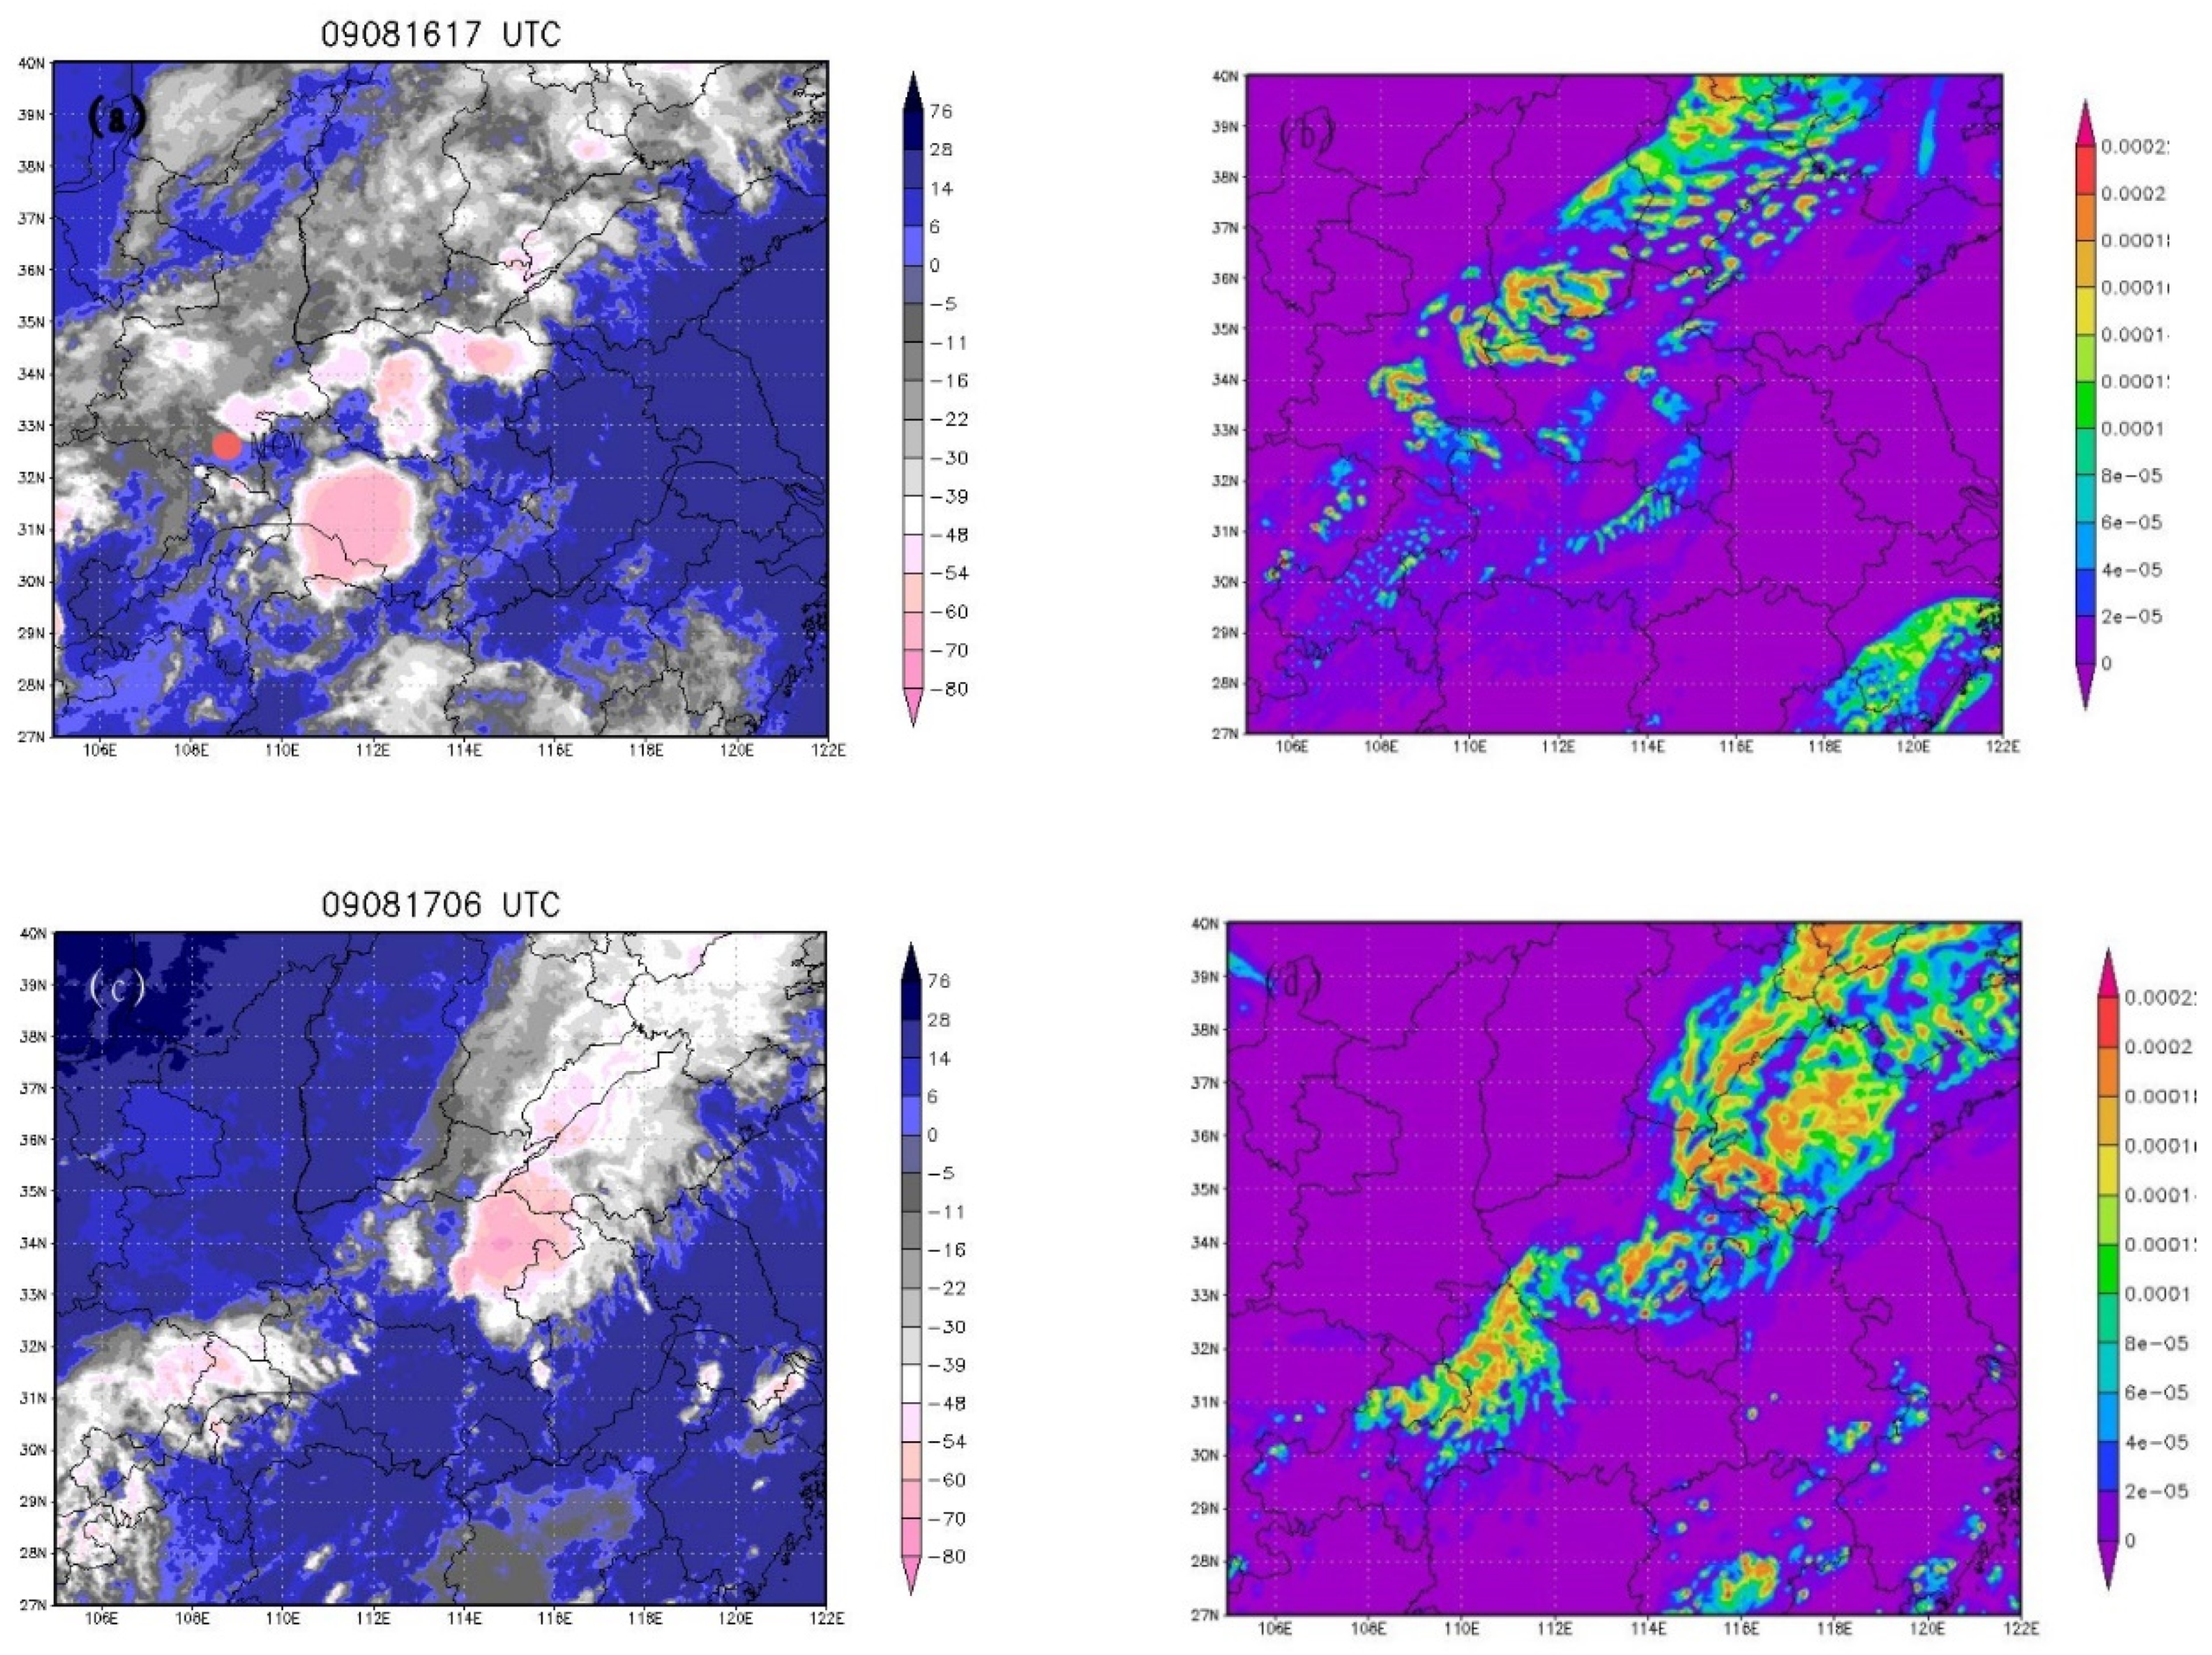
As the standard to identify a MCS is based on the cloud-top-brightness temperature, the model output of ice-mixing ratio can therefore be used to identify the simulated MCS. Figure 5 compares the simulated 300 hPa ice-mixing ratio and the actual infrared cloud image. Figure 5a,b correspond to the time of MCV initiation (17:00 UTC on 16 August), and Figure 5c,d correspond to the last time of model integration (06:00 UTC 17th). In Figure 5a, a highlighted northeast–southwest cloud belt extends from Sichuan Province to northeastern China. Meanwhile, the simulation result (Figure 5b) presents a northeast–southwest high-value area of ice-mixing ratio in the same location. In the lower right corner of Figure 5a, a white cloud belt appears over the northern region of Fujian Province. Correspondingly, in Figure 5b there is also a high-value area of ice-mixing ratio. At the last time of model integration (Figure 5c,d), the northeast–southwest oriented high-value area of ice-mixing ratio in Figure 5d matches well with the cloud belt in Henan and Shandong Provinces. Furthermore, there are some scattered convective cloud clusters in the lower-right corner of Figure 5c, which are also well-simulated, as shown in Figure 5d. Overall, the simulation results reproduce the convection activities in this rainstorm episode well.

3.3.2. Verification of the Simulated MCV Activities

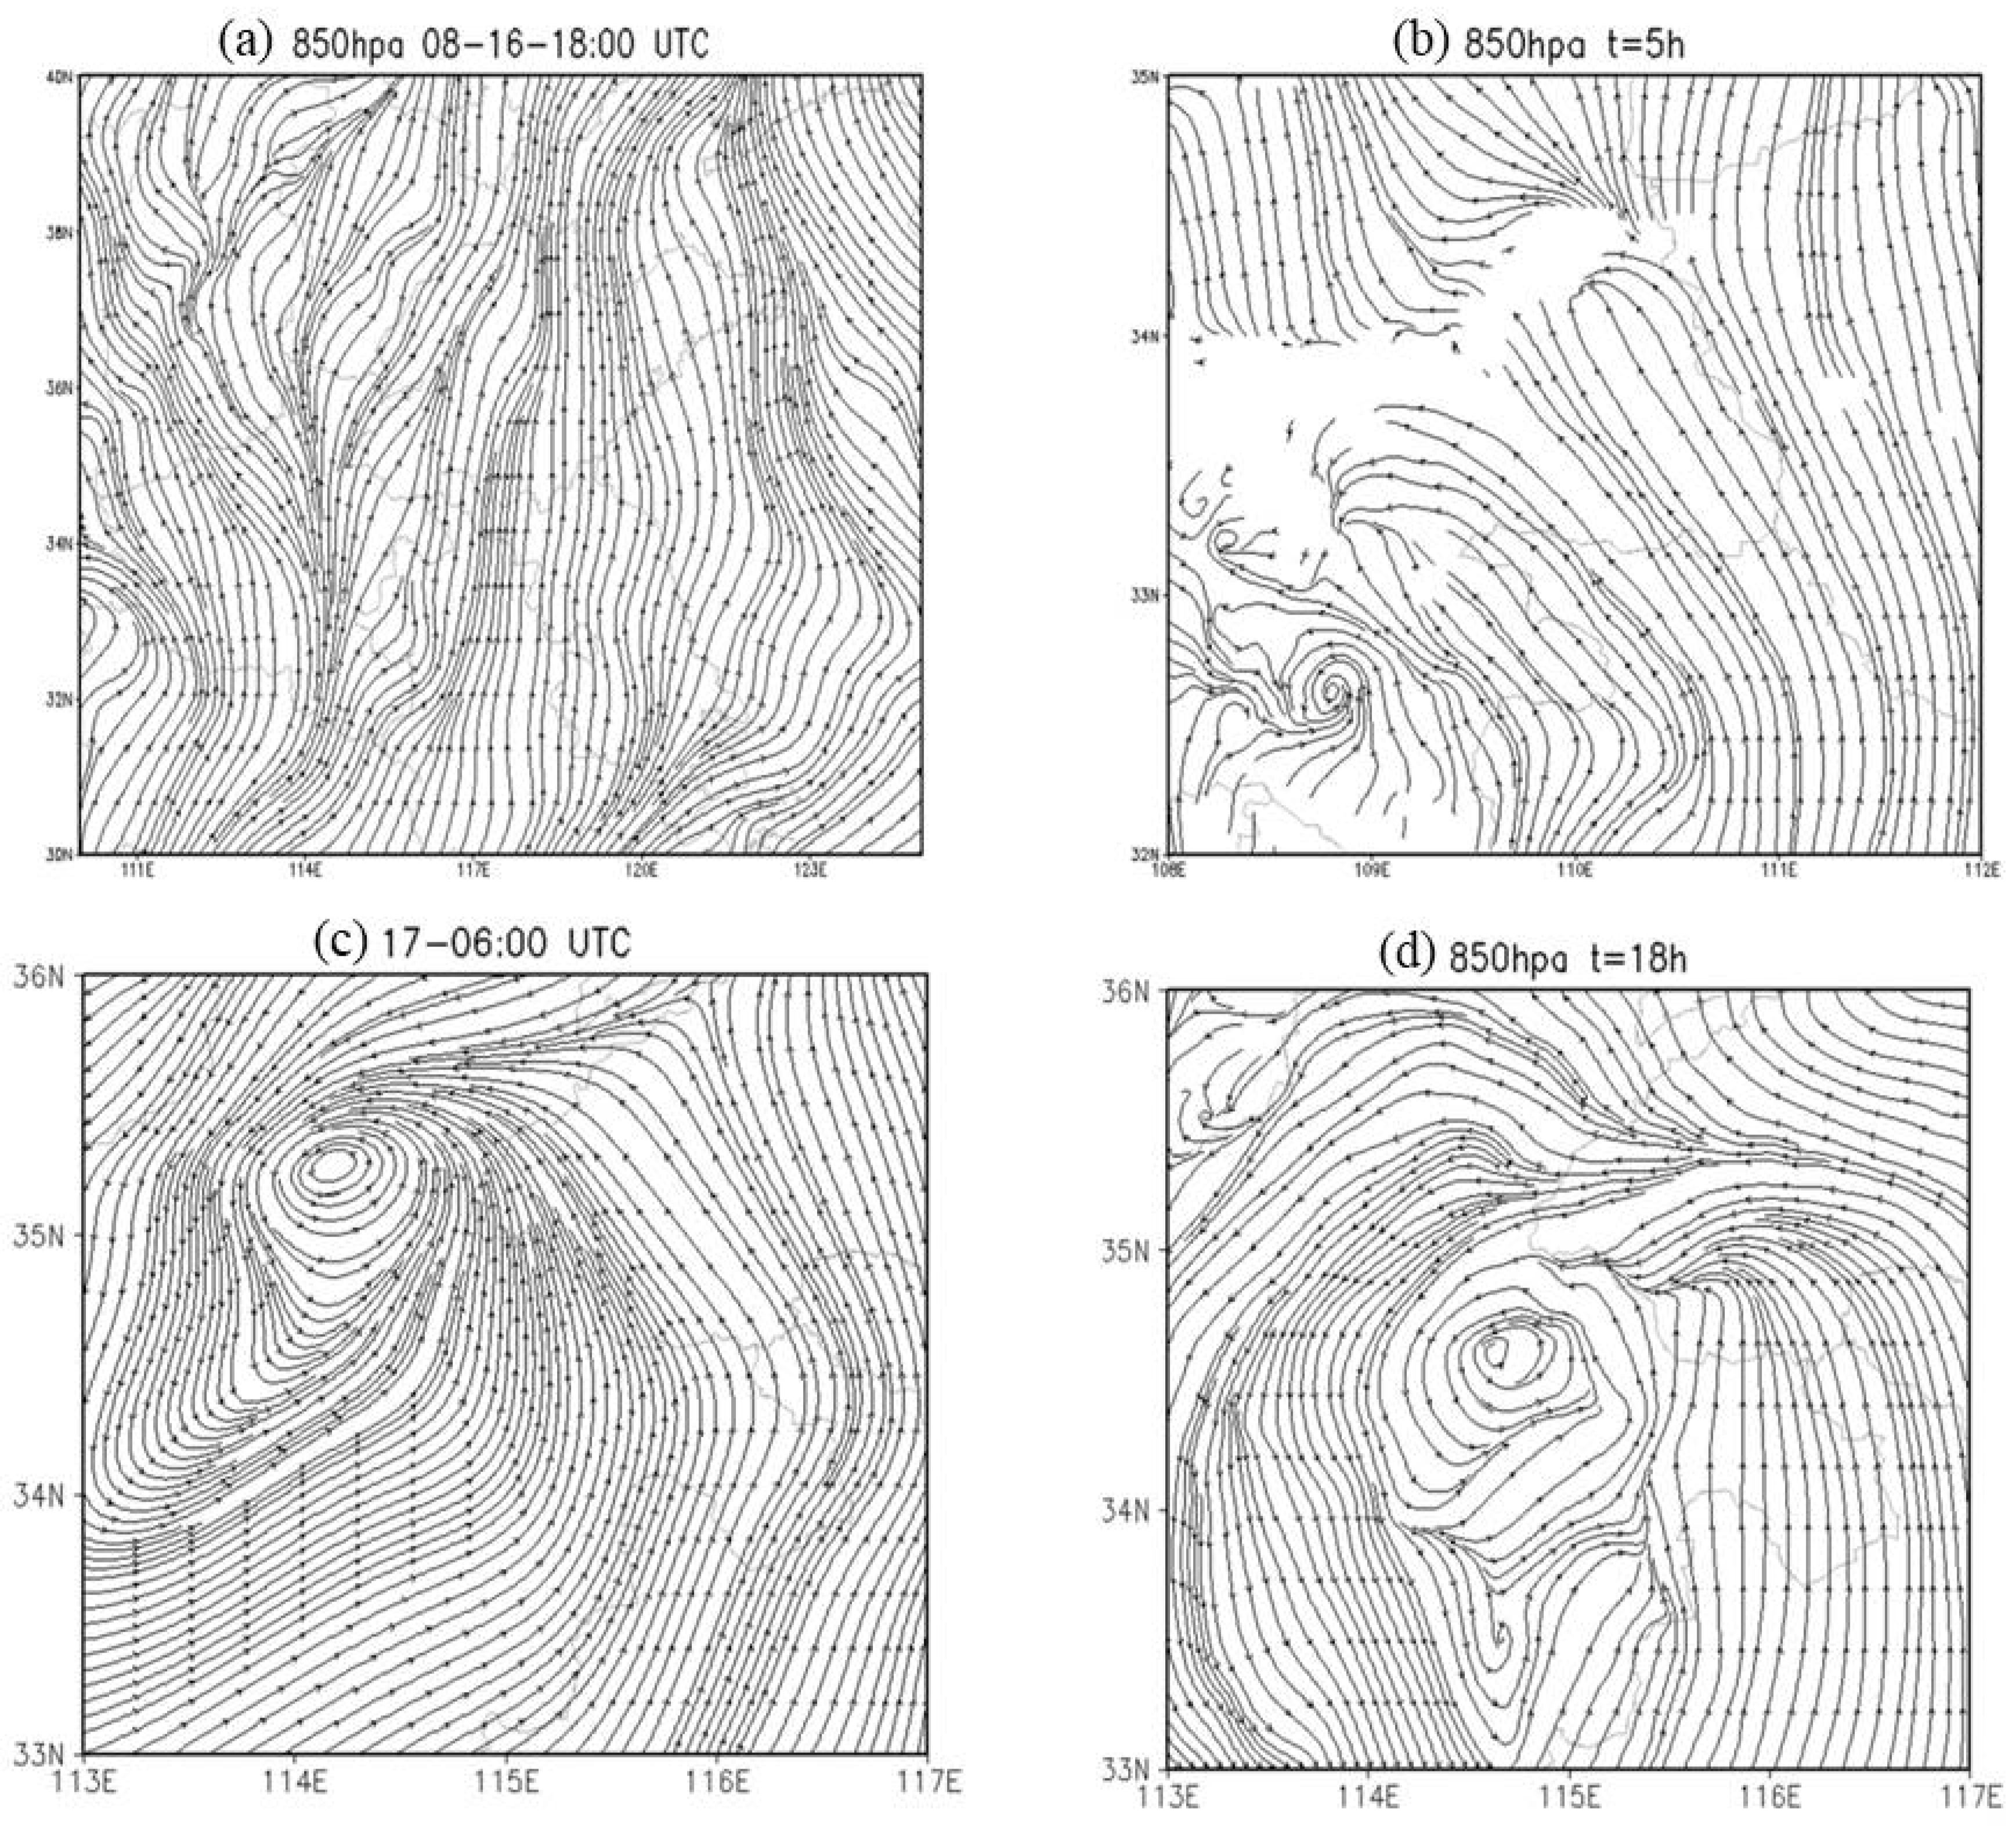
In this section, the RSM-GANAL reanalysis data were used to analyze the 850 hPa flow field and verify the simulation results (Figure 6). Figure 6a,b present the 850 hPa flow field at the MCV initiation time (17:00 UTC on 16 August). Note that the time of Figure 6a is one hour later than Figure 6b, due to the 6 h interval of the reanalysis data. In the simulation results, the closed streamlines first appeared near 108.8° E, 32.6° N at 17:00 UTC on 16 August. Accordingly, it was recorded as the MCV initiation time. The diameter of the MCV was about 40 km at the initiation time. In the reanalysis field (Figure 6a), the corresponding closed circulation exists near 110° E, 33° N at 18:00 UTC 16th, which indicates that the simulated vortex position in Figure 6b is basically accurate. It should be pointed out that the vortex is not fully displayed in Figure 6a because the reanalysis data only began from 110° E.
Figure 6c,d respectively show the 850 hPa flow field from the reanalysis data and model output at 06:00 UTC on 17 August, which was the MCV developing stage. After 18 h of model integration, the scale and location of the simulated MCV were still close to the reanalysis data, with only a slight difference in its location (114.2° E, 35.3° N and 114.7° E, 35.7° N). As for the vertical extension and intensity of the MCV, the simulations were close to the observations (figure omitted due to length limit). The MCV mainly existed in 900–550 hPa, and the intensity at initiation was at the magnitude of 10−3s−1. Overall, this simulation reproduced the formation and development of this MCV activity well. Therefore, the simulation was successful and reliable. Thus, the model output can provide a high spatiotemporal resolution dataset for further analyses.

4. Vorticity-Budget Analysis

In order to investigate the formation mechanisms of this MCV, the vorticity source at the MCV initiation time was analyzed in detail. In this section, the model output data of domain 3 were used. Each term of the vorticity equation was analyzed to identify the source of vorticity. The model integration time t = 5 h was chosen as the MCV initiation time to investigate the vorticity budget.

4.1. Vorticity Equation

Vorticity budget analysis is a commonly used method to investigate the physical processes of vortex formation. The three-dimensional wind field obtained from the model output can be used to calculate the scale of each term in the vorticity equation. Ignoring friction and subgrid processes, the vorticity equation in the pressure-coordinate system is:
( ζ p t ) p = [ u ( ζ p x ) p + v ( ζ p y ) p ] ω ( ζ p p ) p v ( f y ) p ( ζ p + f ) [ ( u x ) p + ( v y ) p ] + [ ( ω y ) p u p ( ω x ) p v p ]
In Equation (1), f is the Coriolis parameter, ζ is relative vorticity, ζ p = ( v x ) p ( u y ) p is the vertical component of relative vorticity, u and v are horizontal wind, and ω = p t   is vertical velocity. The subscripted “p” means the value is in a pressure-coordinate system, and it is omitted hereinafter for briefness. The term on the left side of the equation is the vorticity tendency term (ζten) that represents local change of relative vorticity. The right side of the equation consists of five terms:
(1)
ζ h a d v = ( u ζ x + v ζ y ) is the advection term of relative vorticity, which is caused by the nonuniform horizontal distribution of relative vorticity;
(2)
ζ v a d v = ω ζ p is the convection term, which indicates the vertical transport of relative vorticity caused by the vertical motion;
(3)
ζ f a d v = v f y is the advection term of planetary vorticity. This term refers to the change of relative vorticity caused by the absolute-vorticity conservation when the air mass moves along the meridional direction;
(4)
ζ d i v = ( f + ζ ) ( u x + v y ) is the convergence/divergence term. This term indicates the increase or decrease in the preexisted vertical vorticity caused by the horizontal convergence or divergence;
(5)
ζ t i l t = ( ω x v p ω y u p ) is the tilting term. This term indicates the vertical vorticity change resulting from the nonuniform horizontal distribution of vertical motion.
Accordingly, the local variation of the relative vorticity (Equation (1)) can be simplified as:
ζ t e n = ζ t = ζ h a d v + ζ v a d v + ζ f a d v + ζ d i v + ζ t i l t
Based on the model output of domain 3, we can calculate all the terms on the right side of the vorticity equation at each grid point on each isobaric surface. The sum of the terms on the right side represents the local change of relative vorticity ( ζ t e n ) at each grid point. Through a simple statistical calculation, the mean values of each term in the vortex area can be obtained.
To obtain the magnitudes of each term in the vorticity equation at the initiation time of this MCV case, the scale analysis was conducted to show the contribution of each item to the vortex initiation. The diameter of MCV at the initiation time was about 40 km, indicating a typical meso-β scale system. Considering the actual situations in the lower troposphere at middle-low latitudes, the characteristic scales of the traditional variables were set as: U = 10 m·s−1, L = 104 m, τ = L/U = 103 s, f0 = 10−5s−1, Δp = 10 hPa, W = 10−1 m·s−1, and Ω0 = 100 Pa·s−1. Under these conditions, we could obtain the result of ζ0 = D0 = 10−3s−1.
Thus, the magnitudes of the terms in the vorticity equation are:
ζ h a d v = ( u ζ x + v ζ y ) 10 6 s 2
ζ v a d v = ω ζ p 10 6 s 2
ζ f a d v = v f y 10 8 s 2
ζ d i v = ( f + ζ ) ( u x + v y ) 10 6 s 2
ζ t i l t = ( ω x v p ω y u p ) 10 6 s 2
ζ t e n = ζ t 10 6 s 2
The results of the scale analysis reveal that the advection term of planetary vorticity caused by the meridional movement of air mass is two orders of magnitude smaller than other terms, whereas the orders of magnitude for the other four terms on the right side of Equation (2) are equal. In other words, these four terms are equally important to the vorticity change, and none of them is a dominant controlling factor. Therefore, the vorticity change depends on their joint effect.

4.2. Vorticity Budget at the MCV Initiation

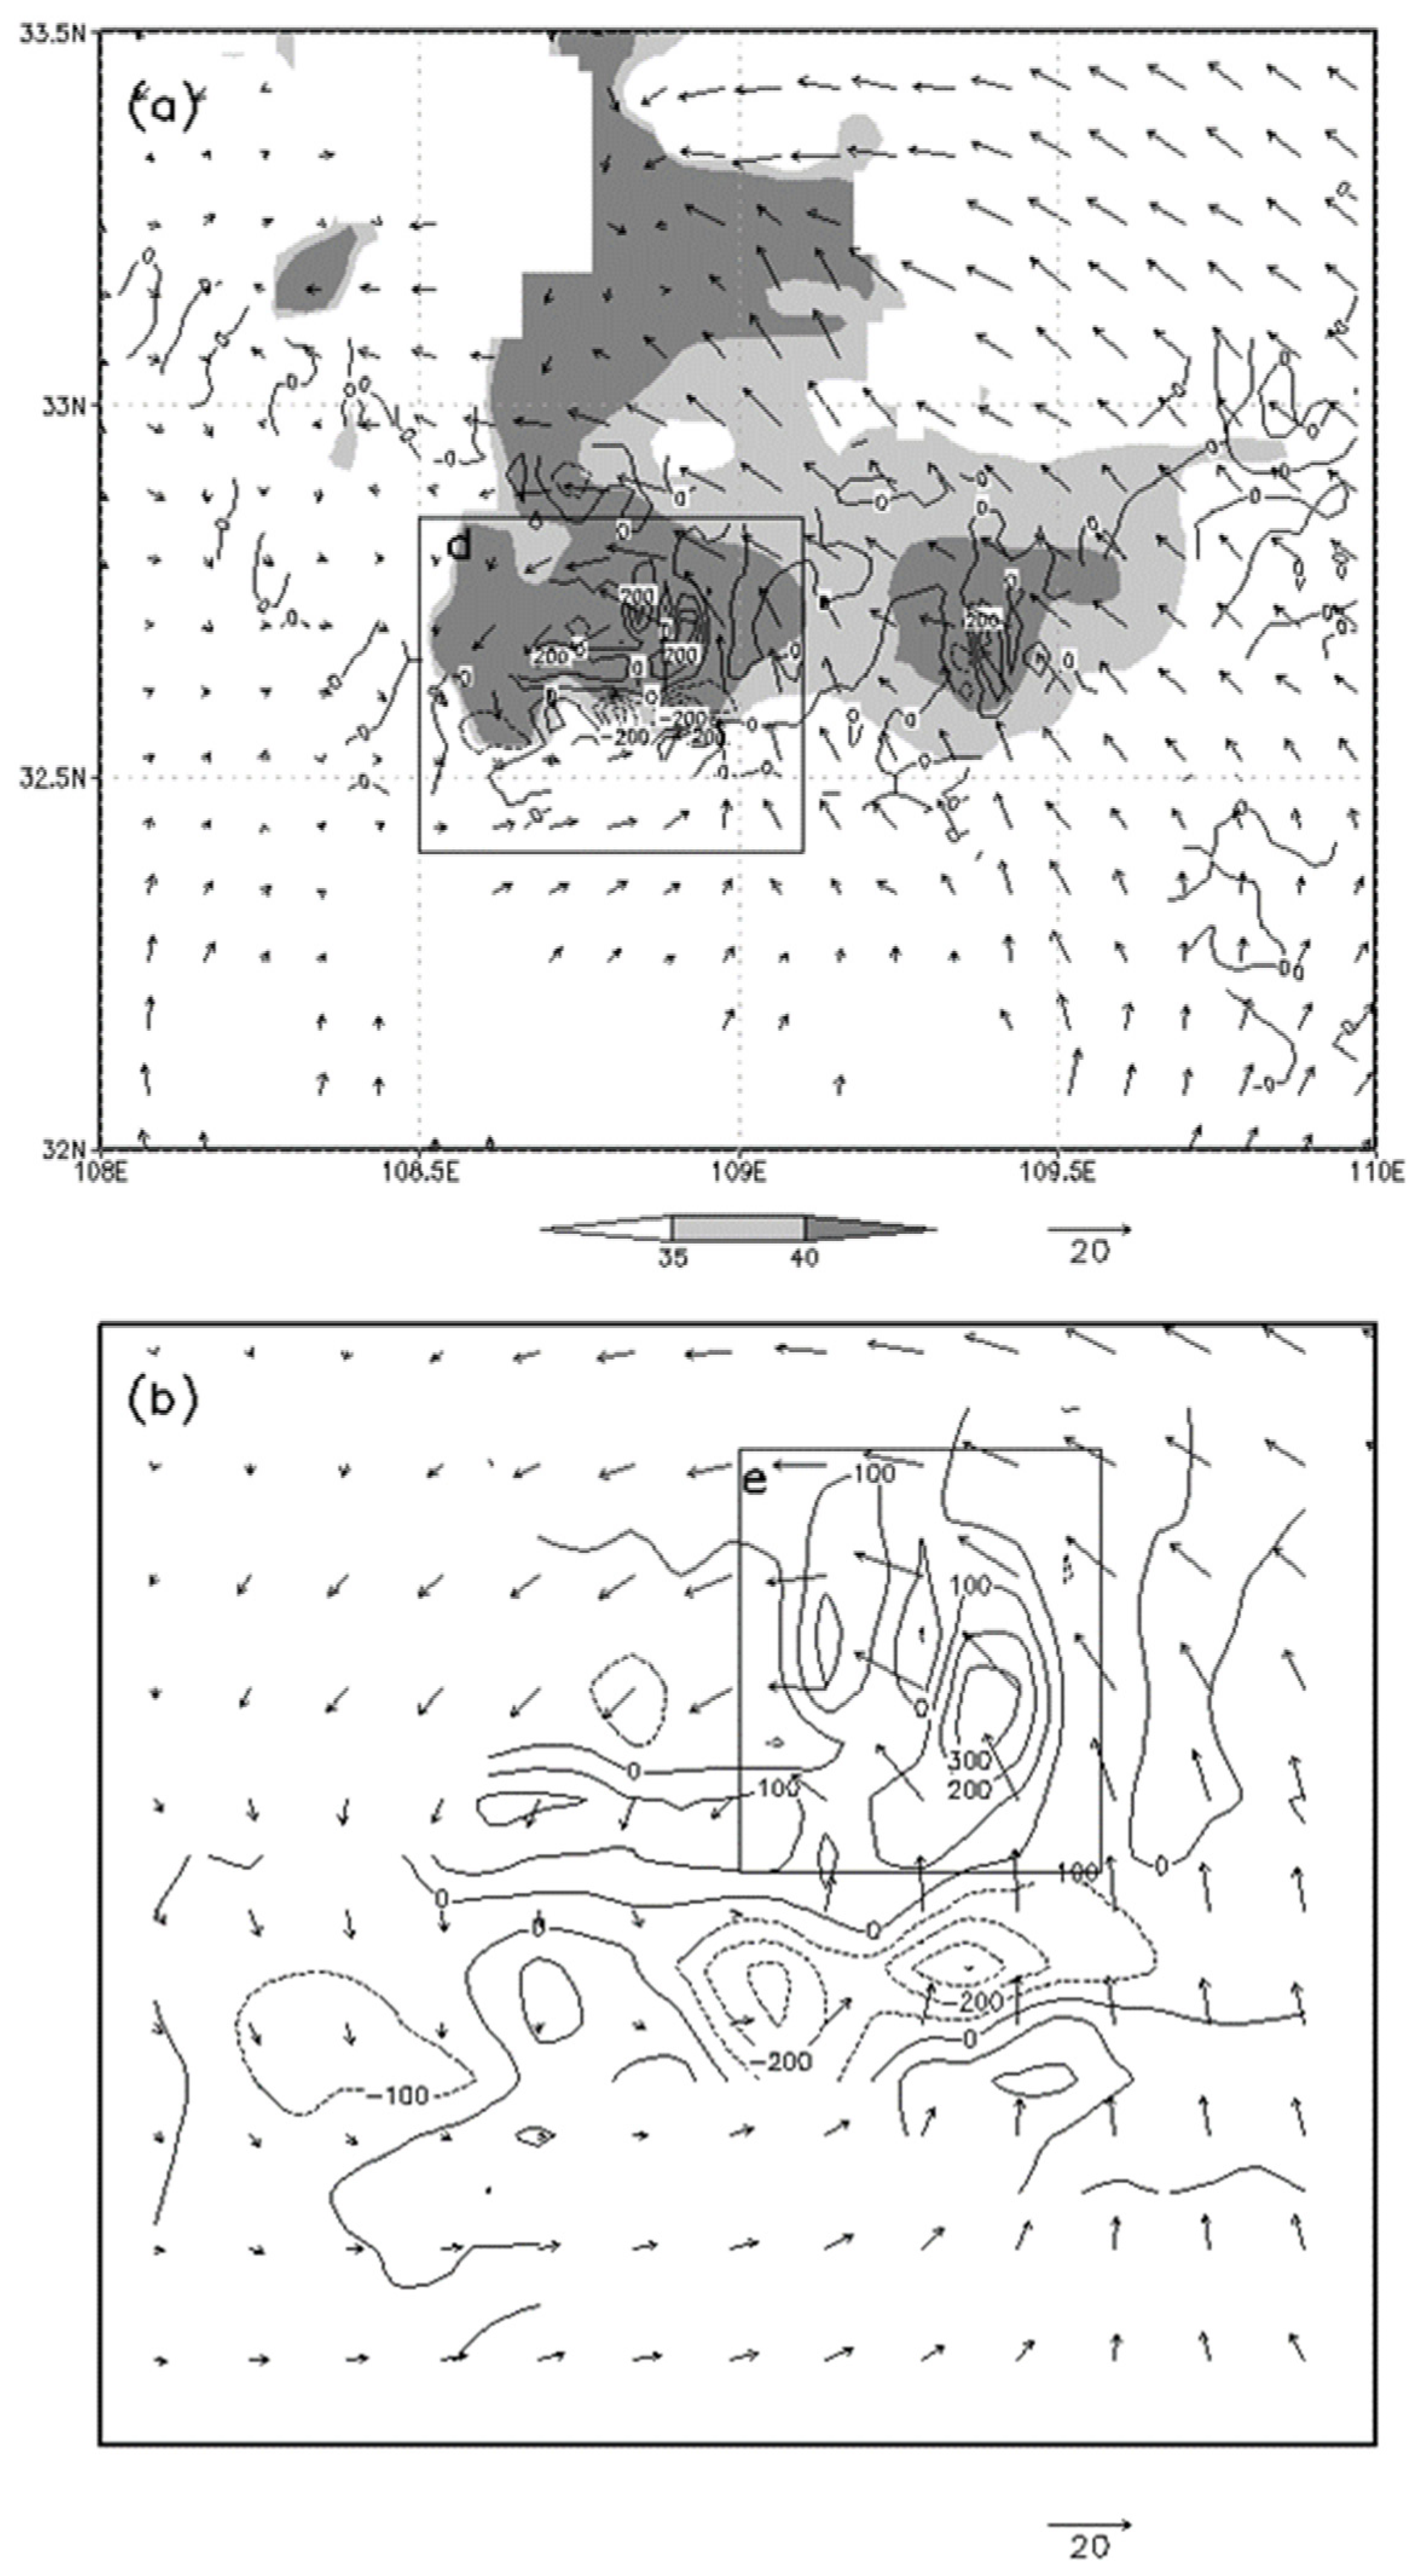
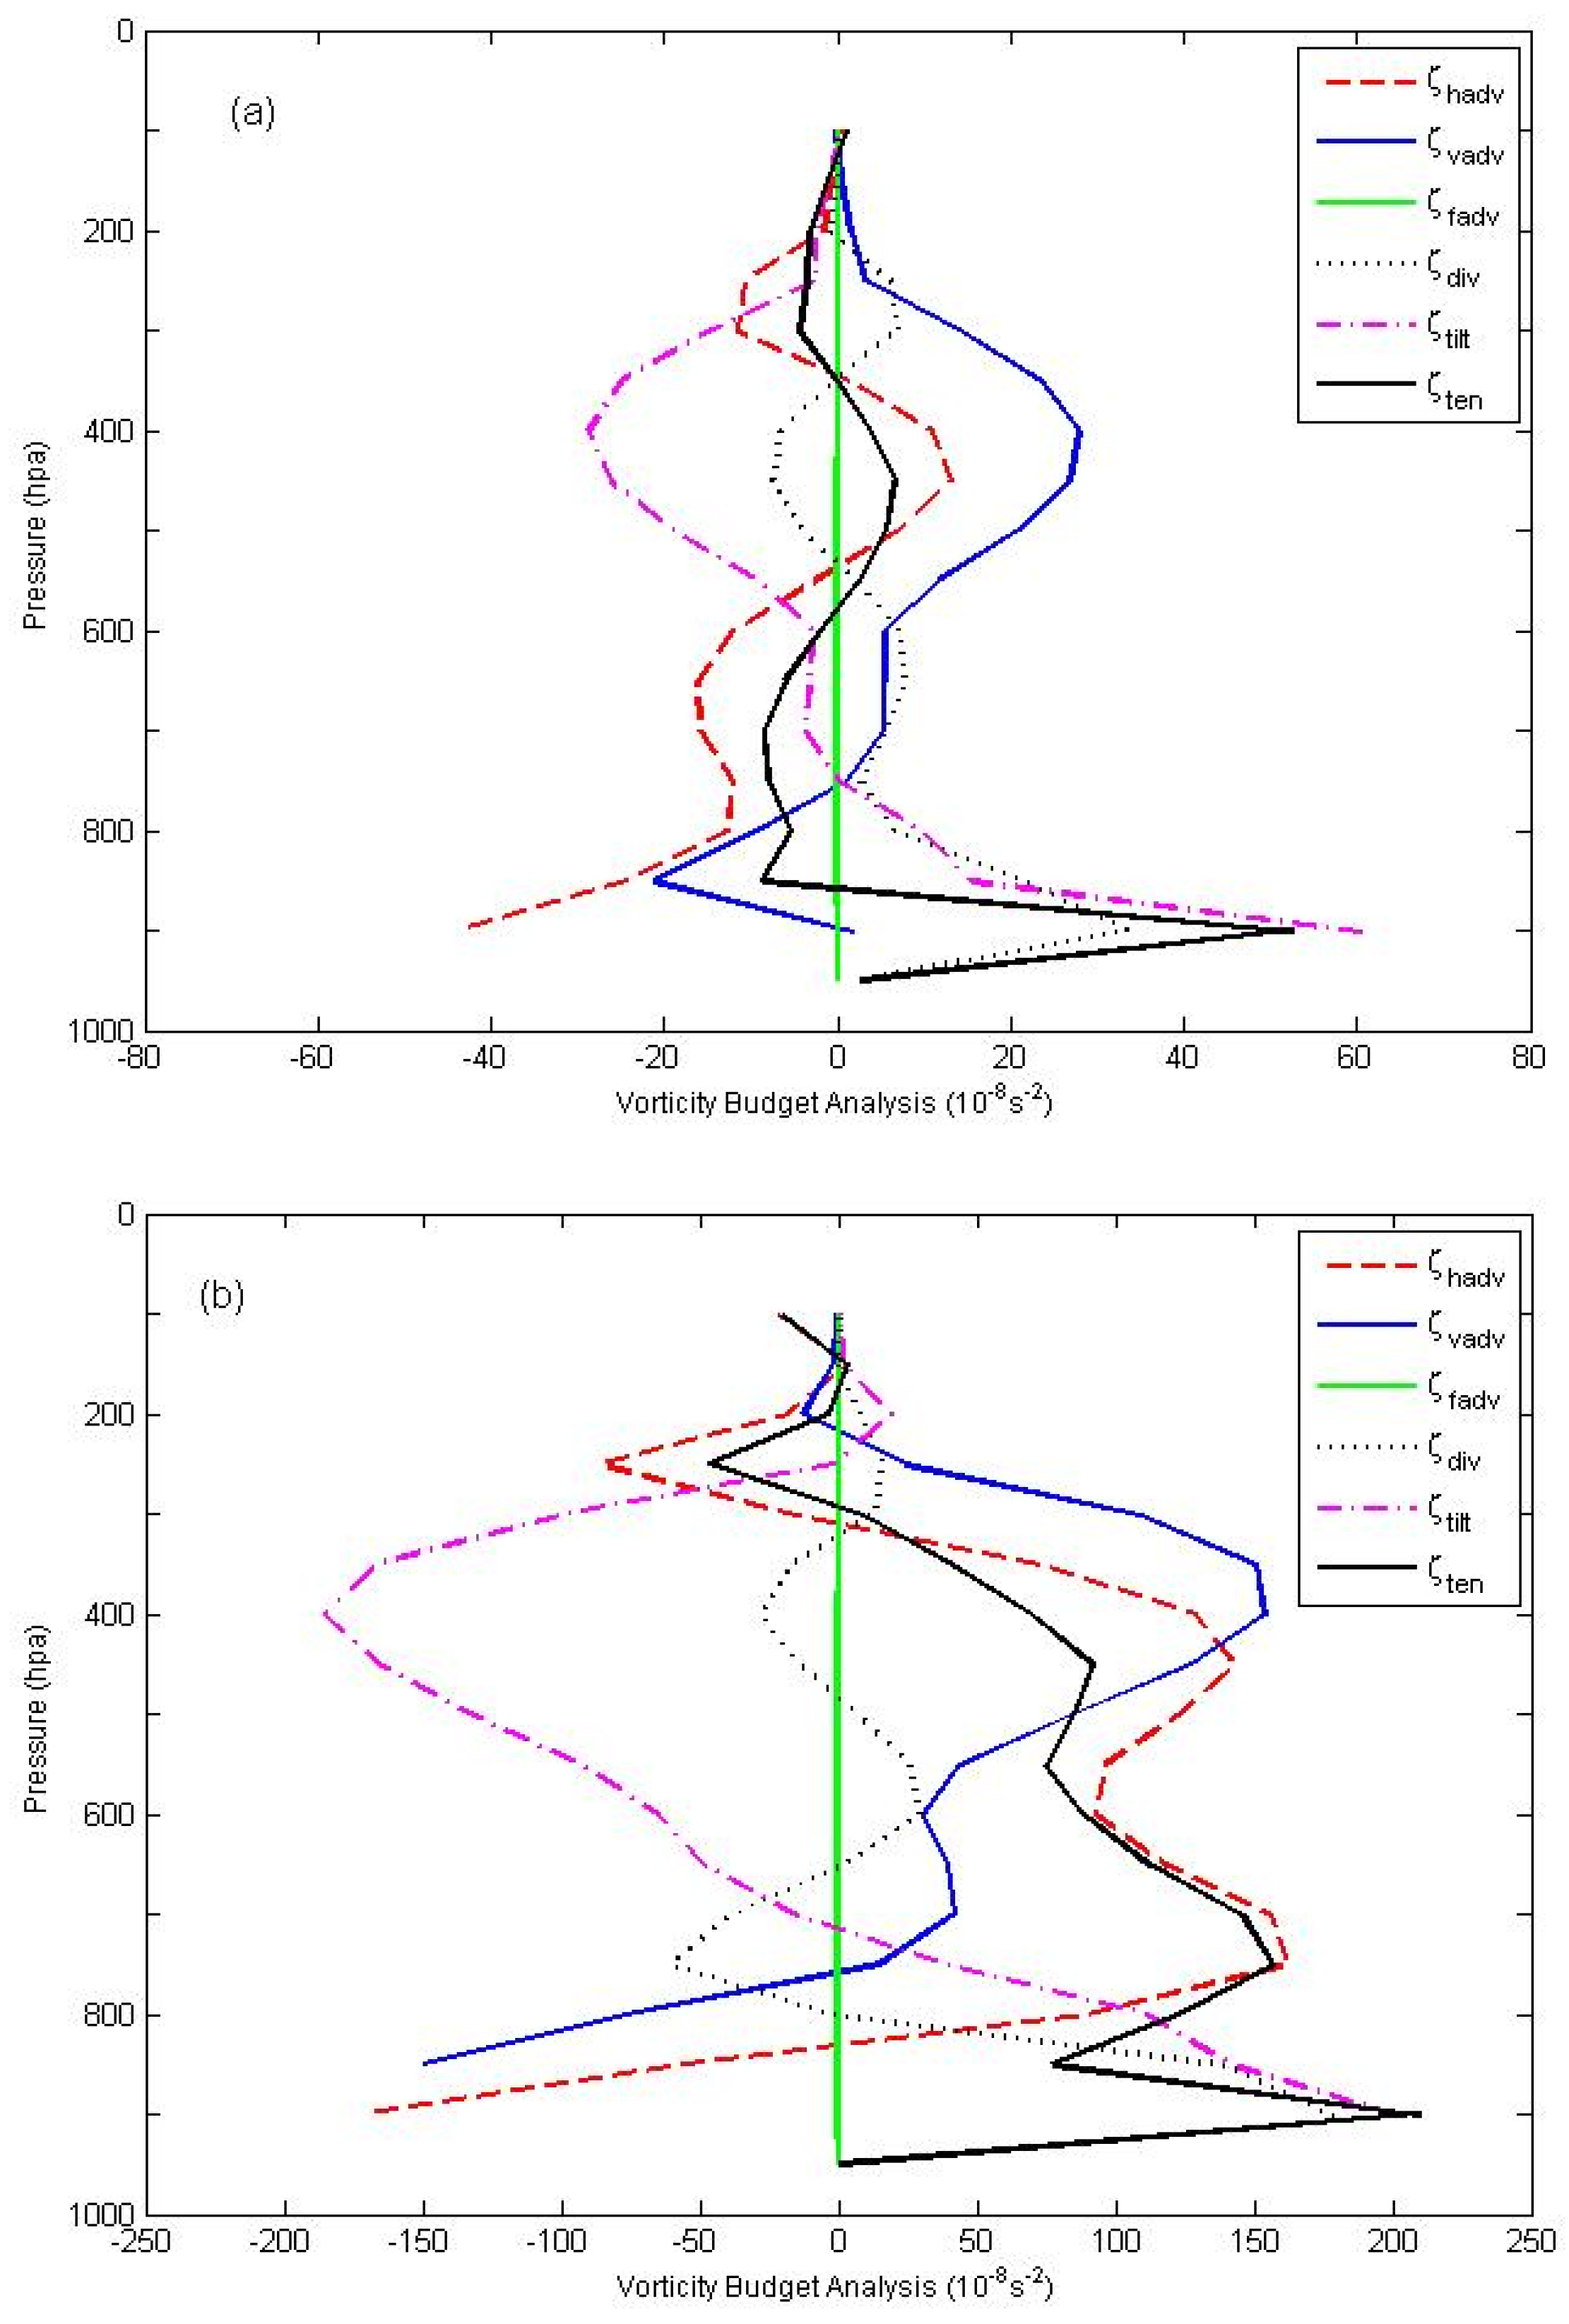
As mentioned above, the 850 hPa was used as the representative MCV level to study the vorticity budget at the MCV initiation stage. Figure 7 shows the simulated wind, relative-vorticity change (ζten), and reflectivity factor at 850 hPa at the MCV initiation time (t = 5 h). Figure 7b corresponds to the area d (the vortex region) in Figure 7a. As can be seen from the wind distribution in Figure 7, a vortex formed in the square area d at t = 5 h. Figure 8a shows the vertical profiles of the mean values of each term in Equation (2) over area d. It can be found that in the vortex region (Figure 8a) the convergence/divergence term ζ d i v and the advection term of relative vorticity ζ h a d v played almost opposite effects in the whole troposphere. They were similar in magnitude yet with opposite sign. Below 550 hPa, ζ d i v was positive and ζ h a d v was negative. Meanwhile, the convection term ζ v a d v and titling term ζ t i l t made opposite contributions in the whole troposphere. Above 750 hPa, these two terms were two symmetrical around the central line, while below 750 hPa, the absolute value of the tilting term was much larger than that of the convection term. The orders of magnitude of the above four terms were similar, whereas the advection term of planetary vorticity ζ f a d v was far smaller than the four terms. This result is consistent with the above scale analysis. On the whole, due to the balance among the four terms, the mean value of the local variation of relative vorticity ( ζ t e n ) in the vortex region was small, between 850 hPa and 100 hPa, and the large positive value of ζ t e n was mainly in 900 hPa. From Figure 7, the north–south-oriented vorticity-variation couplets are observed in area d. The existence of the vorticity-variation couplets led to the weak vorticity change in the whole vortex region (area d). From another aspect, such a distribution of positive–negative vorticity variations might be the mechanism for vortex movement on a certain isobaric surface. It indicates that the vortex tends to move to the location with the largest positive-vorticity variation.
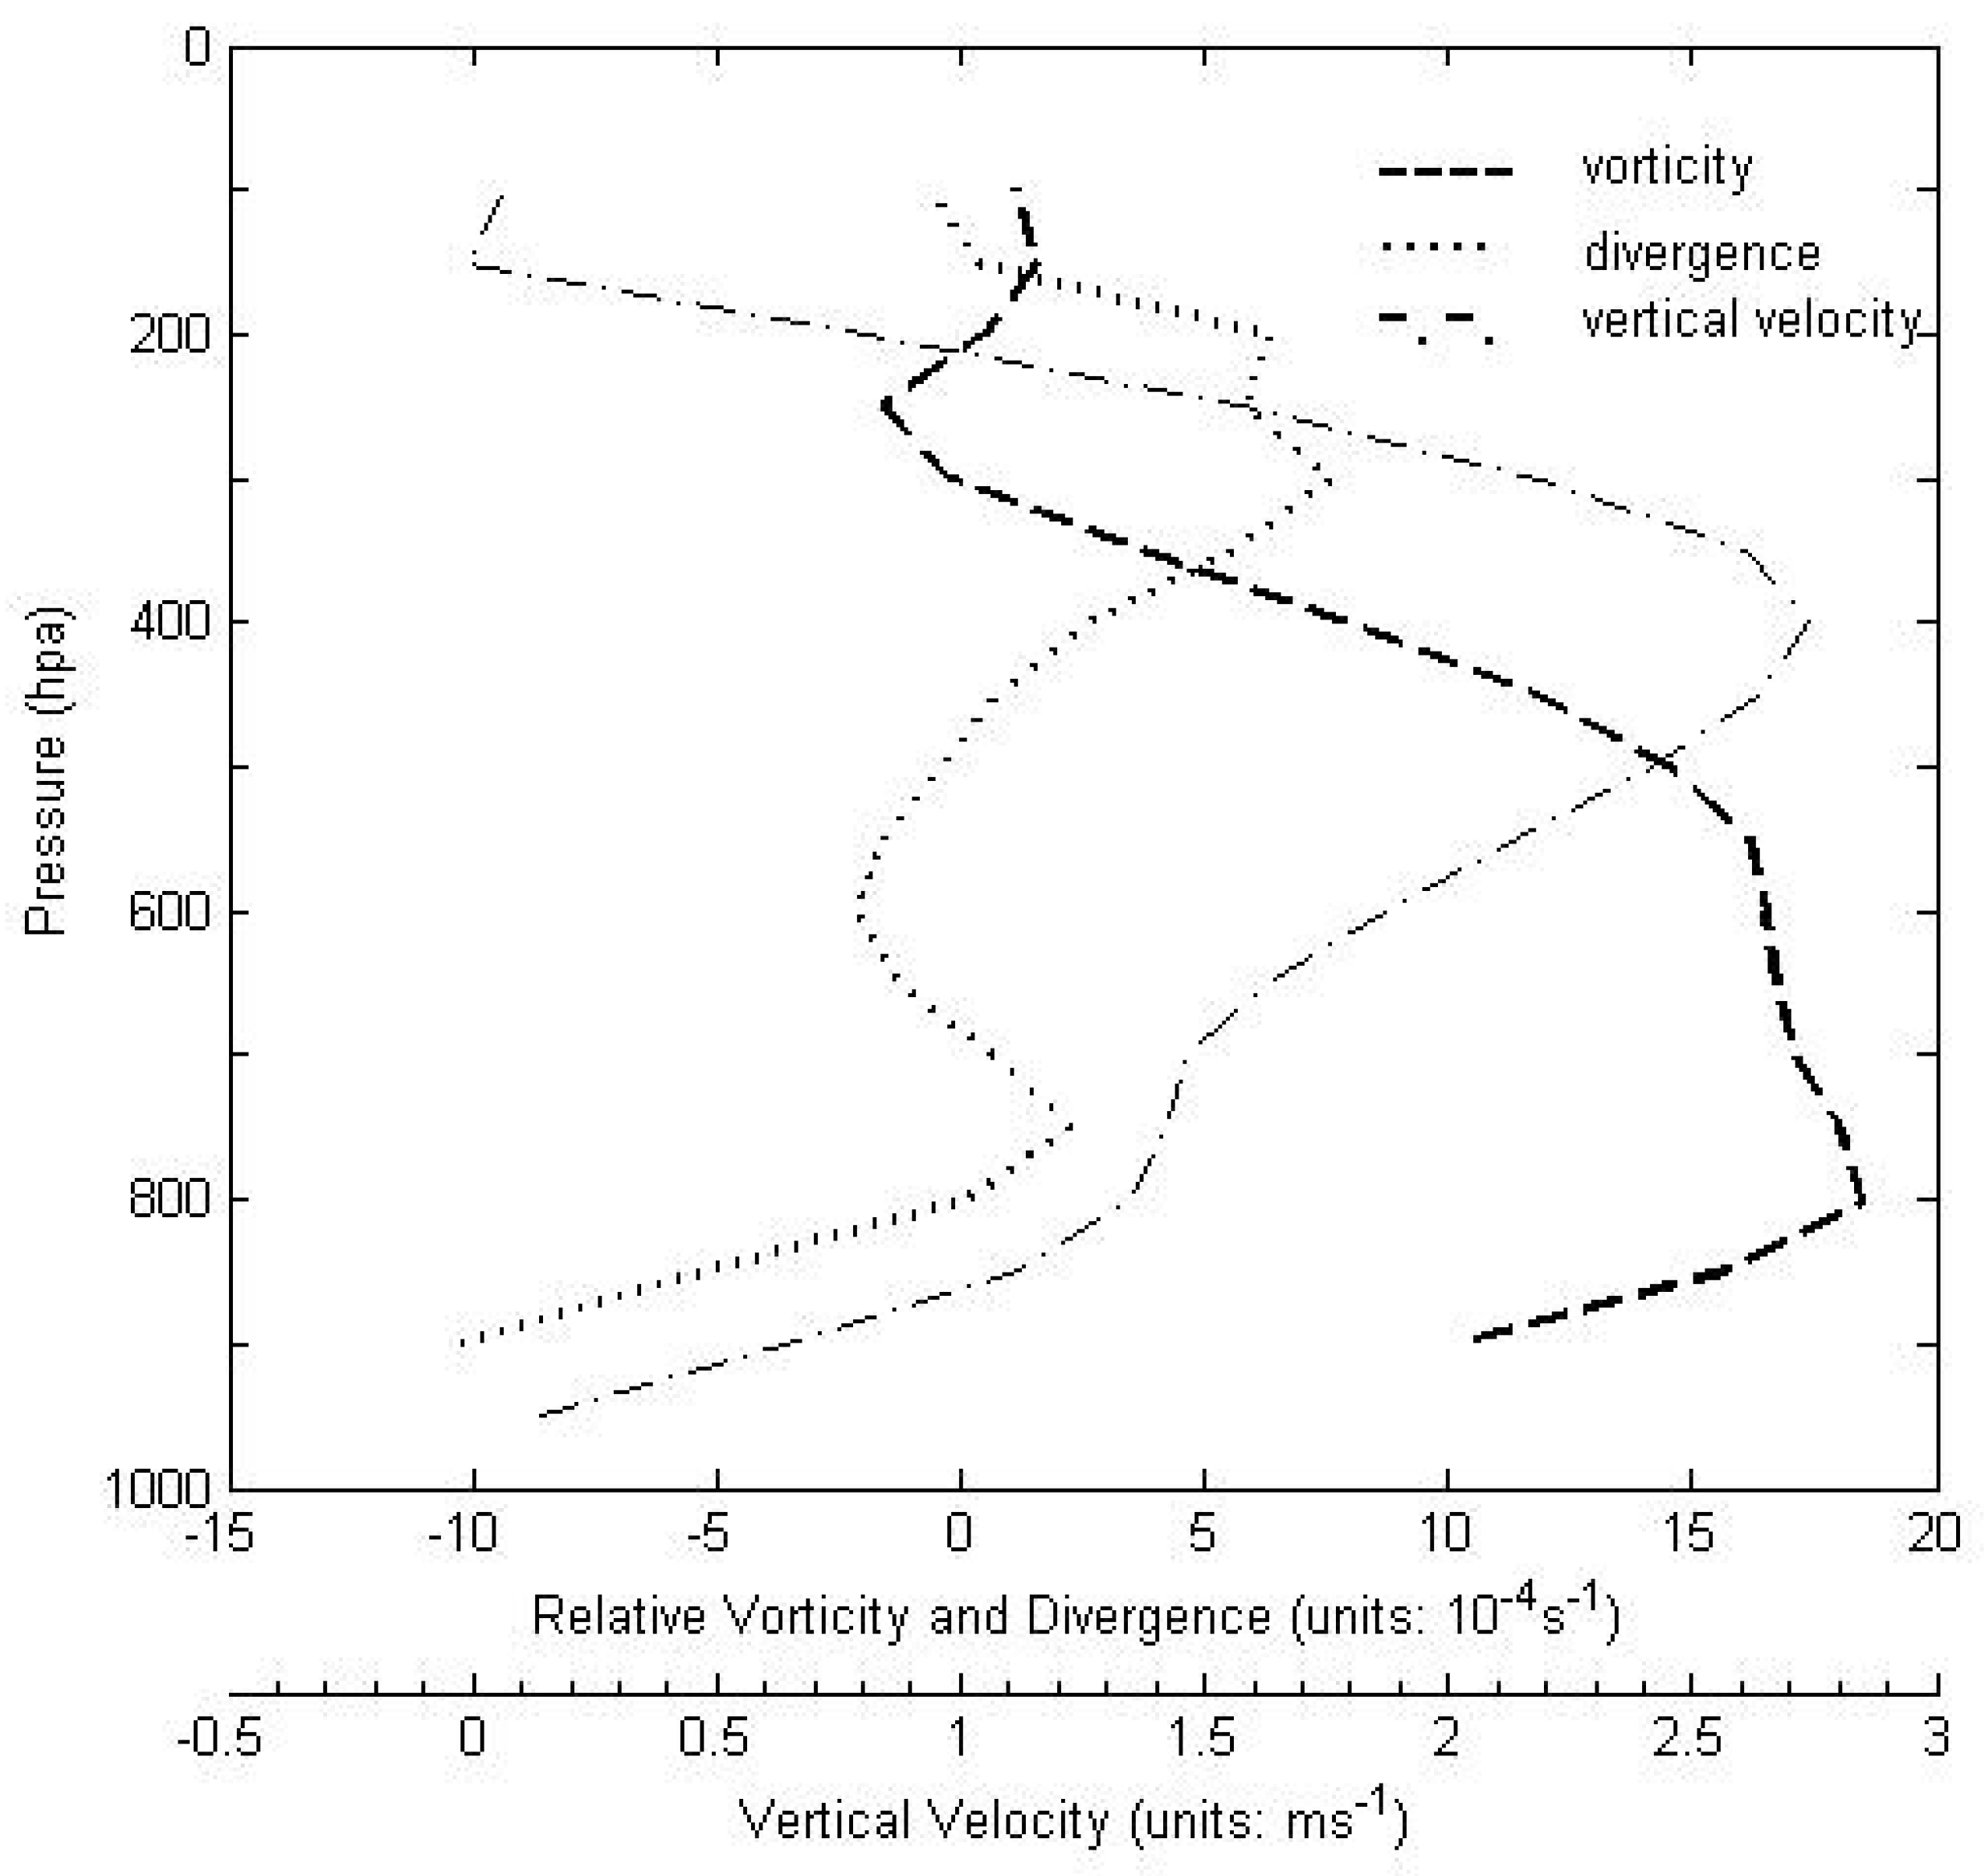
To further understand how the positive vorticity is generated, the positive vorticity-change area (area e) at 850 hPa was selected (Figure 7b). Furthermore, the mean values of each term at the MCV initiation (t = 5 h) in the vorticity equation in this region were calculated, and the profiles are presented in Figure 8b. Moreover, to better explain the effects of each item, Figure 9 shows the vertical profiles of the mean values of relative vorticity, divergence, and vertical velocity over the area e at t = 5 h. As can be seen from Figure 8b, there is a significant positive-vorticity change (the black solid line) below 300 hPa, with the order of magnitude reaching 10−6s−2 below 650 hPa. Corresponding to the convergence below 800 hPa (Figure 9), the convergence/divergence term is an important contributor to the positive-vorticity change. The advection term contributes negatively to the vorticity change below 850 hPa, but contributes positively between 300 and 800 hPa. Similar to area d, the tilting term and the convection term contribute oppositely to the vorticity change in area e. Below 750 hPa, the tilting term transforms the horizontal vorticity into the vertical vorticity, which is a positive contribution, while the convection term is a negative contribution. Above 750 hPa, the convection term transports the low-level vorticity to the upper and middle levels, generating a positive contribution, while the tilting term is a negative contribution. Moreover, the advection term of planetary vorticity does not contribute significantly to the vorticity change.
By comparing Figure 8a,b, we find there are large differences for the vorticity budgets, which are mainly caused by the different regions used to calculate the vorticity budget. Some of the terms cancel each other out for the whole vortex region (area d), but it is not the case in area e. In summary, in the lower troposphere around 850 hPa, the two main vorticity sources at the MCV initiation are the low-level airflow convergence and the tilting of the horizontal vortex tube caused by the upward motion (Figure 9). In contrast, the advection term and convection term inhibit the development of vorticity. Figure 9 shows that the vertical velocity reaches its maximum near 400 hPa, which corresponds to the peak value of the convection term near 400 hPa in Figure 8b. Affected by the convection term, the relative vorticity is transported upward from the low levels to the middle levels, which is the reason for the vorticity increase in the middle levels in the early stage of MCV development.

5. Discussion on the MCV Formation Mechanisms

5.1. Latent-Heat Release and Low-Level Convergence

Herotenstein et al. [37] pointed out that the response to diabatic-heating forcing is a mechanism of MCV formation. In the MCS that breeds the MCV, the air column is stretched due to the release of latent heat caused by the condensation in convective activities. Thus, the air pressure in the low levels decreases and results in airflow convergence. Under the influence of the Coriolis force, the converging airflow begins to rotate, resulting in an increase in local vorticity. Driven by the latent heating for a certain period of time, the mesoscale vortex gradually forms below the layer of maximum heating. Zhang et al. [38] and Menard et al. [39] also indicate that the airflow convergence caused by condensational heating is beneficial to the formation and enhancement of MCV in mesoscale convective complexes. As expected, in this case the convergence/divergence term is a main source of 850 hPa positive vorticity at the MCV formation time (Figure 8b).
In some MCV studies abroad, MCVs tend to form within the stratiform precipitation region [40,41], and the formation of MCV is caused by the atmospheric response to stratiform heating. However, in our case, the MCV forms within the convective precipitation region, and the formation of MCV is driven by the atmospheric response to convective heating. From the model output, we find that the lifting condensation level (LCL) in the MCV-formation area is about 1000 m above the ground. Considering the terrain height of 1000 m, the LCL is about 2000 m above the sea level (around 800 hPa). In our case, the MCV forms below 800 hPa. It is thus clear that the vortex initiates below the LCL, and the release of convective latent heat above the LCL causes the convergence of the low-level airflow, which is favorable for the formation of MCV in the low levels.

5.2. Upward Motion and the Titling of Vortex Tube

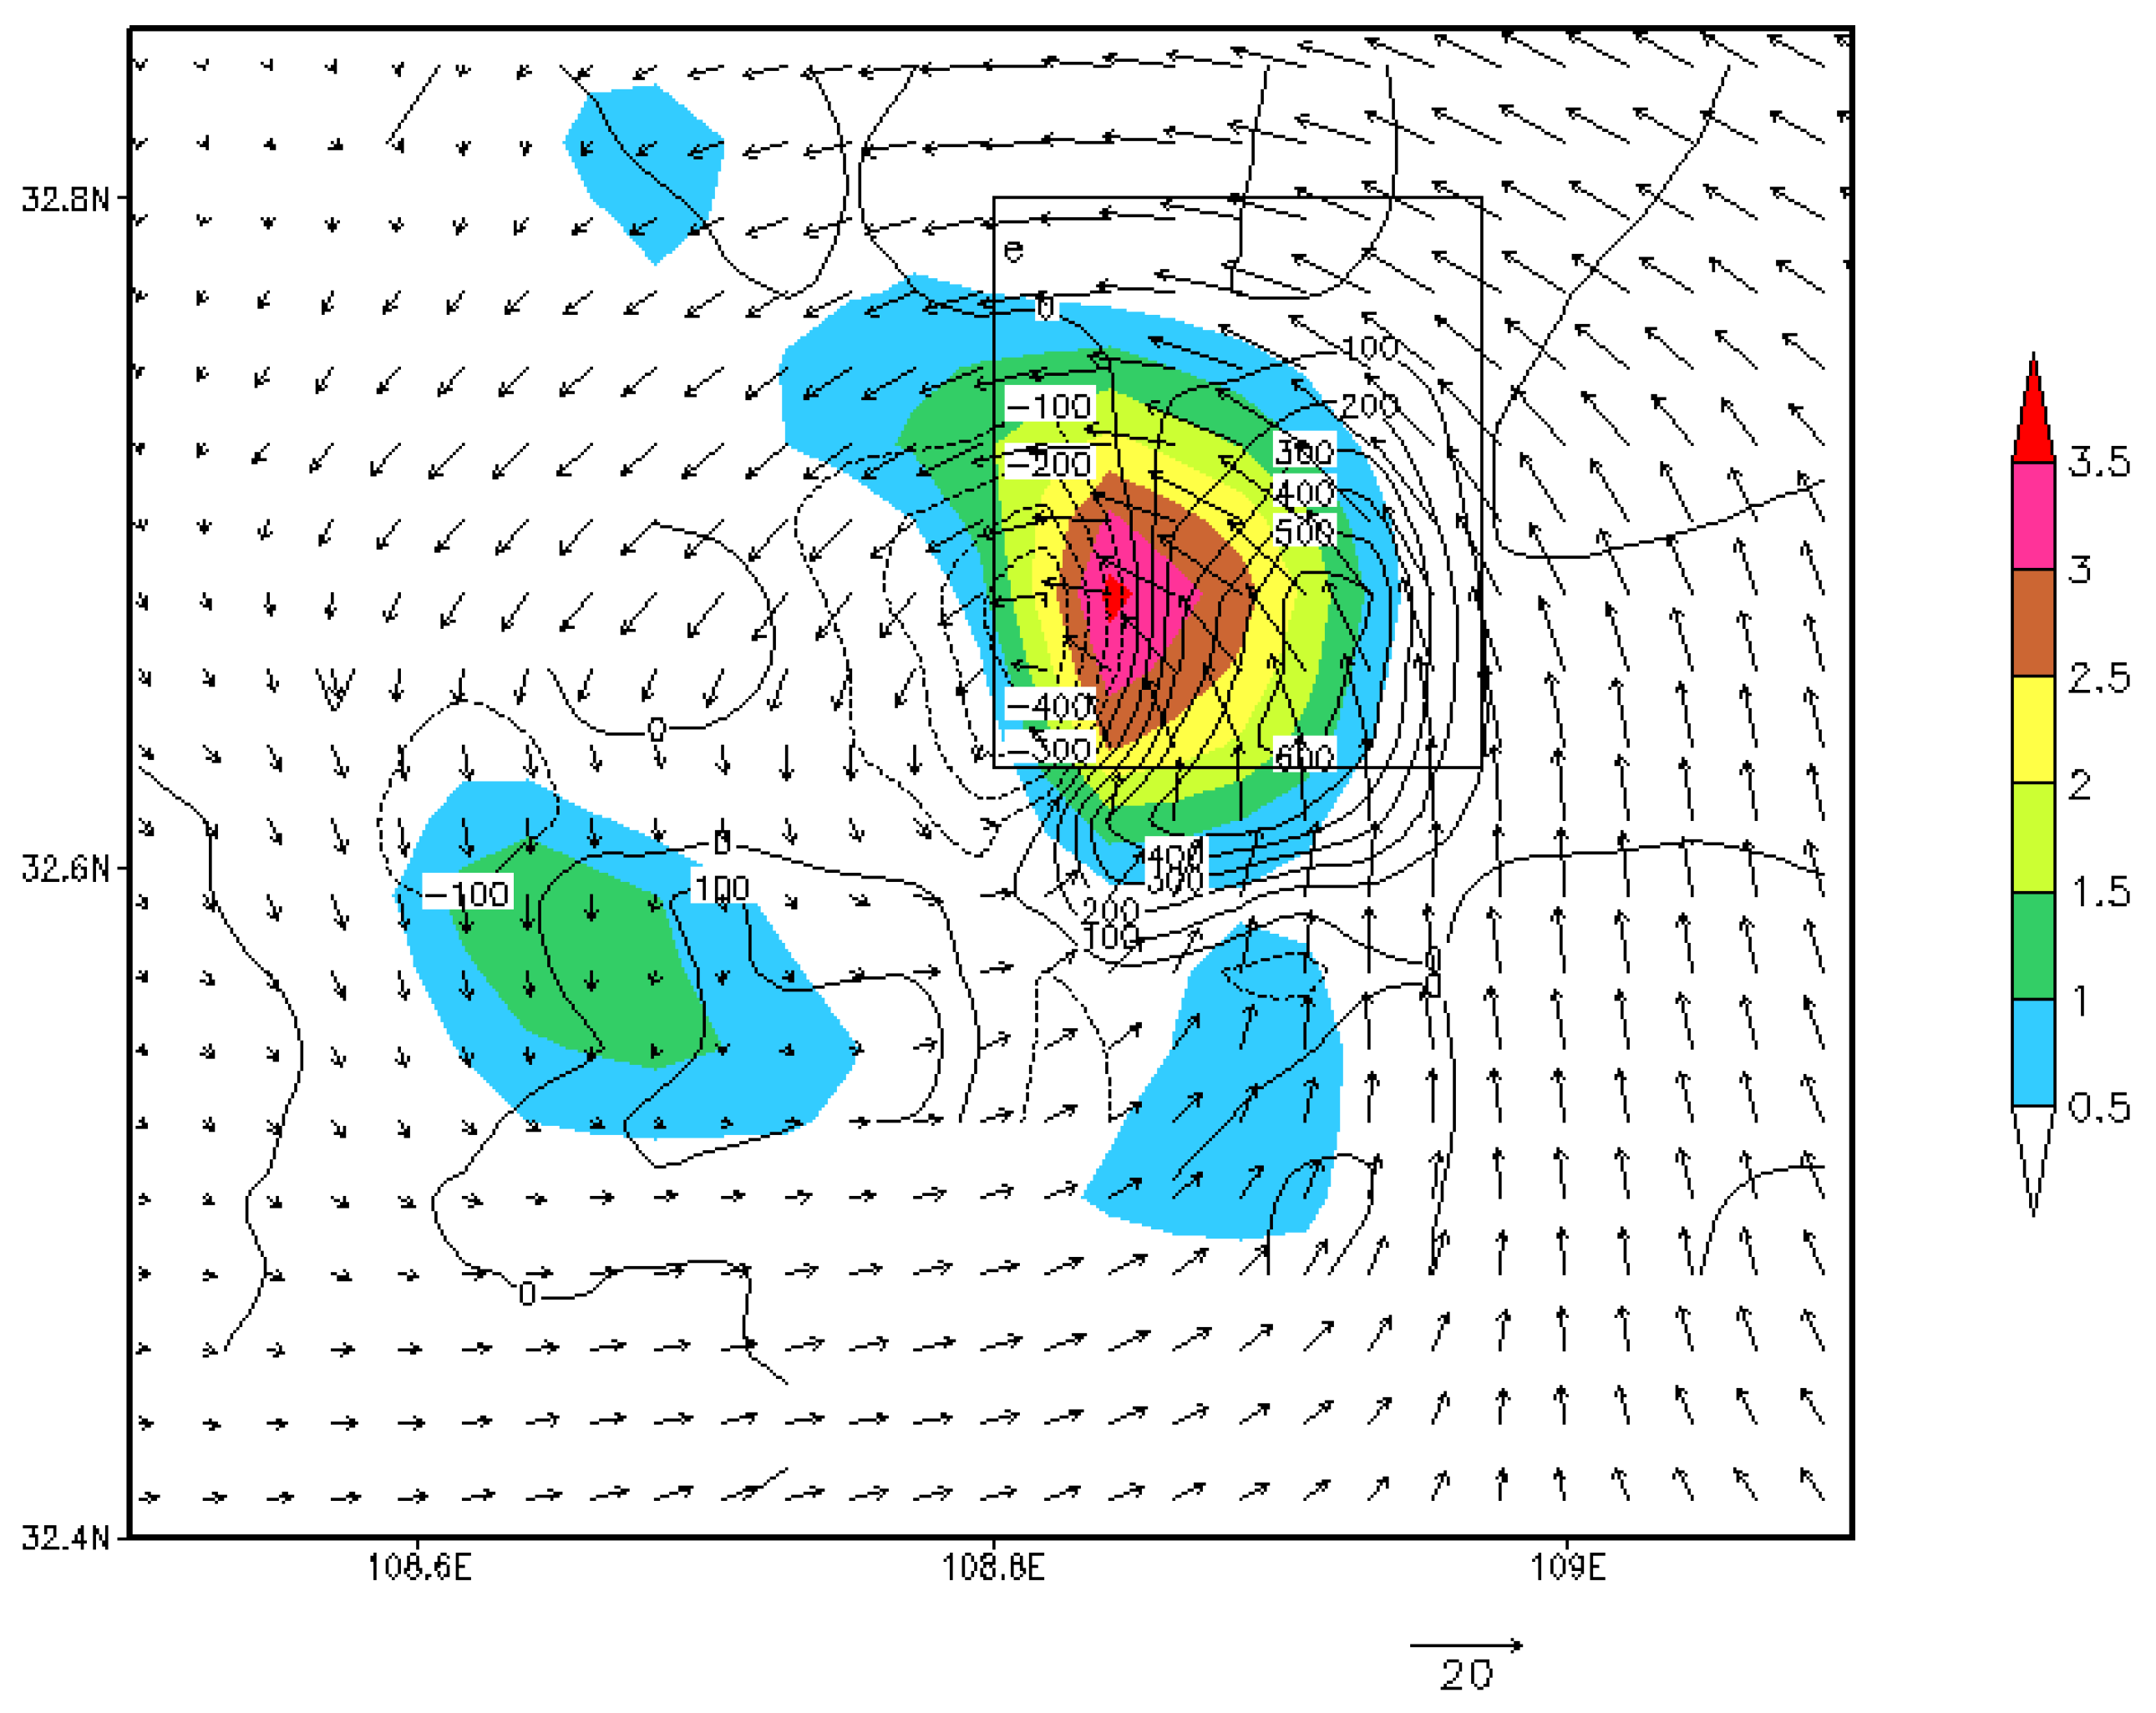
Similar to other MCV-observation studies [42], in our MCV case, the tilting of the horizontal vortex tube caused by the upward motion is important to the MCV formation (Figure 8b). Figure 10 shows the horizontal distribution of the tilting term (ζtilt), upward motion and horizontal wind in the vortex region (area d) at 850 hPa at the MCV initiation time (t = 5 h). We can find that the tilting term presents a symmetrical distribution around the core of upward motion (Figure 10). It suggests that the upward motion results in the tilting of the horizontal vortex tube and converts the horizontal vorticity into the vertical vorticity. Finally, the tilting produces positive vorticity to the east of the upward-motion core and negative vorticity to the west. In the positive-vorticity-change area (area e), ζtilt presents a positive contribution (Figure 7b), which further increases the low-level vorticity and promotes the formation of MCV.
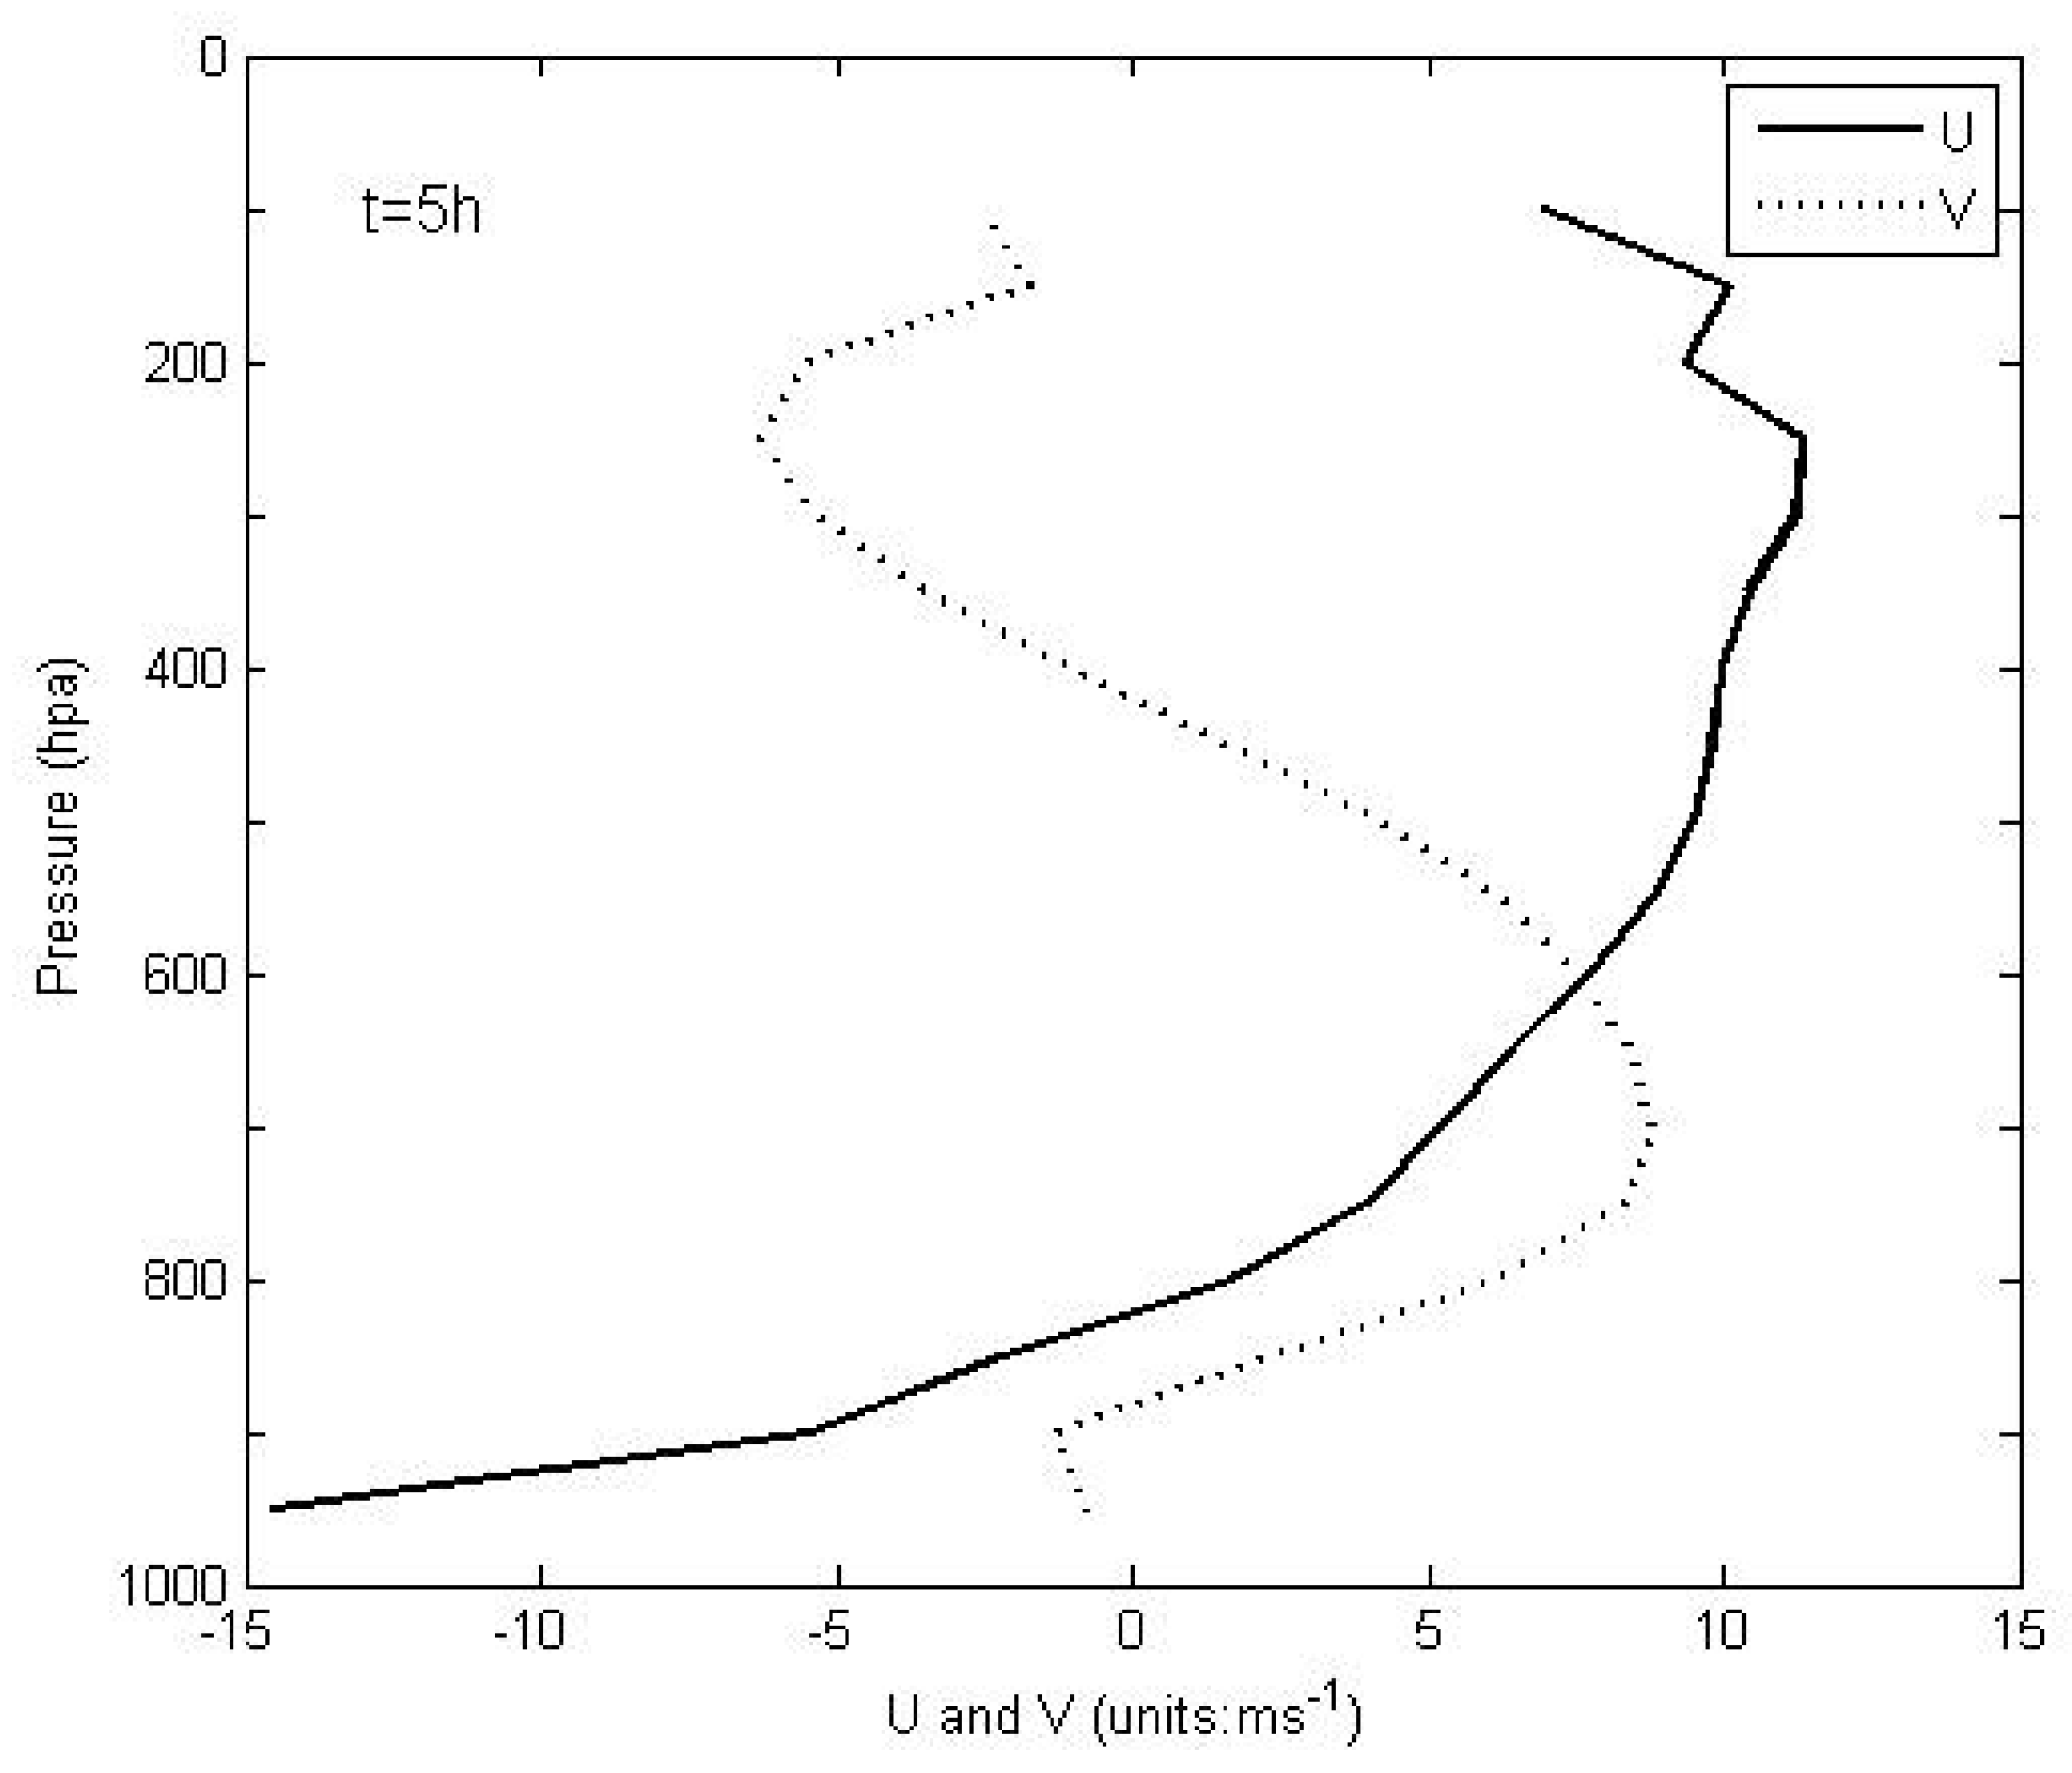
Figure 11 shows the vertical profiles of the u wind and v wind averaged in the vortex region (area d) at 850 hPa at the MCV initiation time (t = 5 h). As can be seen, u and v increased with height below 700 hPa, i.e., u p < 0 and v p < 0 . The left (west) and right (east) sides of the upward-motion core there are ω x < 0 and ω x > 0 , respectively. According to the expression of ζtilt in Section 4.1, on the left and right sides of the upward-motion core there should, respectively, be negative and positive ζtilt, which corresponds to the result in Figure 10. We could also explain the tilting of the vortex tube from a perspective of physics. The wind-field configuration in Figure 11 could create a southeast–northwest horizontal vortex tube in the lower troposphere. The updrafts in the convective system cause the tilting of the horizontal vortex tube, and result in an increase in the vertical vorticity on the east of the upward-motion core and a decrease on its west. Because the vortex tends to move towards the region with positive-vorticity change, the tilting term will cause the eastward movement of the vortex. It indicates that the eastward movement of the vortex is not only determined by the steering flow.

5.3. Rossby Radius of Deformation

In previous theoretical and simulation studies, researchers have found that the absolute geometric scale of atmospheric disturbance cannot effectively represent the actual geostrophic adjustment process [43]. In fact, the process of geostrophic adjustment depends on the ratio of the typical horizontal scale of the disturbance to the Rossby radius of deformation (Rd). Cotton et al. [44] used Rd to evaluate the relative importance of rotation and inertia stability under a certain disturbance scale. The mathematical expression of Rd is:
R d = N H / [ ( ζ + f ) 1 / 2 ( 2 V T R 1 + f ) 1 / 2 ]
where N [ g θ ( θ z ) ] 1 / 2 is the Brunt-Väisällä frequency, H is the height of the disturbance, ζ is the vertical component of relative vorticity, f is the Coriolis parameter, VT is the tangential wind, and R is the curvature radius of rotating airflow. Essentially, Rd represents the ratio of the vertical static stability to the horizontal inertial stability. When the horizontal scale of the circulation is greater than or close to Rd, the air-pressure field dominates the change of airflow, and the wind field adjusts to the pressure field. Consequently, the circulation is in a quasi-equilibrium state and will last for a long time. This type of circulation disturbance is often termed as “large-scale disturbance”. On the contrary, when the horizontal scale of the circulation is much smaller than Rd, the wind field in the circulation will dissipate rapidly due to the effect of the gravity wave. In this case, the circulation disturbance is deemed as the “small-scale disturbance” and its lifetime is relatively short.
In our case, considering the latent-heat release caused by strong convection, the calculation of the Brunt–Väisälä frequency adopts the formula under the vapor saturation [45]:
N 2 = g [ A θ e / z q w / z ]
where g = 9.88 m·s−2, θ e is the pseudo-equivalent temperature, and q w = q c + q r + q s is the total mixing ratio of various water phases. q c , q r and q s are the mixing ratios of cloud water, rainwater, and snow, respectively. The coefficient A is expressed as:
A = θ 1 ( 1 + 1.61 ε L q v R d T ) / ( 1 + ε L 2 q v C p v R v T 2 )
where q v is the water-vapor-mixing ratio, L = 2.5 × 10⁶ J·kg−1 is the condensational heating of water vapor, ε   = 0.622, R d = 287 J·kg−1·K−1, R v   = 461.5287 J·kg−1·K−1, C p v is the specific heat of water vapor at constant pressure (about 1870 J·kg−1·K−1), θ is the potential temperature, and T is the temperature. Except for θ e , all the variables in Equations (3)–(5) can be obtained directly from the model outputs. The calculation of θ e follows the formula of Yang et al. [46]:
θ e = θ ( 1 + 0.46 r ) e L r C p d T k
where L and θ are the same definitions as above, C p d = 1004 J·kg−1·K−1 is the specific heat of dry air at constant pressure, r is the mixing ratio, and Tk is the temperature at the LCL, which is about 800 hPa in this case.
By using model outputs and substituting Equations (4)–(6) into Equation (3), we can obtain the value of Rd. After calculation, at the MCV formation time (t = 5 h) the pseudo-equivalent temperature θ e at the vortex center at 850 hPa is about 357.3 K, and the Brunt–Väisälä frequency N is about 12.75 × 10⁻³s−1. According to the height (800 hPa) where the vortex formed, H is set as 2000 m. The average tangential wind is about 6 m·s−1, the curvature radius of the vortex is about 20 km, the vorticity at the vortex center is 15 × 10−4s−1, and the Coriolis parameter is 7.858 × 10⁻⁵s−1. By substituting the above values into Equation (3), the value of Rd is found to be around 25 km, and the horizontal scale of MCV at its initiation (40 km) is larger than Rd. Therefore, the vortex was a “large scale disturbance” and would persist for a long time. The results from the reanalysis data show that this MCV lasted for about 43 h, and was indeed a long-lived MCV. In common sense, the Rd in middle latitudes is usually ~1000 km for synoptic-scale systems. However, for this MCV case, the initial disturbance was localized and small scale, which is quite different from the situation in synoptic-scale or large-scale systems.
However, we should keep in mind that besides the internal thermal dynamics, the duration of MCV closely depends on the synoptic background and the interactions with other mesoscale systems. In this section, the investigation on the scale of disturbance and Rossby radius of deformation is to verify the correctness of the geostrophic adjustment theory in this MCV case; we are not to predict the duration of the MCV by the scale of disturbance and Rossby radius of deformation. According to our analysis, the longevity of this MCV is mainly caused by the interactions between MCV and MCS.

6. Discussions and Conclusions

A long-lasting heavy rainstorm occurred on 16–18 August 2009 in Henan, Shandong, and Jiangsu Provinces in China. In this study, the WPSH, the low-level shear lines and the low-level jet were the main large-scale rain-producing systems. The MCV was generated in the MCS, and it in turn contributed to the development and maintaince of the parent MCS. Meanwhile, the MCV triggered new convection to its southeast by interacting with the background environment. From a broad perspective, MCV could be deemed as a self-sustaining mechanism of the MCS. Steered by the average wind in middle-low levels, the MCV moved towards the east by north. The MCV moved fast at its early stage, slowed down after maturity, and stagnated and spun at the dissipation stage. The moving track of MCV was basically the same as that of the MCS.
The formation process of this MCV was simulated using the WRF model and NCEP reanalysis data. The results show that the model simulated the MCS and MCV activities well. The scale analysis on the vorticity equation indicates that the advection term of planetary vorticity contributed very little to the local vorticity change (10−8s−2). In comparison, the advection term of relative vorticity, the convection term, the convergence/divergence term, and the titling term were of the same order, about 10−6s−2. These four terms jointly determined the variation of local vorticity in the initiation of this MCV.
The output of domain 3 suggests that the MCV formed at 1700 on 16 August. It formed at low levels (below 800 hPa), and the vortex characteristic was most noticeable at 850 hPa. The vorticity-budget analysis reveals that the MCV was formed in the convective-precipitation region, and there were vorticity-variation couplets in the vortex region at the MCV initiation time. The vortex moved towards the region with positive-vorticity change. Averaged over the whole vortex region, the contributions of the convergence/divergence term and the advection term of relative vorticity to local vorticity canceled each other out in the whole troposphere. Similarly, the contributions of the tilting term and the convection term canceled each other out. In the region with positive-vorticity change, the convergence/divergence term and the tilting term were the sources of positive vorticity in the low levels; the tilting term and the convection term were in the same magnitude but opposite sign in the entire troposphere. Within the vortex region, the vertical velocity peaked in the middle level. After the vortex was formed, the convection term transported the vorticity upwards from the low levels.
The forced response of the atmosphere to the diabatic heating is one of the formation mechanisms of the MCV. In previous studies, MCV was noted to generate in the stratiform-cloud region of the parent MCS [8]. However, in this case, the MCV formed in the convective-precipitation region. The LCL was at about 800 hPa, and above 800 hPa the condensational heating caused by convective precipitation warmed and stretched the air column. Then, the pressure in the low levels decreased and the air flow converged. Under the Coriolis force, the air flow rotated and the local vorticity was increased. It should be noted that in our case, the MCV was caused by the forced response of the atmosphere to convective heating, not stratiform heating. Hence, the height of the heating layer was relatively low, and consequently the formation height of the MCV was also low (below 800 hPa). Previous studies have shown that the formation height of the MCV in China is generally low [47], and comparatively higher in the US [9]. The case analysis in this study is in agreement with this conclusion.
Another mechanism for the formation of the MCV is the tilt of the horizontal vortex tube caused by the upward motion in convection. In this case, a southeast–northwest horizontal vortex tube was tilted due to the upward motion. Then, the vertical vorticity on the southeast of the upward-motion core increased, and finally the MCV formed. The calculation of Rd at the MCV formation time shows that the vortex disturbance scale was larger than Rd. Namely, the disturbance was dynamically large, the wind field adjusted to the pressure field, and the vortex circulation lasted for a long time.
Overall, the MCV case analyzed in this paper is some different from those in the previous studies. For example, the formation height of the MCV was relatively low, and the formation position was in the convective-precipitation region of the parent MCS. Are all the MCVs in this region such as this, however? What are the reasons for the difference between this MCV and the MCVs in the US? To answer these questions, more MCV case studies are needed. In future, we will focus on the triggering effect of MCVs on secondary convection, as well as the necessary environmental conditions to generate secondary convection.

Author Contributions

Conceptualization, J.S.; methodology, Y.S.; software, C.J.; validation, Y.S. and C.J.; formal analysis, Y.S.; investigation, Y.S.; resources, J.S.; data curation, B.Z.; writing—original draft preparation, Y.S.; writing—review and editing, B.Z.; visualization, C.J.; supervision, J.S.; project administration, Y.S.; funding acquisition, Y.S. and J.S. All authors have read and agreed to the published version of the manuscript.

Funding

This research was funded by the Jiangsu Province “333” project (BRA2020429), the National Natural Science Foundation of China (41305051, Key Program 91937301), and the Meteorological Union Fund of the National Natural Science Foundation of China (U2142203).

Institutional Review Board Statement

Not applicable.

Informed Consent Statement

Not applicable.

Data Availability Statement

The NCEP data are openly available https://psl.noaa.gov/data/gridded/ (accessed on 15 January 2019).

Acknowledgments

We appreciate the provision of the NCEP/NCAR reanalysis data from the National Center for Meteorological and Environmental Forecast (NCEP) and National Center for Atmospheric Research (NCAR). We thank Nanjing Hurricane Translation for reviewing the English language quality of this paper.

Conflicts of Interest

The authors declare no conflict of interest.

References

  1. Ge, J.J.; Zhong, W.; Lu, H.C. A diagnostic analysis of vorticity-divergence effects and the quasi-balanced flow in a mesoscale vortex during the process of flash-flood-producing rainstorm. Acta Meteorol. Sin. 2011, 69, 277–288. (In Chinese) [Google Scholar]
  2. Green, A.; Gopalakrishnan, S.G.; Alaka, G.J., Jr.; Chiao, S. Understanding the role of mean and eddy momentum transport in the rapid intensification of Hurricane Irma (2017) and Hurricane Michael (2018). Atmosphere 2021, 12, 492. [Google Scholar] [CrossRef]
  3. Wang, Y.; Wang, T. Numerical simulation of a heavy rainstorm in Northeast China caused by the residual vortex of Typhoon 1909 (Lekima). Atmosphere 2021, 12, 120. [Google Scholar] [CrossRef]
  4. Fu, S.M.; Yu, F.; Wang, D.H.; Xia, R.T. A comparison of two kinds of eastward-moving mesoscale vortices during the mei-yu period of 2010. Sci. China Earth Sci. 2012, 42, 1282–1300. [Google Scholar] [CrossRef]
  5. Liu, J.Y.; Tan, Z.M.; Zhang, Y. Study of the three types of torrential rains of different formation mechanism during the meiyu period. Acta Meteorol. Sin. 2012, 70, 452–466. [Google Scholar] [CrossRef]
  6. Zhang, Y.; Zhang, F.; Davis, C.; Sun, J. Diurnal evolution and structure of long-lived mesoscale convective vortices along the Mei-yu front over the East China Plains. J. Atmos. Sci. 2018, 75, 1005–1025. [Google Scholar] [CrossRef]
  7. Fu, S.M.; Mai, Z.; Sun, J.H.; Li, W.L.; Ding, Y.; Wang, Y.Q. Impacts of convective activity over the Tibetan Plateau on plateau vortex, southwest vortex, and downstream precipitation. J. Atmos. Sci. 2019, 76, 3803–3830. [Google Scholar] [CrossRef]
  8. Bartels, D.L.; Maddox, R.A. Midlevel cyclonic vortices generated by mesoscale convective systems. Mon. Weather Rev. 1991, 119, 104–118. [Google Scholar] [CrossRef] [Green Version]
  9. Davis, C.A.; Galarneau, T.J. The vertical structure of mesoscale convective vortices. J. Atmos. Sci 2009, 66, 686–704. [Google Scholar] [CrossRef]
  10. Fritsch, J.M.; Murphy, J.D.; Kain, J.S. Warm core vortex amplification over land. J. Atmos. Sci. 1994, 51, 1780–1807. [Google Scholar] [CrossRef]
  11. Davis, C.A.; Trier, S.B. Mesoscale convective vortices observed during BAMEX. Part I: Kinematic and thermodynamic structure. Mon. Weather Rev. 2007, 135, 2029–2049. [Google Scholar] [CrossRef] [Green Version]
  12. Davis, C.A.; Ahijevych, D.A.; Trier, S.B. Detection and prediction of warm season midtropospheric vortices by the Rapid Update Cycle. Mon. Weather Rev. 2002, 130, 24–42. [Google Scholar] [CrossRef]
  13. Rogers, R.F.; Fritsch, J.M. Surface cyclogenesis from convectively driven amplification of midlevel mesoscale convective vortices. Mon. Weather Rev. 2001, 129, 605–637. [Google Scholar] [CrossRef]
  14. Shu, Y.; Sun, J.S.; Pan, Y.N. Characteristics of mesoscale vortices over China in 2015. J. Meteorol. Res. 2017, 31, 1149–1160. [Google Scholar] [CrossRef]
  15. Trier, S.B.; Davis, C.A. Influence of balanced motions on heavy precipitation within a long-lived convectively generated vortex. Mon. Weather Rev. 2002, 130, 877–899. [Google Scholar] [CrossRef]
  16. Raymond, D.J.; Jiang, H. A theory for long-lived mesoscale convective systems. J. Atmos. Sci. 1990, 47, 3067–3077. [Google Scholar] [CrossRef] [Green Version]
  17. Trier, S.B.; Davis, C.A. Mesoscale convective vortices observed during BAMEX. Part II: Influences on secondary deep convection. Mon. Weather Rev. 2007, 135, 2051–2075. [Google Scholar] [CrossRef] [Green Version]
  18. Lai, H.W.; Davis, C.A.; Jou, B.J.D. A subtropical Oceanic mesoscale convective vortex observed during SoWMEX/TiMREX. Mon. Weather Rev. 2011, 139, 2367–2385. [Google Scholar] [CrossRef] [Green Version]
  19. Rogers, R.F.; Reasor, P.D.; Zawislak, J.A.; Nguyen, L.T. Precipitation Processes and Vortex Alignment during the Intensification of a Weak Tropical Cyclone in Moderate Vertical Shear. Mon. Weather Rev. 2020, 148, 1899–1929. [Google Scholar] [CrossRef] [Green Version]
  20. Chen, S.S.; Frank, W.M. A numerical study of the genesis of extratropical convective mesovortices. Part I: Evolution and Dynamics. J. Atmos. Sci. 1993, 50, 2401–2406. [Google Scholar] [CrossRef] [Green Version]
  21. Sun, J.H.; Zhao, S.X.; Xu, G.K.; Meng, Q.T. Study on a mesoscale convective vortex causing heavy rainfall during the Mei-yu season in 2003. Adv. Atmos. Sci. 2010, 27, 1193–1209. [Google Scholar] [CrossRef]
  22. Yu, F.; Fu, S.M.; Zhao, S.X.; Sun, J.H. Study on the dynamic chararistics of an eastward-offshore mesoscale vortex along the Meiyu-Baiu front. Atmos. Ocean. Sci. Lett. 2012, 5, 360–366. [Google Scholar] [CrossRef] [Green Version]
  23. Xu, W.H.; Ni, Y.Q.; Wang, X.K.; Qiu, X.X.; Bao, X.H.; Jin, W.Y. A study of structure and mechanism of a meso-beta-scale convective vortex and associated heavy rainfall in the Dabie Mountain area Part I: Diagnostic analysis of the structure. Adv. Atmos. Sci. 2011, 28, 1159–1176. [Google Scholar] [CrossRef]
  24. Trier, S.B.; Davis, C.A.; Tuttle, J.D. Long-lived meso-convective vortices and their environment. Part I: Observations from the central United States during the 1998 warm season. Mon. Weather Rev. 2000, 128, 3376–3395. [Google Scholar] [CrossRef]
  25. Fu, S.M.; Tang, H.; Li, Y.; Ma, H.; Sun, J.H. On the Relationship of a Low-Level Jet and the Formation of a Heavy-Rainfall-Producing Mesoscale Vortex over the Yangtze River Basin. Atmosphere 2021, 12, 156. [Google Scholar] [CrossRef]
  26. Gao, L.X.; Wang, Y.; Wang, M.B.; Liu, C. A study on radar echo and the impact of terrain on the heavy torrential rainfall event in Shandong Province on 17 August 2009. Trans. Atmos. Sci. 2011, 34, 239–245. (In Chinese) [Google Scholar] [CrossRef]
  27. Hong, S.Y.; Juang, H.M.; Zhao, Q. Implementation of prognostic cloud scheme for a regional spectral model. Mon. Weather Rev. 1998, 126, 2621–2639. [Google Scholar] [CrossRef]
  28. Hong, S.Y.; Pan, H.L. Nonlocal boundary layer vertical diffusion in a medium-range forecast model. Mon. Weather Rev. 1996, 124, 2322–2339. [Google Scholar] [CrossRef] [Green Version]
  29. Kain, J.S.; Fritsch, J.M. A one-dimensional entraining/detraining plume model and its application in convective parameterization. J. Atmos. Sci. 1990, 47, 2784–2802. [Google Scholar] [CrossRef] [Green Version]
  30. Pielke, R.A. Mesoscale Meteorological Modeling, 2nd ed.; Academic Press: San Diego, CA, USA, 2002; p. 676. [Google Scholar]
  31. Paulson, C.A. The mathematical representation of wind speed and temperature profiles in the unstable atmospheric surface layer. J. Appl. Meteorol. Climatol. 1970, 9, 857–861. [Google Scholar] [CrossRef]
  32. Dyer, A.J.; Hicks, B.B. Flux-gradient relationships in the constant flux layer. Q. J. R. Meteorol. Soc. 1970, 96, 715–721. [Google Scholar] [CrossRef]
  33. Webb, E.K. Profile relationships: The log-linear range, and extension to strong stability. Q. J. R. Meteorol. Soc. 1970, 96, 67–90. [Google Scholar] [CrossRef]
  34. Mlawer, E.J.; Taubman, S.J.; Brown, P.D.; Iacono, M.J.; Clough, S.A. Radiative transfer for inhomogeneous atmosphere: RRTM, a validated correlated-k model for the long-wave. J. Geophys. Res. 1997, 102, 16663–16682. [Google Scholar] [CrossRef] [Green Version]
  35. Dudhia, J. Numerical study of convection observed during the winter monsoon experiment using a mesoscale two-dimensional model. J. Atmos. Sci. 1989, 46, 3077–3107. [Google Scholar] [CrossRef]
  36. Wicker, L.J.; Skamarock, W.C. Time splitting methods for elastic models using forward time schemes. Mon. Weather Rev. 2002, 130, 2088–2097. [Google Scholar] [CrossRef]
  37. Hertenstein, R.F.A.; Schubert, W.H. Potential vorticity anomalies associated with squall lines. Mon. Weather Rev. 1991, 119, 1663–1672. [Google Scholar] [CrossRef] [Green Version]
  38. Zhang, D.L.; Fritsch, J.M. A numerical investigation of a convectively generated, inertially stable, extratropical warm-core mesovortex over land. Part I: Structure and evolution. Mon. Weather Rev. 1988, 116, 2660–2687. [Google Scholar] [CrossRef] [Green Version]
  39. Menard, R.D.; Fritsch, J.M. A mesoscale convective complex-generated inertially stable warm core vortex. Mon. Weather Rev. 1989, 117, 1237–1260. [Google Scholar] [CrossRef] [Green Version]
  40. Bartels, D.L.; Brown, J.M.; Tollerud, E.I. Structure of a midtropospheric vortex induced by a mesoscale convective system. Mon. Weather Rev. 1997, 125, 193–211. [Google Scholar] [CrossRef]
  41. Houze, R.A. Mesoscale convective systems. Rev. Geophys. 2004, 42, 125–133. [Google Scholar] [CrossRef] [Green Version]
  42. Verlinde, J.; Cotton, W.R. A mesoscale vortex couplet observed in the trailing anvil of a multicellular convective complex. Mon. Weather Rev. 1990, 118, 993–1010. [Google Scholar] [CrossRef] [Green Version]
  43. Frank, W.M. The cumulus parameterization problem. Mon. Weather Rev. 1983, 111, 1859–1871. [Google Scholar] [CrossRef]
  44. Cotton, W.R.; Anthes, R.A. Storm and Cloud Dynamics; Academic Press: San Diego, CA, USA, 1989; p. 883. [Google Scholar]
  45. Skamarock, W.C.; Klemp, J.B.; Dudhia, J.; Gill, D.O.; Barker, D.M.; Wang, W.; Powers, J.G. A Description of the Advanced Research WRF Version 2; NCAR Tech Note NCAR/TN-468 + STR; University Corporation for Atmospheric Research: Boulder, CO, USA, 2005; p. 88. [Google Scholar]
  46. Yang, D.S.; Liu, Y.B.; Liu, S.S. Meteorological Dynamics; China Meteorological Press: Beijing, China, 1980; pp. 34–37. (In Chinese) [Google Scholar]
  47. Wang, W.; Pan, Y.N.; Shu, Y. The characteristics of mesoscale convective system and mesoscale convective vortex in summers over eastern China. J. Nanjing Univ. Nat. Sci. 2011, 47, 692–702. (In Chinese) [Google Scholar]
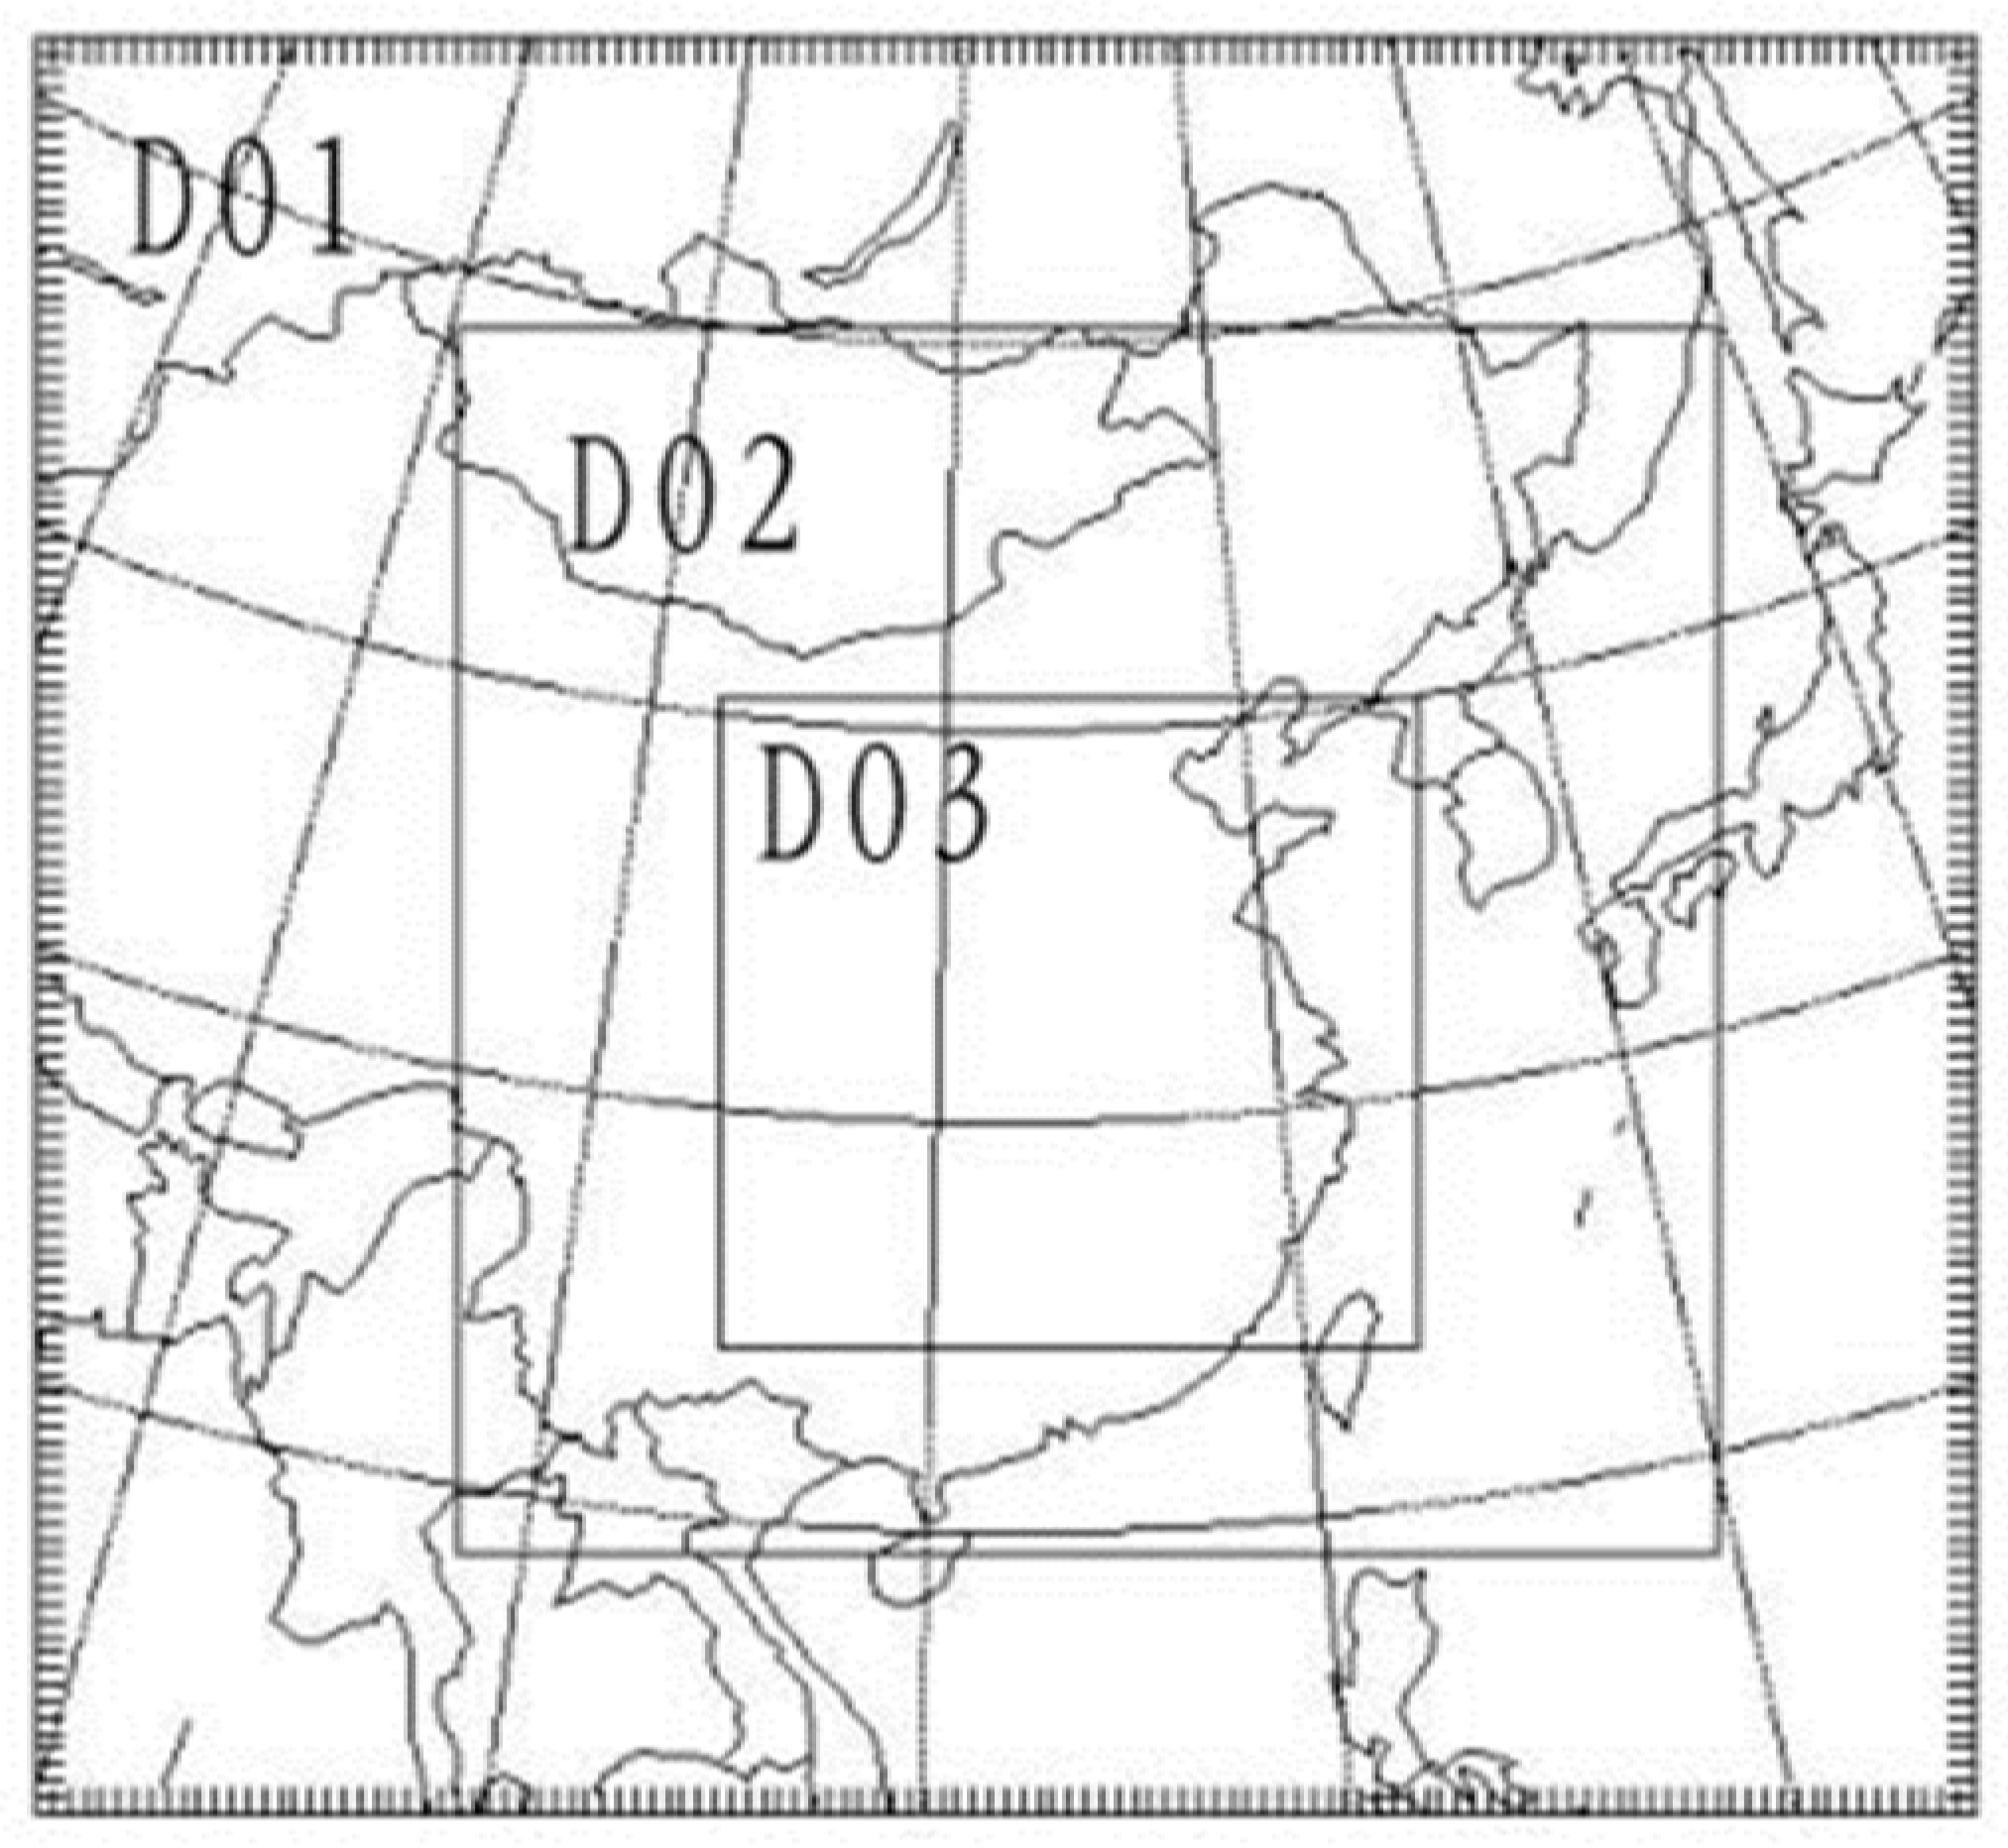
Figure 1. Domain configuration.
Atmosphere 13 00556 g001
Figure 2. Accumulated precipitation observed from 00:00 UTC on 17 August to 00:00 UTC on 18 August (shaded; unit: mm, with scale at bottom).
Atmosphere 13 00556 g002
Figure 3. Synoptic background at 00:00 UTC on 16 August 2009.
Atmosphere 13 00556 g003
Figure 4. Tracks of the MCV center from 18:00 UTC on 16 August to 12:00 UTC on 18 August 2009. The MCV is identified with the RSM_GANAL reanalysis data.
Atmosphere 13 00556 g004
Figure 5. Multifunctional Transport Satellite-1R infrared satellite images at (a) 17:00 UTC on 16 August 2009 and (c) 06:00 UTC on 17 August 2009, and the simulated 300 hPa ice-mixing ratio at (b) t = 5 h and (d) t = 18 h. The red dot in Figure 5a indicates the location of the MCV initiation. Figure 5a,b correspond to the time of MCV initiation, while (c,d) correspond to the last time of model integration.
Atmosphere 13 00556 g005
Figure 6. The 850 hPa flow field analyzed by the RSM-GANAL reanalysis data at (a) 18:00 UTC on 16 August and (c) 06:00 UTC on 17 August 2009, and that analyzed by the model output at (b) t = 5 h and (d) t = 18 h. Note that the time of Figure 6a is one hour later than (b), due to the 6 h interval of the reanalysis data.
Atmosphere 13 00556 g006
Figure 7. Distribution of the simulated wind (vector, m s−1), ζten (contour) and reflectivity factor (shaded) at t = 5 h. The solid lines indicate ζten > 0, and the dotted lines denote ζten < 0 (unit: 10−8s−2). The shading indicates the region with a reflectivity factor larger than 35 dBZ, with a scale at the bottom. Figure (b) corresponds to the region d in Figure (a).
Atmosphere 13 00556 g007
Figure 8. Vertical profiles of the mean values of the vorticity equation terms from the simulation output of domain 3 at t = 5 h over (a) the area d in Figure 7a and (b) the area e in Figure 7b.
Atmosphere 13 00556 g008
Figure 9. Vertical profiles of the mean values of relative vorticity, divergence, and vertical velocity over the positive-vorticity-change area (area e) at the MCV initiation (t = 5 h).
Atmosphere 13 00556 g009
Figure 10. Distributions of the tilting term (ζtilt), upward motion, and horizontal wind in the vortex region (area d) at 850 hPa at the MCV initiation time (t = 5 h).
Atmosphere 13 00556 g010
Figure 11. Vertical profiles of u wind and v wind averaged in the vortex region (area d) at 850 hPa at the MCV initiation time (t = 5 h).The solid lines represent ζtilt > 0 and the dotted lines represent ζtilt < 0 (unit: 10−8s−2). The shading indicates the upward motion (unit: m·s−1). The vectors denote the horizontal wind with scale at bottom (unit: m·s1).
Atmosphere 13 00556 g011
Table 1. Model setup.
Domain 1Domain 2Domain 3
Grid spacing45 km15 km5 km
Grid points121 × 111235 × 229391 × 361
Cumulus parameterizationKain–Fritsch schemenone
Integration time12:00 UTC on 16 August to 06:00 UTC on 17 August 2009
Cloud microphysicsWRF Single Moment 5-class scheme
Boundary layerYonsei University (YSU) scheme
Parameterization of near-surface layerMonin–Obukhov scheme
Parameterization of long-wave radiationThe Rapid Radiative Transfer Model (RRTM) scheme
Parameterization of short-wave radiationDudhia scheme
Land surfaceThermal diffusion scheme
Time integrationThird-order Runge–Kutta scheme
Publisher’s Note: MDPI stays neutral with regard to jurisdictional claims in published maps and institutional affiliations.