Abstract
This study investigated the dynamic influence of the Chesapeake Bay (CB) on local ozone (O3) concentration and distribution using a weather forecasting model. The Weather Research and Forecasting model coupled with Chemistry (WRF–Chem) was employed to simulate O3 production and transportation near the CB. Baseline (water) as well as sensitivity (nowater) model experiments of bay circulation were carried out with and without bay water by changing the water surface from water to land (loam). First, the model performance simulating O3 was evaluated using the baseline experiment results and AirNow surface wind and O3 observations. The results showed that the model overestimates surface O3 by up to 20–30%. Further, the comparisons of the baseline and sensitivity experiments revealed higher O3 mixing ratios, primarily due to the resulting bay breeze circulation. These increases, after considering model overestimation, represent a mean bay dynamics circulation-induced contribution of up to 10% at night and 5% during the day. Furthermore, the boundary layer over northern CB, where it is at its narrowest width, was higher (by 1.2 km on average) during daytime due to higher surface temperatures observed. The boundary layer depth difference between the northern, central, and southern regions of the bay leads to a differential in the role of bay circulation dynamics in the observed O3 increase. The relatively wider swath of water surface over southern CB resulted in a lower boundary layer depth and stronger breeze circulation and this circulation contributed to O3 concentrations. Moreover, since the case selected has a minimal bay breeze circulation, the associated surface ozone enhancements represent what is expected at least at a minimum.
1. Introduction
Tropospheric (ground-level or surface) ozone (O3) has significant environmental and human health impacts. Long-term exposure to high O3 concentration air leads to serious health issues, such as irritated lungs, aggravated bronchitis, emphysema, and asthma [1,2,3]. O3 also has significant impacts on crop yields, forest growth, and species composition [4]. Recent studies have focused on quantifying the impact of current O3 concentration on net ecosystem production as compared to the conditions of the pre-industrial era. [5,6]. To mitigate surface pollution in the U.S., the Clean Air Act requires the Environmental Protection Agency (EPA) to set National Ambient Air Quality Standards (NAAQS) [7]. The current NAAQS, in effect since 2015, sets an ambient 8 h O3 mixing ratio criterion of 70 parts per billion by volume (ppbv) [8,9]. In particular, the O3 mixing ratio over some coastal regions exceeds the NAAQS more frequently compared to other inland regions. Examples of such regions include the Chesapeake Bay (hereafter referred to as CB) [10,11], Galveston Bay [12], the Great Lakes [13,14,15,16], and the Great Salt Lake [17]. All these locations are in close proximity to water bodies surrounded by land, and related research is ongoing to investigate the causes of the exceedance of O3 concentration [11,18,19]. As a secondary pollutant, ground-level O3 depends on its precursors, chemical reactions, and meteorological conditions [20,21,22]. Understanding them helps to track O3 pollution sources and sinks and is critical for improving the accuracy of O3 pollution forecasting.
Field campaigns provide insights into physical and chemical processes in the atmosphere under a diverse set of meteorological conditions over the aforementioned locations. A number of campaigns have been conducted to investigate bay/lake effects on local meteorology and air quality, e.g., Deriving Information on Surface Conditions from Column and Vertically Resolved Observations Relevant to Air Quality from 27 June to 31 July 2011 (DISCOVER-AQ) [23,24], the Border Air Quality and Meteorology Study from 20 June to 10 July 2007 (BAQS-Met) [16], the Ozone Water–Land Environmental Transition Study from 5 July to 3 August 2017 (OWLETS) and from 6 June to 6 July 2018 (OWLETS2) [11,18], and the Lake Michigan Ozone Study (LMOS) [13,14,19,25]. Findings on the impacts of CB on O3 from both dynamical and chemistry perspectives have been generated and a link to the bay/lake water body has also been suggested by these field campaign studies [10,13,14,17,19,23,24,25].
One of the most important contributions made by the previous studies concerns the role of dynamics originating from the local bay/lake and coastal circulations. The bay/lake dynamical effects contributing to the local meteorology and air quality are: (1) the developing land/bay breeze and resulting diurnal dynamics that alter the near-shore meteorology through small-scale circulations, e.g., the bay breeze yields high pressure over CB and low pressure inland near CB [26]; (2) associated changes in cloud formation, which, in turn, modify the radiation environment, thereby causing shielding for O3 photolysis [10], e.g., the presence of clear skies over CB and later development of cumulus clouds due to higher surface temperatures and elevated boundary layers [26]; (3) changes in the vertical mixing of gases, associated with changes in plume updraft velocity over land compared to water, which impact O3 concentration, e.g., the development of a bay breeze during the late morning and early afternoon along the western shore of CB was found to lead to a convergence of pollutants [10]; and (4) modification of the inversion layer (strong inversion over land at night as opposed to over the bay/lake) and its impact on the dilution and venting of gases.
Most of these previous studies utilized observations from field campaigns to analyze the effects of the bay/lake and evaluate model performance by comparing model results with observations [10,25,26]. To our knowledge, not many studies have taken advantage of recent modeling improvements, especially the online coupling of meteorology and chemistry, to specifically address the dynamical role of CB on O3 concentrations.
Even though some previous reports have discussed the numerous possible dynamic and chemical processes that alter near-shore pollution, they have focused on model resolution sensitivity and model performance evaluation [10,11,18,25,26,27,28,29]. Chief among the dynamical processes are the development of breeze (bay and land) and the differential sensible heating resulting in the land–bay horizontal temperature gradients. The modelling of sea breezes depends on the land surface sensible heat flux, ambient geostrophic wind, atmospheric stability and moisture, water body dimensions, terrain height and slope, Coriolis parameter, surface roughness length, and shoreline curvature [30]. To capture these features in a model simulation, spatial resolution is a key factor to determine model performance when simulating different scales. Studies have demonstrated that finer horizontal spatial resolution (0.5 km [10]; 1.33 km [27]) model runs agreed better with pollutant observations at the top of the boundary layer and resolved the structure of the bay breeze better as compared to coarser model resolutions (13.5 km, [10]; 12 km, [27]). Similar results were also reported by Jiménez et al. (2006), who concluded that O3 simulation during sea breezes is better with a fine resolution model than with a coarse resolution model [31].
This study further investigates the influence of CB on the O3 mixing ratio distribution by employing a mesoscale model, the Weather Research and Forecasting model coupled with Chemistry (WRF–Chem) [32]. It aims to quantify the relative influence of the bay–land dynamics on the O3 concentration near bay areas. One baseline experiment (“water”) and one sensitivity experiment (“nowater”) were performed with the normal configuration and by altering the model configuration of the underlying water over CB to land (loam), respectively. First, the baseline model simulation performance was evaluated by the surface O3 mixing ratio observations to make sure that model simulations were reliable. Then, both horizontal and vertical O3 distribution differences between “water” and “nowater” over CB were analyzed to study the resulting dynamics and their influence on the temporal spatial O3 concentration distribution.
This paper is organized as follows: descriptions of the model configuration, study domain, background, case study, and datasets are given in Section 2, followed by a model performance evaluation in Section 3. The results and analysis are presented in Section 4, and concluding remarks are made in Section 5.
2. Model Setup and Case Study
2.1. Model Configuration
WRF–Chem (version 3.7) integrates the air quality component consistent with the meteorological components [32]. The gas-phase chemistry and aerosol module were based on the Carbon Bond Mechanism Version Z (CBM-Z) [33] and the Model for Simulating Aerosol Interactions and Chemistry (MOSAIC) [34], respectively. The Yonsei University (YSU) planetary boundary layer scheme [35,36] was used here based on the model performance evaluation and recommendation for such an area [37]. Radiation treatment utilized the Rapid Radiative Transfer Model for General Circulation Model (RRTMG) short-wave and long-wave radiation schemes [38]. The radiation scheme was in line with what was recommended for the model simulations over the continental U.S. by the WRF developer team [39].
Figure 1 shows the model domain, with the outer study area set to include the eastern U.S. The outer domain was further resolved by one two-way nested grid region that progressively focused and centered on the study region, CB. The outer domain (d01) was set at 9 km × 9 km horizontal spatial resolution, while the nested inner domain (d02) had a higher horizontal spatial resolution (3 km × 3 km) because it exclusively focused on the detailed investigation of O3 concentration and its evolution. Thirty-five vertical levels were used with about 15 levels set below 800 hPa to resolve the PBL, and the model top was at 100 hPa.
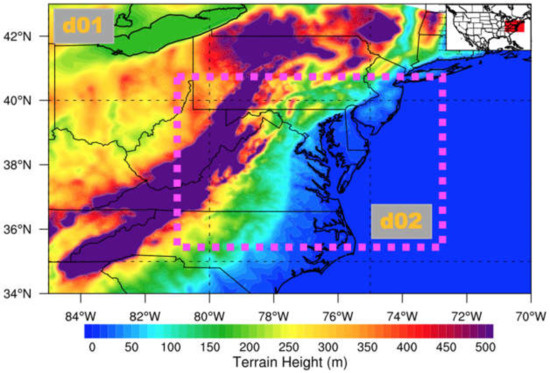
Figure 1.
Terrain height of the area surrounding CB over the eastern U.S. The outer domain is denoted as d01 and the nest domain is enclosed within the pink dashed rectangle (d02). The insert map in the top-right corner shows the location of the study region (red shading) over the continental U.S. [40].
2.2. Topography of the CB Surrounding Region
CB is located on the western coast of the Atlantic Ocean and surrounded by the states of Maryland, Virginia, and Delaware. It is approximately 320 km long from north to south, 4.5 km wide at its narrowest point from west to east, and 48 km at its widest point. The average depth is 6.4 m, with a maximum of 53 m [41]. The terrain towards the east of CB is flat, and its terrain height is less than 50 m. Mountains are located 100 km west of CB, with the terrain height more than 1000 m (Figure 1). CB alters moisture, wind speed and direction, and atmospheric stability. Due to the evaporation of the water body over CB, the air moisture level near it is higher than in the surrounding area. It has a relatively high temperature at night, which makes the atmosphere unstable, while, in the day, it has a relatively low temperature, which stabilizes the atmosphere.
2.3. Case Study
There are several points that need to be considered that may have an impact on the choice of the selection of 3 June 2015. First, O3 is mostly a summertime problem, and early June is the beginning of summer and a heightened pollution period in this region. Stauffer and Thompson (2015) used O3 climatology data for Baltimore, MD, and Hampton, VA, from May–September, 1981–2010, and distinguished three day types: no bay breeze, rainy/cloudy, and bay breeze [42]. The O3 concentration ranges were 40–100 ppbv (median at 60 ppbv) on no bay breeze days, 20–80 ppbv (median at 50 ppbv) on rainy/cloudy days, and 40–100 ppbv (median at 70 ppbv) on bay breeze days. The O3 diurnal variation varies from 15 ppbv at night to 70 ppbv in the day. The 8 h O3 mean on bay breeze days is 3–5 ppbv higher than on no bay breeze days. Second, this provides for a relatively uncomplicated pollution day, a time just after an exit southward of a cold front (Figure 2a), providing a relatively less polluted day and the start of a bay–land interaction in the PBL development. Although this case will be slightly different from a muggy and stagnant case, it will serve as an important case for including all the physical processes that may be at work in the bay–land interaction. However, there was a low-pressure system near North Carolina which formed clouds and precipitation over the study region (Figure 2b and Figure 3). The cloud fraction was 100% from the MODIS cloud product (Figure 3c,d). The 24 h precipitation map shows that the rainfall was around 0.1–0.5 in (or 0.25–1.25 cm, Figure 2b). This means that less solar radiation was expected over CB, which would reduce the photochemical reactions of O3 and its precursors. So, the chemistry influence on O3 generated was limited due to the absence of sunlight. Third, the prevailing winds on this day were northeasterly rather than the typical northwesterly. This would avoid the influence of pollutants transported from the Ohio River Valley. In addition, the synoptic scale and rainy/cloudy conditions on this day constituted minimal impacts of CB on meteorology and O3 formation. This case will capture the physical processes involved and their impacts on controlling the mesoscale distribution of pollutants in this region and serve as a guide to future studies. An effort is under way to repeat this work for several cases and synoptic wind types in the future.
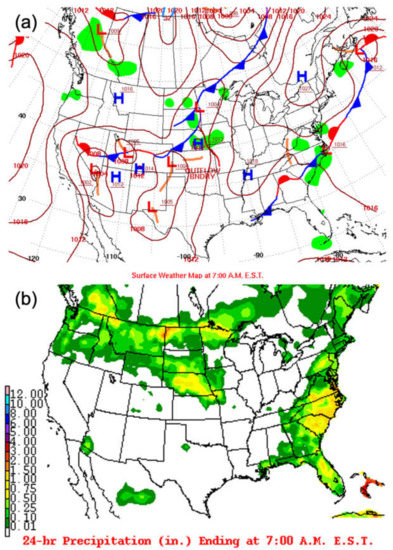
Figure 2.
(a) Surface weather map at 7:00 AM EST (11:00 UTC) on 3 June 2015, with low-pressure systems and high-pressure systems indicated by L (red) and H (blue), respectively. (b) Map showing 24 h precipitation at 7:00 AM EST on 4 June 2015 (http://www.wpc.ncep.noaa.gov/dailywxmap/, accessed on 10 September 2020).
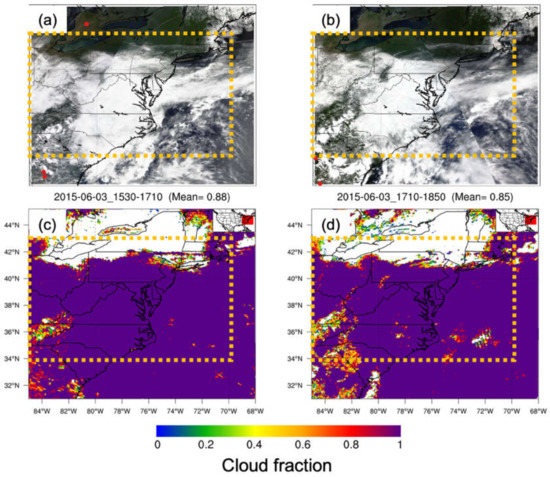
Figure 3.
MODIS three-band color overlay images (band 1—red, band 4—green, and band 3—blue) from Terra (a) and Aqua (b) satellites on 3 June 2015. Red dots indicate the locations of daytime fires detected by MODIS. Note that the fire dot scale has been enlarged to portray the fires more clearly in the figure. Bottom images show MODIS cloud fractions from Terra (c) and Aqua (d). The orange dashed rectangle is the outer domain (d01).
2.4. Datasets
Relevant information on the data used in the simulation and sensitivity studies as well as model evaluation is presented in Table 1.

Table 1.
Data used as inputs to WRF–Chem simulations.
Both land use and water land mask datasets are used in this study. The land use (soil type) dataset from the United States Geological Survey (USGS) has 16 soil categories (Figure 4). Since the spatial resolution of the land mask dataset is 30 arcsec, it cannot resolve the fine streams and branches feeding into CB. As a result, the shape of the water mask does not exactly follow the CB outline, which may lead to uncertainties about the size of CB. In the sensitivity experiment, the land mask was altered from water to land over CB (Figure 4a,b). The land use index was modified to loam, since the land over the eastern shore of CB is loam (Figure 4c,d). The CB surface temperature was from NARR reanalysis data. The sea surface temperature (SST) data are from large-scale forcing data, which are from the NARR dataset. The EPA AirNow program provides forecasts and near real-time observed air quality information across the U.S., Canada, and Mexico (http://www.epa.gov/AirNow, accessed on 20 September 2020). It receives air quality observations from over 1000 monitoring stations and collects forecasts for more than 300 cities. For this study, wind and O3 mixing ratios measured near the surface were used as evaluation datasets to estimate model simulation performance. In the following comparison, we only considered the O3 mixing ratio difference between baseline and sensitivity experiments, except for the model performance evaluation, where the O3 mixing ratio was used.
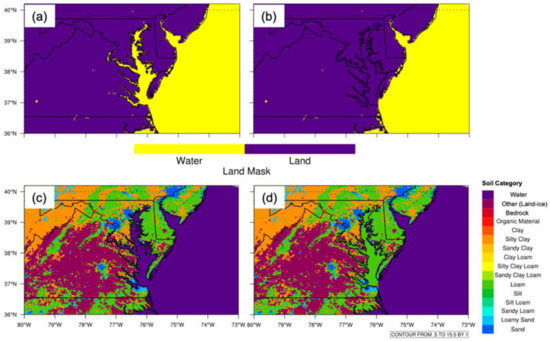
Figure 4.
(a) WRF USGS land mask. (b) Same as (a), but modified water to land over CB. (c) WRF USGS 16 soil categories. (d) Same as (c), but modified water to loam over CB.
3. Model Simulation Evaluation
To stabilize the meteorological and chemical fields, the baseline experiment was conducted from 1200 UTC, 1 June, to 0000 UTC, 4 June 2015. The first 36 h simulations were treated as spin-up and the remaining 24 h simulations (from 0000 UTC, 3 June, to 0000 UTC, 4 June) were selected for analysis. The sensitivity experiment was the same as the baseline experiment, except for the surface land type over CB. The surface land type was changed from water to land (loam) on 0000 UTC, 2 June 2015. The sensitivity experiment continued to run until 0000 UTC, 4 June 2015. In the following comparison between the baseline and sensitivity experiments, we selected the simulations from 0000 UTC, 3 June, to 0000 UTC, 4 June 2015.
The wind patterns influenced the instantaneous surface O3 mixing ratio horizontal spatial distribution. Both model-simulated winds and AirNow observed winds show that the prevailing winds were northeasterly in the northeastern domain, easterly over mountains, northerly over Virginia state, and southerly over the Atlantic Ocean in the southeastern domain (Figure 5). For example, the high O3 mixing ratio (around 35 ppbv) over the east of the Appalachian Mountains was primarily due to the accumulated O3 transported by the northeast winds from the polluted region nearby. When O3 reached the eastern side of the mountains, it was blocked, accumulated, and lofted, leading to an apparent increase in O3 concentration (Figure 5). On the other hand, the uniform northeasterly wind (5–15 m s−1) over the relatively flat coastal terrain of Delaware–Maryland–Virginia favored a uniform surface O3 mixing ratio spatial distribution. At the northern CB, the model-simulated O3 mixing ratio agreed with the AirNow O3 observation well. The relatively high O3 concentration (>25 ppbv) existed over the south of CB. The high wind speed transported O3 from CB, and local stagnant wind and weak convergence also contributed to the high O3 concentration. Even though the influence of prevailing winds on the O3 concentration distribution was important, the sensitivity experiment was able to capture the O3 concentration differences due to the dynamics of CB. This is different from the study conducted by Stauffer et al. (2015), in which conclusions were based on the condition that the mesoscale or synoptic-scale wind must be absent [41]. The model-simulated surface winds and AirNow surface winds agree in both speed and directions over the study domain. In comparison to the AirNow surface O3 concentration, the model results overestimated the surface O3 mixing ratio over the middle and west of the study region, while they underestimated O3 in the Delaware and New Jersey regions due to the clean air from the Atlantic Ocean. Overall, the model simulation showed O3 mixing ratio surface spatial distribution patterns that agreed well with observations (Figure 5).
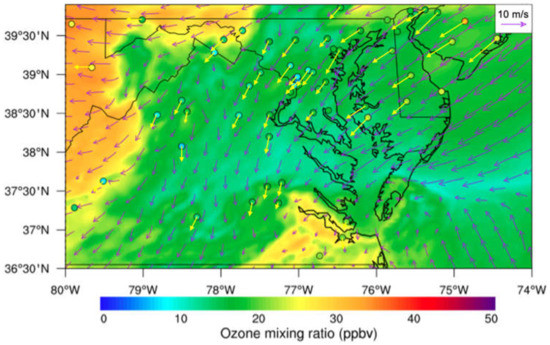
Figure 5.
WRF–Chem-simulated surface O3 mixing ratios and EPA AirNow observed surface O3 mixing ratios (color-filled circles) at 1500 UTC on 3 June 2015. The purple streamlines are the simulated surface winds, while the yellow ones are EPA AirNow observed surface winds. Wind magnitude is indicated by the length of the streamline shown in the top-right insert; units, m s−1.
We investigated the hourly surface O3 mixing ratio diurnal evolution for the model and observations to evaluate the model performance on capturing the O3 diurnal variation. To compare the model simulation with the observations, the simulated O3 mixing ratios in nine 3 km × 3 km grids surrounding the AirNow station were aggregated to one 9 km × 9 km grid region and their means and standard deviations were calculated. Figure 6 shows hourly surface O3 mixing ratio diurnal variations from three AirNow stations (Millington, Fair Hill, and Aldino) close to the north of CB, two AirNow stations (Horn Point and Hampton) near the south of CB, and one AirNow station (Albemarie_HS) to the west of CB. As expected, the hourly surface O3 mixing ratio diurnal variation showed a lower O3 mixing ratio at night (around 10 ppbv at 0600 UTC; sunrise was at 1030 UTC), and a higher O3 mixing ratio in the daytime (around 30 ppbv at 2000 UTC; sunset was at 0000 UTC). During the night, the absence of sunlight and fewer O3 precursor (NOX, etc.) emissions prevented the required O3-forming chemical reactions from being initiated. The correlation coefficients (Rs) and root mean square errors (RMSEs) were 0.77, 0.95, 0.93 and 6.38, 7.99, 9.31, 0.82, 0.65, and 0.91 for Milington, Fair Hill, Aldino, Horn Point, Hampton, and Albemarie_HS, respectively. In general, the WRF–Chem model captured the AirNow-measured O3 mixing ratio diurnal variation trend pattern but overestimated the O3 concentration by 5–10 ppbv, or 20–30%.
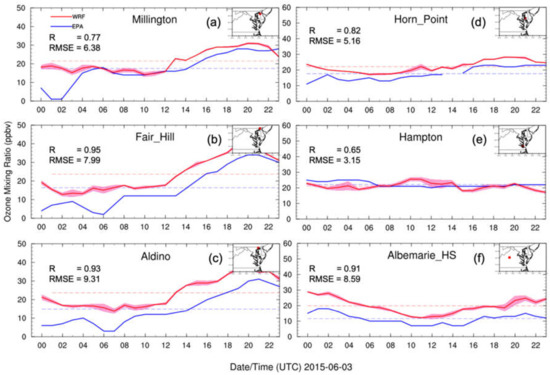
Figure 6.
Hourly surface O3 mixing ratio diurnal variations from EPA AirNow observations (blue curves) and WRF–Chem simulations (red curves) at three AirNow sites. The light-red shaded areas are standard deviations. Surface O3 mixing ratio daily averages are denoted as dashed lines for AirNow (blue) and WRF–Chem (red). R is the Pearson correlation coefficient and RMSE is the root mean square error. The inset on the upper right shows the locations of EPA AirNow sites.
4. Model Simulation Results
4.1. Overview of the O3 Mixing Ratio Difference
The observational and modeled O3 mixing ratio diurnal variation revealed the transition between the minimum and maximum of O3 mixing ratios (Figure 6). By separating the nighttime modeled O3 mixing ratio difference from that of the daytime, the absolute and relative influences of CB can be analyzed explicitly. Daytime is defined as 1000–0000 UTC (or 0600–2000 local time), and nighttime is defined as 0000–0900 UTC (or 00:00–06:00 and 20:00–00:00 local time). The relative difference is calculated using the following equation.
On 3 June, at night, the model-simulated O3 with water over CB was 28 ppbv, while, without water, the model-simulated O3 mixing ratio was 18 ppbv (Figure 7a,b). In the day, the model-simulated O3 with water over CB was 32 ppbv, while, without water, the model-simulated O3 mixing ratio was 25 ppbv (Figure 7c,d). The averaged surface O3 mixing ratio over CB increased by 10 ppbv (30%) at night (Figure 7c,d) and 5 ppbv (20%) during the day (Figure 7g,h). The shallow stable nocturnal boundary layer “trapped” O3 and prevented it from venting to higher altitudes at night, while the deep mixed layer lofted O3 to the free troposphere during the daytime. In the daytime, the O3 mixing ratio difference was distributed semi-homogeneously over CB, with more O3 over southern CB than northern CB (Figure 7g,h). The higher O3 increase over southern CB was due to the larger area of the water body in southern CB. The O3 mixing ratio difference increased slightly from east to west across CB, consistent with the direction of the prevailing winds. The wind difference over CB indicated wind increase due to less surface friction over the water surface than over land and contributions from bay breezes. In addition, the westward pooling of pollution created elevated O3 that extended into the Baltimore–Washington D.C. urban corridor [26]. At night, the O3 mixing ratio difference gradient gradually decreased and approached the minimum close to the eastern shore (Figure 7c,d). In the daytime, the O3 mixing ratio difference gradient had a pattern analogous to nighttime but had a smaller magnitude (Figure 7g,h).
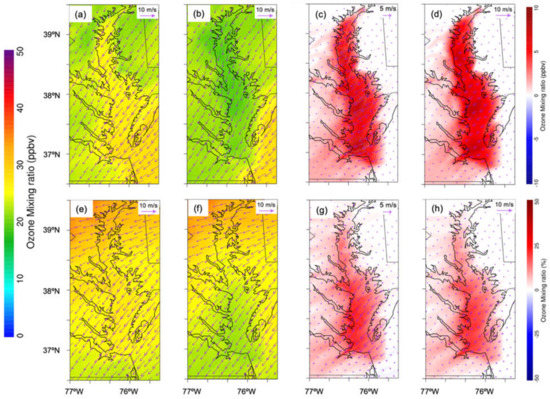
Figure 7.
WRF–Chem modeled O3 mixing ratio and absolute and relative O3 mixing ratio difference between water and nowater (water minus nowater) for both nighttime (a,c) and daytime (b,d). (a) O3 mixing ratio with water at night. (b) O3 mixing ratio with nowater at night. (c) Absolute O3 mixing ratio difference at night. (d) Relative O3 mixing ratio difference at night. (e) O3 mixing ratio with water in the daytime. (f) O3 mixing ratio with nowater in the daytime. (g) Relative O3 mixing ratio difference in the daytime. (h) Same as (c) but in the daytime. The wind vector arrow is shown in the top-right corner; wind units, m s−1. Daytime is defined as 1000–0000 UTC (or 06:00–20:00 local time); nighttime is defined as 0000–0900 UTC (or 00:00–06:00 and 20:00–00:00 local time).
The surface O3 mixing ratio diurnal variations in both the baseline and sensitivity experiments and their differences above CB are shown in Figure 8. These show that the surface O3 mixing ratio above CB from the baseline and sensitivity experiments had a similar diurnal variation trend. The surface O3 mixing ratio at night (about 20–25 ppbv) was lower than in the daytime (about 25–30 ppbv). The larger surface O3 mixing ratio difference mean over CB occurred at night (about 5 ppbv or 25%) rather than in the daytime (about 2 ppbv or 15%) due to the longer residence time of O3 over CB at night. The wind speed over CB at night is lower than in the daytime, recorded as 8 m s−1 and 12 m s−1, respectively. At night, the residence of this higher O3 air over CB tended to be longer. In addition, O3 accumulated at the southern end of CB (and the western shore of CB) where it was more impacted, and differences would add to the chance of exceedance of O3 mixing ratio limits. In fact, Goldberg et al. (2014) indicated that over a 10-day period, ozone was exceeded four times over the water as observed on a moving ship compared to two times over land during the DISCOVER-AQ-2011 project (June–31 July 2011, [26]), while the surrounding land exceeded the NAAQS four (4) times, reinforcing the O3 increase effect due to CB, especially in the downwind region.
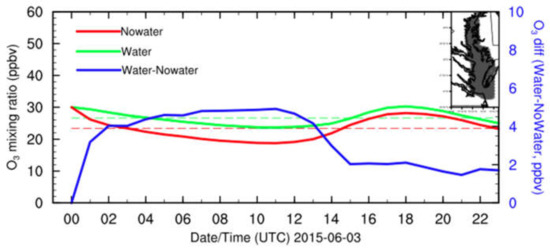
Figure 8.
WRF–Chem-simulated surface O3 mixing ratios for water (green) and nowater (red), and surface O3 mixing ratio difference (water minus nowater, blue) diurnal variations above CB on 3 June 2015. The dashed lines are surface O3 mixing ratio means for water (green) and nowater (red). The grey shade in the top-right corner of the map indicates the location of CB.
4.2. Dynamical Influence on O3 Mixing Ratios
4.2.1. Horizontal Dynamical Influence
We analyzed the dynamic mechanism that increased the simulated O3 mixing ratio solely due to the change of the land surface type. First, the thermal properties of water and land (loam) are different. The volumetric heat capacity of land (loam) is around 2.0 × 10⁶ J m−3 K−1, much smaller than water, 4.18 × 10⁶ J m−3 K−1. This implies that the loam temperature increases/decreases about twice as much as water by absorbing/emitting the same amount of heat during the day/night. This fundamental physical property controls the model lower boundary surface temperature difference in our experiments. Due to the presence of a water body over CB, the temperature difference increased by 2.0–3.0 K at night, while the temperature difference decreased by 1.0 K in the day at the northern end of CB (Figure 9a,b). The nighttime temperature difference increase over CB was distributed homogeneously across northern and southern CB. However, the daytime temperature change showed a regional variation, the temperature over northern CB decreasing by about 1 K compared to a decrease of only 0.1 K or even an increase of 0.1 K over southern CB. The absolute value of temperature increase was larger than the temperature decrease. The obvious reason was that land (loam) emits longwave radiation and its temperature decreases quickly, whether it is night or day. The absence of the shortwave radiation at night led to the temperature decrease over land being relatively large. During the day, besides the longwave radiation emission, there was also shortwave radiation absorption. Land increased temperature faster than water, while absorbing the same amount of heat. So, the water temperature was slightly lower during the day. The regional temperature variation also led to water vapor mixing ratio variability over CB. The resulting water vapor mixing ratio differences increased both at night (~2 g kg−1) and in the day (~0.5 g kg−1) (Figure 9c,d). Similarly, the vertical velocity difference also changed from night to day (Figure 9e,f). The vertical velocity changes were located at western CB and also mostly at northern CB. There was a velocity increase of about 0.005 m s−1 at the western shore of northern CB at night and a decreased of 0.002 m s−1 at the same location during the day, which corresponded to the temperature difference shown in Figure 9a,b. The positive water surface temperature change led to air ascent at night, while the negative water surface temperature change caused air to descend. The experiment showed that the water body modified the meteorology and dynamics of CB in a major way, leading to mixing and advection (via the prevailing winds). The higher surface temperature led to instability near the surface and more water vapor flux through the relatively higher vertical velocity, hence the flux that resulted.
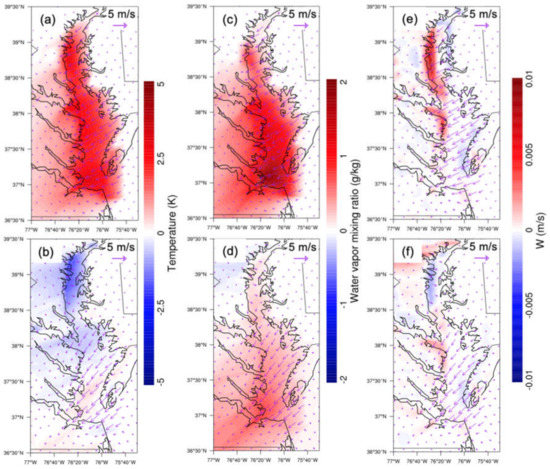
Figure 9.
WRF–Chem-simulated absolute differences (water minus nowater) in temperature (a,b), water vapor mixing ratio (c,d), and vertical velocity (e,f) between simulations of baseline (water) and sensitivity (nowater) experiments over CB overlaid with corresponding surface wind differences. The first row is at night; the second row is in the day. Daytime is defined as 1000–0000 UTC (or 06:00–20:00 local time); nighttime is defined as 0000–0900 UTC (or 00:00–06:00 and 20:00–00:00 local time).
Pressure differences were observed from the baseline and sensitivity experiments. At night, the effect of CB increased the surface pressure over the western shore of northern CB, leading to the pressure gradient force pointing from west to east (Figure 10a,c). This is consistent with Goldberg et al. (2014) [26]. The pressure gradient contributed to the land breeze from the west, offshore of CB. The resulting increased land breeze blew in opposition to the northeasterly prevailing wind, minimizing the wind difference over CB due to the water body (Figure 10a,c). During the daytime, CB decreased pressure. The pressure gradient favored the prevailing wind and worked to reinforce the flow (Figure 10b,d).
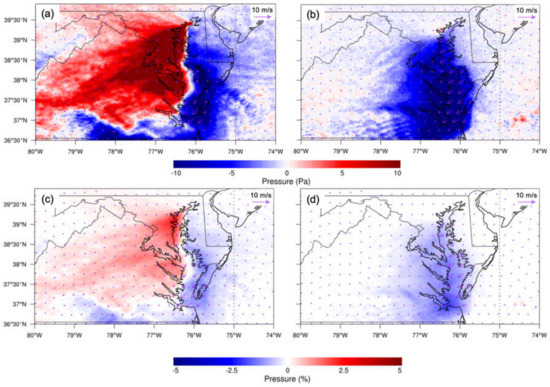
Figure 10.
(a) Averaged absolute surface pressure difference (water minus nowater) at night. (b) Same as (a), but in the day. (c) Averaged relative surface pressure difference at night. (d) Same as (c), but in the day. The overlaid streamline is the corresponding surface wind difference. Daytime is defined as 1000–0000 UTC (or 06:00–20:00 local time); nighttime is defined as 0000–0900 UTC (or 00:00–06:00 and 20:00–00:00 local time).
The differences in surface temperature, moisture, and vertical velocity have important influences on the stability and dynamics of the boundary layer. To investigate the stability consequences of these meteorological quantities, stability parameters were investigated. First, the gradient Richardson number (Ri) was defined as:
The gradient Richardson number is a dynamical stability measure to determine whether turbulence exists. g = 9.8 m s−2 is the gravitational acceleration. U and V are horizontal velocities. θv is the virtual potential temperature and can be calculated as:
r is the water vapor mixing ratio, and rL is the liquid water mixing ratio in the atmosphere. For the unsaturated atmosphere, rL = 0, and is the wind shear squared.
The root of the numerator in Equation (1) is the Brunt–Väisälä frequency (N), a measure of buoyancy, calculated using the following equation:
If the Brunt–Väisälä frequency is positive, the atmosphere is stable; if the Brunt–Väisälä frequency is negative, the atmosphere becomes unstable.
Figure 11 shows buoyancy, Brunt–Väisälä (buoyancy) frequency, wind shear squared, and gradient Richardson number at the surface, with a relative decrease in magnitude and no regional preference at night, which led to more instability due to the existence of CB. However, during the day, positive values for all parameters were found located over northern CB, while negative values were found at southern CB.
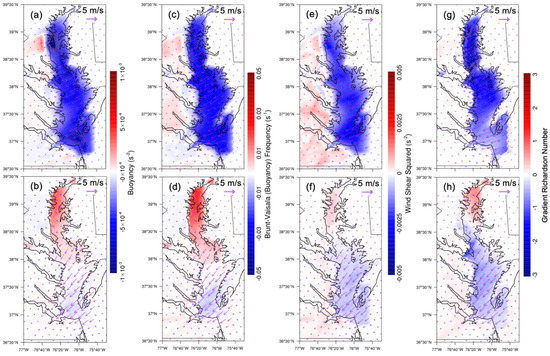
Figure 11.
Differences (water minus nowater) in WRF–Chem-simulated variables related to stability during both nighttime (first row) and daytime (second row). (a,b) Buoyancy. (c,d) Brunt–Väisälä (buoyancy) frequency. (e,f) Wind shear squared. (g,h) Gradient Richardson number. The overlaid streamline is the corresponding surface wind difference. Daytime is defined as 1000–0000 UTC (or 06:00–20:00 local time); nighttime is defined as 0000–0900 UTC (or 00:00–06:00 and 20:00–00:00 local time).
At night, the buoyancy, Brunt–Väisälä (buoyancy) frequency, wind shear squared, and gradient Richardson number decreased due to the presence of CB (Figure 11a,c,e,g). A relatively small water body surrounded by a large landmass over northern CB led to a significant thermally induced perturbation in contrast to southern CB. Relatively small surface wind differences were due to the water body and contributed to the atmospheric stability through wind shear. There was no regional preference of surface horizontal wind difference and thus its contribution to the instability was uniform over the entirety of CB (Figure 11a,c,e,g). In addition to the surface temperature increase, the vertical velocity difference was positive over northern and middle CB, which contributed to the unstable condition (Figure 10e). The critical Richardson number is 0.25. If the gradient Richardson number is less than 0.25, the atmosphere is dynamically unstable and turbulent. The gradient Richardson number difference was negative (around −1–−2) at northern CB and caused significant atmospheric instability. In the day, the surface wind differences at northern CB were smaller than at nighttime. The differences in buoyancy, Brunt–Väisälä (buoyancy) frequency, wind shear squared, and gradient Richardson number remained negative at southern CB and shifted to positive values at northern CB (Figure 11b,d,f,h). Contrary to the night, CB increased the gradient Richardson number in the day at northern CB, leading to the stable condition.
4.2.2. Vertical Dynamical Influence
Apart from the O3 mixing ratio horizontal distribution, its vertical distribution also helps to understand how CB influences the O3 three-dimensional distribution. The cross sections should pass through the east–west, north–south, and center of CB. We selected six cross sections to visualize the vertical pictures around CB. The vertical cross sections of O3 mixing ratio and water vapor mixing ratio were selected to characterize the role of CB in impacting their vertical distributions.
Figure 12 shows the O3 mixing ratio vertical distribution difference throughout northern, central, and southern CB to distinguish the possible dynamic variations due to different parts over CB. The PBLHs are shown for both the baseline and sensitivity experiments. At night, O3 was constrained within the shallow nocturnal boundary layer and the PBLH was less than 0.4 km, which led to the O3 increase at night as compared to the daytime (Figure 12a–c). The increased O3 mixing ratio difference was found near the surface to increasingly intrude over the western shore via transport by the nighttime breeze and the northeasterly prevailing wind. The water body of CB increased the PBLH by about 0.1 km over the west shore of northern CB. A subsidence of about 0.1 km in PBLH over eastern CB was also evident due, presumably, to the resulting subsidence (Figure 12a). Similar dynamics were observed at the cross sections over middle and southern CB (Figure 12b,c). After sunrise, the resulting instability and convection increased the PBLH from 0.4 to 1.0 km. PBLHs were tilted from west to east of CB. The west is close to land terrain, which meant a higher temperature during the day, while the east is near the Atlantic Ocean which had a lower temperature during the day. All these factors diluted the O3 mixture and transported O3 to the free troposphere, leading to surface O3 mixing ratio difference decrease.
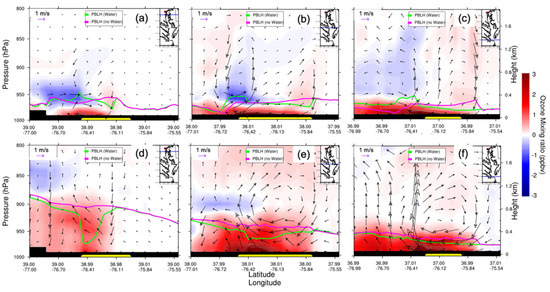
Figure 12.
WRF–Chem-simulated O3 mixing ratio vertical cross section (from west to east) differences (water minus nowater, night: (a–c); day: (d–f)). The overlaid streamline is the corresponding surface wind difference. The green curve is the PBLH of water; the pink curve is the PBLH of nowater; CB is represented by the yellow bar. The upright insert map shows the location of the vertical cross section (blue line). Note that vertical wind is magnified by 50 times for the illustration. Daytime is defined as 1000–0000 UTC (or 06:00–20:00 local time); nighttime is defined as 0000–0900 UTC (or 00:00–06:00 and 20:00–00:00 local time).
Another interesting point is the strength of the wind circulation in the vertical cross sections shown in Figure 12. The wind vectors for baseline and sensitivity experiments are not shown here due to the large number of figures. As the bay breeze moved from north to center to south, it became well defined and stronger (shown as circulations in Figure 12e,f). At the northern CB transect, surrounded by land and far from the Atlantic Ocean, the simulated PBLH increased dramatically when the water body was replaced by land (loam), implying that the land surface contribution to the PBLH was large. This indicated an ability to absorb large amounts of heat (shortwave radiation) with relatively little temperature change and resulted in subsiding air over CB. The overall result was that the maximum O3 mixing ratio difference was localized over western CB due to the shallow PBL with a relatively weak bay breeze to ventilate the O3 buildup. The change in PBLH was smaller in the central and southern transects where a much stronger breeze and shallower PBLH were observed.
Figure 13 shows O3 mixing ratio north–south transects at the west, over, and east of CB, which confirms the significant influence of the water surface and associated bay dynamics on the O3 mixing ratio and its distribution over and west of CB (Figure 13a–d), while no influence is visible at the east of CB (Figure 13e,f). The northeastern prevailing wind blew O3 to the west after its generation from CB. Figure 13 also shows the shallow and flat nocturnal PBLH (~0.2 km) at night as compared to the tilted and large PBLH in the day. We did not find the significant PBLH difference between water and nowater simulations at nighttime, whereas a totally different scenario unfolded for daytime PBLH over CB (Figure 13d), while the water-influenced PBLH was similar to the sensitivity simulations both west and east of CB, decreasing sharply from north to south, perhaps due to the water body area difference between northern and southern CB (Figure 13b,f). The PBLH over CB from the baseline experiment was much lower than the sensitivity experiment, approximately 0.8 km lower (Figure 13d). This was explained, as previously discussed, by the significant impact of the much smaller water body area over northern CB.
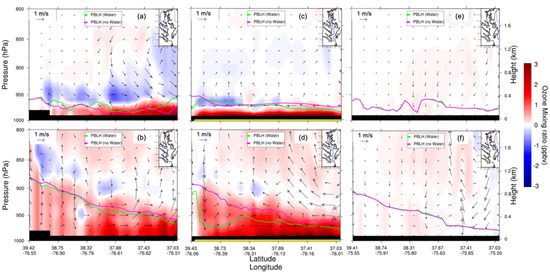
Figure 13.
WRF–Chem-simulated O3 mixing ratio vertical cross section (from north to south) differences (water minus nowater, night: (a,c,e); day: (b,d,f)). The overlaid streamline is the corresponding surface wind difference. The green curve is the PBLH of water; the pink curve is the PBLH of nowater. CB is denoted with the yellow bar. Note that vertical wind is magnified by 50 times for illustration purposes. Daytime is defined as 1000–0000 UTC (or 06:00–20:00 local time); nighttime is defined as 0000–0900 UTC (or 00:00–06:00 and 20:00–00:00 local time).
Water vapor can influence atmospheric stability as well. Equation (2) shows that the calculation of the gradient Richardson number uses the virtual potential temperature, which is influenced by water vapor (Equation (3)). If the water vapor increases near the surface, the virtual potential temperature will increase, which leads to a decrease in the virtual potential temperature vertical gradient. Then, the gradient Richardson number will decrease and the atmosphere will become unstable. The water body in CB influenced the water vapor mixing ratio vertical distribution (Figure 14). At night, the presence of CB increased the water vapor mixing ratio from north to south CB (Figure 14a,c,e). The water vapor increased much less over northern CB than over southern CB (Figure 14a,e), while, during the day, the water vapor mixing ratio increased less than at nighttime (Figure 14d,f) or even decreased over northern CB (Figure 14b). The possible reason is that the temperature decreased (Figure 9b). Overall, the atmosphere became unstable due to the increases in water vapor over CB.
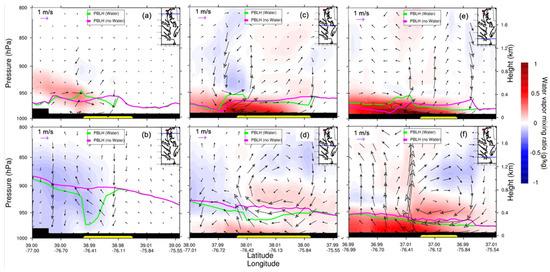
Figure 14.
WRF–Chem-simulated water vapor mixing ratio vertical cross section (from west to east) differences (water minus nowater, night: (a–c); day: (d–f)). The overlaid streamline is the corresponding surface wind difference. The green curve is the PBLH of water; the pink curve is the PBLH of nowater; CB is represented by the yellow bar. The upright insert map shows the location of the vertical cross section (blue line). Note that vertical wind is magnified by 50 times for the illustration. Daytime is defined as 1000–0000 UTC (or 06:00–20:00 local time); nighttime is defined as 0000–0900 UTC (or 00:00–06:00 and 20:00–00:00 local time).
5. Discussion and Conclusions
This paper has investigated the influence of CB on local O3 pollution by employing the WRF–Chem model to simulate the O3 concentration on 3 June 2015. To ensure model accuracy, we first validated the model’s performance in a simulation of O3 spatial distribution and time evolution using AirNow surface O3 observations. Through the comparison between baseline and sensitivity experiments over CB, by altering the surface type of CB from water to land (loam), dynamical differences due to CB were analyzed thoroughly from both horizontal and vertical directions. The findings showed that CB elevated the O3 mixing ratio both at nighttime and in the daytime, but for discrepant reasons.
The model-simulated O3 mixing ratio overall agreed with AirNow O3 observations, even though it overestimated ratios near mountains and underestimated them over New Jersey and Delaware. The higher O3 mixing ratio over CB was decidedly confirmed from the perspective of the model simulation, which was consistent with the previous studies over CB [24,26,27]. A shallower boundary layer decreased the surface O3 vertical dilution, especially for northern CB, which led to relatively high O3 concentration close to the surface. A strong bay breeze caused O3 to accumulate in the downwind region near CB. Taking the model uncertainty into account, the surface O3 mixing ratio increased by 10% at night and 5% in the day. The O3 mixing ratio difference gradient was negative over the eastern shore and positive over the western shore, which indicated that the O3 mixing ratio difference increased from the eastern shore to the western shore due to the northeastern prevailing winds. With the difference in O3 mixing ratio diurnal variation between the baseline and sensitivity experiments, water increased O3 by 5 ppbv (25%) at night and 2 ppbv (15%) during the day. The water body increased temperature by 2–3 K at night and decreased it by 1.0 K during the day, increased the water vapor mixing ratio by 2 g kg−1 at night and 0.5 K in the day, and increased vertical velocity by 0.005 m s−1 at night and decreased it by 0.002 m s−1.
The vertical distributions of the O3 mixing ratio and the water vapor mixing ratio showed the vertical influence of CB. The west–east cross sections located at northern, central, and southern CB showed that O3 was confined within PBL, which reached 0.2 km at night and extended to 0.8–1.0 km in the day (tilted PBL). PBLH is lowest over CB. Over land, PBLH is lower close to the upwind cold water, i.e., the eastern shore, and downwind and close to the Atlantic Ocean. PBLH is higher on the western shore of CB, where an urban heat island is present.
Apart from field campaigns, this work sheds light on how to employ models to study the influence of CB on O3 mixing ratios thoroughly, since models provide us with the flexibility to eliminate CB. This helps us to quantify the O3 concentration differences between them, with and without CB, even though model error attributes some uncertainties to these estimations. A merit of this modeling approach is that it provides us with a novel method to study the influence of CB on O3 in three dimensions, which could not be achieved with field campaigns. As models are further developed, the model errors will become smaller and analogous work in the future will be more reliable.
Author Contributions
Conceptualization, B.D. and Z.Y.; methodology, Z.Y. and B.D.; software, Z.Y.; validation, Z.Y., B.D., R.D., J.T.S., A.T. and P.L.; formal analysis, Z.Y. and B.D.; writing—original draft preparation, Z.Y.; writing—review and editing, B.D.; visualization, Z.Y.; supervision, B.D.; project administration, B.D.; funding acquisition, B.D. and R.D. All authors have read and agreed to the published version of the manuscript.
Funding
This work was partly funded by the National Science Foundation award (AGS-1503563) to the University of Maryland, Baltimore County, and by a grant from the Maryland Department of Environment (MDE) to the University of Maryland, Baltimore County. B. Demoz and R. Delgado were also partially funded by the National Oceanic and Atmospheric Administration—Cooperative Science Center for Atmospheric Sciences and Meteorology (NOAA-NCAS-M) and the Center for Earth System Sciences and Remote Sensing Technologies (NOAA-CESSRST) under the Cooperative Agreement Grants #NA16SEC4810006 and #NA16SEC4810008, respectively. The WRF–Chem model is publicly available at: https://www2.mmm.ucar.edu/wrf/users/, accessed on 1 October 2019. The EPA AirNow measurements are publicly available at: https://www.airnowtech.org/index.cfm, accessed on 20 September 2020.
Institutional Review Board Statement
Not applicable.
Informed Consent Statement
Not applicable.
Data Availability Statement
MODIS products are publicly available at: https://atmosphere-imager.gsfc.nasa.gov/products.html, accessed on 10 May 2020. The EPA AirNow measurements are publicly available at: https://www.airnowtech.org/index.cfm, accessed on 10 June 2020. The WRF–Chem model is publicly available at: https://www2.mmm.ucar.edu/wrf/users/, accessed on 2 February 2020.
Acknowledgments
The authors thank the High Performance Computing Facility (HPCF) at the University of Maryland, Baltimore County, for providing computing resources.
Conflicts of Interest
The authors declare that they have no conflict of interest.
References
- Lippmann, M. Health effects of tropospheric ozone. Environ. Sci. Technol. 1991, 25, 1954–1962. [Google Scholar] [CrossRef]
- Mudway, I.S.; Kelly, F.J. Ozone and the lung: A sensitive issue. Mol. Asp. Med. 2000, 21, 1–48. [Google Scholar] [CrossRef]
- Forouzanfar, M.H.; Afshin, A.; Alexander, L.T.; Anderson, H.R.; Bhutta, Z.A.; Biryukov, S.; Brauer, M.; Burnett, R.; Cercy, K.; Charlson, F.J.; et al. Global, regional, and national comparative risk assessment of 79 behavioural, environmental and occupational, and metabolic risks or clusters of risks, 1990–2015: A systematic analysis for the Global Burden of Disease Study 2015. Lancet 2016, 388, 1659–1724. [Google Scholar] [CrossRef]
- Ashmore, M.R. Assessing the future global impacts of ozone on vegetation. Plant Cell Environ. 2005, 28, 949–964. [Google Scholar] [CrossRef]
- Agyei, T.; Juráň, S.; Edwards-Jonášová, M.; Fischer, M.; Švik, M.; Komínková, K.; Ofori-Amanfo, K.K.; Marek, M.V.; Grace, J.; Urban, O. The Influence of Ozone on Net Ecosystem Production of a Ryegrass–Clover Mixture under Field Conditions. Atmosphere 2021, 12, 1629. [Google Scholar] [CrossRef]
- Juráň, S.; Grace, J.; Urban, O. Temporal changes in ozone concentrations and their impact on vegetation. Atmosphere 2021, 12, 82. [Google Scholar] [CrossRef]
- Martineau, R., Jr.; Novello, D. The Clean Air Act Handbook; American Bar Association: Chicago, IL, USA, 1997. [Google Scholar]
- Office of the Federal Register, National Archives and Records Administration. National Ambient Air Quality Standards for Ozone; Office of the Federal Register, National Archives and Records Administration: College Park, MD, USA, 2015; Volume 80, p. 65292.
- Cooper, O.R.; Langford, A.O.; Parrish, D.D.; Fahey, D.W. Challenges of a lowered US ozone standard. Science 2015, 348, 1096–1097. [Google Scholar] [CrossRef]
- Loughner, C.P.; Tzortziou, M.; Follette-Cook, M.; Pickering, K.E.; Goldberg, D.; Satam, C.; Weinheimer, A.; Crawford, J.H.; Knapp, D.J.; Montzka, D.D.; et al. Impact of bay-breeze circulations on surface air quality and boundary layer export. J. Appl. Meteorol. Climatol. 2014, 53, 1697–1713. [Google Scholar] [CrossRef]
- Sullivan, J.T.; Berkoff, T.; Dreessen, J.; Delgado, R.; Gronoff, G.; Nino, L.; Carroll, B.; Tzortziou, M. Direct Observations of Pollution Gradients within the Chesapeake Bay Watershed: Overview of the Ozone Water-Land Environmental Transition Study-2 (OWLETS-2). In Proceedings of the AGU Fall Meeting, Washington, DC, USA, 10–14 December 2018. [Google Scholar]
- Daum, P.H.; Kleinman, L.I.; Springston, S.R.; Nunnermacker, L.J.; Lee, Y.N.; Weinstein-Lloyd, J.; Zheng, J.; Berkowitz, C.M. Origin and properties of plumes of high ozone observed during the Texas 2000 Air Quality Study (TexAQS 2000). J. Geophys. Res. Atmos. 2000, 109, D17306. [Google Scholar] [CrossRef]
- Lyons, W.A.; Cole, H.S. Photochemical oxidant transport: Mesoscale lake breeze and synoptic-scale aspects. J. Appl. Meteor. 1976, 15, 733–743. [Google Scholar] [CrossRef][Green Version]
- Dye, T.S.; Roberts, P.T.; Korc, M.E. Observations of transport processes for ozone and ozone precursors during the 1991 Lake Michigan Ozone Study. J. Appl. Meteor. 1995, 34, 1877–1889. [Google Scholar] [CrossRef]
- Lyons, W.A.; Tremback, C.J.; Pielke, R.A. Applications of the Regional Atmospheric Modeling System (RAMS) to provide input to photochemical grid models for the Lake Michigan Ozone Study (LMOS). J. Appl. Meteor. 1995, 4, 1762–1786. [Google Scholar] [CrossRef]
- Brook, J.R.; Makar, P.A.; Sills, D.M.L.; Hayden, K.L.; McLaren, R. Exploring the nature of air quality over southwestern Ontario: Main findings from the Border Air Quality and Meteorology Study. Atmos. Chem. Phys. 2013, 13, 10461–10482. [Google Scholar] [CrossRef]
- Blaylock, B.K.; Horel, J.D.; Crosman, E.T. Impact of lake breezes on summer ozone concentrations in the Salt Lake valley. J. Appl. Meteorol. Climatol. 2017, 56, 353–370. [Google Scholar] [CrossRef]
- Sullivan, J.T.; Berkoff, T.; Gronoff, G.; Knepp, T.; Pippin, M.; Allen, D.; Twigg, L.; Swap, R.; Tzortziou, M.; Thompson, A.M.; et al. The Ozone Water–Land Environmental Transition Study: An Innovative Strategy for Understanding Chesapeake Bay Pollution Events. Bull. Am. Meteorol. Soc. 2019, 100, 291–306. [Google Scholar] [CrossRef]
- LMOS 2017 Study Team. 2017 Lake Michigan Ozone Study (LMOS) Preliminary Finding Report; NASA: Hampton, VA, USA, 2019.
- Porg, U. Ozone in the United Kingdom; United Kingdom Photochemical Oxidants Review Group Report; Department of the Environment: London, UK, 1997.
- Jenkin, M.E.; Clemitshaw, K.C. Ozone and other secondary photochemical pollutants: Chemical processes governing their formation in the planetary boundary layer. Atmos. Environ. 2000, 34, 2499–2527. [Google Scholar] [CrossRef]
- Karle, N.N.; Mahmud, S.; Sakai, R.K.; Fitzgerald, R.M.; Morris, V.R.; Stockwell, W.R. Investigation of the Successive Ozone Episodes in the El Paso–Juarez Region in the Summer of 2017. Atmosphere 2020, 11, 532. [Google Scholar] [CrossRef]
- Crawford, J.H.; Pickering, K.E. DISCOVER-AQ: Advancing strategies for air quality observations in the next decade. Environ. Manag. 2014, 4, 4–7. [Google Scholar]
- Loughner, C.P.; Allen, D.J.; Pickering, K.E.; Zhang, D.L.; Shou, Y.X.; Dickerson, R.R. Impact of fair-weather cumulus clouds and the Chesapeake Bay breeze on pollutant transport and transformation. Atmos. Environ. 2011, 45, 4060–4072. [Google Scholar] [CrossRef]
- Foley, T.; Betterton, E.A.; Jacko, P.R.; Hillery, J. Lake Michigan air quality: The 1994–2003 LADCO Aircraft Project (LAP). Atmos. Environ. 2011, 45, 3192–3202. [Google Scholar] [CrossRef]
- Goldberg, D.L.; Loughner, C.P.; Tzortziou, M.; Stehr, J.W.; Pickering, K.E.; Marufu, L.T.; Dickerson, R.R. Higher surface ozone concentrations over the Chesapeake Bay than over the adjacent land: Observations and models from the DISCOVER-AQ and CBODAQ campaigns. Atmos. Environ. 2014, 84, 9–19. [Google Scholar] [CrossRef]
- He, H.; Loughner, C.P.; Stehr, J.W.; Arkinson, H.L.; Brent, L.C.; Follette-Cook, M.B.; Tzortziou, M.A.; Pickering, K.E.; Thompson, A.M.; Diskin, G.S.; et al. An elevated reservoir of air pollutants over the Mid-Atlantic States during the 2011 DISCOVER-AQ campaign: Airborne measurements and numerical simulations. Atmos. Environ. 2014, 85, 18–30. [Google Scholar] [CrossRef]
- Anderson, D.C.; Loughner, C.P.; Diskin, G.; Weinheimer, A.; Canty, T.P.; Salawitch, R.J.; Tzortziou, M.A.; Pickering, K.E.; Thompson, A.M.; Martins, D.K.; et al. Measured and modeled CO and NOy in DISCOVER-AQ: An evaluation of emissions and chemistry over the eastern US. Atmos. Environ. 2014, 96, 78–87. [Google Scholar] [CrossRef]
- Flynn, C.M.; Pickering, K.E.; Crawford, J.H.; Weinheimer, A.J.; Diskin, G.; Thornhill, K.L.; Loughner, C.; Lee, P.; Strode, S.A. Variability of O3 and NO2 profile shapes during DISCOVER-AQ: Implications for satellite observations and comparisons to model-simulated profiles. Atmos. Environ. 2016, 147, 133–156. [Google Scholar] [CrossRef]
- Crosman, E.T.; Horel, J.D. Sea and lake breezes: A review of numerical studies. Bound.-Layer Meteorol. 2010, 137, 1–29. [Google Scholar] [CrossRef]
- Jiménez, P.; Jorba, O.; Parra, R.; Baldasano, J.M. Evaluation of MM5-EMICAT2000-CMAQ performance and sensitivity in complex terrain: High-resolution application to the northeastern Iberian Peninsula. Atmos. Environ. 2006, 40, 5056–5072. [Google Scholar] [CrossRef]
- Grell, G.A.; Peckham, S.E.; Schmitz, R.; McKeen, S.A.; Frost, G.; Skamarock, W.C.; Eder, B. Fully coupled online chemistry within the WRF model. Atmos. Environ. 2005, 39, 6957–6975. [Google Scholar] [CrossRef]
- Zaveri, R.A.; Peters, L.K. A new lumped structure photochemical mechanism for large-scale applications. J. Geophys. Res. 1999, 104, 30387–30415. [Google Scholar] [CrossRef]
- Zaveri, R.A.; Easter, R.C.; Fast, J.D.; Peters, L.K. Model for Simulating Aerosol Interactions and Chemistry (MOSAIC). J. Geophys. Res. 2008, 113, D13204. [Google Scholar] [CrossRef]
- Hong, S.Y.; Pan, H.L. Nonlocal boundary layer vertical diffusion in a medium-range forecast model. Mon. Weather Rev. 1996, 124, 2322–2339. [Google Scholar] [CrossRef]
- Hong, S.Y.; Noh, Y.; Dudhia, J. A new vertical diffusion package with an explicit treatment of entrainment processes. Mon. Weather Rev. 2006, 134, 2318–2341. [Google Scholar] [CrossRef]
- Hu, X.M.; Nielsen-Gammon, J.W.; Zhang, F. Evaluation of three planetary boundary layer schemes in the WRF model. J. Appl. Meteorol. Climatol. 2010, 49, 1831–1844. [Google Scholar] [CrossRef]
- Iacono, M.J.; Delamere, J.S.; Mlawer, E.J.; Shephard, M.W.; Clough, S.A.; Collins, W.D. Radiative forcing by long-lived greenhouse gases: Calculations with the AER radiative transfer models. J. Geophys. Res. Atmos. 2008, 113, D13103. [Google Scholar] [CrossRef]
- Peckham, S.E.; Grell, G.A.; McKeen, S.A.; Barth, M.; Pfister, G.; Wiedinmyer, C.; Fast, J.D.; Gustafson, W.I.; Hewson, M.; Schmitz, R.; et al. WRF/Chem Version 3.7 User’s Guide. 2015. Available online: https://permanent.access.gpo.gov/gpo67735/Users_guide.pdf (accessed on 20 May 2020).
- The NCAR Command Language (Version 6.6.2) [Software]. Boulder, Colorado, 2019, UCAR/NCAR/CISL/TDD. Available online: https://doi.org/10.5065/D6WD3XH5 (accessed on 1 August 2020).
- National Centers for Environmental Information. NOAA NOS Estuarine Bathymetry—Chesapeake Bay (M130). National Centers for Environmental Information, NOAA. 2017. Available online: https://doi.org/10.7289/V5ZK5F0X (accessed on 12 May 2020).
- Stauffer, R.M.; Thompson, A.M.; Martins, D.K.; Clark, R.D.; Goldberg, D.L.; Loughner, C.P.; Delgado, R.; Dickerson, R.; Stehr, J.W.; Tzortziou, M. Bay breeze influence on surface ozone at Edgewood, MD during July 2011. J. Atmos. Chem. 2015, 72, 335–353. [Google Scholar] [CrossRef]
Publisher’s Note: MDPI stays neutral with regard to jurisdictional claims in published maps and institutional affiliations. |
© 2022 by the authors. Licensee MDPI, Basel, Switzerland. This article is an open access article distributed under the terms and conditions of the Creative Commons Attribution (CC BY) license (https://creativecommons.org/licenses/by/4.0/).