Abstract
This paper presents the temporal characteristics of electromagnetic fields produced by cloud-to-ground (CG) lightning flashes associated with Antarctica storms. A total of 51 positive CG (+CG) and 103 negative CG (−CG) flashes have been recorded by a magnetic direction finder (MDF) sensor in King Sejong Station, King George Island. In total, 47 positive and 107 negative return strokes were located, ranges from 32 to 569 km. All CG flashes were detected to occur over the ocean. The return strokes characteristics include the observations of slow front, fast rising, rise time, and pulse duration with geometric mean values of 3.2, 0.53, 3.21, 13.12, and 67.09 µs for +CG flashes, while 3.9, 0.57, 3.72, 20.75, and 69.86 µs for −CG flashes, respectively. Additionally, the average peak currents of +CG and −CG flashes were 4.13 kA and 3.14 kA, respectively. The temporal characteristics of the return strokes of Antarctica storms are comparable to other geographical regions. The smaller peak currents might be due to small magnitude of Antarctica cloud charges when compared to other geographical regions.
1. Introduction
A recent study reported lightning occurrences in the Arctic based on Worldwide Lightning Location Network (WWLLN) data [1]. The trend of annual total lightning strikes has been incremental in the past 10 years, where the annual lightning strikes increased from 30,000 in 2010 to 240,000 in 2020. Another study reported lightning occurrences in western Antarctica using a commercial Boltek Lightning Detector [2]. During their experiments between February and December 2017, a total of 43% positive cloud-to-ground (+CG) and 57% negative cloud-to-ground (−CG) flashes were detected. Most of the flashes were detected between February and May (summer and autumn), accounting for around 96% of the total CG flashes. The authors recorded more +CG flashes in the Antarctica Peninsula compared to other regions. For comparison, the percentages of detected +CG were 8.4% in Uppsala, Sweden (59.9°, 2009 to 2014) [3], 5.4% in Hubei province, China (29.0° to 33.3°, 2006 to 2012) [4], and 0.8% in Skudai, Malaysia (1.6°, April to May 2009 and November to December 2012) [3]. It has been suggested that the occurrence of +CG flashes is latitude-dependent [3]. Since thunderstorms in high latitudes have lower cloud tops (lower tropopause layer) and mixed-phase regions compared to storms in the tropics, more +CG occurrence would be expected to be detected in high latitudes than in the tropics. Therefore, since Antarctica is located at a latitude higher than the polar circle (60°), the amount of +CG flashes should be significant.
In some cases, thunderstorms could be predominately +CG flashes with inverted polarity cloud charge structure where the main negative charges layer is above the positive charges layer [5]. Such thunderstorms could be found in the Great Plains and the United States Midwest [5,6]. A tornadic supercell was examined during the Severe Thunderstorm Electrification and Precipitation Study (STEPS) on 29 June 2000 [7]. It was found that 90% of the total detected CG flashes were +CG flashes. During the predominately +CG flashes, the storm consistently produced a dominant upper level (around 8 to 12 km above mean sea level, MSL) of inverted dipole charge structure, which extended downward and sloped with additional negative charge beneath it. The charge structure was complex but could be roughly described as an inverted tripole charge structure. The +CG flashes produced by deep mid-level positive charge were around 5 to 9 km above MSL, and clustered on the downwind side of the main precipitation of the storm. The prevalent +CG flashes in Antarctica [1,2] might have been produced by the similar cloud charge structure. Moreover, it has been observed that during winter thunderstorms in Honshu Island Japan, more than 30% of CG flashes transferred positive charges to the ground [8,9,10]. The situation was different during summer thunderstorms that usually produced relatively more negative CG flashes. It has been suggested that dipole charge structure could be tilted from the strong vertical wind shear in winter storms and thus caused the prevalence of +CG flashes.
A combination of Cloud-Aerosol Lidar and Infrared Pathfinder Satellite Observation (CALIPSO) and CloudSat has been used to study cloud structure in Antarctica [11]. The authors analyzed cloud thickness (CTH), cloud base height above MSL (Hbase), cloud top height above MSL (Htop), and mean of maximum equivalent radar reflectivity factor (Zmax). They classified clouds in Antarctica into four types, namely, the high-level, middle-level, low-level, and deep clouds, with maximum (mean) value of cloud top of 10.3 (9.9), 6.6 (6.4), 2.6 (2.5), and 9.1 (8.6) km, respectively. Clouds over Antarctica and its surrounding seas have interseasonal variation. During summer and fall seasons, cloud occurrences were greater than 80% due to high number of cyclonic disturbances that resulted in more cloudiness compared to winter and spring seasons. The largest total cloud occurrences could be observed over the Amundsen–Bellingshausen Sea (ABS) in the western Antarctica region with 80 to 90% cloud occurrences throughout all seasons. On the other hand, only 20 to 30% of cloud occurrences have been observed over the Transantarctic Mountains in the eastern region of Antarctica.
Furthermore, it was found that clouds over sea have greater cloud occurrences and greater vertical extent than the clouds over land. Observation of meridional average vertical distribution of cloud occurrence between June and May of 2006–2010 southward of 60° S were observed for continental Antarctica and the Southern Ocean [11]. Over land, cloud occurrences abruptly discontinued at 60° W, with higher cloud occurrence to the west and lower cloud occurrence to the east. Over the western continental region, which is adjacent to the ABS, low level cloud (1–2 km) occurrence was up to 50% while cloud that extended to 8 km above the surface had cloud occurrence of 30%. Over the eastern side of the continental region, which includes the Antarctic Plateau, low level clouds (1–3 km) occurred for 25–30% of cloud occurrence while less than 10% were above 5 km from the surface. For all seasons except summer, clouds over land were observed to reach up to 8 km. Greater cloud occurrences and vertical extent could be observed over sea, where the cloud tops reached up to 10 km height. Large cloud occurrence was consistently observed around 100° E throughout the year. During winter and spring seasons, cloud tops could extend over 11 km. Meanwhile, during summer and fall seasons, cloud tops could barely extend up to 10 km above the surface. The report of cloud occurrences and their characteristics (high cloud tops and cyclonic disturbances) indicates that electrical charges separation is possible inside the Antarctica clouds [11]. Additionally, it was suggested that Antarctica thunderclouds might have inverted and/or tilted dipole charge structure due to the prevalence of +CG flashes [2].
In this paper, we present the analysis of lightning electromagnetic fields associated with Antarctica thunderclouds for the first time. Measurement of electromagnetic fields was conducted in the King Sejong Station in the Antarctica Peninsula region. The temporal characteristics of positive and negative return strokes are evaluated. This study is important since the temporal analysis could reveal the characteristic of ground flash, thus confirming its occurrences in the polar region. The characteristics of return strokes in CG flashes include the slow front, 10–90% fast rising, 10–90% rise time, zero crossing time, and pulse duration for both +CG and −CG flashes. Moreover, the number of strokes per flash and the interstroke intervals between successive strokes were also measured and analyzed. Comparative studies were made for the various parameters of the first and the subsequent return strokes and were compared with findings from previous studies.
2. Materials and Methods
A lightning measurement station consisted of fast antenna (FA) and slow antenna (SA) electric field sensors systems (decay time constants of 13 ms and 1 s, respectively), and a magnetic field (B-field) sensor (two orthogonal loop antennas) have been successfully deployed in King Sejong Station or KSJ (62°13′22″ S 58°47′18″ W), King George Island, Antarctica. The B-field sensor, together with the FA sensor, was used to configure the single station magnetic direction finder (MDF) system. The B-field sensor consisted of two orthogonal loops oriented at the north–south (NS) and east–west (EW), operated between 400 Hz and 400 kHz. The magnetic field sensor could detect lightning within 800 km from the measurement station [12]. The estimation of distance of lightning source (d) was based on the Earth propagation model [13] and the relationship between radiation components of electric and magnetic fields [14]. The estimation of distance was governed by the following equations:
To calculate the estimated distance between the measuring station and lightning source, d is calculated with the estimated height of striking distance, h, and the elevation angle, α. The elevation angle can be calculated based on Equation (2) from the ratio of vertical components of electric field intensity, , and the azimuthal components of magnetic flux density, , where c is the speed of light.
The vertical component of electric field density can be calculated with Equation (3), where is the measured value of voltage of the total vertical electric field from electric field measurement (FA sensor). The values of the capacitances such as capacitance of the antenna relative to the ground, , capacitance value of the 58 Ω coaxial cable, , and the capacitor value used in the filter circuit, C, are shown in Equation (3). The value of can be calculated using Equation (4) where is the permittivity of free space, A is the area of the antenna, and D is the distance gap between the antenna plates. To calculate the vertical electric field, the linear equation of effective height of parallel plate antenna is calculated with the physical height of the antenna to the ground, [15].
Moreover, the azimuthal magnetic field amplitudes, , were calculated using Equation (6) based on the square root of the measured voltage of NS and EW measurement using the loop antenna. Since the core of the loop antenna was ferromagnetic material, it is taken into consideration as Factor B, which comprises the area, number of loops, and the permeability value of ferromagnetic material. By applying all the equations, the estimated distance of the lightning source could be calculated from the measurement station. A case study was conducted with the same measurement station deployed in Malaysia, which was compared with Vaisala time-of-arrival (ToA) lightning location system, yielding the accuracy of the MDF system of 7.6 km [16].
The waveform from each sensor was recorded continuously by a digitizer. The outputs of the antennas were digitized at a rate of 2.4 MS/s with a vertical resolution of 12 bits for 200 ms window size. The timing for all captured events was provided by a Global Positioning System (GPS). The digitizer operated using a computer to display the waveforms and to make sure all waveforms had the same timestamp. The recorded waveforms were all timestamped with the Universal Time Coordinates (UTC) and in the 24 h format. The waveforms of the return strokes captured by using FA and B-field sensor were filtered in MATLAB between 400 Hz and 100 kHz to make sure the frequency components of both electric and magnetic fields are the same for the estimation of distance and location. Far-distance electromagnetic fields (more than 200 km) might be attenuated during wave propagation, and the errors might be higher. Additional details for the E-field and B-field instrumentations are given in [17]. Data from the Worldwide Lightning Location Network (WWLLN) was used to compare lighting strike locations. This global lightning locator uses VLF sensors placed around the world.
In this paper, we identified 51 +CG and 103 −CG detected between 11 and 31 January 2020. Each of the CG flash return strokes were observed based on its temporal characteristics such as slow front, 10–90% fast rising, 10–90% rise-time, zero-crossing time, pulse duration, and amplitude. Not all CG flashes have slow fronts; only 47 out of 51 +CG and 29 out of 103 −CG flashes have slow fronts. There were 15 thunderstorms identified during the measurement periods. A total of 46 +CG and 107 −CG return strokes were located, while the rest could not be located due to contamination of electromagnetic waveforms with noise. Based on located return strokes, normalized electric fields (100 km) and peak currents were also estimated.
Figure 1a shows an example of a return stroke of a +CG flash detected on 24 January at 22:02 located 177.4 km from the measurement station, while Figure 1b shows an example of a return stroke of a −CG flash detected on 15 January at 07:46 located 109.1 km from the measurement station. At the initial rising part of the return stroke, two parameters were observed that comprised slow rising parts known as slow front, followed by a relatively fast rise to the peak, known as fast transition. The breakpoint between these two parameters is normally around 50% from the initial of the return stroke to its peak for the first return stroke, while the subsequent return stroke has a breakpoint of 20% [18]. For the third observation, the zero-to-peak rise time is defined as the duration between the initial of the return stroke to its highest peak of return stroke. The fourth observed parameter is the zero-crossing time which can be defined as the time when the radiation field crosses the zero line, as depicted in Figure 1a,b. Lastly, the pulse duration of the return stroke, defined as the time when radiation field of return stroke completes one cycle, was also measured.
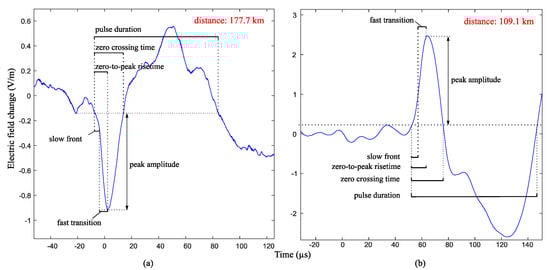
Figure 1.
The characteristics of a return stroke for (a) a positive (+CG) flash detected at 177.7 km, and (b) a negative (−CG) flash detected at 109.1 km, from measurement station, respectively. The waveforms are plotted based on atmospheric electricity sign convention.
The CG flashes peak currents can be estimated from the measured electric fields. According to the transmission line (TL) model, the peak current is related to the far-field electric field peak and return stroke speed [19]. Based on the study in [19], they validated the derived equations with simultaneous measurement of return stroke current, electric field at 5 km, and return stroke speed associated with triggered lightning return strokes. Based on the statistical parameters of their study, minimum and maximum peak currents were calculated using the minimum and maximum return stroke speed.
3. Results and Analysis
3.1. Occurrence of CG Flashes
The identification of the flash type was based on the record of fast electric field change. In this study, slow electric field change measurements were recorded simultaneously, but there are no visible pulses related to lightning events that could be observed throughout the measurement period. From the total recorded 51 +CG flashes, 46 were single-stroke flashes, four were one subsequent return stroke flashes, and one was three subsequent return strokes flash. In addition to that, from the total of 103 −CG flashes, 98 were single-stroke flashes, three were one subsequent return stroke flashes, one was two subsequent return strokes flashes, and one was three subsequent return strokes flash. The distribution of flash multiplicity is illustrated in Figure 2a, which shows the distribution of the total ground flashes captured by the measurement station.
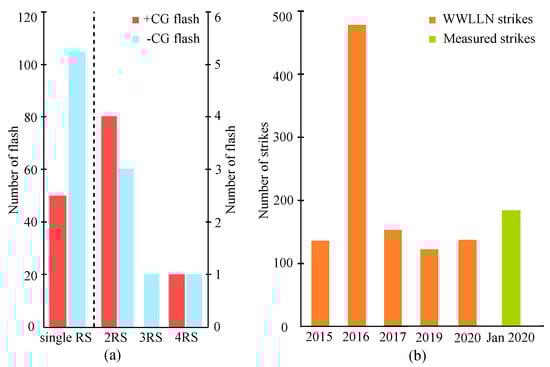
Figure 2.
(a) Distribution of CG flashes recorded in Antarctica based on its polarities; (b) total number of lightning strikes; orange represents worldwide lightning location network (WWLLN) annual lightning strikes distribution between 2015 and 2020, while the green column represents total CG lightning strokes in King Sejong Station recorded by our lightning measurement station between 11 and 31 January 2020 in Antarctica.
The global lightning location from WWLLN has been observed for five years between 2015 and 2020. Lightning strikes detected within 600 km from our lightning measurement station were considered for comparison based on the farthest lightning detected by our measurement system at 570 km. Figure 2b shows the annual distribution of lightning strokes from WWLLN data. Between the years of 2015 and 2020, the total detected lightning strikes in a year by WWLLN within the vicinity of our lightning measurement system were 136, 478, 153, 122, and 137, respectively, except for the year 2018 which was not included due to the lack of data. In comparison, a total of 154 lightning strikes were captured between 11 and 31 January 2020 by our measurement system. Moreover, the number of lightning strikes captured in the month of January by WWLLN between the year 2015 and 2020 (excluding 2018) were 7, 192, 10, 5, and 5, respectively. By comparing both data, it can be suggested that our measurement system was more sensitive in measuring lightning events.
Figure 3 shows the locations of the return strokes of +CG (red plots) and −CG (blue plots) flashes located between 32 and 530 km and between 32 and 569 km, respectively. A total of 129 return strokes were located northeast of the measurement station, two return strokes were located southwest, and 22 return strokes were located northwest of the measurement station. Almost all lightning strikes located by our measurement station occurred over the ocean. The measurements of lightning flashes throughout the month of January have been classified into 15 storms, where five of them are shown individually in Figure 4a–e, while Figure 4f shows a combination of the remaining 10 storms with fewer counts of lightning strikes.
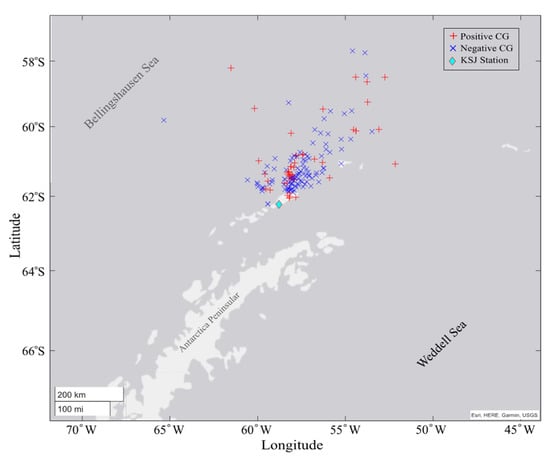
Figure 3.
The locations of the return strokes estimated based on the electromagnetic field measurement in King Sejong Station throughout the month of January 2020.
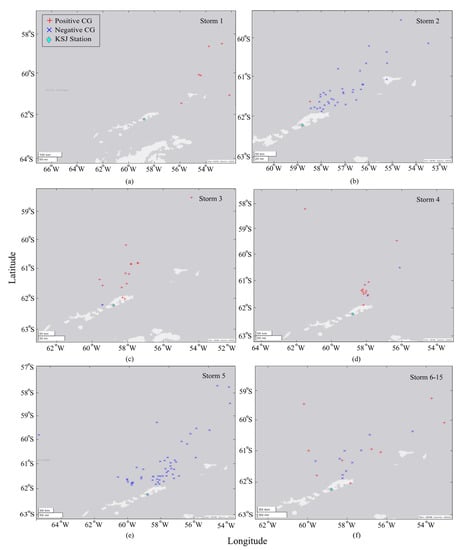
Figure 4.
Individual storms occurring on different days throughout the month of January 2020.
3.2. Temporal Characteristics of CG Flashes
3.2.1. Return Stroke Parameters
Return strokes were analyzed throughout this study based on parameters such as the slow front duration, fast transition duration, zero-to-peak rise time, zero crossing time, pulse duration, the normalized electric field peak, and the peak current, which are defined and illustrated in Figure 1a,b for +CG and −CG flash, respectively. The statistics of the measured parameters are presented in Table A1 and Table A2. Figure 5 shows the boxplot of the overall return stroke parameters while Figure 6a,b show the normalized electric field and estimated peak current for all the CG flashes.
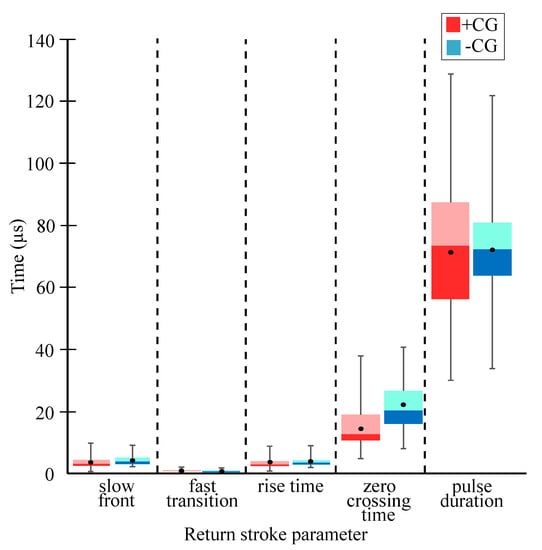
Figure 5.
Statistics of overall return strokes parameters including slow front, 10–90% fast rising, 10–90% rise time, zero crossing time, and pulse duration in µs scale. Red box represents +CG, while blue/cyan box represents −CG flashes.
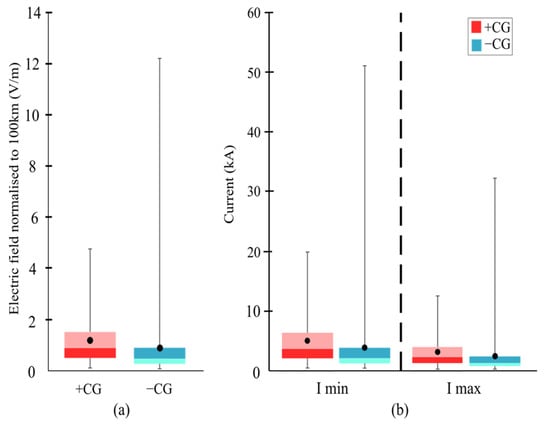
Figure 6.
(a) Electric field intensity normalized to 100 km for +CG (red box) and −CG (cyan/blue box); (b) estimated positive and negative CG minimum and maximum peak currents.
3.2.2. CG Flash Return Strokes
A total of 51 +CG flashes were identified from our measurement of lightning flashes in King Sejong Station, Antarctica. Out of the total, 46 flash were single-stroke, four flash had one subsequent return stroke, and one flash had three subsequent return strokes. Meanwhile, for −CG flashes, a total of 103 were identified throughout the month of January measurements. From the total −CG flashes recorded, 98 were single-stroke flash, three had one subsequent return stroke, one had two subsequent return strokes, and one had three subsequent return strokes.
Table A1 and Table A2 and Figure 5 tabulate the statistics of temporal characteristics of the first return strokes and subsequent return strokes of both +CG and −CG flashes. The minimum slow front duration of −CG flashes is 3.4 times longer compared to +CG flash, while the maximum values were comparable. The arithmetic mean (AM) and geometric mean (GM) values of slow front duration for −CG flashes were 11.7% and 18% longer compared to +CG flashes, respectively. For the 10–90% risetime duration, the AM and GM durations of −CG flashes were slightly higher, by 6.3% and 13.7%, than +CG flashes, respectively. For the zero-crossing time, −CG flashes had longer duration compared to +CG flashes. The AM and GM values of the normalized electric fields of +CG flash are 23.5% and 35.0% higher compared to −CG flashes.
From the measured electric fields, the peak currents, I, could be estimated, as follows [19]:
where c is the speed of light, r is the horizontal distance between measurement station and lightning strike location, v is the return stroke speed, E is the electric field intensity peak, and is the permittivity value of free space. Based on triggered lightning observations, the mean values of minimum and maximum of return stroke speed were and m/s, respectively. By using Equation (8), the minimum and maximum peak currents of the return strokes could be estimated [19]. The derived equations to estimate the peak current were validated with measurement of return stroke currents with electric field at 5 km and return stroke speeds associated with triggered lightning return strokes. By inserting the statistical parameter associated with return stroke speed in the derived equations, return stroke currents were in good agreement with the measured values [19]. Based on the return strokes detected in Antarctica, the AM and GM values of the peak currents of −CG flashes were 23.7% and 34.6% higher than the peak currents of +CG flashes, respectively.
3.2.3. Flash Multiplicity
The subsequent return strokes analyzed in this paper are classified to be from the same flash as the first return stroke when it occurred within the 500 ms duration from the first return stroke [20]. Due to the lack of photographic capability at our measurement site, it was not possible to determine the termination point for each subsequent stroke. From the total recorded 51 +CG flashes, 46 were single-stroke (90%) and five were multiple strokes (10%). From these five +CG flashes, four were two-strokes flashes (8%) and one had four strokes (2%). The average multiplicity based on number of strokes per flash was 1.14. Apart from that, 103 −CG flashes were recorded as well, where 98 were single-stroke (95%) and five were multiple strokes (5%). Out of these five flashes, three were two-strokes flashes (3%), one flash was three-strokes (1%), and another one was four-strokes (1%). The average multiplicity of −CG flash was 1.11.
By referring to Table A3 and Table A4 [21,22,23,24,25,26,27,28,29,30,31], it can be observed that most flashes from different geographical regions comprised single-stroke flashes, where mean multiplicity was between 1.04 to 3.14 for +CG flashes and 1.11 to 5.2 for −CG flashes. Only a handful of studies report the occurrence of four-strokes +CG flashes, with only five cases reported by previous studies [21,22,23]. From the total number of analyzed +CG flashes, this study found around 10% multiple-stroke flashes (from 51 flashes) compared to 12% in [21], 37% in [22], 11% in [23], 19% in [24], 19% in [25], 4% for +CG and 60% for −CG in [26] and 12.5% in [27]. Ref. [22] recorded the highest number of flash multiplicity in +CG flash (37%), even though the geographical location and climate of measurement is similar to [21], which only recorded 12% +CG flashes with multiple strokes. One possible reason for the difference might be due to the sample size used in [22], where two different summer periods were observed, while only one summer period measurement was conducted in [21].
Similar observation could be seen based on the studies in [23,27] that showed different statistics of multiple strokes +CG flashes with 12.5% and 25%, respectively. Both studies were conducted in similar geographical location and climate, but the difference was quite large, indicating that a higher sample from different measurement periods could affect the statistics. On the other hand, all studies found that most flashes recorded in various geographical locations were single-stroke flashes, accounting for more than 70% of total ground flashes. For the interstroke intervals of CG flashes based on studies in [21,22,23,24,25,26,27,32,33] (see Table A5), the minimum and maximum values were comparable with previous studies, with minimum and maximum values observed to be between 2.9 and 518 ms.
4. Discussion
Measurements of electromagnetic fields carried out in King Sejong Station have shown presence of lightning activities in the western part of Antarctica as shown in Figure 3. The annual march of cyclonic activities over the adjacent of the South Ocean near the Amundsen–Bellingshausen Sea (ABS) transport moisture and heat to the Western Antarctica side [34]. As discussed in Section 1, [11] classified four types of clouds in Antarctica, namely high-level, middle-level, low-level, and deep clouds. Throughout the seasons, the highest total cloud occurrence of 80–90% was observed near the ABS, west of Antarctica.
Cloud occurrences varied on an inter-sessional basis, where greater cloud occurrence within the circumpolar region throughout summer and fall seasons, compared to during winter and spring seasons. Referring to Figure 4 in [11], low-level stratus clouds were the major components of the clouds in the coastal regions throughout the seasons. Nonetheless, the high-level and deep clouds that extended beyond 7 km vertically were observed throughout the year. In the western region next to the ABS, 30% of cloud occurrence extended up to 8 km from the surface, while in the continental region in the east, less than 10% of cloud occurrences were above 5 km. More than 25% of clouds that occurred over the land were observed to have height up to 8 km westward of the Antarctica Peninsula in all seasons except during summer. Meanwhile, for clouds over the ocean, more than 25% extended over 11 km during winter and spring seasons. During summer and fall seasons, clouds over the ocean rarely extend up to 10 km above the surface.
Referring to [18], when conditions are preferable, clouds that grow vertically from cumulus congestus to cumulonimbus are capable of producing lightning. Due to the temperature inversion at tropopause, the growth of thunderclouds is limited. Therefore, thundercloud activities are limited to the troposphere. In the temperate region, the tropopause is approximately 10 km above the ground while in the tropical region, it is approximately 15 km above the ground. Since the report of cloud occurrence that extended over 11 km is suggested to be a cumulonimbus cloud, the cloud could have sufficient positive and negative charges that could result in the production of lightning flash, as observed in this study.
The detected lightning flashes in Antarctica have been analyzed and compared with previous studies, where the statistics are tabulated in Table A6 and Table A7. Overall, the mean values of slow front duration, fast transition duration, rise time duration, zero crossing time, and pulse duration of both positive and negative return strokes are comparable with the return strokes in various geographical regions [21,35,36,37,38,39,40,41,42,43,44,45,46,47]. On the other hand, the estimated peak currents of CG flashes in Antarctica were relatively smaller than the peak currents measured in other geographical regions [48,49,50,51,52]. The calculation of the peak currents yields the average minimum and maximum values of 0.34 and 19.93 kA, respectively. Based on these findings, it is important to examine the parameters that have been measured since lightning flashes such as +CG are usually associated with large charge transfers that could potentially cause severe damage to various objects and systems. Therefore, the knowledge regarding temporal characteristics of +CG and −CG flashes is important, particularly in the field of lightning protection.
A study in Florida found that the peak currents of the first return strokes were relatively higher for lightning occurring over ocean than over land [53]. Based on two separate observations in western and eastern parts of Florida, it was found that stepped-leader duration was relatively shorter for lightning occurring over ocean than over land by 17% in the west and up to 39% in the east. The authors suggested that the cloud charge structure for some of the oceanic storms was different than storms over land. Moreover, an experiment proved that with higher salinity of water compared to moist soil, it resulted in a more efficient charge transfer to the surface that resulted in a larger peak current discharge and brighter optical flash [54].
If the findings in [53,54] are applied to the cloud structure occurred over Antarctica, we could hypothesize that lightning flashes could be detected more over the Southern Ocean than over the Antarctica continental areas. In fact, all the detected CG flashes in Antarctica have been located over the ocean and no flashes have been detected over continental areas. It can be suggested that, due to small magnitude of charges inside the clouds in Antarctica, the detected peak current is relatively small compared to other geographical regions. Moreover, due to the small magnitude of charges, it is possible to have a short-lived storm with a few flash counts. In addition, it is possible that some weak lightning flashes occurred within the same hour, but due to low intensity, our sensor did not pick up those flashes.
As the number of +CG flashes are quite high in Antarctica, with 33% from the total detected flashes, it can be suggested that the cloud charge structure over the Southern Ocean could be tilted [8,9] or inverted [5,6] dipole charge structure, similar to the thunderstorms in Japan and the Great Plains. The winter thunderstorms in Japan have prevalent +CG flashes, where more than 30% of detected flashes are +CG. Moreover, strong wind shear in the Antarctica Peninsula region might contribute to the configuration of the charge structure inside clouds. Furthermore, +CG flash occurrence is latitude-dependent [3]. As the latitude increases from Malaysia (1.6°) [3], China (29.0°) [4], Sweden (59.9°) [5], to Antarctica (this study at 62°), the percentage of +CG flashes increases from 0.8% to 33%.
5. Conclusions
In this paper, the temporal analysis of lightning electromagnetic field waveforms of CG flashes was successfully performed. The measurements were conducted in the Antarctica Peninsula. Most of the CG flashes were single-stroke with only 10% +GG and 5% −CG being multiple strokes. A total of 51 +CG and 103 −CG flashes were recorded by a magnetic direction finder sensor in King Sejong Station, King George Island. In total, 47 positive and 107 negative return strokes were located, ranging from 32 to 569 km. All CG flashes were detected to occur over the ocean. The return strokes characteristics include the observations of slow front, fast rising, rise time, and pulse duration, with geometric mean values of 3.2, 0.53, 3.21, 13.12, and 67.09 µs for +CG flashes and 3.9, 0.57, 3.72, 20.75, and 69.86 µs for −CG flashes, respectively. Additionally, the average peak currents of +CG and −CG flashes were 4.13 kA and 3.14 kA, respectively. The temporal characteristics of the return strokes of Antarctica storms are comparable to other geographical regions. The smaller peak currents might be due to small magnitude of Antarctica cloud charges when compared to other geographical regions.
Author Contributions
The study was completed with cooperation between all authors; S.A.M. as first author collected the data, analyzed the data, and wrote the manuscript; expeditions to KSJ in Antarctica and system installation were conducted from 2020 and on-going by M.R.A. in collaboration with P.S. from the Korea Polar Research Institute (KOPRI); M.R.A. gave the idea and checked the validation of measurements analysis; M.A., G.L. and V.C. contributed with knowledgeable discussions and suggestions; S.A.S.B. and N.Y. contributed to data interpretation and to the reviewing process. All authors have read and agreed to the published version of the manuscript.
Funding
This research was funded by the Yayasan Penyelidikan Antartika Sultan Mizan (YPASM)research grant (ZF-2019-001). The co-author Sang-Jong Park was supported by the research project PE22030 of KOPRI.
Acknowledgments
This research was funded by YPASM Grant (ZF-2019-001). The authors would like to thank Institut Perubahan Iklim (IPI), Universiti Kebangsaan Malaysia (UKM) and Universiti Teknikal Malaysia Melaka (UTeM) for their supports in this project. The travelling logistic was supported by Korea Polar Research Institute (KOPRI) throughresearch project of PE22030. The authors would also like to thank the World-Wide Lightning Location Network (WWLLN) (http://wwlln.net) accessed on 17 March 2021, a collaboration among over 50 universities and institutions, for providing the lightning location data used in this paper.
Conflicts of Interest
The authors declare no conflict of interest.
Appendix A

Table A1.
Comparison of +CG flash parameters for first, subsequent and all return strokes in Antarctica.
Table A1.
Comparison of +CG flash parameters for first, subsequent and all return strokes in Antarctica.
| Description | First Stroke | Subsequent Stroke | All | Description | First Stroke | Subsequent Stroke | All |
|---|---|---|---|---|---|---|---|
| (a) Slow front duration (µs) | (b) 10–90% Fast transition duration (µs) | ||||||
| Sample size, N | 47 | 6 | 53 | Sample size, N | 47 | 6 | 53 |
| Min | 0.61 | 1.22 | 0.61 | Min | 0.32 | 0.33 | 0.32 |
| Max | 9.81 | 3.41 | 9.81 | Max | 1.64 | 1.73 | 1.73 |
| AM | 3.83 | 2.49 | 3.67 | AM | 0.60 | 0.68 | 0.61 |
| GM | 3.34 | 2.31 | 3.20 | GM | 0.53 | 0.53 | 0.53 |
| S. D | 1.99 | 0.95 | 1.95 | S. D | 0.34 | 0.58 | 0.37 |
| (c) 10–90% rise time (µs) | (d) Zero crossing time (µs) | ||||||
| Sample size, N | 51 | 6 | 57 | Sample size, N | 51 | 6 | 57 |
| Min | 0.83 | 2.09 | 0.83 | Min | 4.81 | 5.73 | 4.81 |
| Max | 8.84 | 3.06 | 8.84 | Max | 37.91 | 13.35 | 37.91 |
| AM | 3.65 | 2.65 | 3.54 | AM | 14.94 | 10.85 | 14.51 |
| GM | 3.29 | 2.63 | 3.21 | GM | 13.47 | 10.47 | 13.12 |
| S. D | 1.68 | 0.34 | 1.62 | S. D | 6.88 | 2.75 | 6.67 |
| (e) Pulse duration (µs) | (f) Initial electric field peak normalized to 100 km (V/m) | ||||||
| Sample size, N | 51 | 6 | 57 | Sample size, N | 41 | 6 | 47 |
| Min | 30.03 | 32.93 | 30.03 | Min | 0.13 | 0.17 | 0.13 |
| Max | 128.80 | 90.93 | 128.80 | Max | 4.78 | 1.82 | 4.78 |
| AM | 72.95 | 57.31 | 71.31 | AM | 1.24 | 0.56 | 1.15 |
| GM | 68.91 | 53.48 | 67.09 | GM | 0.89 | 0.39 | 0.80 |
| S. D | 22.87 | 23.12 | 23.20 | S. D | 1.07 | 0.63 | 1.04 |
| (g) Peak current all return stroke (kA) (Imin / Imax) | |||||||
| First-stroke | Subsequent stroke | All | |||||
| Sample size, N | 41 | 6 | 47 | ||||
| Min | 0.54 | 0.34 | 0.69 | 0.44 | 0.54 | 0.34 | |
| Max | 19.93 | 12.59 | 7.58 | 4.79 | 19.93 | 12.59 | |
| AM | 5.15 | 3.26 | 2.35 | 1.48 | 4.79 | 3.03 | |
| GM | 3.71 | 2.34 | 1.64 | 1.04 | 3.34 | 2.11 | |
| S. D | 4.44 | 2.81 | 2.61 | 1.65 | 4.33 | 2.74 | |
Table A2.
Comparison of −CG flashes parameters for first, subsequent and all return strokes in Antarctica.
Table A2.
Comparison of −CG flashes parameters for first, subsequent and all return strokes in Antarctica.
| Description | First stroke | Subsequent Stroke | All | Description | First Stroke | Subsequent Stroke | All |
|---|---|---|---|---|---|---|---|
| (a) Slow front duration (µs) | (b) 10–90% Fast transition duration (µs) | ||||||
| Sample size, N | 29 | 3 | 32 | Sample size, N | 29 | 3 | 32 |
| Min | 2.08 | 2.65 | 2.08 | Min | 0.32 | 0.33 | 0.32 |
| Max | 8.48 | 8.97 | 8.97 | Max | 1.67 | 1.03 | 1.67 |
| AM | 4.02 | 5.53 | 4.16 | AM | 0.63 | 0.67 | 0.64 |
| GM | 3.81 | 4.91 | 3.90 | GM | 0.57 | 0.61 | 0.57 |
| S. D | 1.38 | 3.19 | 1.61 | S. D | 0.31 | 0.35 | 0.31 |
| (c) 10–90% rise time (µs) | (d) Zero crossing time (µs) | ||||||
| Sample size, N | 103 | 8 | 111 | Sample size, N | 103 | 8 | 111 |
| Min | 1.97 | 2.55 | 1.97 | Min | 8.07 | 11.13 | 8.07 |
| Max | 9.00 | 7.51 | 9 | Max | 40.73 | 23.07 | 40.73 |
| AM | 3.88 | 4.17 | 3.78 | AM | 22.45 | 16.45 | 22.02 |
| GM | 3.69 | 3.94 | 3.72 | GM | 21.18 | 15.89 | 20.75 |
| S. D | 1.29 | 1.58 | 1.31 | S. D | 7.78 | 4.66 | 7.74 |
| (e) Pulse duration (µs) | (f) Initial electric field peak normalized to 100 km (V/m) | ||||||
| Sample size, N | 103 | 8 | 111 | Sample size, N | 103 | 8 | 111 |
| Min | 33.72 | 35.94 | 33.72 | Min | 0.11 | 0.11 | 0.11 |
| Max | 121.70 | 119.70 | 121.70 | Max | 12.23 | 0.63 | 12.23 |
| AM | 72.13 | 68.96 | 71.89 | AM | 0.92 | 0.30 | 0.88 |
| GM | 70.20 | 65.64 | 69.86 | GM | 0.55 | 0.26 | 0.52 |
| S. D | 15.83 | 23.95 | 16.41 | S. D | 1.69 | 0.17 | 1.64 |
| (g) Peak current all return stroke (kA) (Imin / Imax) | |||||||
| First stroke | Subsequent stroke | All | |||||
| Sample size, N | 103 | 8 | 111 | ||||
| Min | 0.44 | 0.28 | 0.45 | 0.29 | 0.44 | 0.28 | |
| Max | 51.02 | 32.22 | 2.63 | 1.66 | 51.02 | 32.22 | |
| AM | 3.85 | 2.43 | 1.25 | 0.79 | 3.66 | 2.31 | |
| GM | 2.30 | 1.45 | 1.08 | 0.68 | 2.18 | 1.38 | |
| S. D | 7.07 | 4.47 | 0.73 | 0.46 | 6.85 | 4.33 | |
Table A3.
The distribution of +CG flashes with different number of strokes.
Table A3.
The distribution of +CG flashes with different number of strokes.
| Researcher | Location | Measurement Period | Sample Size, N | Number of Strokes in Flash | Average Multiplicity | |||
|---|---|---|---|---|---|---|---|---|
| Single- Stroke | Two Strokes | Three Strokes | Four Strokes | |||||
| This study (2020) | Antarctica Peninsula | January 2020 | 51 | 46 (90%) | 4 (8%) | 0 (0%) | 1 (2%) | 1.14 |
| [21] | Uppsala, Sweden | Summer 2014 | 51 | 45 (88%) | 4 (8%) | 1 (2%) | 1 (2%) | 1.2 |
| [22] | Uppsala, Sweden | Summer 2010 and 2011 | 107 | 67 (63%) | 30 (28%) | 7 (6%) | 3 (3%) | 1.5 |
| [23] | Munich, Germany | 1984 to 1993 | 44 | 33 (75%) | 8 (18%) | 2 (5%) | 1 (2%) | 1.3 |
| [24] | Florida, US | April–October and November–February 2007 to 2008 | 52 | 42 (81%) | 9 (17%) | 1 (1%) | - | 1.2 |
| [25] | Brazil, US, and Austria | February 2003 to September 2009 | 103 | 83 (81%) | 19 (18%) | 1 (1%) | - | 1.04 |
| [26] | US, Central Great Plains | 1995 to 1997 | 204 (+CG) 103 (−CG) | 195 (96%) 41 (40%) | 9 (4%) 62 (60%) | - | - | 1.13 3.14 |
| [27] | Munich, Germany | 1995 to 1997 | 32 | 28 (87.5%) | 4 (12.5%) | - | - | 1.13 |
Table A4.
The distribution of −CG flashes with different number of strokes.
Table A4.
The distribution of −CG flashes with different number of strokes.
| Researcher | Location | Sample Size, N | Average Multiplicity |
|---|---|---|---|
| This study −CG (2020) | Antarctica Peninsula | 5 | 1.11 |
| [25] | Brazil | 233 | 3.8 |
| [28] | Indonesia | 100 | 5.2 |
| [29] | Malaysia | 100 | 4 |
| [30] | Florida | 478 | 4.6 |
| [31] | Israel | 18611 | 1.4 |
Table A5.
Inter-stroke intervals comparison between previous studies.
Table A5.
Inter-stroke intervals comparison between previous studies.
| Researcher | Location | Measurement Period | Sample Size, N | Inter-Stroke Interval (ms) | |||
|---|---|---|---|---|---|---|---|
| Min | Max | AM | GM | ||||
| This study +CG (2020) | Antarctica Peninsula | January 2020 | 14 | 5.59 | 55.15 | 25.57 | 20.66 |
| This study −CG (2020) | Antarctica Peninsula | January 2020 | 8 | 10.4 | 681.6 | 134.58 | 51.72 |
| [21] +CG | Uppsala, Sweden | Summer 2014 | 9 | 25 | 124 | 71 | 60 |
| [22] +CG | Uppsala, Sweden | Summer 2010 and 2011 | 53 | 2.9 | 518 | 116 | 70 |
| [23] +CG | Florida, US | April–October and November–February 2007 to 2008 | 8 | 8.5 | 201 | 77 | 54 |
| [24] +CG | Brazil, US, and Austria | February 2003 to September 2009 | 21 | 14 | 406 | 143 | 94 |
| [25] +CG | US, Central Great Plains | July 2005 | 9 | - | - | 50 | 27 |
| [26] +CG | Munich, Germany | 1984 to 1993 | 16 | - | - | 120 | 101 |
| [27] | Munich, Germany | 1995 to 1997 | 4 | 51 | - | 102 | - |
| [32] +CG | Fukui, Japan | December 2995 to February 1996 November 1996 to January 1997 | 17 | - | - | 78 | - |
| [33] +CG | Uppsala, Sweden | Summer 1992 to 1993 | 29 | 6.8 | 290 | 92 | 64 |
Min: minimum, Max: maximum, AM: arithmetic mean and GM: geometric mean.
Table A6.
Comparison on return strokes parameters between previous studies for +CG flashes.
Table A6.
Comparison on return strokes parameters between previous studies for +CG flashes.
| Parameter | Researcher | Location | Measurement Period | Sample Size | Distance of Flash (km) | Min | Max | AM | GM |
|---|---|---|---|---|---|---|---|---|---|
| Slow front duration (µs) | This study 2020 | Antarctica | Summer January 2020 | 47 | 36–530 | 0.61 | 9.81 | 3.67 | 3.2 |
| [21] | Sweden | Summer 2014 | 60 | 6–150 | 0.65 | 18 | 8.5 | 7.8 | |
| [35] | Florida | Summer and winter 2007–2008 | 51 | 7.8–157 | 0.77 | 19 | 6.1 | 5.1 | |
| [36] | Denmark | Summer | 23 | - | 4 | 16 | 8.4 | - | |
| [37] | Sweden | Summer of 1979–1981 | 63 | 100–300 | 3 | 23 | 10 | - | |
| [38] | Sweden | 1986 | 20 | 25–100 | 3 | 11 | 8.2 | - | |
| [39] | Japan | - | - | 15–50 | - | - | 19.3 | - | |
| 10 to 90% fast rising duration (µs) | This study | Antarctica | January 2020 | 47 | 36–530 | 0.32 | 1.73 | 0.61 | 0.53 |
| [21] | Sweden | Summer 2014 | 60 | 6–150 | 0.27 | 5.1 | 1.6 | 1.3 | |
| [35] | Florida | Summer and winter 2007–2008 | 51 | 7.8–157 | 0.28 | 4.6 | 1.2 | 1.0 | |
| [36] | Denmark | Summer | 23 | - | 1 | 6 | 2.5 | - | |
| [38] | Sweden | 20 | 25–100 | 4 | 8 | 5.6 | - | ||
| 10–90% rise time (µs) | This study | Antarctica | January 2020 | 57 | 36–530 | 0.83 | 8.84 | 3.54 | 3.21 |
| [21] | Sweden | Summer 2014 | 60 | 6–150 | 0.85 | 13 | 5.9 | 5.2 | |
| [35] | Florida | Summer and winter 2007–2008 | 51 | 7.8–157 | 2.3 | 19 | 7.9 | 7.1 | |
| [40] | Japan | Summer | 32 | <150 | 6 | 22 | 13.2 | - | |
| Winter | 123 | 8 | 44 | 21.2 | - | ||||
| [39] | Japan | Winter | 15–50 | - | - | 22.3 | - | ||
| [36] | Sweden | 20 | 25–100 | 4 | 12 | 8.9 | - | ||
| [37] | Sweden | 64 52 | 100–300 | 5 5 | 25 25 | 13 12 | - - | ||
| [41] | USA | 15 | - | 4.5 | 24.3 | 11.5 | - | ||
| Zero crossing time (µs) | This study | Antarctica | January 2020 | 57 | 36–530 | 4.81 | 37.91 | 14.51 | 13.12 |
| [21] | Sweden | Summer 2014 | 36 | 6–150 | 2.7 | 100 | 30 | 25 | |
| [35] | Florida | Summer and winter 2007–2008 | 33 | 7.8–157 | 14 | 452 | 77 | 49 | |
| [40] | Japan | Summer | 34 | <150 | 80 | 280 | 151 | - | |
| Winter | 89 | 30 | 160 | 93 | - | ||||
| Initial electric field peak normalized to 100 km (V/m) | This study | Antarctica | January 2020 | 47 | 36–530 | 0.13 | 4.78 | 1.15 | 0.8 |
| [21] | Sweden | Summer 2014 | 55 | 6–150 | 1.2 | 51 | 14 | 12 | |
| [35] | Florida | Summer and winter 2007–2008 | 24 | 7.8–157 | 3.2 | 26 | 11 | 9.6 | |
| [36] | Denmark | Summer | 22 | - | 10 | 42 | 22 | - | |
| Peak current (kA) | This study | Antarctica | January 2020 | 47 | 38–530 | 0.34 | 19.93 | 4.13 | 2.96 |
| [48] | Malaysia | 2013–2015 | 9159 | ≤70 | 10 | 86.7 | - | 14.2 | |
| [49] | Japan | Winter 2014 | 33 | ≤20 | 10 | 208 | 62.45 | 40.34 | |
| [21] | Sweden | Summer 2014 | 52 | 6–150 | 8.8 | 236 | 56 | 42 |
Table A7.
Comparison on return strokes parameters between previous studies for −CG flashes.
Table A7.
Comparison on return strokes parameters between previous studies for −CG flashes.
| Parameter | Researcher | Location | Measurement Period | Sample Size | Distance of Flash (km) | Min | Max | AM | GM |
|---|---|---|---|---|---|---|---|---|---|
| Slow front duration (µs) | This study | Antarctica | January 2020 | 32 | 32–568 | 2.08 | 8.97 | 4.16 | 3.9 |
| [44] | Florida | 2007–2008 | 4 | 0.5 (near) 50 (far) | 2.7 2.3 | 10.2 9.7 | 6 5.6 | 5.4 5.0 | |
| [45] | Florida | 1979 | 105 | >50 | - | - | 2.9 | - | |
| [37] | Sweden | 1979–1981 | 82 | >100 | - | - | 5.0 | - | |
| [46] | Florida | 1975 and 1976 | 62 | 10–30 | - | - | 4.0 | - | |
| 90 | - | - | 4.1 | - | |||||
| 10–90% fast rising duration (µs) | This study | Antarctica | January 2020 | 32 | 32–568 | 0.32 | 1.67 | 0.64 | 0.57 |
| [44] | Florida | 2007–2008 | 4 | 0.5 (near) 50 (far) | 0.4 0.7 | 1.8 1.5 | 0.9 1.1 | 0.8 1.0 | |
| [45] | Florida | 1979 | 105 | >50 | - | - | 0.97 | - | |
| [46] | Florida | 1975 and 1976 | 38 | 10–3 | - | - | 0.2 | - | |
| [47] | Florida | 125 | 10–50 | - | - | 0.9 | - | ||
| 10–90% rise time (µs) | This study | Antarctica | January 2020 | 111 | 32–568 | 1.97 | 9.0 | 3.78 | 3.72 |
| [44] | Florida | 2007–2008 | 4 | 0.5 (near) 50 (far) | 2.8 2.4 | 8.0 7.0 | 4.9 4.0 | 4.0 3.6 | |
| [45] | Florida | 1979 | 105 | >5 | - | - | 4.4 | - | |
| [37] | Sweden | 1979–1981 | 140 | >100 | - | - | 7.0 | - | |
| [42] | Florida | 51 29 | 50–200 | - - | - - | 2.4 2.7 | - - | ||
| Zero crossing time (µs) | This study | Antarctica | January 2020 | 111 | 32–568 | 8.07 | 40.7 | 22.0 | 20.7 |
| [37] | Sweden Sri Lanka | 102 91 | 100–200 | - - | - - | 49 89 | - - | ||
| [42] | Florida | 1974–1976 | 46 | 50–200 | - | - | 54 | - | |
| Initial electric field peak normalized to 100 km (V/m) | This study | Antarctica | January 2020 | 111 | 32–568 | 0.11 | 12.2 | 0.88 | 0.52 |
| [43] | 63 | - | - | 39 | - | ||||
| Peak current (kA) | This study | Antarctica | January 2020 | 111 | 38–530 | 0.28 | 51.0 | 3.14 | 1.88 |
| [48] | Malaysia | 2013–2015 | 563,123 | ≤70 | 139.6 | - | 13.6 | ||
| [50] | China | 5425 | 13–466 | 4.8 | 196.8 | 24.9 | 19.7 | ||
| [51] | Brazil | 29 | - | 2 | - | - | 45 | ||
| [52] | Switzerland | 101 | - | - | - | - | 30 |
References
- Holzworth, R.H.; Brundell, J.B.; McCarthy, M.P.; Jacobson, A.R.; Rodger, C.J.; Anderson, T.S. Lightning in the Arctic. Geophys. Res. Lett. 2021, 48, e2020GL091366. [Google Scholar] [CrossRef]
- Yusop, N.; Ahmad, M.R.; Abdullah, M.; Mohd Esa, M.R.; Mohammad, S.A.; Suparta, W.; Gulisano, A.M.; Cooray, V. Seasonal Analysis of Cloud-To-Ground Lightning Flash Activity in the Western Antarctica. Atmosphere 2019, 10, 744. [Google Scholar] [CrossRef]
- Ahmad, M.R.; Esa, M.R.M.; Cooray, V.; Baharudin, Z.A.; Hettiarachchi, P. Latitude dependence of narrow bipolar pulse emissions. J. Atmos. Sol. Terr. Phys. 2015, 128, 40–45. [Google Scholar] [CrossRef]
- Chai, J.; Sun, J. Characteristics of cloud-to-ground lightning activity over Hubei province, China. Weather Clim. Extrem. 2019, 24, 100207. [Google Scholar] [CrossRef]
- Rust, W.D.; MacGorman, D.R.; Bruning, E.C.; Weiss, S.A.; Krehbiel, P.R.; Thomas, R.J.; Rison, W.; Hamlin, T.; Harlin, J. Inverted-polarity electrical structures in thunderstorms in the Severe Thunderstorm Electrification and Precipitation Study (STEPS). Atmos. Res. 2005, 76, 247–271. [Google Scholar] [CrossRef]
- Carey, L.D.; Rutledge, S.A.; Petersen, W.A. The relationship between severe storm reports and cloud-to-ground lightning polarity in the contiguous United States from 1989 to 1998. Mon. Weather Rev. 2003, 131, 1211–1228. [Google Scholar] [CrossRef]
- Wiens, K.C.; Rutledge, S.A.; Tessendorf, S.A. The 29 June 2000 supercell observed during STEPS. Part II: Lightning and charge structure. J. Atmos. Sci. 2005, 62, 4151–4177. [Google Scholar] [CrossRef]
- Takeuti, T.; Nakano, M.; Yamamoto, Y. Remarkable characteristics of cloud-to-ground discharges observed in winter thunderstorms in Hokuriku area, Japan. J. Meteorol. Soc. Jpn. 1976, 54, 436–440. [Google Scholar] [CrossRef][Green Version]
- Brook, M.; Nakano, M.; Krehbiel, P.; Takeuti, T. The electrical structure of the Hokuriku winter thunderstorms. J. Geophys. Res. Ocean. 1982, 87, 1207–1215. [Google Scholar] [CrossRef]
- Suzuki, T.; Morita, T. Long term observation of winter lightning on Japan Sea coast. J. Atmos. Electr. 1992, 12, 53–56. [Google Scholar] [CrossRef]
- Adhikari, L.; Wang, Z.; Deng, M. Seasonal variations of Antarctic clouds observed by CloudSat and CALIPSO satellites. J. Geophys. Res. Atmos. 2012, 117, D04202. [Google Scholar] [CrossRef]
- Zhang, H.; Lu, G.; Qie, X.; Jiang, R.; Fan, Y.; Tian, Y.; Sun, Z.; Liu, M.; Wang, Z.; Liu, D.; et al. Locating narrow bipolar events with single-station measurement of low-frequency magnetic fields. J. Atmos. Sol. Terr. Phys. 2016, 143, 88–101. [Google Scholar] [CrossRef]
- Smith, D.A.; Shao, X.M.; Holden, D.N.; Rhodes, C.T.; Brook, M.; Krehbiel, P.R.; Stanley, M.; Rison, W.; Thomas, R.J. A distinct class of isolated intracloud lightning discharges and their associated radio emissions. J. Geophys. Res. Atmos. 1999, 104, 4189–4212. [Google Scholar] [CrossRef]
- Nag, A.; Rakov, V.A.; Tsalikis, D.; Cramer, J.A. On phenomenology of compact intracloud lightning discharges. J. Geophys. Res. Atmos. 2010, 115, D14. [Google Scholar] [CrossRef]
- Galvan, A.; Fernando, M. Operative Characteristics of a Parallel-Plate Antenna to Measure Vertical Electric Fields from Lightning Flashes. 2000. Available online: https://www.semanticscholar.org/paper/Operative-characteristics-of-a-parallel-plate-to-Galv%C3%A1n-Fernando/8da8652ec3cb6c56f44c4f546311be303d299f1d (accessed on 1 February 2022).
- Mohammad, S.A.; Ahmad, M.R.; Abdullah, M.; Baharin, S.A.S.; Park, S.J.; Cooray, V. Azimuth and elevation factors correction for single station lightning electromagnetic field sensor. Geogr. Malays. J. Soc. Space 2021, 17, 378–392. [Google Scholar] [CrossRef]
- Sabri, M.H.M.; Ahmad, M.R.; Esa, M.R.M.; Periannan, D.; Lu, G.; Zhang, H.; Cooray, V.; Williams, E.; Aziz, M.Z.A.A.; Abdul-Malek, Z.; et al. Initial electric field changes of lightning flashes in tropical thunderstorms and their relationship to the lightning initiation mechanism. Atmos. Res. 2019, 226, 138–151. [Google Scholar] [CrossRef]
- Cooray, V. An Introduction to Lightning; Springer: Dordrecht, The Netherlands; Heidelberg, Germany; New York, NY, USA; London, UK, 2015; pp. 152–153. [Google Scholar]
- Rachidi, F.; Bermudez, J.L.; Rubinstein, M.; Rakov, V.A. On the estimation of lightning peak currents from measured fields using lightning location systems. J. Electrost. 2004, 60, 121–129. [Google Scholar] [CrossRef]
- Rakov, V.A.; Uman, M.A. Long continuing current in negative lightning ground flashes. J. Geophys. Res. Atmos. 1990, 95, 5455–5470. [Google Scholar] [CrossRef]
- Johari, D.; Cooray, V.; Rahman, M.; Hettiarachchi, P.; Ismail, M.M. Features of the first and the subsequent return strokes in positive ground flashes based on electric field measurements. Electr. Power Syst. Res. 2017, 150, 55–62. [Google Scholar] [CrossRef]
- Baharudin, Z.A.; Cooray, V.; Rahman, M.; Hettiarachchi, P.; Ahmad, N.A. On the characteristics of positive lightning ground flashes in Sweden. J. Atmos. Sol. Terr. Phys. 2016, 138, 106–111. [Google Scholar] [CrossRef]
- Nag, A.; Rakov, V.A. Positive lightning: An overview, new observations, and inferences. J. Geophys. Res. Atmos. 2012, 117, D08109. [Google Scholar] [CrossRef]
- Saba, M.M.; Schulz, W.; Warner, T.A.; Campos, L.Z.; Schumann, C.; Krider, E.P.; Cummins, K.L.; Orville, R.E. High-speed video observations of positive lightning flashes to ground. J. Geophys. Res. Atmos. 2010, 115, D24201. [Google Scholar] [CrossRef]
- Fleenor, S.A.; Biagi, C.J.; Cummins, K.L.; Krider, E.P.; Shao, X.M. Characteristics of cloud-to-ground lightning in warm-season thunderstorms in the Central Great Plains. Atmos. Res. 2009, 91, 333–352. [Google Scholar] [CrossRef]
- Heidler, F.; Hopf, C. Measurement results of the electric fields in cloud-to-ground lightning in nearby Munich, Germany. IEEE Trans. Electromagn. Compat. 1998, 40, 436–443. [Google Scholar] [CrossRef]
- Heidler, F.; Drumm, F.; Hopf, C. Electric fields of positive earth flashes in near thunderstorms. In Proceedings of the 24th International Conference on Lightning Protection, Birminghan, UK, 14–18 September 1998; pp. 42–47. [Google Scholar]
- Hazmi, A.; Emeraldi, P.; Hamid, M.I.; Takagi, N. Some characteristics of multiple stroke negative cloud to ground lightning flashes in Padang. Int. J. Electr. Eng. Inform. 2016, 8, 438–450. [Google Scholar] [CrossRef]
- Baharudin, Z.A.; Ahmad, N.A.; Mäkelä, J.S.; Fernando, M.; Cooray, V. Negative cloud-to-ground lightning flashes in Malaysia. J. Atmos. Sol. Terr. Phys. 2014, 108, 61–67. [Google Scholar] [CrossRef]
- Zhu, Y.; Rakov, V.A.; Mallick, S.; Tran, M.D. Characterization of negative cloud-to-ground lightning in Florida. J. Atmos. Sol. Terr. Phys. 2015, 136, 8–15. [Google Scholar] [CrossRef]
- Yair, Y.; Shalev, S.; Erlich, Z.; Agrachov, A.; Katz, E.; Saaroni, H.; Price, C.; Ziv, B. Lightning flash multiplicity in eastern Mediterranean thunderstorms. Nat. Hazards Earth Syst. Sci. 2014, 14, 165–173. [Google Scholar] [CrossRef]
- Ishii, M.; Shimizu, K.; Hojo, J.; Shinjo, K. Termination of Multiple-Stroke Flashes Observed by Electromagnetic Field. In Proceedings of the 24th International Conference on Lightning Protection, Birminghan, UK, 14–18 September 1998. [Google Scholar]
- Cooray, V.; Pérez, H. Some features of lightning flashes observed in Sweden. J. Geophys. Res. Atmos. 1994, 99, 10683–10688. [Google Scholar] [CrossRef]
- Nicolas, J.P.; Bromwich, D.H. Climate of West Antarctica and influence of marine air intrusions. J. Clim. 2011, 24, 49–67. [Google Scholar] [CrossRef]
- Nag, A.; Rakov, V.A. Parameters of electric field waveforms produced by positive lightning return strokes. IEEE Trans. Electromagn. Compat. 2014, 56, 932–939. [Google Scholar] [CrossRef]
- Cooray, V.; Fernando, M.; Gomes, C.; Sorensen, T.; Scuka, V.; Pedersen, A. The fine structure of positive return stroke radiation fields: A collaborative study between researchers from Sweden and Denmark. In Proceedings of the 24th International Conference on Lightning Protection, Birminghan, UK, 14–18 September 1998; pp. 78–82. [Google Scholar]
- Cooray, V.; Lundquist, S. On the characteristics of some radiation fields from lightning and their possible origin in positive ground flashes. J. Geophys. Res. Ocean. 1982, 87, 11203–11214. [Google Scholar] [CrossRef]
- Cooray, V. A novel method to identify the radiation fields produced by positive return strokes and their submicrosecond structure. J. Geophys. Res. Atmos. 1986, 91, 7907–7911. [Google Scholar] [CrossRef]
- Hojo, J.; Ishii, M.; Kawamura, T.; Suzuki, F.; Funayama, R. The fine structure in the field change produced by positive ground strokes. J. Geophys. Res. Atmos. 1985, 90, 6139–6143. [Google Scholar] [CrossRef]
- Hojo, J.; Ishii, M.; Kawamura, T.; Suzuki, F.; Komuro, H.; Shiogama, M. Seasonal variation of cloud-to-ground lightning flash characteristics in the coastal area of the Sea of Japan. J. Geophys. Res. Atmos. 1989, 94, 13207–13212. [Google Scholar] [CrossRef]
- Rust, W.D.; MacGorman, D.R.; Arnold, R.T. Positive cloud-to-ground lightning flashes in severe storms. Geophys. Res. Lett. 1981, 8, 791–794. [Google Scholar] [CrossRef]
- Lin, Y.T.; Uman, M.A.; Tiller, J.A.; Brantley, R.D.; Beasley, W.H.; Krider, E.P.; Weidman, C.D. Characterization of lightning return stroke electric and magnetic fields from simultaneous two-station measurements. J. Geophys. Res. Ocean. 1979, 84, 6307–6314. [Google Scholar] [CrossRef]
- Krider, E.P.; Leteinturier, C.; Willett, J.C. Submicrosecond fields radiated during the onset of first return strokes in cloud-to-ground lightning. J. Geophys. Res. Atmos. 1996, 101, 1589–1597. [Google Scholar] [CrossRef]
- Nag, A.; Tsalikis, D.; Rakov, V.A.; Howard, J.; Biagi, C.J.; Hill, D.; Uman, M.A.; Jordan, D.M. Fine structure of electric field waveforms recorded at near and far distances from the lightning channel. In Proceedings of the 2010 Asia-Pacific International Symposium on Electromagnetic Compatibility, Beijing, China, 12–16 April 2010; pp. 1231–1234. [Google Scholar]
- Master, M.J.; Uman, M.A.; Beasley, W.; Darveniza, M. Lightning induced voltages on power lines: Experiment. IEEE Trans. Power Appar. Syst. 1984, 9, 2519–2529. [Google Scholar] [CrossRef]
- Weidman, C.D.; Krider, E.P. The fine structure of lightning return stroke wave forms. J. Geophys. Res. Ocean. 1978, 83, 6239–6247. [Google Scholar] [CrossRef]
- Weidman, C.D. The Submicrosecond Structure of Lightning Radiation Fields. Ph.D. Thesis, The University of Arizona, Tucson, AZ, USA, 1982. [Google Scholar]
- Johari, D.; Amir, M.F.; Hashim, N.; Baharom, R.; Haris, F.A. Positive Cloud-to-Ground Lightning Observed in Shah Alam, Malaysia based on SAFIR 3000 Lightning Location System. In Proceedings of the 2021 IEEE International Conference in Power Engineering Application (ICPEA), Shah Alam, Malaysia, 8–9 March 2021; pp. 178–182. [Google Scholar]
- Wang, D.; Zheng, D.; Wu, T.; Takagi, N. Winter Positive Cloud-to-Ground Lightning Flashes Observed by LMA in Japan. IEEJ Trans. Electr. Electron. Eng. 2021, 16, 402–411. [Google Scholar] [CrossRef]
- Li, J.; Cai, L.; Hu, Q.; Zhou, M.; Li, Q.; Wang, J. Electric Field Parameters of Natural Negative Cloud-to-Ground Lightning in China. IEEE Trans. Electromagn. Compat. 2021, 63, 2007–2014. [Google Scholar] [CrossRef]
- Pinto, O., Jr.; Pinto, I.R.; Saba, M.M.; Solorzano, N.N.; Guedes, D. Return stroke peak current observations of negative natural and triggered lightning in Brazil. Atmos. Res. 2005, 76, 493–502. [Google Scholar] [CrossRef]
- Berger, K. Parameters of lightning flashes. Electra 1975, 41, 23–37. [Google Scholar]
- Nag, A.; Cummins, K.L. Negative first stroke leader characteristics in cloud-to-ground lightning over land and ocean. Geophys. Res. Lett. 2017, 44, 1973–1980. [Google Scholar] [CrossRef]
- Asfur, M.; Price, C.; Silverman, J.; Wishkerman, A. Why is lightning more intense over the oceans? J. Atmos. Sol. Terr. Phys. 2020, 202, 105259. [Google Scholar] [CrossRef]


Publisher’s Note: MDPI stays neutral with regard to jurisdictional claims in published maps and institutional affiliations. |
© 2022 by the authors. Licensee MDPI, Basel, Switzerland. This article is an open access article distributed under the terms and conditions of the Creative Commons Attribution (CC BY) license (https://creativecommons.org/licenses/by/4.0/).