Article

Ozone Monitoring in the Baikal Region (East Siberia): Spatiotemporal Variability under the Influence of Air Pollutants and Site Conditions

Limnological Institute, Siberian Branch of the Russian Academy of Sciences (RAS), 664033 Irkutsk, Russia
*
Author to whom correspondence should be addressed.
Atmosphere 2022, 13(4), 519; https://doi.org/10.3390/atmos13040519
Submission received: 31 January 2022 / Revised: 17 March 2022 / Accepted: 21 March 2022 / Published: 24 March 2022
(This article belongs to the Special Issue Ozone Pollution in East Asia: Factors and Sources)

Abstract

:
This article analyses the results of year-round automatic ozone monitoring in seven cities of the Baikal region (southeastern Siberia). We reveal that significant differences in the spatiotemporal variability of the average daily ozone concentrations depend on different anthropogenic loads. In large cities with heavy industry, which are located in the Angara River valley, the ozone concentrations were minimal and changed little during the year: less than 5 µg/m3 in the Angarsk city and 20–30 µg/m3 in the Irkutsk city. In the settlements of a less polluted region, the Selenga River valley, the ozone concentrations were significantly higher, and the annual ozone variability was typical of East Siberia: the maximum in spring (60 to 70 μg/m3) and the minimum in autumn and winter (10 to 30 μg/m3). The maximum ozone concentrations were observed in rural conditions (Listvyanka station), up to 80–100 μg/m3 during the spring maximum. Nitrogen oxides had the main influence on ozone depletion in the surface atmosphere of the cities, especially in winter, the season of maximum burning of fossil fuels (negative correlation can reach −0.9). In cities with heavy industry, the effect of NOx on ozone was weaker. Perhaps other anthropogenic impurities can also affect ozone suppression in these cities, which have not yet been studied.

1. Introduction

In recent decades, spatiotemporal dynamics of concentrations of tropospheric, especially ground-level ozone, have been attracting increasing interest. Ozone is the strongest oxidizing agent, elevated concentrations of which (over 40–60 ppbv) can cause direct harmful effects on human health and terrestrial vegetation, including crop yields [1,2]. Moreover, tropospheric ozone is one of the strongest greenhouse gases and, hence, its growth can contribute to global warming. Tropospheric and ground-level ozone participates in many atmospheric chemical reactions, including anthropogenic and natural air pollutants [3,4,5].
The ozone concentrations in the ground layer of the atmosphere vary greatly in space and time, both daily and seasonally. This may result from photochemical reactions involving sunlight and precursor gases such as nitrogen oxides (NOx), volatile organic compounds, methane, and carbon monoxide [6]. These precursors can be both of natural origin (wildfires, biogenic hydrocarbon emissions and biogenic NOx released from soils) and of anthropogenic origin (combustion of fossil fuels and biofuels as well as emissions from various production processes). The variability of ozone concentrations near the ground surface is especially great where it easily interacts with various surfaces and vegetation.
According to some estimates [7,8], from the pre-industrial revolution to the present time, average concentrations of tropospheric ozone have increased from 10–15 ppbv to 40–60 ppbv. An increase in the emissions of anthropogenic pollutants (carbon monoxides, nitrogen oxides and hydrocarbons) and their involvement in photochemical reactions with the formation of ozone are considered the sources of this growth. However, numerous data indicating the opposite ozone-destroying effect of air pollution (particularly NO) have been also obtained in recent decades [9,10,11]. In this regard, for a better understanding of the spatiotemporal dynamics of ground-level ozone, as well as its chemical transformations, it is important to introduce modern high-resolution (possibly automatic) methods for monitoring ozone and air pollutants that affect it in areas with different degrees of anthropogenic impact.
In particular, automatic monitoring of ozone in the Baikal region was previously carried out at three permanent monitoring stations characterizing areas with different degrees of air pollution: Irkutsk—urban conditions (constant anthropogenic impact), Listvyanka—rural conditions (periodic impact of regional sources) and Mondy—remote mountain station (2000 m above sea level) representing background conditions (almost complete absence of anthropogenic impact) [12,13,14,15]. The most prolonged series of automatic observations of ozone (over 15 years) was obtained from the alpine background station, Mondy, using an automatic optical (absorption UV spectrometry) method. The obtained results indicated that during all 15 years, its concentrations in background alpine areas (Mondy) were the most stable compared to other areas and were always higher than in urban and rural areas. The stability of ozone concentrations in background areas was violated only during wildfires, leading to the release of large amounts of CO, which caused sharp increases in the ozone concentrations. Its lowest concentrations were observed in urban conditions, in Irkutsk [16].
In recent years (since 2014–2015), the state system of automatic monitoring of air pollution, including ozone has been developing in the largest cities of the south of Siberia. More than 20 automatic monitoring stations have been installed in the most polluted cities of the region, which conduct continuous year-round measurements of the main pollutants with a 20-min time resolution. The data on the average daily concentrations of pollutants at these stations are open access on the website of The Russian Federal Service for Hydrometeorology and Environmental Monitoring (Roshydromet), Moscow [17]. This allows us to make broader comparisons of the spatiotemporal dynamics of ozone in the studied region and its relationship with other air pollutants and meteorological factors.
This article presents for the first time such analysis for the Baikal region (Figure 1), the southern part of which experiences anthropogenic impact due to surrounding industrial centres. We use the 2021 data from the maximum available automatic stations that are in the public domain.

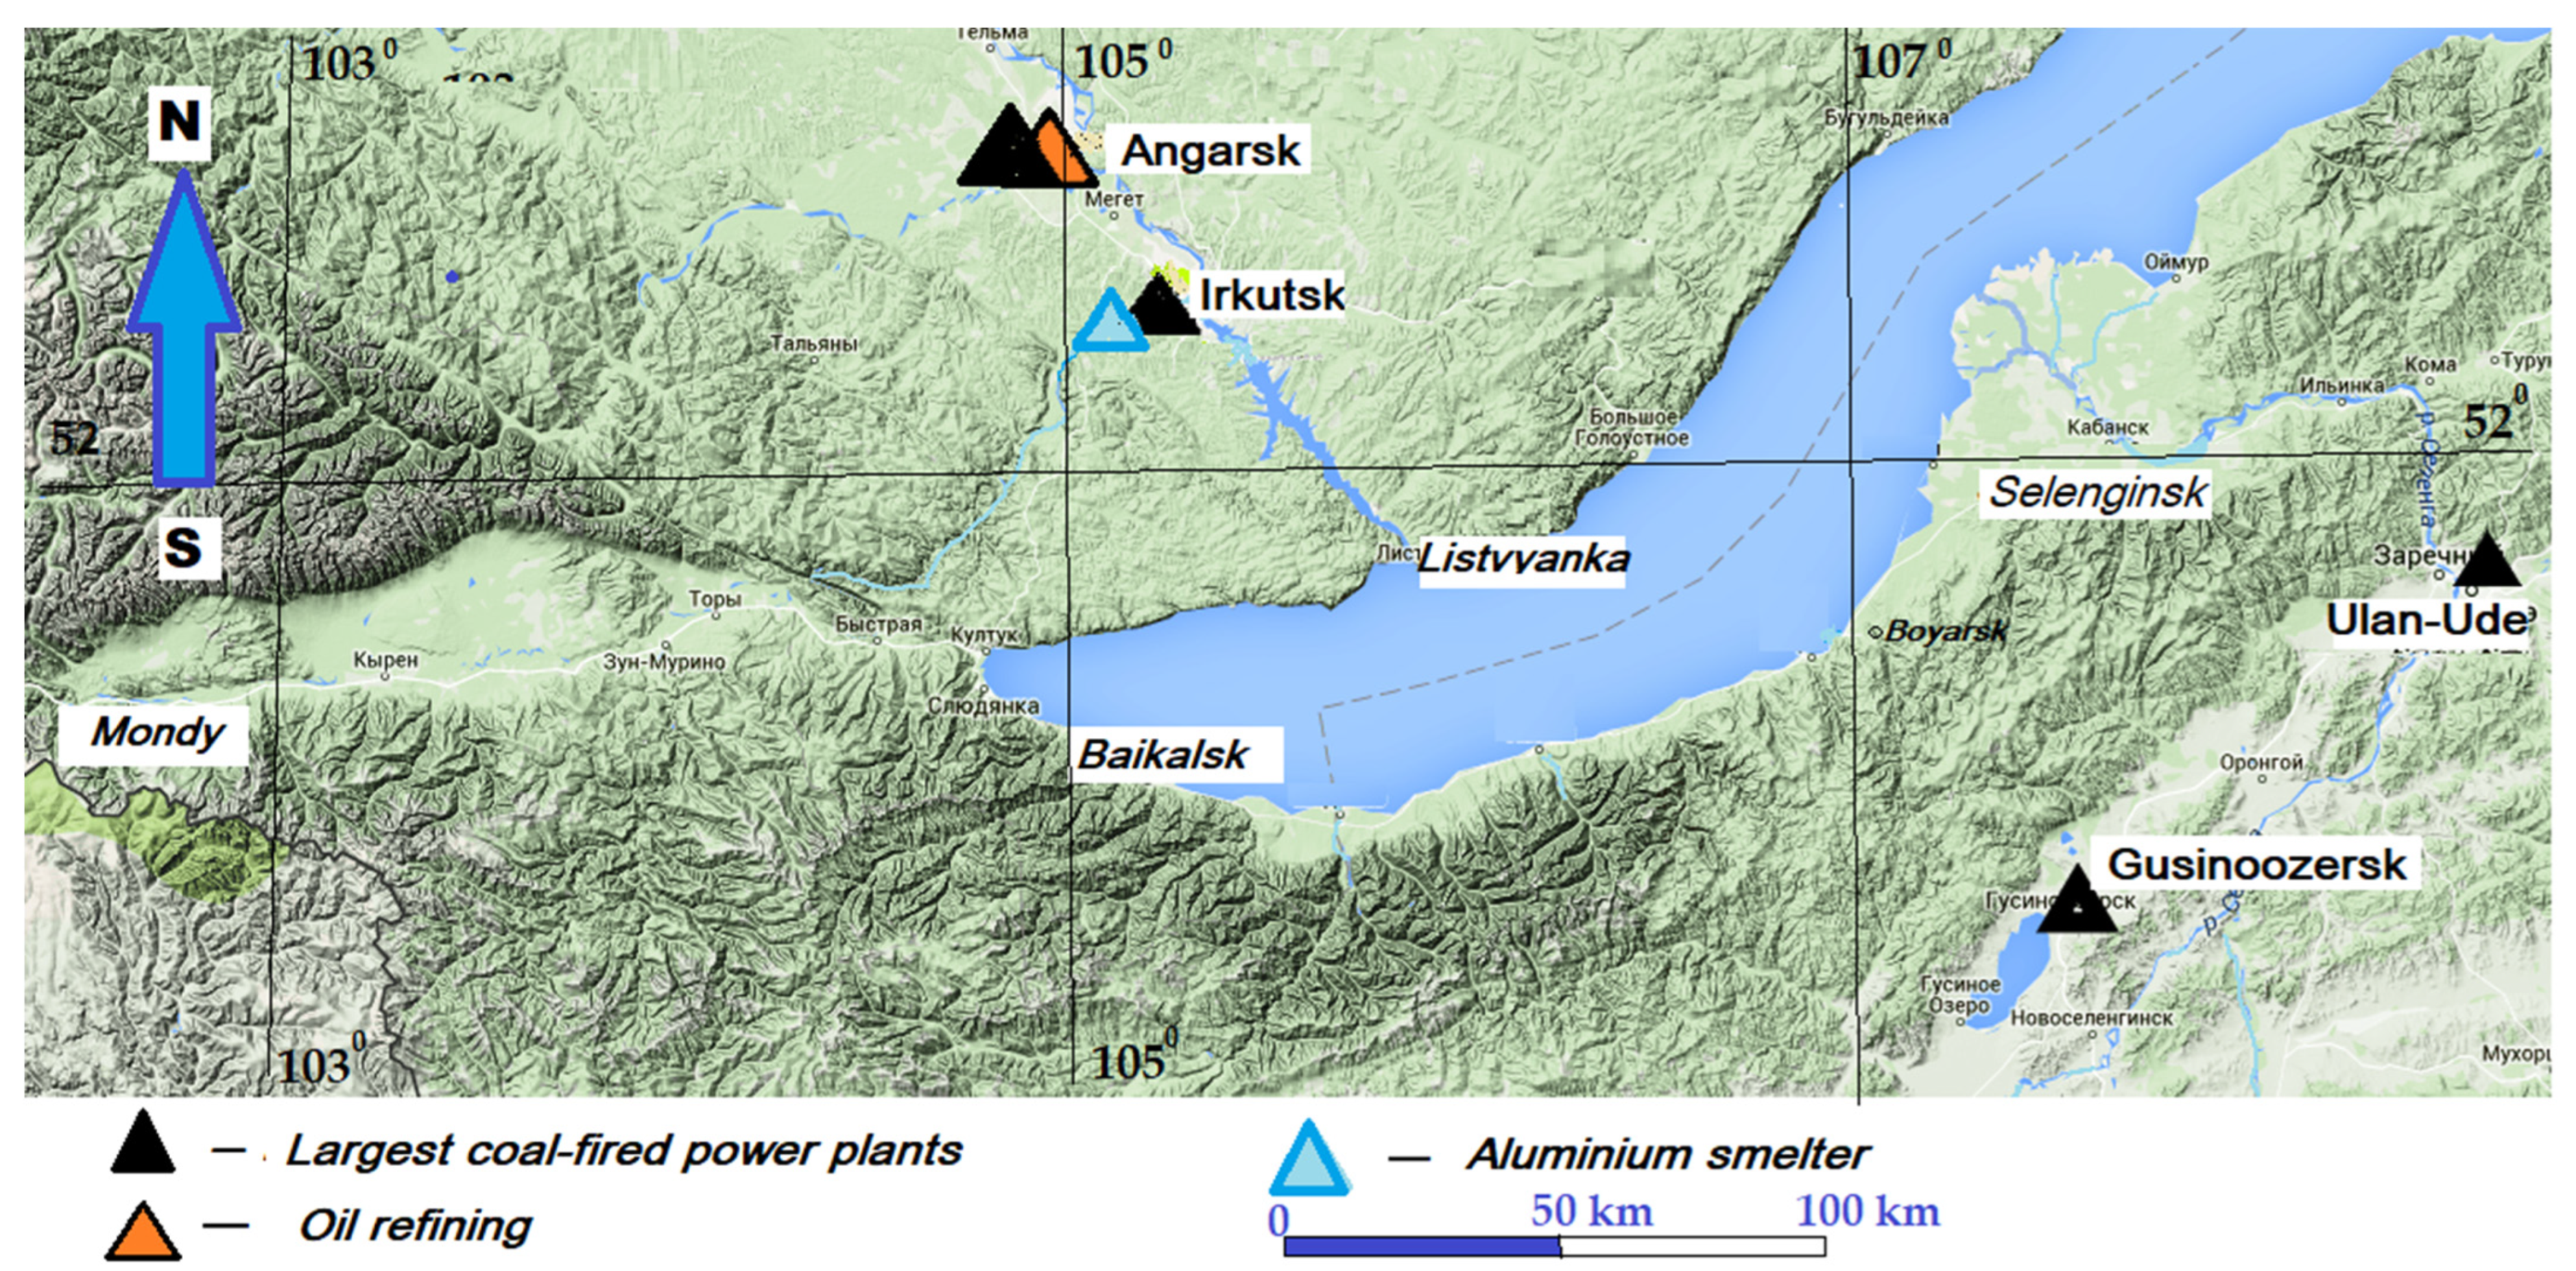
2. Monitoring Sites and Methods

In terms of the impact of pollution on the dynamics of ozone in the study area, two industrial sites are of the greatest interest: the Irkutsk–Angarsk site in the valley of the Angara River flowing from Lake Baikal and the Selenga River site flowing into Lake Baikal from the Buryatia side. Figure 1 shows the location of the main source cities of air pollution and the monitoring stations.
The state network of automatic monitoring stations is concentrated in the following large cities of the region: Angarsk—two stations, Irkutsk—five stations, Ulan-Ude—three stations, and one station each in the smaller towns of Baikalsk, Selenginsk and Gusinoosersk. Due to the location of the urban monitoring stations in the ground atmospheric layer (about 3–5 m depending on shelter structure), they are not only affected by the large industrial sources of air pollution (coal-fired thermal power stations and plants) but also experience short-term effects of various low-altitude and small sources, especially vehicles. Therefore, concentrations of pollutants can be very variable even within one city and vertically. The data on the average daily concentrations of the studied pollutants at urban automatic monitoring stations were taken from the Roshydromet website that is open access [17]. For measuring ozone concentrations at these sites, the automatic ozone analysers “O342e” (Environnement SA, Poissy, France, http://www.environnement-sa.com, accessed on 24 March 2022), were used. The concentration range was from 0 to 2.0 mg/m3, relative accuracy—±25.
Unlike the stations of the state network (urban), the Listvyanka station, supervised by the Limnological Institute SB RAS, Irkutsk, Russia (www.lin.irk.ru, accessed on 19 March 2022), has a special location. It is situated outside the settlement on the top of the coastal hill 200 m high above the lake level. Therefore, local low-altitude anthropogenic sources, in particular, vehicles, do not affect it, but it is subject to the periodic influence of regional transport of high-altitude plumes of emissions from large coal-fired thermal power plants, primarily from Irkutsk [18]. To measure ozone at this station, an F-105 optical ozone analyser (OPTEK, Saint Petersburg, Russia) was used. The division value of the analyser was 1 μg/m3, and the relative error of readings was 10%. The time resolution of the records was 5 min. In addition to the ozone measurements, other pollutants transported with plumes from thermal power plants are analysed at this station automatically, in particular, NOx (P-310, OPTEK, Saint Petersburg, Russia), which allows us to observe their effect on the ozone concentrations in real-time. The standard meteorological parameters were also measured automatically by ultrasonic meteorological station “Meteo-2M” designed by the Institute of Atmospheric and Ocean Optics (Tomsk, Russia). Meteorological parameters for the study period (2021) at the Listvyanka station are shown in Table 1. The dry season from February to April with very low precipitation amount and low humidity was of special interest as good conditions for the photogeneration of ozone having the maximum concentrations in March and April.

3. Results

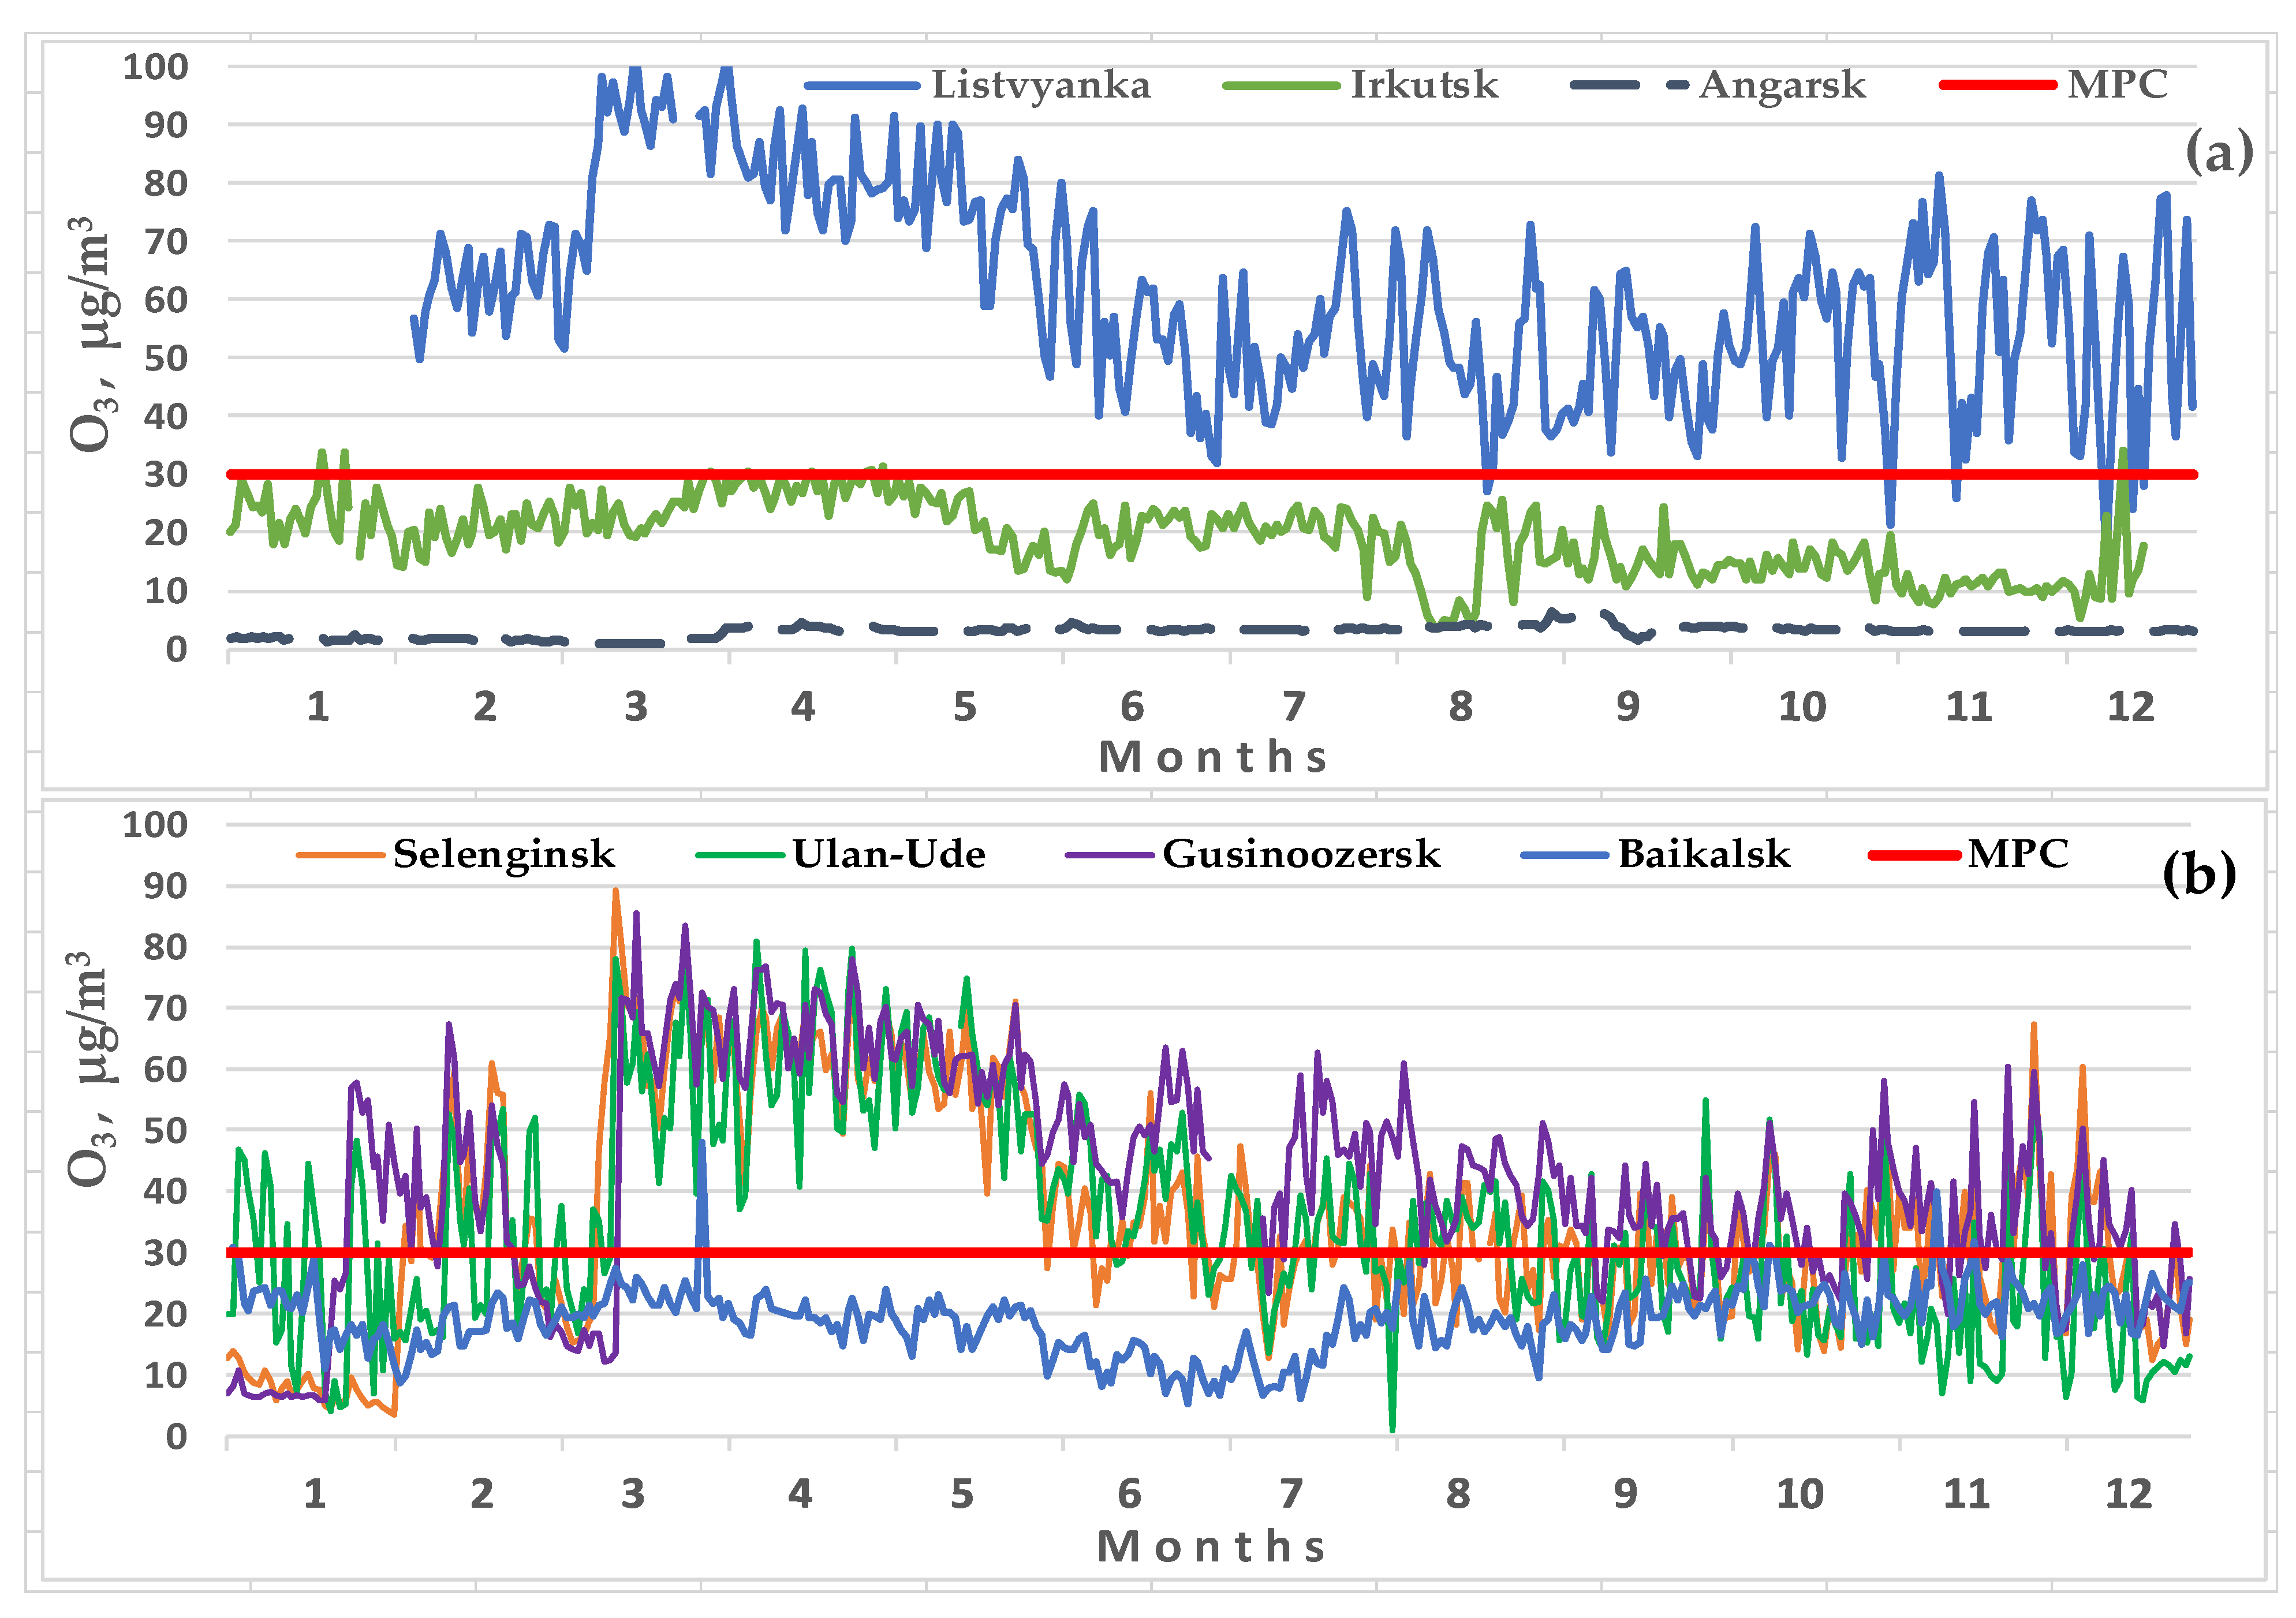
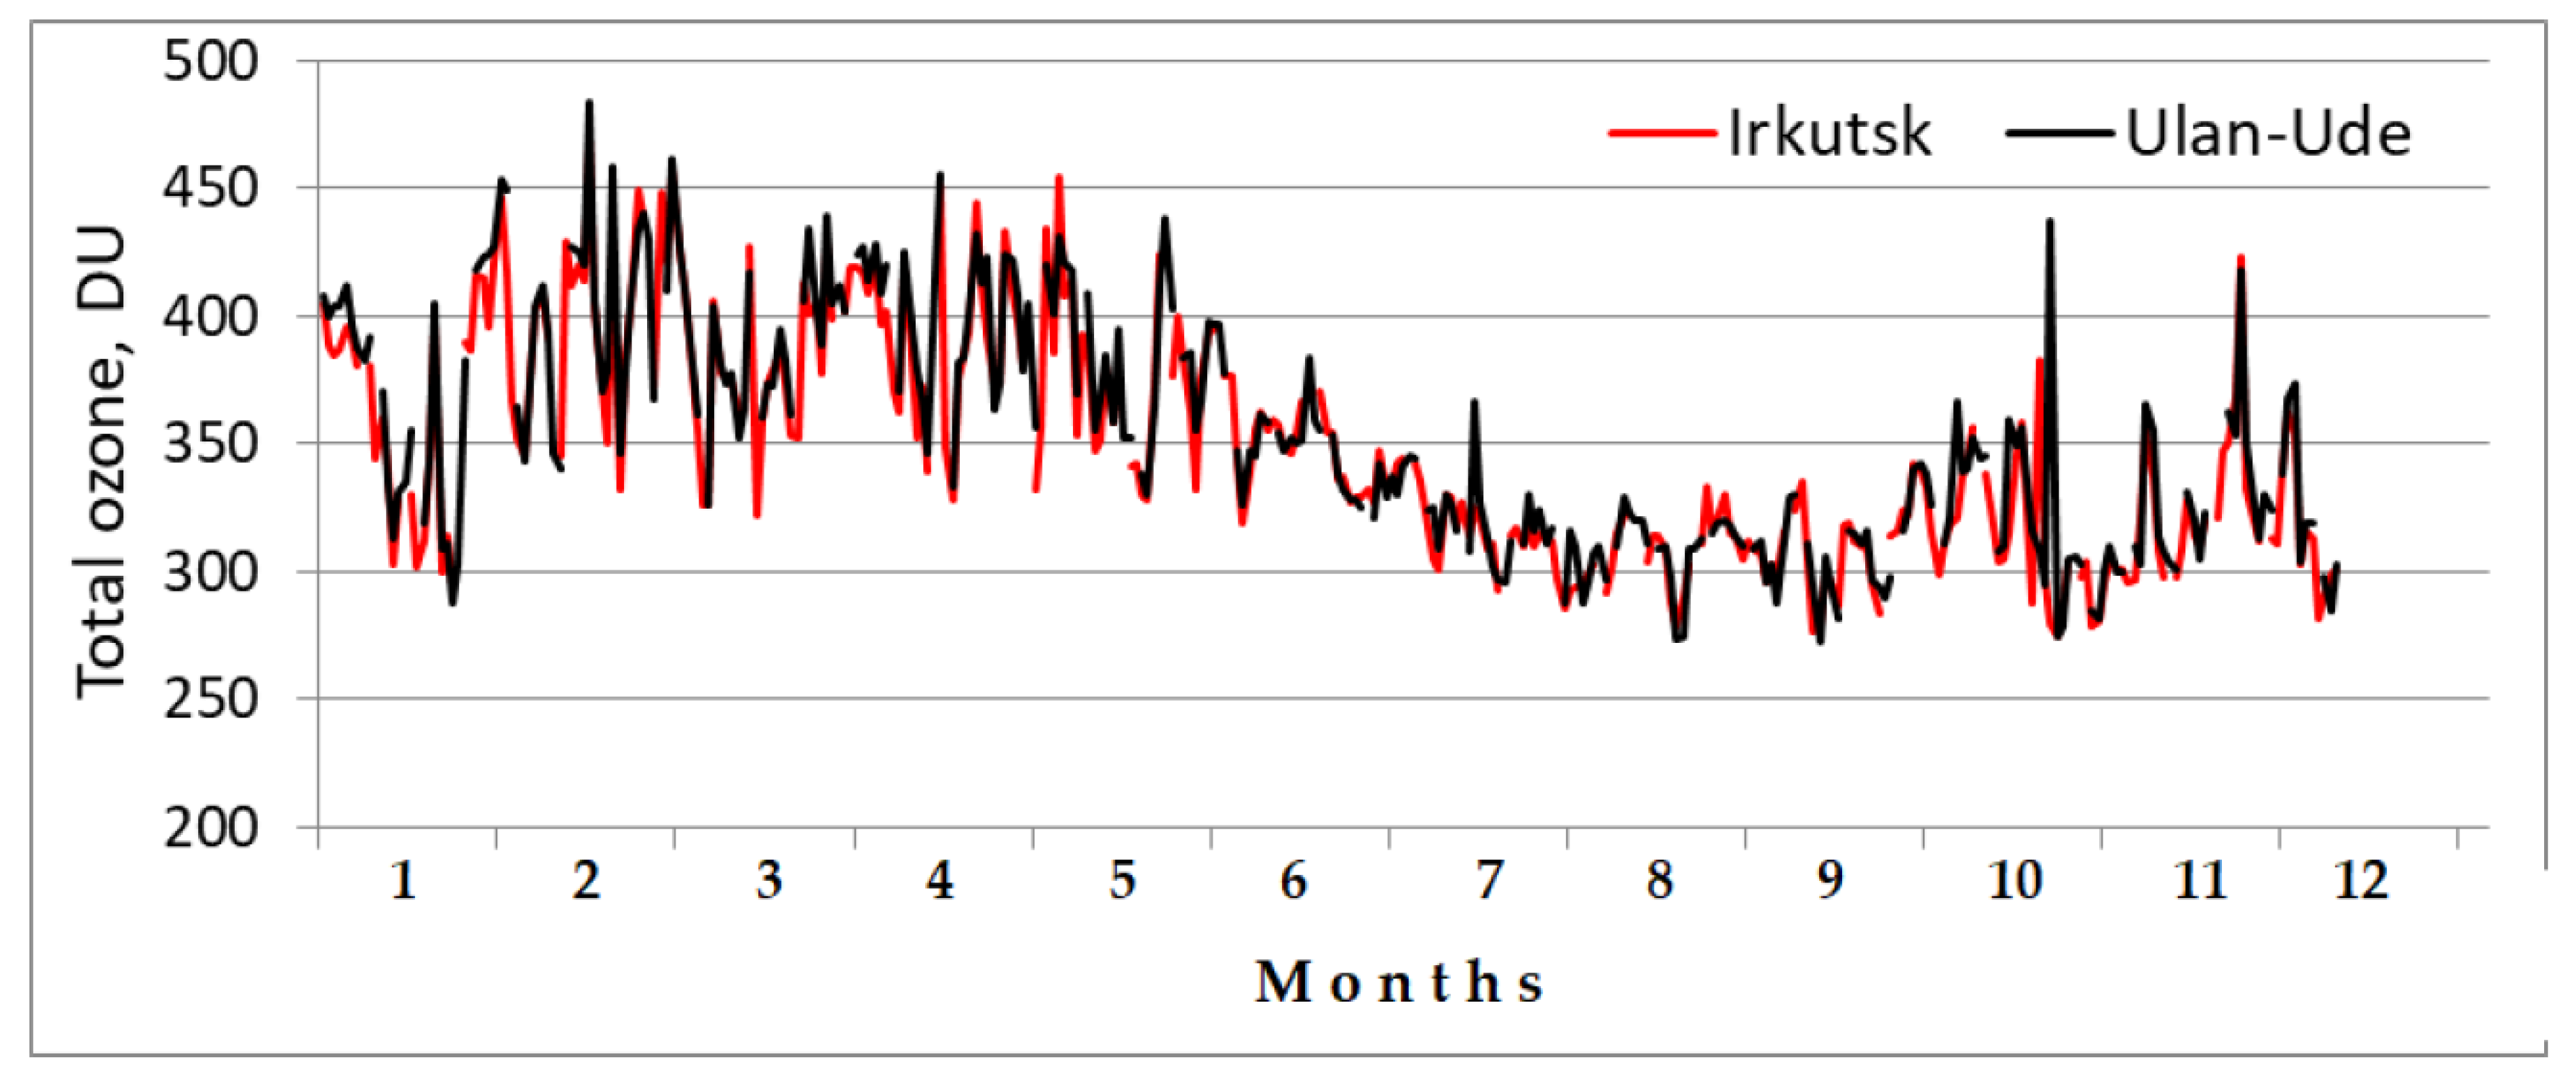
3.1. Spatial Variabilities of Ozone Concentrations in the Region

The variability of the average daily ozone concentrations at seven stations in the region for 2021 is shown in Figure 2. Among them, six stations characterize the ozone concentrations in urban conditions (in the ground atmospheric layer), and one station (Listvyanka)—the ozone concentration at the rural station situated at an altitude of 650 m above sea level (200 m above the lake level) and outside settlements.
The lowest ozone concentrations were observed in the large cities situated in the valley of the Angara River: Irkutsk and Angarsk (Figure 2a). These cities accommodate the largest coal-fired thermal power plants in the region, and there is a large number of vehicles. Furthermore, an oil refinery complex is also a serious source of pollutants as well as a large aluminium smelter in Shelekhov (near Irkutsk). This likely caused almost zero ozone concentrations in Angarsk during 2021, and there was practically no annual variation. In Irkutsk, the ozone concentrations were slightly higher, and there was a visible annual variation with the maximum value in spring. The highest ozone concentrations were recorded at the Listvyanka station situated outside settlements on the hill, 200 m high above the lake. The station experiences only the periodic impact of high-altitude transport of plumes from the high-altitude emissions of remote thermal power plants (mainly from Irkutsk) but is not affected by the influence of the local sources and vehicles.
In the cities of the Selenga valley (Figure 2b), the ozone concentrations were much higher than in the Angara valley but slightly lower than at the rural Listvyanka station. At the same time, based on the satellite monitoring data, the total ozone concentrations above both valleys (Angara and Selenga) had the same values and similar annual variabilities (Figure 3). This may suggest that the anthropogenic impact on ground-level ozone concentrations take place in these areas only in the ground layer and does not spread to higher layers.
Very low concentrations of ozone in Baikalsk appeared to be surprising. This town does not have large sources of air pollution, except for a small thermal power plant, though the Trans-Siberian Railway and highway passing near the city can also affect the likely behaviour of ozone. At the same time, the location of the town on the shore of a large water body (Lake Baikal) can be a natural factor of the ozone in the near-water layer of the air. Low concentrations of ozone above the water area of the lake based on satellite data are shown in [19]. However, other authors recorded high concentrations of ozone both in the ground layer and from the 30 m meteorological mast at the station about 2 km from the lake shore [20,21,22]. In the summer of 2015, 2016 and 2018, they observed that the average daily concentrations of ozone ranged from 35 to 65 μg/m3. Moreover, with the intense smoke from wildfires, the significant increase in the ozone concentration and its daily dynamics had an average value of 72 μg/m3 in the ground layer and a maximum concentration of up to 147 μg/m3 on the mast top (30 m).
Most likely, the unusually low concentrations of ozone in the cities of Angarsk and Irkutsk, as well as on the shore of Lake Baikal, are associated with processes occurring in the ground layer of the atmosphere. In the higher altitude layers of these cities, the ozone concentrations can be higher and reach approximately the same concentrations as in the cities of the Selenga River valley or at the rural station. There are no differences in the total ozone concentrations (based on satellite data) between these areas (Figure 3).

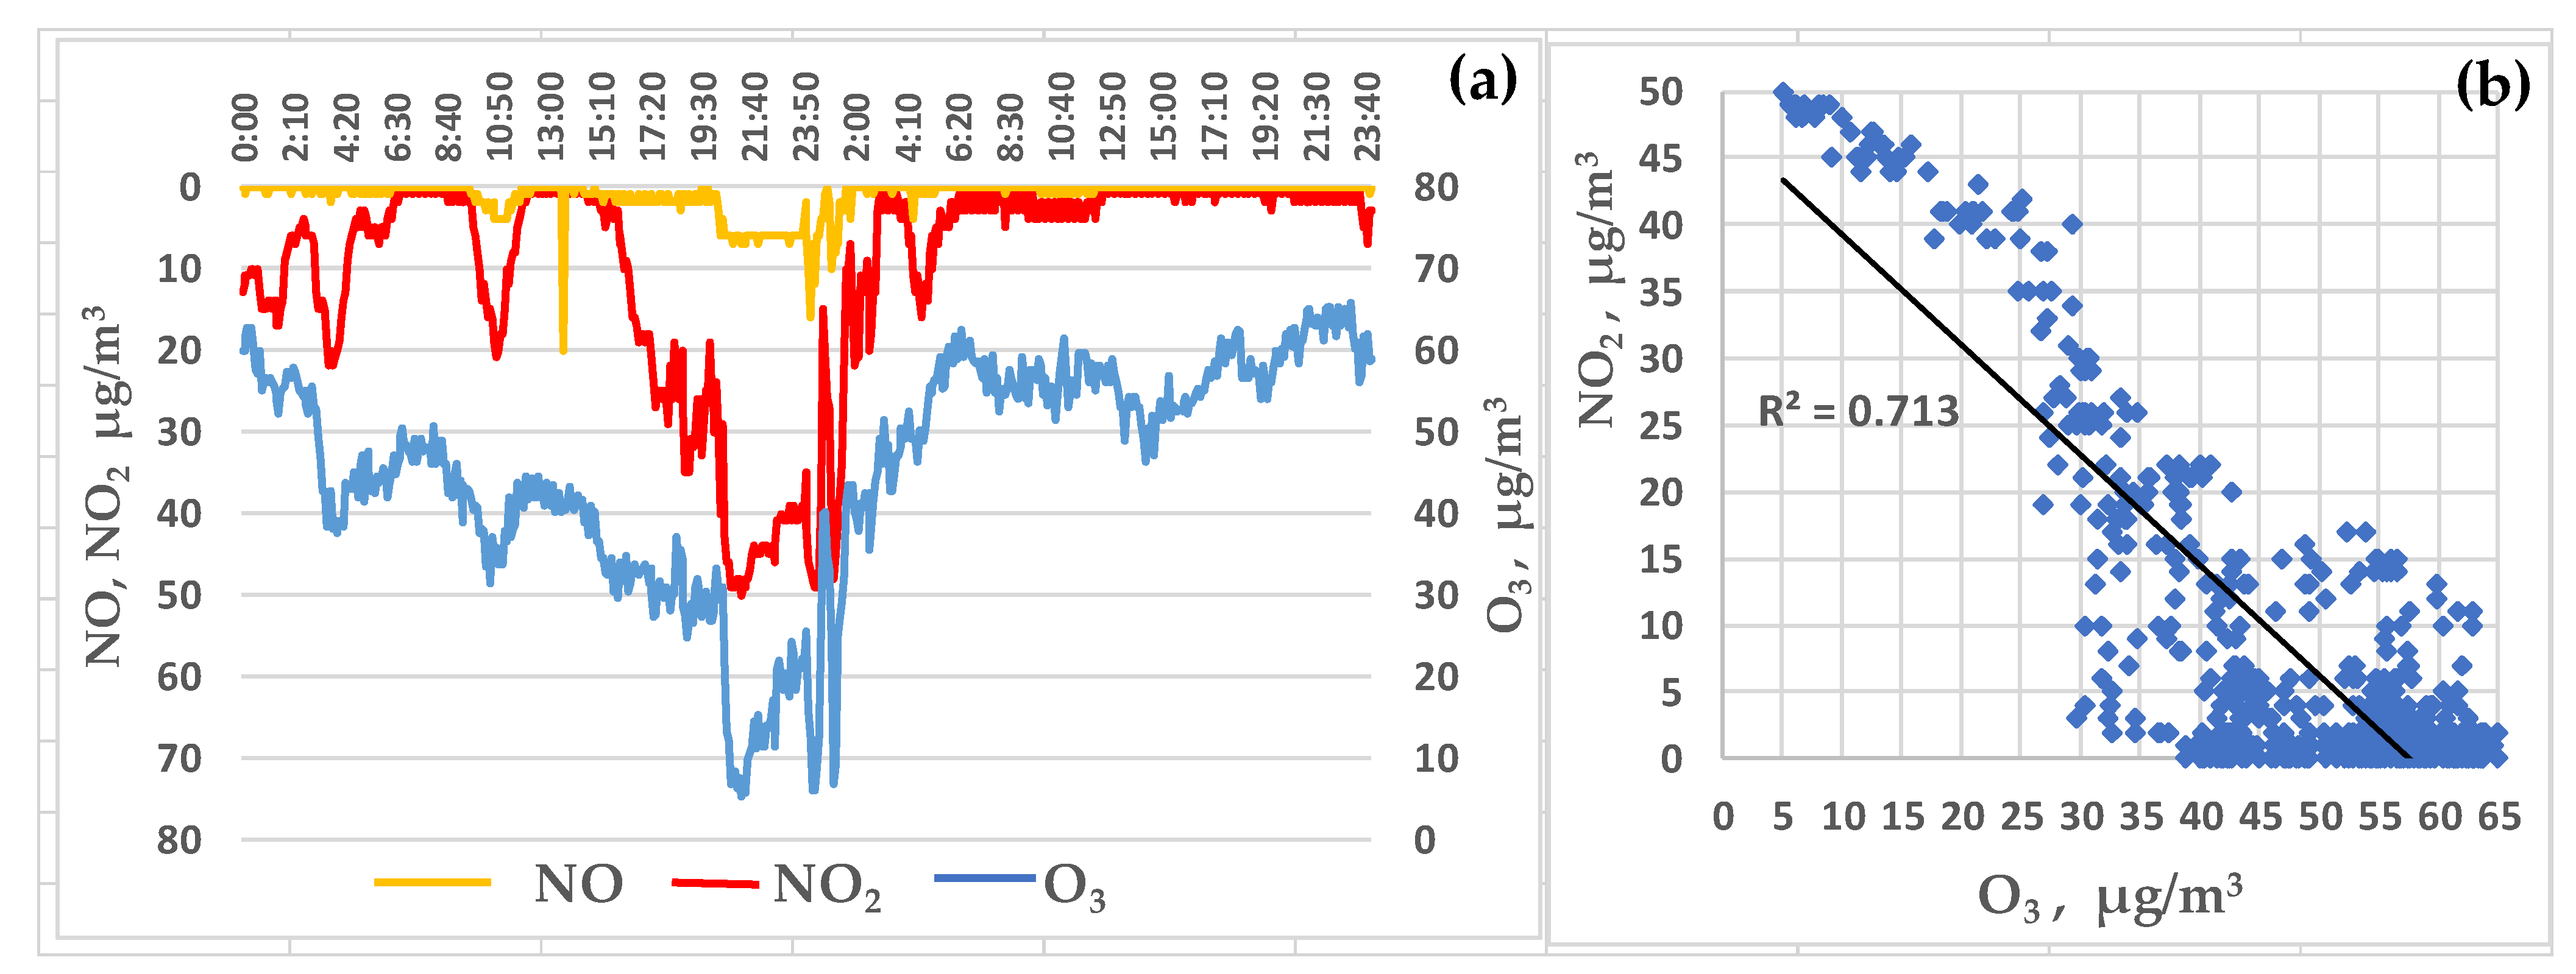
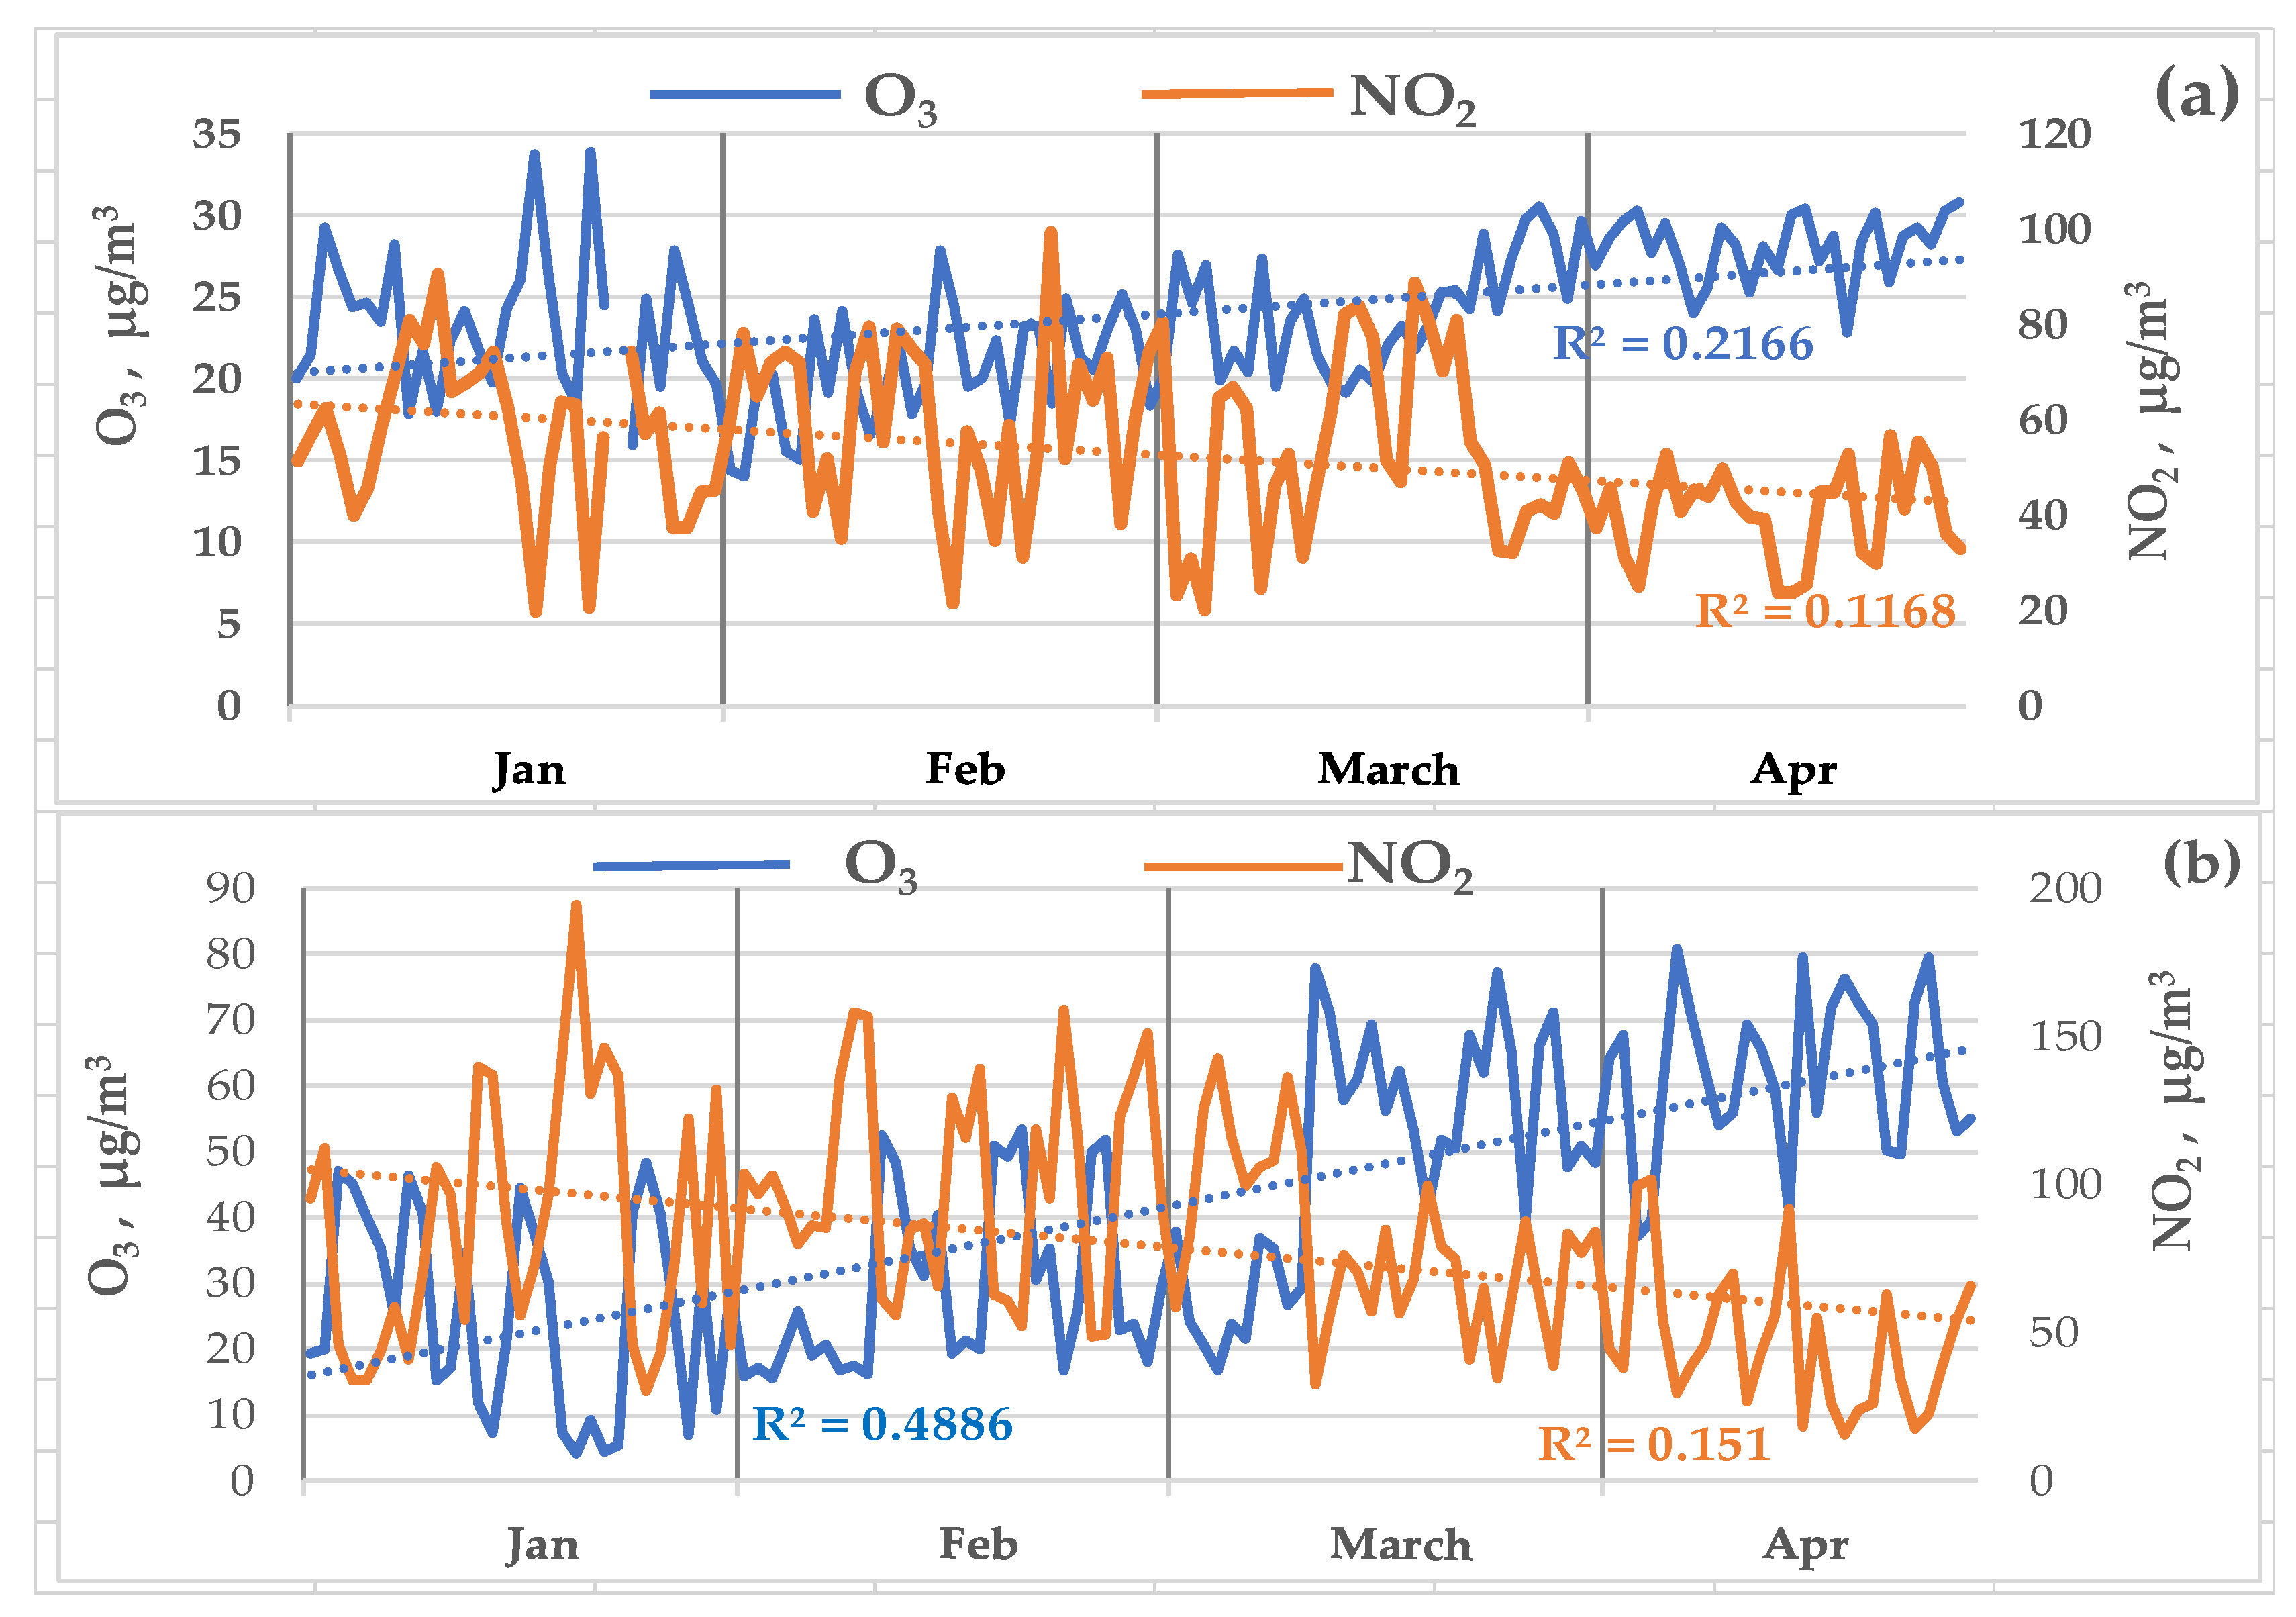
3.2. Ozone Concentrations and Air Pollution

It has long been known that plumes of emissions from thermal power plants consume the surrounding ozone during propagation in the atmosphere, leading to oxidation of NOx [8,9,10]. This was especially obvious during the joint high-resolution automatic recording of the concentrations of these gases. As an example, Figure 4 demonstrates a synchronous five-minute recording of these gases during the propagation of the plume from the remote thermal power plant at night on 27–28 November 2021 above the Listvyanka station.
Average daily concentrations of ozone in the cities of the Baikal region also demonstrate an obvious inverse relationship with the daily concentrations of nitrogen dioxide in the cold season of 2021. Furthermore, different directions take place both in short-term (daily average) fluctuations and seasonal trends (Figure 5).
The greatest effect of nitrogen oxides on the ozone concentrations occurs in the cold season, firstly, due to their greater emission by heating systems in winter and, secondly, due to deterioration of conditions for the dispersion of vehicle emissions in the ground atmospheric layer during anticyclone weather in the cold period of the year. Table 2 shows correlations of the concentrations of O3 and NO2, which confirm the significant negative effect of nitrogen oxides on ozone in the cold season and the weakening of this effect in summer. The correlation of O3 and NO2 is substantially weaker in Angarsk than in other cities, possibly because in this city, in addition to the thermal power plant and vehicles, there is also another significant source of pollution, which is an oil refinery.
The results presented above demonstrate that ozone concentrations in the near-ground atmospheric layer are lowest in the most polluted industrial centres of the Angara valley (Irkutsk and Angarsk). Even in summer when the conditions for the dispersion of air pollutants improve, the ozone concentrations remain low in these cities. In the cities of the Selenga valley, the situation is obviously different: the ozone concentrations are much higher, and a typical annual variability is clearly visible. In this area, the emissions of pollutants into the atmosphere are approximately ten times lower (~25,000 tons per year) than in the Angara valley (>200,000 tons per year) [23]. This seems to be the main reason for the difference in the behaviour of ozone in these industrial areas. In the annual variability, the ozone minimum is observed in winter when the combustion of fossil fuels increases and the vertical mixing in the ground atmospheric layer deteriorates due to temperature inversions, leading to the accumulation of anthropogenic pollutants in the ground atmospheric layer [24]. Perhaps this causes a more intensive consumption of ground-level ozone for the oxidation of numerous pollutants and the formation of its vertical inversion.
Low ozone concentrations in the area of Baikalsk situated near the water area of the southeast shore of Lake Baikal appeared to be unexpected. The impact of the anthropogenic factor on the lake shores is minimal compared to the industrial areas, and such low ozone concentrations in Baikalsk require additional research.
In addition to the anthropogenic factors, meteorological factors also influence the spatiotemporal dynamics of ozone [25]. For instance, the Selenga valley has a drier and sunnier climate than the Angara valley or the shore of Lake Baikal. This contributes to an increase in the influx of solar irradiance, especially ultraviolet (due to lower air humidity and low precipitation amounts), and the growth of ozone photogeneration [14]. Although it is generally accepted that the spring maximum of the ground-level ozone in the region is associated with the descending of ozone-enriched air masses from the stratosphere [26,27], there is evidence that photogeneration may make a greater contribution to its growth in this season, which is associated with an increase in day length and a small amount of precipitation. In particular, presented in [15] are synchronous measurements of the concentrations of the ground-level ozone and solar irradiance, which revealed that solar irradiance is the most important factor of the ozone generation in the ground atmospheric layer of rural and background areas in spring and summer. The ozone generation starts in the morning when the irradiance intensity reaches about 200 W/m2 and continues up to the same values in the evening. In other words, the ozone maximum on sunny days is shifted by three to six hours (depending on the day length) relative to the maximum solar irradiance.
Based on the 2021 data (Figure 6), the ozone maximum at the Listvyanka station was also at 18 o’clock (local time) in spring months which have the longest sunny days and very low precipitation amount (Table 1). The minimum was in January (the minimum day length) as well as in the early morning hours in summer and autumn due to weaker ozone photogeneration during longer nights and more cloudy and rainy weather.

4. Summary

The presented data on the spatiotemporal variability of average daily ozone concentrations in settlements with varying degrees of anthropogenic pressure indicate the suppression of ozone in the ground atmospheric layer of large cities, primarily due to the ozone oxidation of nitrogen oxides released during coal combustion by heating systems in the cold season. The minimum ozone concentrations throughout the year were observed in the most polluted cities with heavy industry (less than 5 µg/m3 in Angarsk and 10 to 25 µg/m3 in Irkutsk). In the settlements of a less polluted area, the valley of the Selenga River, the ozone concentrations were higher, and its annual variability was more typical of East Siberia: the maximum values in spring (60 to 70 μg/m3) and the minimum values in autumn and winter (10 to 30 μg/m3). The maximum ozone concentrations were observed in rural conditions (Listvyanka station), up to 80–100 μg/m3 during the spring maximum. In the settlements of the Selenga valley and rural areas, there was a high negative correlation between O3 and anthropogenic NO2 (up to −0.90), especially in winter, the season of maximum fossil fuel combustion. In cities with heavy industry, the effect of NOx on ozone was much weaker. Possibly, in these cities, ozone suppression was not only due to nitrogen oxides but also due to other anthropogenic pollutants that have not yet been studied. The excess of the Russian national hygiene standard for ozone, the average daily permissible concentration (MPC = 30 µg/m3), was practically not observed in the industrial cities of the Angara valley for less than five days. In the settlements of the Selenga valley, the excess was recorded from 200 to 270 days. In 2021, MPCs were mostly exceeded at the rural sites: more than 300 days of the year. It should be noted that the presented monitoring data on the ozone concentrations in urban areas refer only to the ground layer of the atmosphere. Additional studies of the vertical distribution of ozone in cities are required to understand the real extent of anthropogenic influence on ozone. To date, such data are absent.

Author Contributions

Conceptualization, V.O. and O.K.; methodology, V.P.; formal analysis, V.P. and V.O.; investigation, V.O. and O.K.; writing—original draft preparation, V.O. and V.P.; visualization, V.P. and V.O.; supervision, V.O. and T.K.; funding acquisition, T.K. All authors have read and agreed to the published version of the manuscript.

Funding

The results were supported by the Ministry of Science and Higher Education of the Russian Federation, Moscow (no. 075-15-2020-787) for the implementation of the large scientific project “Fundamentals, Methods and Technologies for Digital Monitoring and Forecasting of the Environmental Situation on the Baikal Natural Territory”. Section 2.

Institutional Review Board Statement

Not applicable.

Informed Consent Statement

Not applicable.

Data Availability Statement

The automatic daily monitoring data for Irkutsk are available at the website http://www.feerc.ru/baikal/ru/monitoring/air/ (accessed on 20 August 2021); the database on automatic monitoring data for the Listvyanka station has recently been designed and will be available at a later date.

Conflicts of Interest

The authors declare no conflict of interest.

References

  1. Agyei, T.; Juráň, S.; Edwards-Jonášová, M.; Fischer, M.; Švik, M.; Komínková, K.; Ofori-Amanfo, K.K.; Marek, M.V.; Grace, J.; Urban, O. The influence of ozone on net ecosystem production of a ryegrass–clover mixture under field conditions. Atmosphere 2021, 12, 1629. [Google Scholar] [CrossRef]
  2. Juráň, S.; Grace, J.; Urban, O. Temporal changes in ozone concentrations and their impact on vegetation. Atmosphere 2021, 12, 82. [Google Scholar] [CrossRef]
  3. Levy, H. Photochemistry of the lower troposphere. Planet. Space Sci. 1972, 20, 919–935. [Google Scholar]
  4. Belan, B.D. Ozone in Troposphere; Institute of Atmosphere Optics SB RAS: Tomsk, Russia, 2010; 527p. [Google Scholar]
  5. Logan, J.A.; Prather, M.J.; Wofsy, S.C.; McElroy, M.B. Tropospheric chemistry: A global perspective. J. Geophys. Res. 1981, 86, 7210–7254. [Google Scholar] [CrossRef]
  6. Monks, P.S.; Archibald, A.T.; Colette, A.; Cooper, O.; Coyle, M.; Derwent, R.; Fowler, D.; Granier, C.; Law, K.S.; Mills, G.E.; et al. Tropospheric ozone and its precursors from the urban to the global scale from air quality to short-lived climate forcer. Atmos. Chem. Phys. 2015, 15, 8889–8973. [Google Scholar] [CrossRef] [Green Version]
  7. Fowler, D.; Amann, M.; Anderson, R.; Ashmore, M.; Cox, P.; Depledge, M.; Derwent, D.; Grennfelt, P.; Hewitt, N.; Hov, O.; et al. Ground-Level Ozone in the 21st Century: Future Trends, Impacts and Policy Implications; The Royal Society: London, UK, 2008; ISBN 978-0-85403-713-1. [Google Scholar]
  8. Akimoto, N. Tropospheric Ozone a Growing Threat; Acid Deposition and Oxidant Research Centre: Niigata, Japan, 2006; 26p. [Google Scholar]
  9. Cocks, A.T.; Kallend, A.S.; Marsh, A.R.W. Dispersion limitations of oxidation in power plant plumes during long-range transport. Nature 1983, 305, 122–123. [Google Scholar]
  10. Obolkin, V.A.; Potemkin, V.L.; Makukhin, V.L.; Chipanina, Y.V.; Marinayte, I.I. Low-level atmospheric jets as main mechanism of long-range transport of power plant plumes in the Lake Baikal Region. Int. J. Environ. Stud. 2014, 71, 391–397. [Google Scholar]
  11. Obolkin, V.; Khodzher, T.; Sorokovikova, L.; Tomberg, I.; Netsvetaeva, O.; Golobokova, L. Effect of long-range transport of sulphur and nitrogen oxides from large coal power plants on acidification of river waters in the Baikal region, East Siberia. Int. J. Environ. Stud. 2016, 73, 452–461. [Google Scholar] [CrossRef]
  12. Pochanart, P.; Kato, S.; Katsuno, T.; Akimoto, H. Eurasian continental background and regionally polluted levels of ozone and CO observed in northeast Asia. Atmos. Environ. 2004, 38, 1325–1336. [Google Scholar]
  13. Pochanart, P.; Akimoto, H.; Kajii, Y.; Potemkin, V.; Khodzher, T. Regional background ozone and carbon monoxide variations in remote Siberia/East Asia. J. Geophys. Res. 2003, 108, 4028. [Google Scholar] [CrossRef]
  14. Kholyavitskaya, A.A.; Potemkin, V.L.; Golobokova, L.P.; Khodzher, T.V. Measurements of concentrations of surface ozone using passive sampling. Opt. Atmos. Ocean 2011, 24, 828–831. [Google Scholar]
  15. Khuriganova, O.; Obolkin, V.; Akimoto, H.; Ohizumi, T.; Khodzher, T.; Potemkin, V.; Golobokova, L. Long-Term Dynamics of Ozone in Surface Atmosphere at Remote Mountain, Rural and Urban Sites of South-East Siberia, Russia. Open Access Library J. 2016, 3, e2578. [Google Scholar] [CrossRef]
  16. Potemkin, V.L.; Golobokova, L.P.; Khodzher, T.V. Climatology and Chemistry of Surface Ozone and Aerosol under Alpine Conditions in East Siberia. Aerosol Air Qual. Res. 2019, 19, 1214–1225. [Google Scholar] [CrossRef]
  17. Monitoring of Environmental Pollution. Available online: http://www.feerc.ru/baikal/ru/monitoring/air/ (accessed on 20 December 2021).
  18. Obolkin, V.; Molozhnikova, E.; Shikhovtsev, M.; Netsvetaeva, O.; Khodzher, T. Sulfur and Nitrogen Oxides in the Atmosphere of Lake Baikal: Sources, Automatic Monitoring, and Environmental Risks. Atmosphere 2021, 12, 1348. [Google Scholar] [CrossRef]
  19. Trifonova-Yakovleva, A.M.; Gromov, S.A.; Gromov, S.S.; Khodzher, T.V.; Potemkin, V.L.; Obolkin, V.A. On the possibility of using the GOME2 high resolution ozone profiles for assessment of near-surface ozone concentrations // Sovremennye problemy distantsionnogo zondirovaniya Zemli iz kosmosa [Current problems in remote sensing of the earth from space]. Curr. Probl. Remote Sens. Earth Space 2017, 14, 239–247. (In Russian) [Google Scholar] [CrossRef]
  20. Zayakhanov, A.; Khodzher, T.; Tcydypov, V.; Balzhanov, T.; Dementeva, A. Studies of the Dispersed Composition of Atmospheric Aerosol and Its Relationship with Small Gas Impurities in the Near-Water Layer of Lake Baikal Based on the Results of Ship Measurements in the Summer of 2020. Atmosphere 2022, 13, 139. [Google Scholar] [CrossRef]
  21. Zayakhanov, A.S.; Zhamsueva, G.S.; Tsydypov, V.V.; Balzhanov, T.S.; Balin, Y.S.; Penner, I.E.; Kokhanenko, G.P.; Nasonov, S.V. Specific Features of Transport and Transformation of Atmospheric Aerosol and Gas Admixtures in the Coastal Zone of Lake Baikal. Atmos. Ocean. Opt. 2019, 32, 158–164. [Google Scholar]
  22. Zayakhanov, A.S.; Zhamsueva, G.S.; Tcydypov, V.V.; Balzhanov, T.S.; Dementeva, A.L.; Khodzher, T.V. Investigation of Transport and Transformation of Tropospheric Ozone in Terrestrial Ecosystems of the Coastal Zone of Lake Baikal. Atmosphere 2019, 10, 739. [Google Scholar] [CrossRef] [Green Version]
  23. IUGMS. The state of atmospheric air pollution in cities on the territory of the activity of the FSBI Irkutsk UGMS in 2016. In Yearbook; IUGMS: Irkutsk, Russia, 2017; 100p. [Google Scholar]
  24. Demin, V.I.; Beloglazov, M.I.; Elansky, N.F. On relationship between ozone concentration and height of mixing layer. Opt. Am. Ocean. 2004, 17, 662–665. [Google Scholar]
  25. Yadav, R.; Sahu, L.K.; Beig, G.; Jaaffrey, S.N.A. Role of long-range transport and local meteorology in seasonal variation of surface ozone and its precursors at an urban site in India. Atmos. Res. 2016, 176, 96–107. [Google Scholar] [CrossRef]
  26. Monks, P.S. A review of the observations and origins of the spring ozone maximum. Atmos. Environ. 2000, 34, 3545–3561. [Google Scholar]
  27. Albers, J.R.; Perlwitz, J.; Butler, A.H.; Birner, T.; Kiladis, G.N.; Lawrence, Z.; Dias, J. Mechanisms governing interannual variability of stratosphere-to-troposphere ozone transport. J. Geophys. Res. Atmos. 2018, 123, 234–260. [Google Scholar] [CrossRef]
Figure 1. Location of the main industrial centres with systems of state monitoring of the atmosphere in the Baikal region.
Atmosphere 13 00519 g001
Figure 2. The annual variability of the ozone concentrations: (a) in the cities of the Angara River valley and at Lake Baikal; (b) in the cities of the Selenga River valley for 2021. (MPC is the maximum permissible concentration, average daily values.)
Atmosphere 13 00519 g002
Figure 3. Seasonal variabilities of the total ozone concentrations (Dobson units) in the atmosphere above the Angara River valley (Irkutsk) and Selenga River valley (Ulan-Ude) in 2021 (based on the data at https://ozonewatch.gsfc.nasa.gov/data/omi/, accessed on 16 February 2022).
Atmosphere 13 00519 g003
Figure 4. An example of a five-minute recording of the concentrations of ozone and nitrogen oxides at the Listvyanka station (a) during the transport of the plume from the remote thermal power plant above the Listvyanka monitoring station on 27–28 November 2021 and the scattering diagram (b).
Atmosphere 13 00519 g004
Figure 5. Variability of daily average concentrations of O3 and NO2 in Irkutsk (a) and Ulan-Ude (b) from January to April 2021.
Atmosphere 13 00519 g005
Figure 6. Seasonal and diurnal dynamics of the ground-level ozone on the shore of Lake Baikal, Listvyanka station, 2021.
Atmosphere 13 00519 g006
Table 1. Meteorological conditions at the Listvynaka station in 2021.
Meteorological ParametersMonths
IIIIIIIVVVIVIIVIIIIXXXIXII
Air
tempe-rature,
(°C)
Average−16.6−15.1−6.20.45.510.113.013.78.22.8−3.7−10.5
Absol. Maxim.−4.7−1.69.410.716.122.128.825.520.612.89.7−0.7
Absol.
Minim.
−28.3−31.0−23.9−2.4−2.72.45.66.3−0.3−7.3−16.5−27.4
Air humidity, (%)797366647177878878737576
Wind speed, (m/s)4.63.73.53.33.32.72.02.93.43.23.74.9
Prevailing
wind direction
NSSENNNNSSENNNNN
Precipitation,
(mm)
279814107641481164111016
Table 2. Correlation coefficient of average daily concentrations of ozone and nitrogen dioxide at atmospheric monitoring sites in 2021.
AngarskIrkutskListvyankaSelenginskUlan-UdeGusinoozersk
January−0.14−0.62 −0.58−0.92−0.42
February−0.29−0.60−0.45−0.64−0.82−0.45
March−0.42−0.62 −0.75−0.90−0.64
April−0.25−0.44 −0.58−0.92−0.61
May−0.12+0.10−0.38−0.06−0.53−0.27
June+0.24−0.26−0.40−0.01−0.02+0.01
July−0.18−0.24−0.16−0.14−0.05−0.32
August−0.14+0.14−0.52−0.39−0.64−0.35
September−0.08−0.01−0.70−0.29−0.52−0.53
October−0.68−0.34−0.38−0.57−0.76−0.82
November−0.18−0.49−0.41−0.75−0.62−0.73
Note: Values significant at the level of 95% are highlighted in bold.
Publisher’s Note: MDPI stays neutral with regard to jurisdictional claims in published maps and institutional affiliations.

