Article

Secondary Organic and Inorganic Aerosol Formation from a GDI Vehicle under Different Driving Conditions

1
Center for Environmental Research and Technology (CE-CERT), Bourns College of Engineering, University of California, 1084 Columbia Ave, Riverside, CA 92507, USA
2
Aerosol Physics Laboratory, Physics Unit, Faculty of Engineering and Natural Sciences, Tampere University, FI-33720 Tampere, Finland
*
Author to whom correspondence should be addressed.
Atmosphere 2022, 13(3), 433; https://doi.org/10.3390/atmos13030433
Submission received: 16 February 2022 / Revised: 1 March 2022 / Accepted: 4 March 2022 / Published: 8 March 2022
(This article belongs to the Special Issue Feature Papers in Atmosphere Science)

Abstract

:
This study investigated the primary emissions and secondary aerosol formation from a gasoline direct injection (GDI) passenger car when operated over different legislative and real-world driving cycles on a chassis dynamometer. Diluted vehicle exhaust was photooxidized in a 30 m3 environmental chamber. Results showed elevated gaseous and particulate emissions for the cold-start cycles and higher secondary organic aerosol (SOA) formation, suggesting that cold-start condition will generate higher concentrations of SOA precursors. Total secondary aerosol mass exceeded primary PM emissions and was dominated by inorganic aerosol (ammonium and nitrate) for all driving cycles. Further chamber experiments in high temperature conditions verified that more ammonium nitrate nucleates to form new particles, forming a secondary peak in particle size distribution instead of condensing to black carbon particles. The results of this study revealed that the absorption of radiation by black carbon particles can lead to changes in secondary ammonium nitrate formation. Our work indicates the potential formation of new ammonium nitrate particles during low temperature conditions favored by the tailpipe ammonia and nitrogen oxide emissions from gasoline vehicles.

1. Introduction

Gasoline motor vehicles are an important anthropogenic source of particulate matter (PM), nitrogen oxides (NOx), and volatile organic compounds (VOCs) [1,2]. Gasoline vehicles are also known to significantly contribute to secondary organic aerosol (SOA) formation, with a greater contribution to SOA mass in urban areas compared to diesel vehicles [3,4,5]. SOA is formed in the atmosphere through the photooxidation of semivolatile and volatile organic species, and is the largest component of the ambient organic aerosol (OA) budget [6,7]. A number of studies have demonstrated the key role gasoline vehicles are playing in the elevated SOA mass production, as a result of VOC and intermediate VOC (IVOC) emissions that are considered precursors for SOA formation [8,9,10,11]. The majority of these investigations have also reported significant exceedances of SOA mass compared to primary organic aerosol (POA) levels [12,13,14].
Primary emissions and secondary aerosol production from gasoline vehicles are greatly affected by driving and engine operating conditions [15,16,17,18]. It has been demonstrated that semivolatile organic compound emissions from gasoline vehicles, such as polycyclic aromatic hydrocarbons, which are known SOA precursors can be influenced by the engine operating conditions, with higher emissions for the cold-start period compared to the hot-stabilized period or highway cruise conditions [14,19]. For example, Miersch et al. [20] showed higher concentrations of alkylated naphthalenes from a Euro 5 gasoline direct injection (GDI) engine during a municipal driving cycle representing urban driving, whereas methyl-phenanthrenes and pyrene dominated the exhaust emissions for the high velocity driving cycle. A recent study found greater emissions of reactive aromatics and alkenes during hot idling conditions of a Euro 4 port-fuel injection (PFI) vehicle representing traffic congestion and higher SOA production when compared to cruising conditions [21]. Other studies utilizing oxidation flow reactors have shown greater SOA formation potential during cold-start cycles compared to hot-start cycles [15,18,22,23].
Several metropolitan and rural areas are experiencing severe aerosol pollution, with the majority of aerosol mass being ammonium nitrate and the remaining portion being mostly organic [24,25,26,27]. In urban areas, gasoline passenger vehicles are known sources of ammonia (NH3) emissions, which can react with nitric acid formed from the oxidation of NOx emissions to produce nitrate aerosols in the troposphere [28,29]. In rural (or agricultural) areas on the other hand, NH3 plumes are generated from dairy facilities and fertilizers, which is a particularly severe issue in the San Joaquin Valley of California [25]. The important contribution of gasoline vehicles on the formation of secondary inorganic aerosol (ammonium and nitrate) has been reported by several studies [13,15,24,30]. Vu et al. [13] showed greater formation of inorganic aerosol in the form of ammonium nitrate, which dominated the total secondary aerosol mass when they introduced dilute exhaust in a chamber from GDI vehicles operated on the LA92 cycle. Tkacik et al. [31] reported two times more ammonium nitrate formation compared to SOA when they used a potential aerosol mass (PAM) reactor in a highway tunnel in Pittsburgh.
Information on secondary aerosol formation from gasoline vehicles specific to different driving conditions is limited. While a number of studies have investigated the SOA formation from gasoline vehicles during idling, steady-state cruising, constant-load driving, and regulatory cycles that include idle, acceleration/deceleration, and cruise periods, few or no studies have focused on the non-regulatory cycles that have a better representation of real-world driving patterns and vehicle emissions. The purpose of this work is to better understand primary emissions and secondary aerosol formation from the exhaust of a GDI vehicle when operated on different driving cycles, including certification driving cycles used in the United States (US) and Europe, as well as real-world non-regulatory cycle representative of California freeway driving conditions.

2. Materials and Methods

2.1. Vehicle and Emissions Testing

A 2016 model year light-duty vehicle with a 2.4-L, 4-cylinder, wall-guided direct injection spark ignition engine was employed in this study. The engine had a rated horsepower of 185 hp at 6000 rpm, a torque of 178 ft-lbs. at 4000 rpm, and a compression ratio of 10:1. The vehicle was equipped with a three-way catalyst (TWC) and was certified under California LEVIII SULEV 30 emissions standard. Emissions testing was performed with a typical California E10 fuel.
Emissions measurements were conducted in CE-CERT’s Vehicle Emissions Research Laboratory (VERL), on a Burke E. Porter 48-inch single-roll electric dynamometer. A Pierburg Positive Displacement Pump-Constant Volume Sampling (PDP-CVS) system was used to obtain standard bag measurements for total hydrocarbons (THC), carbon monoxide (CO), nitrogen oxides (NOx), non-methane hydrocarbons (NMHC), and carbon dioxide (CO2). Bag measurements were made with a Pierburg AMA-4000 bench. All gaseous emissions were determined according to the US EPA protocols for light-duty emission testing as specified in the Code of Federal Regulations (CFR), Title 40, Part 86. Cumulative PM mass emissions were measured following the procedures in 40 CFR 1065. Total particle number was measured using a TSI 3776 ultrafine-Condensation Particle Counter (CPC) with a 2.5 nm cut point. The instrument operated at a flowrate of 1.5 L/min. Solid particle number counts were measured with the use of a catalytic stripper. The particles were counted downstream of the catalytic stripper with a TSI 3776 ultrafine CPC at a flow rate of 1.5 L/min. An ejector diluter was used to collect particle number samples from the CVS tunnel for the GDI vehicle.

2.2. Driving Cycles

Testing was conducted in duplicate over several different driving cycles, including the FTP cycle, which is the cycle for emissions certification of light-duty vehicles in the US, and the New European Driving Cycle (NEDC). The FTP includes three phases (i.e., cold-start, urban, and hot-start phases) with a maximum speed of 57 miles/h, whereas the NEDC includes four ECE segments (known as urban driving cycle or UDC) repeated without interruption, followed by one extra-urban driving cycle (EUDC). In addition, the LA92 or the California Unified Cycle was also used. It has a similar three bag structure as the FTP, but is a more aggressive driving cycle with higher speed and acceleration, fewer stops, and less idle time.
A non-regulatory driving schedule was also employed in this study. This cycle was developed by the California Department of Transportation (Caltrans) to better represent typical driving patters in California freeways. This cycle (referred to as Caltrans) has been derived from field driving data representative of freeway, arterial, collector road, and local driving, and traffic congestion level typically found in Los Angeles freeways. The mean and maximum speed is 53.8 miles/h and 90 miles/h, respectively. The speed-time profiles of the test cycles are shown in Figure S1, Supplementary Material (SM).

2.3. Photooxidation Chamber Experiments

For the chamber experiments, diluted exhaust of the GDI vehicle was introduced through the CVS into a 30 m3 Mobile Atmospheric Chamber (MACh), which is a 2-mil fluorinated ethylene propylene Teflon film reactor. Details on the construction and characterization of MACh can be found in Vu et al. [13]. Experimental setup and protocols are described in detail elsewhere [13,32]. Briefly, the chamber is equipped with 600 15W 18” black lights for irradiation with NO2 actinometry measurements inside the reactor averaging 0.23 min−1. Prior to the irradiation experiments, the chamber was cleaned by injecting O3, H2O2, and purified air (H2O, NOx, CO, O3, hydrocarbons below detection limits) and irradiated with UV light. The chamber was then subsequently emptied and filled repeatedly until all gases and particles were below detection limits (H2O < −50 °C dew point; NOx, CO, HC, O3 and PM being below detection limits) and then flushed with purified air overnight. Prior to the injection of vehicle exhaust, the chamber was half-filled with purified air. After the exhaust was collected, the chamber was filled to maximum volume with purified air. 1.0 ppm of H2O2 was also injected utilizing an oven (60 °C), to provide an additional hydroxyl radical source in the chamber. However, subsequent characterization experiments of m-xylene decay in the presence of 1 ppm H2O2 showed insignificant amounts of hydroxyl radicals formed in the chamber via H2O2 photolysis. Therefore, it was concluded that the light spectrum of the blacklights used in this study were not optimal for H2O2 photolysis. As a result, the 1 ppm H2O2 injection did not appreciably increase hydroxyl radical concentrations for this study. Prior to irradiation, the diluted primary exhaust was evaluated for approximately 30 min to physically and chemically characterize the primary emissions. The emissions were then photooxidized continuously for 7–10 h or until particle formation subsided.
A commercial scanning mobility particle sizer (SMPS) consisting of a TSI 3080 Electrostatic Classifier, TSI 3081 long column Differential Mobility Analyzer (DMA) column, and a TSI ultrafine condensation particle counter (CPC) 3776 were used to measure the size-resolved number concentrations. Black carbon was measured with an AVL Micro Soot Sensor (MSS) with a high-power laser diode operating at 802 nm with a photoacoustic sensor. The chemical composition of the non-refractory aerosol was measured online using an Aerodyne high-resolution time-of-flight aerosol mass spectrometer (HR-ToF-AMS). The HR-ToF-AMS was operated in both V and W modes, and the data processing was completed using the ToF-AMS Analysis Toolkit 1.57 and ToF-AMS HR analysis 1.16. The Unit Mass Resolution (UMR) and HR Frag table for CO2 were altered from the assumed concentration of 400 ppm to the measured CO2 concentration using a LI-COR®® LI-840A CO2/H2O analyzer. A Kanomax aerosol particle mass (APM) analyzer system was used to measure particle effective density. The APM was paired with a custom-built SMPS. A more detailed summary of the APM-SMPS system is described in an earlier study [33]. Using the HR-ToF-AMS, the organic, ammonium, nitrate, and sulfate ratios were calculated and applied to the total mass calculated using volume calculated from the SMPS and density from the APM (after subtracting the black carbon contribution). First order size independent wall loss corrections were applied to the suspended particulate [34], while wall-loss corrected black carbon mass was assumed to be constant throughout the irradiation experiments.
Volatility measurements were made with a tandem differential mobility analyzer (TDMA) consisting of two TSI 3081 DMAs and a TSI Model 3760A CPC. Particles selected in their peak mode in the TDMA column pass through a thermodenuder at 100 °C with a residence time of about 17 s. Heated particles are classified in the DMA column, measuring the new aerosol size distribution. The initial diameter is then compared to the final diameter to obtain the volume fraction remaining (VFR) of the particles.
Gas phase instrumentation included a Thermo Environmental Instruments Inc. (MA) Model 42 chemiluminescent NOx analyzer (NO, NO2, NOx). A Dasibi Environmental (CA) nondispersive ultraviolet ozone analyzer will monitor the chamber ozone concentration. A Dasibi Model 48C was used to measure CO concentrations with IR analysis.

3. Results

3.1. Tailpipe Gaseous and Particulate Emissions

A summary of the gaseous emissions for each driving cycle is provided in Table 1. THC and NMHC emissions were higher for the cold-start NEDC, FTP, and LA92 cycles compared to Caltrans. When the engine is cold, the major THC and NMHC source is the fuel vapor from the liquid fuel film on the cylinder surfaces that did not get efficiently oxidized in the TWC, which was below its light-off temperature at the beginning of the cycle. Comparing the cold-start cycles, NOx emissions were higher over the LA92 (0.012 g/mile) compared to FTP (0.006 g/mile) and NEDC (0.007 g/mile) because the LA92 cycle includes more acceleration and less idle periods than the other two cycles, resulting in higher combustion temperatures and favoring thermal NOx formation. CO emission levels were similar for the FTP and LA92 (0.342 g/mile on average), but elevated for the Caltrans cycle and NEDC (0.760 g/mile on average). Generally, CO emissions are linked to the occurrence of sharp accelerations at high-speed conditions encountered over the Caltrans cycle, indicating that the engine was operating fuel-rich. For the NEDC, the more extensive cold-start period due to the milder driving profile compared to FTP and LA92 was likely the cause for the elevated CO emissions.
PM mass and black carbon emissions were higher for the cold-start FTP, NEDC, and LA92 compared to Caltrans, and above the 3 mg/mile PM mass FTP limit (Table 1). Similar patterns were seen for the total and solid particle number emissions, with some exceptions. Previous studies have also shown elevated PM and particle number emissions from GDI vehicles, especially during cold-start conditions [35,36,37,38]. The higher particulate emissions for the cold-start cycles can be attributed to the partially evaporated fuel at the beginning of the cycle, causing increased wall wetting on the cold piston and cylinder surfaces. The dominant pathway for elevated soot formation will be via the diffusion-controlled burning of the non-evaporated liquid fuel thin films [39].

3.2. Tailpipe Aerosol Composition

Figure 1 shows the tailpipe aerosol composition for the GDI vehicle over the different driving cycles. Evidently, tailpipe aerosol emissions were primarily comprised of black carbon. This is consistent with previous studies showed that GDI PM emissions were predominantly black carbon or soot in nature [35,40]. For the FTP, the cycle-averaged black carbon was 1.67 ± 0.17 mg/mile, accounting for about 60% of the total PM before irradiation. For the LA92, the cycle-averaged black carbon was 1.96 ± 0.22 mg/mile, accounting for about 70% of the total PM before irradiation and being about 17% lower than FTP. For the NEDC, black carbon was 3.92 mg/mile and accounted for approximately 55% of the total PM before irradiation. The Caltrans cycle showed comparable levels of black carbon (1.69 mg/mile) with the cold-start FTP and LA92 cycles, and accounted for about 77% of the total PM before irradiation. While the Caltrans cycle was a hot-start, the high demanding and high-speed driving conditions resulted in overall elevated black carbon emissions for this cycle.
The bulk aerosol chemical composition shows that the organics fraction of the total tailpipe PM mass for the FTP, LA92, and Caltrans was about 40% (1.15 mg/mile), 27% (0.78 mg/mile), and 5% (1.10 mg/mile), respectively. The moderate NEDC showed the highest organics fraction of about 44% (3.21 mg/mile) among all other test cycles. It appears that a combination of the cold-start operation and the aggressive nature of the test cycle were the contributing factors for the organic aerosol in total PM, which was likely generated by unburned or partially burned low and intermediate volatility hydrocarbons in the fuel and lubricating oil. It is interesting to note that the organics fraction corroborates with the NMHC emissions. The higher concentrations of organics for the cold-start cycles compared to Caltrans was likely a result of the cold-start period and associated fuel impingement, which deeply influenced unburned hydrocarbon emissions formation and their inefficient oxidation in the cold TWC.

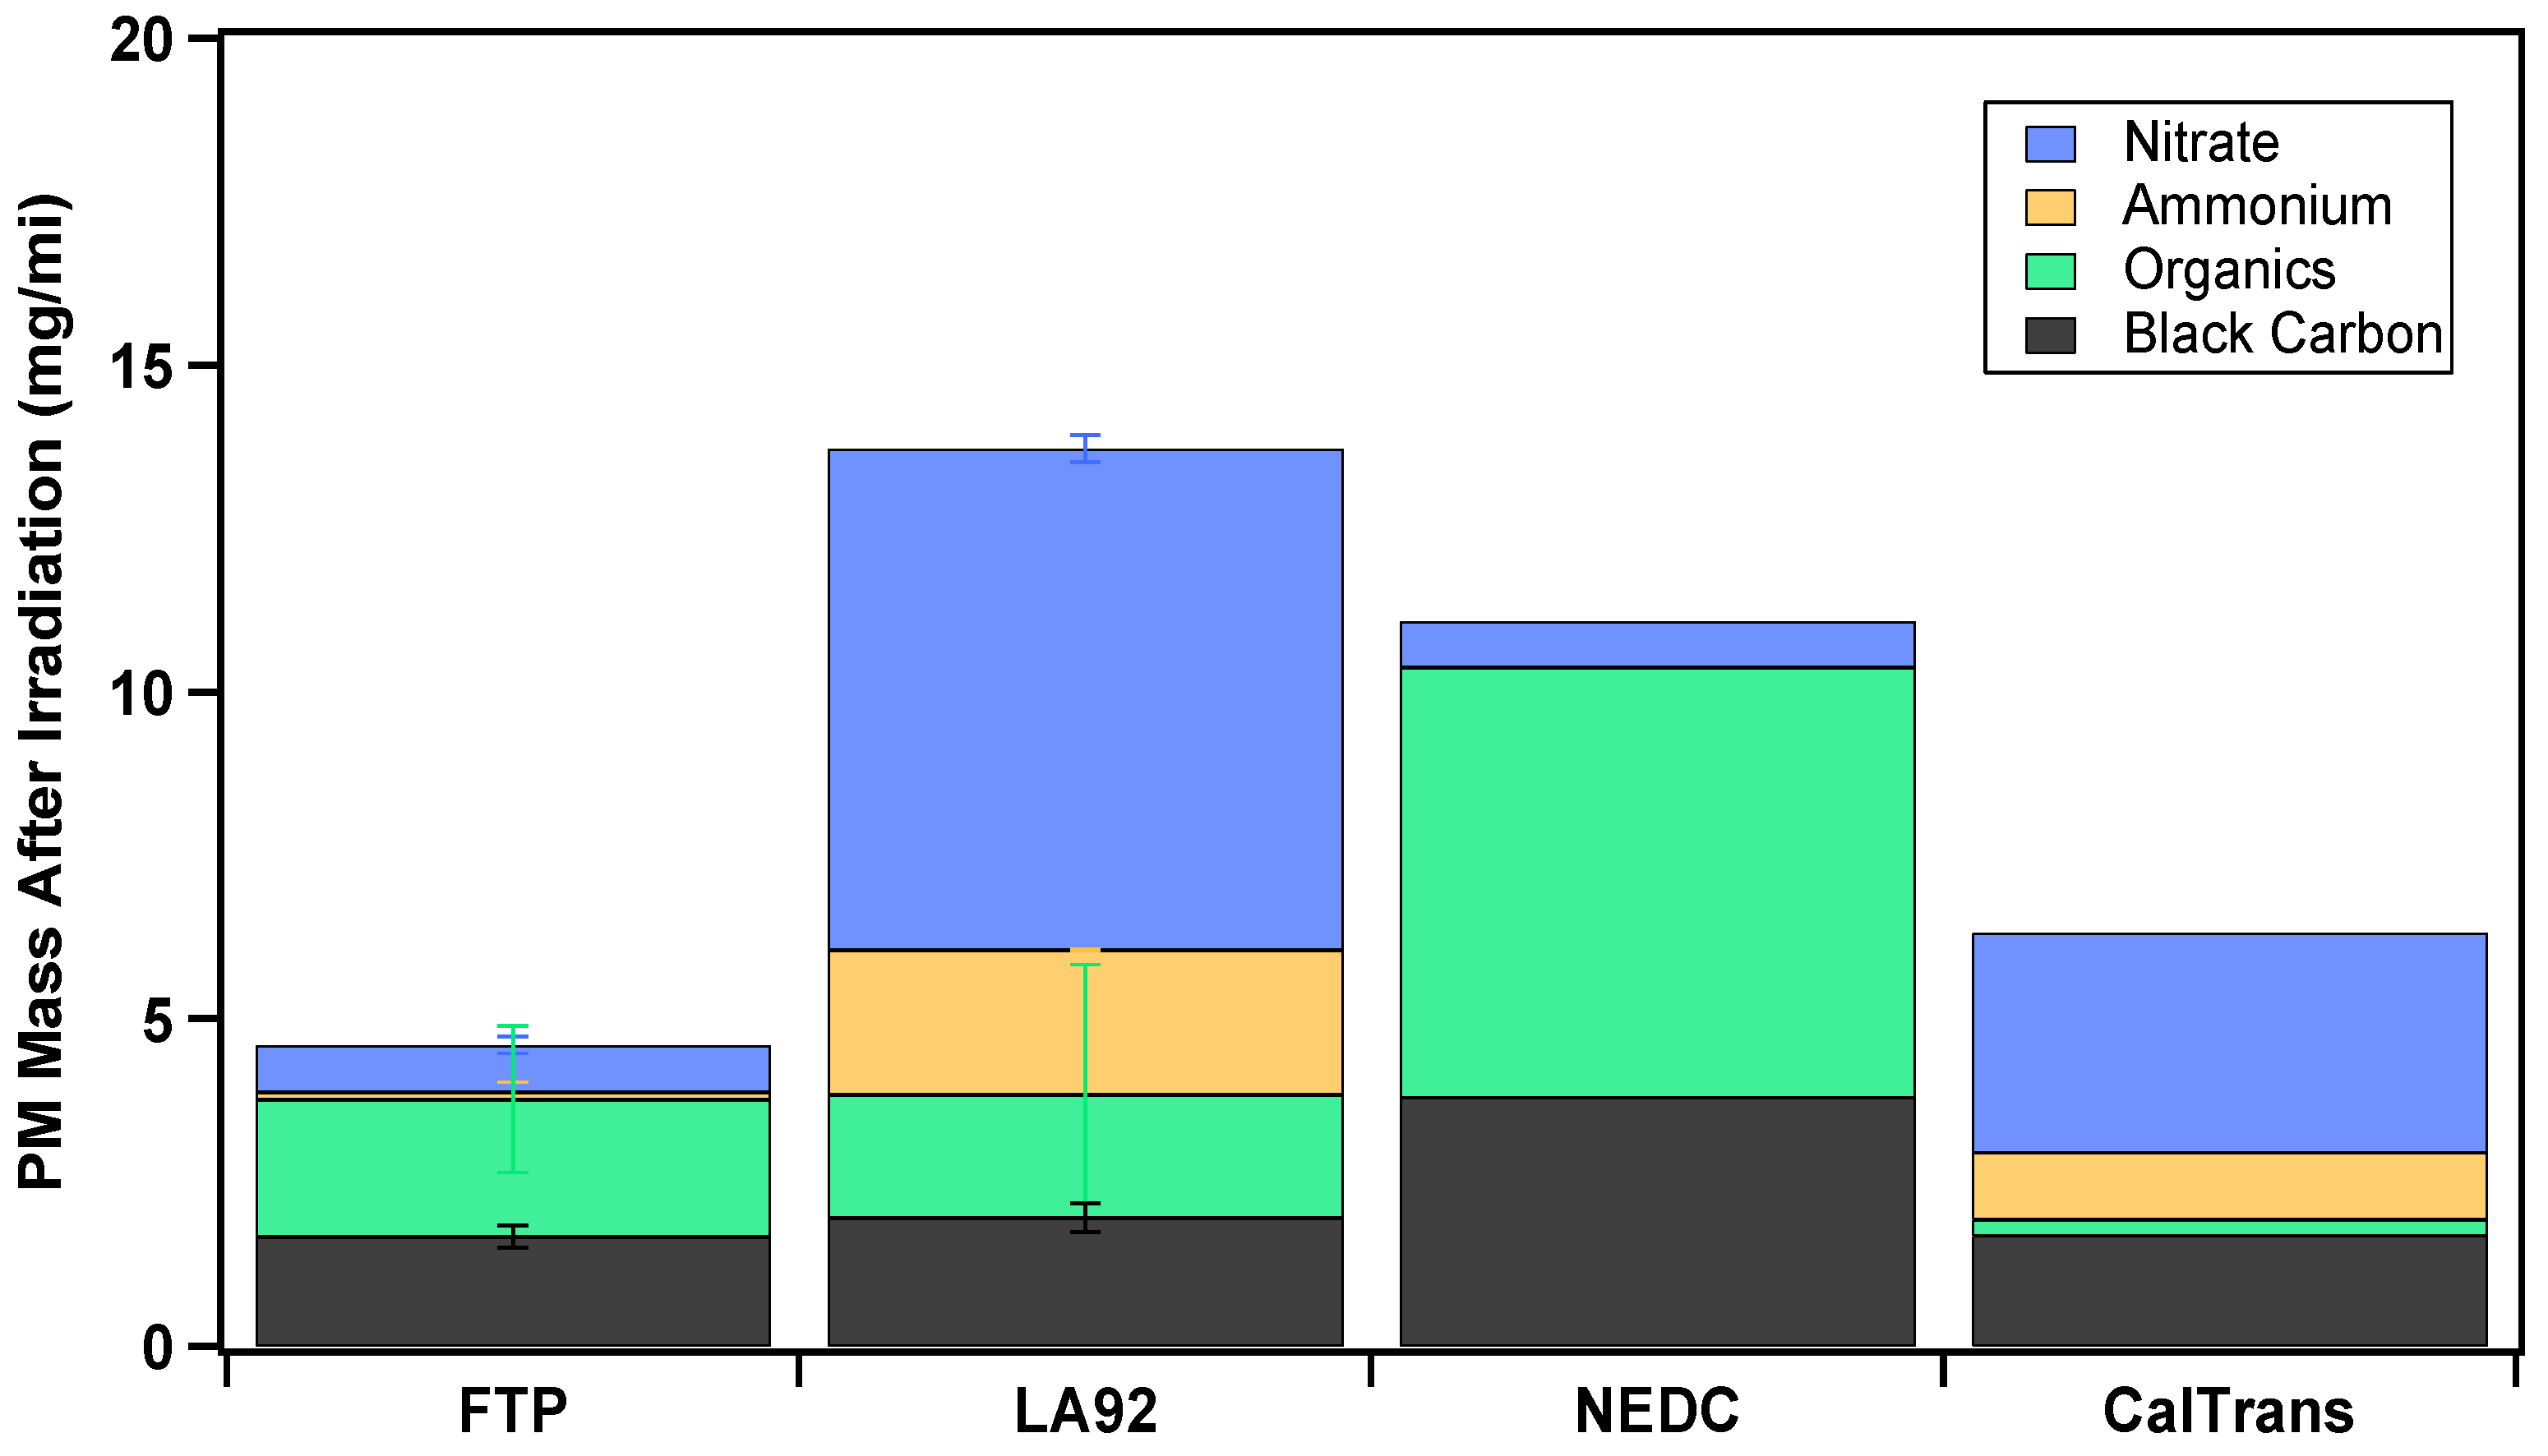
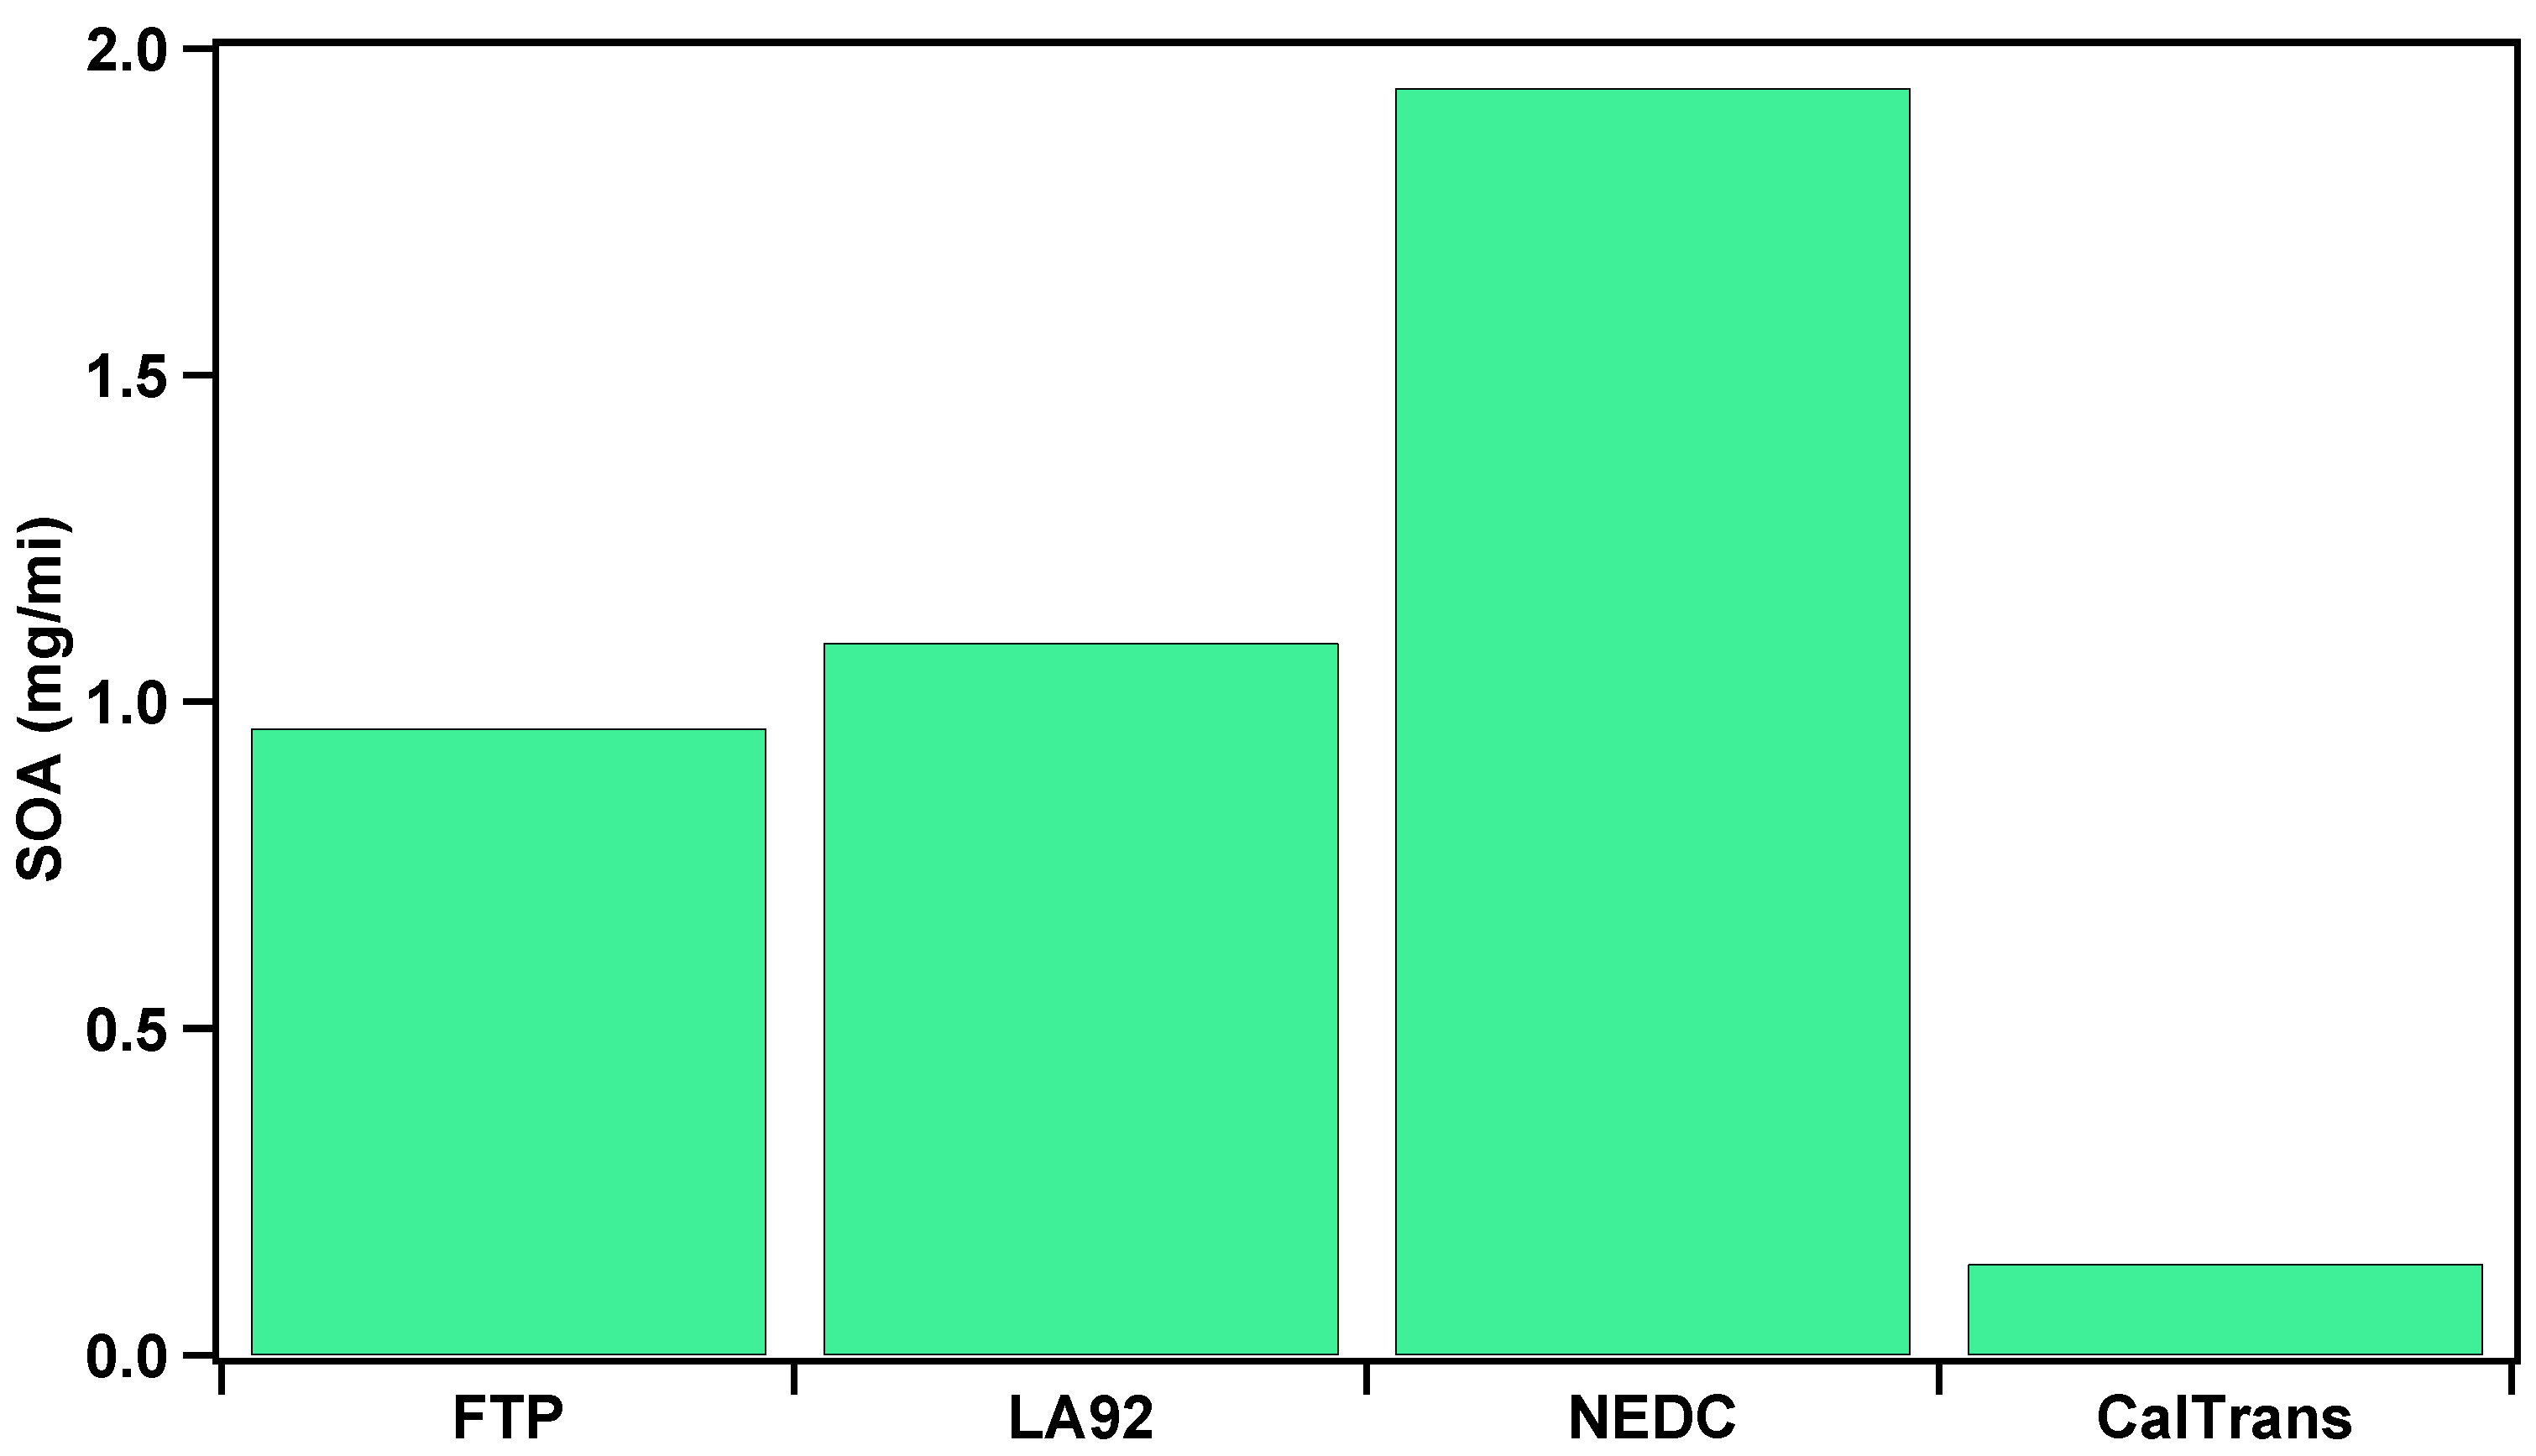
3.3. Total Secondary Aerosol Composition and SOA Formation

Figure 2 presents the aerosol composition for each driving cycle after 400 min of photooxidation in the chamber. The total aerosol particle emissions after the exposure of the exhaust to irradiation for the GDI vehicle over each cycle exceeded primary emissions due to the formation of secondary aerosol. Total aerosol for the FTP, LA92, NEDC, and Caltrans cycles was 1.6, 4.8, 1.6, and 3 times higher, respectively, than primary PM. Our findings are consistent with previous studies of gasoline vehicles operated over transient cycles or idling conditions [12,13,16,23,32]. For all cycles, at the end of the photooxidation experiments there was a significant growth of inorganic aerosol (ammonium and nitrate) along with organic aerosol. As shown in Figure S2 (SM), the ratio of NO3 to NH4 ions in the PM was consistently at 3.44 throughout the photooxidation period in the chamber, which indicates the almost all of the nitrate in the secondary aerosol was ammonium nitrate and the amount of organic nitrate in the chamber was negligible. Evidently, the highest growth of ammonium nitrate concentration in the chamber was observed for LA92 and Caltrans cycles, followed by FTP and NEDC. Ammonium nitrate accounted for more than 72% and 68% of the total secondary aerosol for the LA92 and Caltrans cycles, respectively, and about 7% and 18% for the NEDC and FTP. Previous studies have also shown elevated ammonium nitrate formation from the photooxidation of gasoline exhaust [11,12,13,24,31,41].
In urban areas, a major source of inorganic aerosol is due to the elevated NH3 emissions from gasoline vehicles equipped with TWCs [28]. Ammonia is generated via the catalytic reduction of nitric oxide (NO) and hydrogen (H2) produced through the water-gas shift reaction between CO and water [29]. Although not a regulated pollutant, vehicular NH3 emissions are known to enhance the formation of secondary inorganic aerosols [24,26,41]. Ammonia is strongly favored when the engine is running with rich air-fuel mixtures during acceleration events, where excess CO emissions also occurred [29]. While NH3 measurements were not available for this study, higher levels of CO emissions were seen for the more dynamic LA92 and Caltrans cycles, suggesting elevated NH3 emissions for these cycles [24,29]. The correlation of higher NH3 emission driving cycles with greater inorganic PM formation suggests that NH3 may be a limiting reagent for the formation of ammonium nitrate aerosol for the experiments over the LA92 and Caltrans cycles.
Figure 3 shows the SOA mass for the different driving cycles. Compared to ammonium nitrate, SOA does not account for a significant fraction of secondary aerosol. The results reported here agree with other studies on gasoline vehicles reported exceedances of ammonium nitrate formation compared to SOA [11,13,31]. For example, Vu et al. [13] reported significantly higher ammonium nitrate mass compared to SOA mass formed in a chamber from different GDI vehicles over the LA92 cycle. Kuittinen et al. [15] showed elevated formation of nitrate and ammonium aerosols due to the higher NOx and NH3 emissions, when they tested the same GDI vehicle used in the current study with an oxidation flow reactor over similar driving cycles. The largest SOA production was observed for NEDC (1.94 mg/mile), followed by LA92 (1.09 mg/mile), FTP (0.96 mg/mile), and Caltrans (0.14 mg/mile). These findings agree well with those of Kuittinen et al. [15] when they introduced the exhaust into an oxidation flow reactor as opposed to an environmental chamber. Thus, the different methods to determine the SOA potential of vehicle exhaust, i.e., oxidation flow reactor versus environmental chamber, can be used to detect differences in SOA precursor emissions. Differences in precursor emissions formation can include driving conditions as in the current study, or differences in engine technology, exhaust aftertreatment, and fuel composition. In this study, the cold-start cycles resulted in more SOA production than the hot-start Caltrans cycle due to the higher SOA precursor emissions that were generated when the engine was cold and the TWC not yet at operating temperature. This phenomenon is depicted in Figure S3 (SM), showing the positive correlation between SOA and tailpipe NMHC emissions, which was also observed in previous works [15,32]. The higher NMHC emissions and SOA production for the NEDC could be explained by the fact that the first acceleration hill for the NEDC occurred at 11 s from engine start, whereas for the FTP and LA92 at 23 s and 29 s, respectively. This caused a possible inefficient TWC heating period and a delay in the warm-up of the engine components (i.e., cylinders) during NEDC operation, causing more NMHC emissions at the tailpipe during the extended cold-start period.

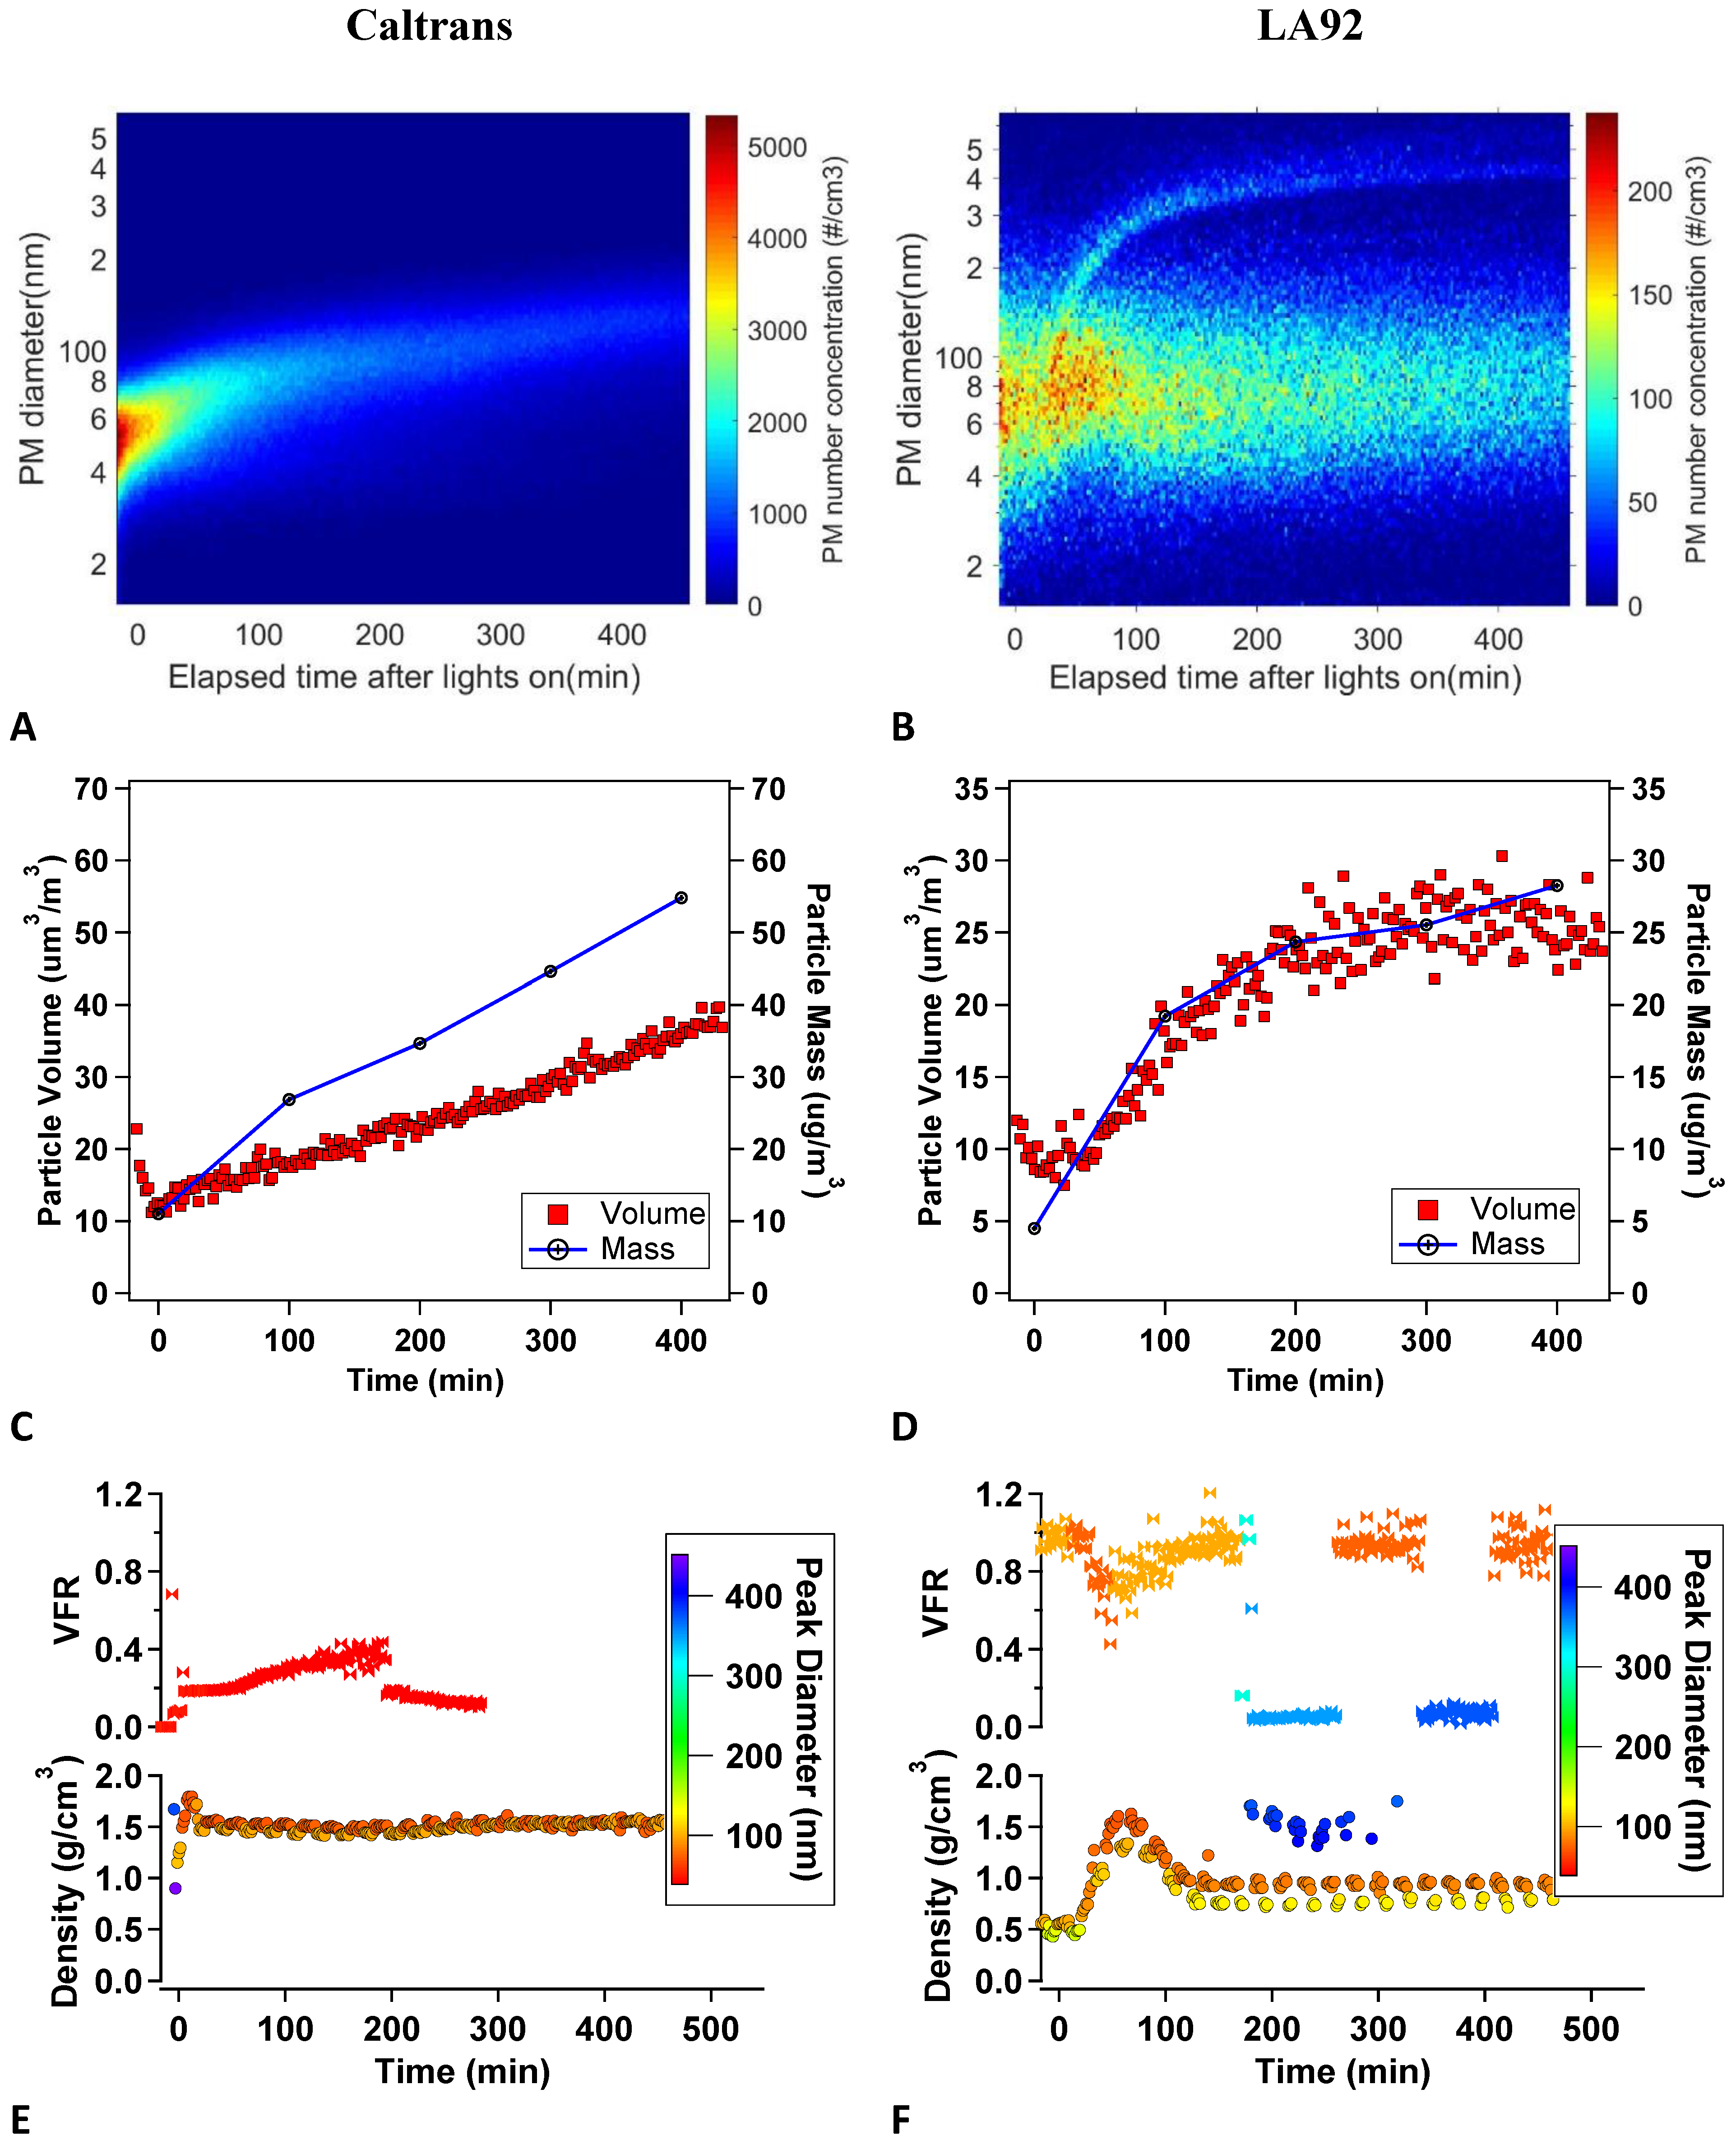
3.4. Particle Size Distributions and Composition

Figure 4 and Figure 5 show the particle size distribution and evolution during photooxidation in the chamber, the wall-loss corrected particle volume and mass concentrations, and particle density and VFR for the FTP and NEDC cycles, and the Caltrans and LA92 cycles, respectively. Note that VFR data was not available for the FTP and NEDC due to instrument availability. Results reported here on particle number and particle size growth during photooxidation in the chamber present three distinct cases; (1) no particle growth, (2) single particle growth, and (3) double particle peaks. For the first case (single peak with no growth), the FTP and NEDC showed no significant growth on peak particle size and number from primary particles to photochemically aged particles (Figure 4). The total wall-loss corrected particle concentrations remained at similar levels after about 400 min of photooxidation. Particle effective density showed an increase from 0.5 g/cm3 to 0.7–1.0 g/cm3, resulting in particle mass increases. Increasing density suggests that condensing organic and ammonium nitrate species may have filled voids in the primary aerosol by condensing into the fractal-shaped black carbon particles, filling void spaces and increasing aerosol mass, but not increasing electrical mobility diameter. For both the FTP and NEDC, there was very little new particle formation, while the existing particles grew after photooxidation in the chamber. Similar findings were observed in previous studies of gasoline vehicles and diesel engines [13,32,42].
For the second case (single peak with growth), a large population of primary particles was observed in the chamber for the Caltrans photooxidation experiments (Figure 5). Although the particle number decreased after photooxidation, the particles peak size continuously grew into larger sizes from about 50 nm to 100 nm in diameter. The VFR at 100 °C of the aerosol at the onset of the photooxidation was approximately 0.2, indicative of the aerosol composition being majorly volatile ammonium nitrate or volatile organics with a small fraction of lower volatility compounds, such as high molecular weight organics and black carbon. Some increases in VFR were seen from 0.2 to 0.4 from the condensation of lower volatility organic oxidation products. The density of 1.6 g/cm3 further indicates that the major composition of particles after photooxidation of the GDI exhaust during Caltrans operation was ammonium nitrate (1.73 g/cm3).
For the third case (double peak and double growth), two distinct particle peaks were seen for the LA92 cycle (Figure 5). This phenomenon has been previously reported for GDI vehicles when tested over the LA92 cycle using an environmental chamber [13,32]. The initial particle size peak remained relatively constant at 70 nm in diameter throughout the photooxidation experiment. A secondary particle peak appeared at about 30 min after the start of the photooxidation experiment, centered at about 400 nm. At the same time, total particle number concentration increased, indicating new particle formation and lower-volatility products forming in the chamber. These products likely condensed onto the newly formed particles instead of existing primary particles. These newly formed particles played an important role since their final size was about 5 to 6 times greater than those of the primary particles, leading to significantly higher single particle volume (125 to 216 times). Prior to the photooxidation process (UV lights of the chamber turned off), the density and VFR of peak particles in the range of 75–100 nm were ~0.5 g/cm3 and 1, respectively, indicating that the major composition of primary particles was non-volatile black carbon, agreeing with the bulk composition data shown in Figure 1. Between 30 and 100 min after the beginning of photooxidation, the density of particles with 100 nm diameter increased from 0.5 g/cm3 to 1.6 g/cm3, and then dropped and remained relatively constant at ~1.0 g/cm3. Within this timeframe, particles of 100 nm in diameter consisted of black carbon, organics, and ammonium nitrate. As the fraction of ammonium nitrate rapidly increased, the average density of particles with 100 nm diameter also increased. When ammonium nitrate particles grew larger than 100 nm in diameter, a second peak of particles appeared. For the second peak of particles, the VFR was 0 and density was at 1.5 g/cm3–1.7 g/cm3, which is consistent with ammonium nitrate, indicating the major composition of this peak is ammonium and nitrate. For the smaller particle peaks (100 nm particles), the fraction of ammonium nitrate in the smaller particle peak dropped over time as ammonium nitrate migrated to the larger particle peak, leading to a subsequent density drop in the smaller particle peak. The VFR of the smaller peak increased to 0.9 with a final density 0.7 g/cm3–1.0 g/cm3, indicating the smaller particles were a combination of black carbon and organics. It should be noted that the production of ammonium nitrate in the chamber for the larger particles dominated the total particle mass due to its larger density and significantly larger volume.

3.5. Ammonium Nitrate Condensation Experiments

To the best of our knowledge, the reasons behind why ammonium nitrate would nucleate into new particles instead of condensing onto existing black carbon particles are not well understood. A hypothesis was proposed that the high heat-absorbing properties of black carbon particles and high volatility of ammonium nitrate may cause the avoidance of ammonium nitrate condensing onto black carbon particles during photooxidation. Black carbon was the major component of particles at the onset of photooxidation and it tends to absorb more heat than other types of particles [43]. Therefore, the higher volatility ammonium nitrate instead of condensing onto ‘hot’ black carbon particles, tended to nucleate to form new particles. Therefore, for the better understanding of temperature impacts on ammonium nitrate formation mechanisms with the presence of black carbon, additional experiments were performed in a 10-m3 temperature-controlled chamber at 20 °C and 30 °C, respectively. In this experiment, black carbon was generated to the chamber by a Pramac 3.6 kW diesel generator following the same setup and experimental procedures described in Nakao et al. [42]. Ammonia and NOx were injected to the chamber as the precursors of ammonium nitrate formation.
Figure 6A–F shows the particle growth and bulk composition for the experiments at 20 °C and 30 °C, respectively. The particle size evolution is shown in Figure 6A,B, whereas the particle-size-dependent non-refractory particle bulk composition for the primary particles prior to the photooxidation and the particles after the photooxidation process are shown in Figure 6C–F, respectively. The primary black carbon particles were peaked at 100 nm before the beginning of the photooxidation at both temperature conditions (Figure 6A,B). Prior to the photooxidation process, while some organics were observed in the primary particles, their formation was insignificant compared to black carbon (Figure 6C,D). During photooxidation at both temperature conditions, a separate large particle peak was formed and levelled off at 400–500 nm in diameter besides the initial particle peak (Figure 6E,F). During photooxidation, the major fraction of particles at 400 nm was ammonium and nitrate, similar to the GDI vehicle exhaust experiments over the LA92 cycle. The initial black carbon peak growth was only seen at 20 °C, indicating that the smaller particle peak only grew at colder temperature conditions from the condensation of ammonium, nitrate, and organics (Figure 6A,B). For the chamber experiments at 20 °C, ammonium nitrate was detected for both the black carbon peak (dm/dlogDp = ~160 μg/m3) and the larger ammonium nitrate peak (dm/dlogDp = ~200 μg/m3). The increased condensation of ammonium nitrate onto black carbon particles at 20 °C can be explained by the greater driving force of ammonium nitrate formation at lower temperature conditions that enables ammonium nitrate condensation to overcome the resistance due to the heating of the black carbon core. These phenomena indicate that black carbon particles have the tendency to prevent the ammonium nitrate condensing onto them.
Diluted vehicle exhaust over all driving cycles was photooxidized at about 30 °C. There was no observation about the temperature influence on ammonium nitrate condensation onto black carbon for the first and second cases discussed earlier, since no significant ammonium nitrate was produced in the first case (operation over the FTP and NEDC) and very little amount of black carbon was detected in the primary emissions of the second case (operation over the Caltrans cycle). For the third case, which describes testing over the LA92, ammonium nitrate formation dominated secondary aerosol along with the presence of black carbon, indicating that the formation of ammonium nitrate was primarily through nucleation mechanisms rather than condensation at 30 °C. This finding can be verified by the particle number measurements in the chamber, which showed that intense nucleation would increase with particle number (Figure S4).

3.6. Atmospheric Relevance

Atmospheric secondary aerosol formation is a complex process depending on precursor and oxidant concentrations, reactions kinetics and environmental parameters such as temperature, humidity, and the amount of radiation. All of these parameters vary spatially and temporally, leading to the situation that laboratory experiments for secondary aerosol formation are challenging to conduct so that they represent exactly certain real-world environments. However, laboratory studies can produce information about how the emission sources differ from each other. In this study, we can conclude that experiments with the environmental chamber clearly showed the differences between the driving cycles and how they can significantly affect the potential of exhaust to cause secondary aerosol formation in the atmosphere. However, it should be noted that the real atmospheric processes and real secondary PM formed from the exhaust compounds strongly depend on environmental parameters.
Furthermore, laboratory studies conducted by environmental chambers can produce valuable information about the aerosol processes and indications of the phenomena that could occur in real atmosphere. This study showed extremely important observations that the absorption of radiation by black carbon particles can lead to significant changes in formation of secondary ammonium nitrate to particle phase. We showed that this kind of radiation-induced process can lead to formation of externally mixed aerosol, instead of internally mixed. This process can change the effects of resulted aerosol in respect of climate, but also in respect of human health. However, we emphasized that the understanding of all possible impacts of this observation requires more laboratory and real-world experiments.

4. Conclusions

This study explored the influence of driving cycles on the primary gaseous and particulate emissions, as well as on the formation of secondary aerosol using an environmental chamber from a GDI vehicle. Testing was conducted over duplicate FTP, LA92, and NEDC cycles, and on a non-regulated cycle that represents typical driving conditions in California highways (Caltrans cycle). Overall, the cold-start cycles showed higher THC, NMHC, CO, PM, and black carbon emissions than the hot-start Caltrans cycle. Total and solid particle number emissions were considerably higher during the cold-start periods primarily due to fuel wetting effects from non-evaporated fuel, which resulted in diffusive combustion and PM generation. Tailpipe PM composition was dominated by black carbon followed by organic material. Results revealed that total secondary aerosol mass exceeded primary PM mass. The formation of ammonium nitrate dominated secondary aerosol and it was found to be significantly higher compared to SOA formation for all test cycles. SOA precursor emissions (i.e., NMHC emissions) affected by the length of the cold-start period and the inefficient operation of the TWC not being able to oxidize these species.
Under the present test conditions and in previous works with vehicle exhaust we observed double peaks in the particle size distribution. Additional experiments were performed in this study to explain these phenomena and to prove that at higher temperatures (30 °C) with lights on, more ammonium nitrate tends to nucleate to new particles and form a distinct secondary peak in particle size distribution instead of condensing onto the heated black carbon particles. These findings are important in highlighting the temperature effects on ammonium nitrate formation in the chamber in the presence of black carbon leading to externally mixed particles within the chamber. In addition, our results indicate potential atmospheric implications with the formation of urban new ammonium nitrate particles during low temperatures (i.e., wintertime) favored by the tailpipe NH3 and NOx emissions from gasoline vehicles.
While this study presents some limitations by focusing on a single GDI vehicle, it provides valuable information on secondary aerosol formation from various driving conditions, as well as valuable insight on the formation mechanisms of ammonium nitrate aerosol. More research is necessary to better understand the impacts of different realistic driving conditions on precursor emissions and secondary aerosol formation from current technology vehicles, with more diverse powertrain designs such as vehicles equipped with port-fuel injection engines, diesel vehicles, and electric drive vehicles with different degrees of hybridization.

Supplementary Materials

The following supporting information can be downloaded at: https://www.mdpi.com/article/10.3390/atmos13030433/s1. Figure S1: Speed-time profiles of the driving cycles; Figure S2: Nitrate and ammonium concentrations in PM during photooxidation; Figure S3: Relationship between SOA emission factor versus tailpipe NMHC emissions; Figure S4: Wall-loss uncorrected particle number in the environmental chamber; Top panel (A) shows measurements for all driving cycles and bottom panel (B) shows measurements for the NEDC, LA92, and FTP only for improved readability.

Author Contributions

Conceptualization, G.K.; methodology, G.K., D.R.C. and T.R.; formal analysis, W.P., C.M. and N.K.; investigation, W.P., C.M. and N.K.; resources, G.K., D.R.C. and T.R.; data curation, W.P., D.R.C. and G.K.; writing—original draft preparation, W.P., D.R.C. and G.K.; writing—review and editing, G.K., D.R.C. and T.R.; project administration, G.K.; funding acquisition, G.K. All authors have read and agreed to the published version of the manuscript.

Funding

This research was funded by CARTEEH (Center for Advancing Research in Transportation Emissions, Energy, and Health), a US Department of Transportation’s University Transportation Center.

Institutional Review Board Statement

Not applicable.

Informed Consent Statement

Not applicable.

Data Availability Statement

The data reported in this study are available within the manuscript and in supplementary materials.

Acknowledgments

The authors thank Mark Villela and Daniel Gomez of the University of California, Riverside for their contribution in conducting testing for this research program.

Conflicts of Interest

The authors declare no conflict of interest. The funders had no role in the design of the study; in the collection, analyses, or interpretation of data; in the writing of the manuscript; or in the decision to publish the results.

References

  1. May, A.A.; Nguyen, N.T.; Presto, A.A.; Gordon, T.; Lipsky, E.M.; Karve, M.; Gutierrez, A.; Robertson, W.H.; Zhang, M.; Brandow, C.; et al. Gas- and particle-phase primary emissions from in-use, on-road gasoline and diesel vehicles. Atmos. Environ. 2014, 88, 247–260. [Google Scholar] [CrossRef]
  2. Pang, Y.; Fuentes, M.; Rieger, P. Trends in the emissions of Volatile Organic Compounds (VOCs) from light-duty gasoline vehicles tested on chassis dynamometers in Southern California. Atmos. Environ. 2014, 83, 127–135. [Google Scholar] [CrossRef]
  3. Bahreini, R.; Middlebrook, A.; de Gouw, J.; Warneke, C.; Trainer, M.; Brock, C.A.; Stark, H.; Brown, S.S.; Dube, W.P.; Gilman, J.B.; et al. Gasoline emissions dominate over diesel in formation of secondary organic aerosol mass. Geophys. Res. Lett. 2012, 39, L06805. [Google Scholar] [CrossRef] [Green Version]
  4. Jathar, S.H.; Woody, M.; Pye, H.O.T.; Baker, K.R.; Robinson, A.L. Chemical transport model simulations of organic aerosol in southern California: Model evaluation and gasoline and diesel source contributions. Atmos. Chem. Phys. 2017, 17, 4305–4318. [Google Scholar] [CrossRef] [PubMed] [Green Version]
  5. Platt, S.M.; El Haddad, I.; Pieber, S.M.; Zardini, A.A.; Suarez-Bertoa, R.; Clairotte, M.; Daellenbach, K.R.; Slowik, J.G.; Baltensperger, U.; Temime-Roussel, B.; et al. Gasoline cars produce more carbonaceous particulate matter than modern filter-equipped diesel cars. Sci. Rep. 2017, 7, 4926. [Google Scholar] [CrossRef]
  6. Robinson, A.L.; Donahue, N.M.; Shrivastava, M.K.; Weitkamp, E.A.; Sage, A.M.; Grieshop, A.P.; Lane, T.E.; Pierce, J.R.; Pandis, S.N. Rethinking organic aerosols: Semivolatile emissions and photochemical aging. Science 2007, 315, 1259–1262. [Google Scholar] [CrossRef]
  7. Jimenez, J.L.; Canagaratna, M.R.; Donahue, N.M.; Prevot, A.S.H.; Zhang, Q.; Kroll, J.H.; Decarlo, P.F.; Allan, J.D.; Coe, H.; Ng, N.L.; et al. Evolution of organic aerosols in the atmosphere. Science 2009, 326, 1525–1529. [Google Scholar] [CrossRef]
  8. Drozd, G.T.; Zhao, Y.; Saliba, G.; Frodin, B.; Maddox, C.; Oliver Chang, M.-C.; Maldonado, H.; Sardar, S.; Weber, R.J.; Robinson, A.L.; et al. Detailed speciation of intermediate volatility and semivolatile organic compound emissions from gasoline vehicles: Effects of cold-starts and implications for secondary organic aerosol formation. Environ. Sci. Technol. 2018, 53, 1706–1714. [Google Scholar] [CrossRef]
  9. Gentner, D.R.; Jathar, S.H.; Gordon, T.D.; Bahreini, R.; Day, D.A.; Haddad, I.E.; Haynes, P.L.; Pieber, S.M.; Platt, S.M.; De Gouw, J.; et al. Review of urban secondary organic aerosol formation from gasoline and diesel motor vehicle emissions. Environ. Sci. Technol. 2017, 51, 1074–1093. [Google Scholar] [CrossRef]
  10. Peng, J.; Hu, M.; Du, Z.; Wang, Y.; Zheng, J.; Zhang, W.; Yang, Y.; Qin, Y.; Zheng, R.; Xiao, Y.; et al. Gasoline aromatics: A critical determinant of urban secondary organic aerosol formation. Atmos. Chem. Phys. 2017, 17, 10743–10752. [Google Scholar] [CrossRef] [Green Version]
  11. Roth, P.; Yang, J.; Stamatis, C.; Barsanti, K.C.; Cocker, D.R., III; Durbin, T.D.; Asa-Awuku, A.; Karavalakis, G. Evaluating the relationships between aromatic and ethanol levels in gasoline on secondary aerosol formation from a gasoline direct injection vehicle. Sci. Total Environ. 2020, 737, 140333. [Google Scholar] [CrossRef] [PubMed]
  12. Gordon, T.D.; Presto, A.A.; May, A.A.; Nguyen, N.T.; Lipsky, E.M.; Donahue, N.M.; Gutierrez, A.; Zhang, M.; Maddox, C.; Rieger, P.; et al. Secondary organic aerosol formation exceeds primary particulate matter emissions for light-duty gasoline vehicles. Atmos. Chem. Phys. 2014, 14, 4661–4678. [Google Scholar] [CrossRef] [Green Version]
  13. Vu, D.; Roth, P.; Berte, T.; Yang, J.; Cocker, D.; Durbin, T.D.; Karavalakis, G.; Asa-Awuku, A. Using a new Mobile Atmospheric Chamber (MACh) to investigate the formation of secondary aerosols from mobile sources: The case of gasoline direct injection vehicles. J. Aerosol Sci. 2019, 133, 1–11. [Google Scholar] [CrossRef]
  14. Herrington, J.S.; Hays, M.D.; George, B.J.; Baldauf, R.W. The effects of operating conditions on semivolatile organic compounds emitted from light-duty, gasoline-powered motor vehicles. Atmos. Environ. 2012, 54, 53–59. [Google Scholar] [CrossRef]
  15. Kuittinen, N.; McCaffery, C.; Peng, W.; Zimmerman, S.; Roth, P.; Simonen, P.; Karjalainen, P.; Keskinen, J.; Cocker, D.R.; Durbin, T.D.; et al. Effects of driving conditions on secondary aerosol formation from a GDI vehicle using an oxidation flow reactor. Environ. Pollut. 2021, 282, 117069. [Google Scholar] [CrossRef] [PubMed]
  16. Platt, S.M.; El Haddad, I.; Zardini, A.A.; Clairotte, M.; Astorga, C.; Wolf, R.; Slowik, J.G.; Temime-Roussel, B.; Marchand, N.; Ježek, I.; et al. Secondary organic aerosol formation from gasoline vehicle emissions in a new mobile environmental reaction chamber. Atmos. Chem. Phys. 2013, 13, 9141–9158. [Google Scholar] [CrossRef] [Green Version]
  17. Nordin, E.Z.; Eriksson, A.C.; Roldin, P.; Nilsson, P.T.; Carlsson, J.E.; Kajos, M.K.; Hellén, H.; Wittbom, C.; Rissler, J.; Löndahl, J.; et al. Secondary organic aerosol formation from idling gasoline passenger vehicle emissions investigated in a smog chamber. Atmos. Chem. Phys. 2013, 13, 6101–6116. [Google Scholar] [CrossRef] [Green Version]
  18. Simonen, P.; Kalliokoski, J.; Karjalainen, P.; Rönkkö, T.; Timonen, H.; Saarikoski, S.; Aurela, M.; Bloss, M.; Triantafyllopoulos, G.; Kontses, A.; et al. Characterization of laboratory and real driving emissions of individual Euro 6 light-duty vehicles—Fresh particles and secondary aerosol for-mation. Environ. Pollut. 2019, 255, 113175. [Google Scholar] [CrossRef]
  19. Zimmerman, N.; Rais, K.; Jeong, C.-H.; Pant, P.; Delgado-Saborit, J.M.; Wallace, J.S.; Evans, G.J.; Brook, J.R.; Pollitt, K.J.G. Carbonaceous aerosol sampling of gasoline direct injection engine exhaust with an integrated organic gas and particle sampler. Sci. Total Environ. 2019, 652, 1261–1269. [Google Scholar] [CrossRef]
  20. Miersch, T.; Czech, H.; Stengel, B.; Abbaszade, G.; Orasche, J.; Sklorz, M.; Streibel, T.; Zimmermann, R. Composition of car-bonaceous fine particulate emissions of a flexible fuel DISI engine under high velocity and municipal conditions. Fuel 2019, 236, 1465–1473. [Google Scholar] [CrossRef]
  21. Zhang, Y.; Deng, W.; Hu, Q.; Wu, Z.; Yang, W.; Zhang, H.; Wang, Z.; Fang, Z.; Zhu, M.; Li, S.; et al. Comparison between idling and cruising gasoline vehicles in primary emissions and secondary organic aerosol formation during photochemical ageing. Sci. Total Environ. 2020, 722, 137934. [Google Scholar] [CrossRef]
  22. Zhao, Y.; Lambe, A.T.; Saleh, R.; Saliba, G.; Robinson, A.L. Secondary organic aerosol production from gasoline vehicle exhaust: Effects of engine technology, cold start, and emission certification standard. Environ. Sci. Technol. 2018, 52, 1253–1261. [Google Scholar] [CrossRef] [PubMed]
  23. Karjalainen, P.; Timonen, H.; Saukko, E.; Kuuluvainen, H.; Saarikoski, S.; Aakko-Saksa, P.; Murtonen, T.; Dal Maso, M.; Ahl-berg, E.; Svenningsson, B.; et al. Time-resolved characterization of primary and secondary particle emissions of a modern gasoline passenger car. Atmos. Chem. Phys. 2016, 16, 8559–8570. [Google Scholar] [CrossRef] [Green Version]
  24. Link, M.F.; Kim, J.; Park, G.; Lee, T.; Park, T.; Bin Babar, Z.; Sung, K.; Kim, P.; Kang, S.; Kim, J.S.; et al. Elevated production of NH 4 NO 3 from the photochemical processing of vehicle exhaust: Implications for air quality in the Seoul Metropolitan Region. Atmos. Environ. 2017, 156, 95–101. [Google Scholar] [CrossRef]
  25. Pusede, S.E.; Duffey, K.C.; Shusterman, A.A.; Saleh, A.; Laughner, J.L.; Wooldridge, P.J.; Zhang, Q.; Parworth, C.L.; Kim, H.; Capps, S.L.; et al. On the effectiveness of nitrogen oxide reductions as a control over ammonium nitrate aerosol. Atmos. Chem. Phys. 2016, 16, 2575–2596. [Google Scholar] [CrossRef] [Green Version]
  26. Nowak, J.B.; Neuman, J.; Bahreini, R.; Middlebrook, A.; Holloway, J.S.; McKeen, S.A.; Parrish, D.D.; Ryerson, T.B.; Trainer, M. Ammonia sources in the California South Coast Air Basin and their impact on ammonium nitrate formation: South coast air basin ammonia sources. Geophys. Res. Lett. 2012, 39, L07804. [Google Scholar] [CrossRef]
  27. Kim, M.J. Sensitivity of nitrate aerosol production to vehicular emissions in an urban street. Atmosphere 2019, 10, 212. [Google Scholar] [CrossRef] [Green Version]
  28. Sun, K.; Tao, L.; Miller, D.J.; Pan, D.; Golston, L.; Zondlo, M.A.; Griffin, R.J.; Wallace, H.W.; Leong, Y.J.; Yang, M.M.; et al. Vehicle emissions as an important urban ammonia source in the United States and China. Environ. Sci. Technol. 2017, 51, 2472–2481. [Google Scholar] [CrossRef]
  29. Suarez-Bertoa, R.; Zardini, A.; Astorga, C. Ammonia exhaust emissions from spark ignition vehicles over the new European driving cycle. Atmos. Environ. 2014, 97, 43–53. [Google Scholar] [CrossRef]
  30. Roth, P.; Yang, J.; Peng, W.; Cocker III, D.R.; Durbin, T.D.; Asa-Awuku, A.; Karavalakis, G. Intermediate and high ethanol blends reduce secondary organic aerosol formation from gasoline direct injection vehicles. Atmos. Environ. 2020, 220, 117064. [Google Scholar] [CrossRef]
  31. Tkacik, D.S.; Lambe, A.T.; Jathar, S.; Li, X.; Presto, A.; Zhao, Y.; Blake, D.; Meinardi, S.; Jayne, J.T.; Croteau, P.L.; et al. Secondary organic aerosol formation from in-use motor vehicle emissions using a potential aerosol mass reactor. Environ. Sci. Technol. 2014, 48, 11235–11242. [Google Scholar] [CrossRef] [PubMed] [Green Version]
  32. Roth, P.; Yang, J.; Fofie, E.; Cocker, D.R.; Durbin, T.D.; Brezny, R.; Geller, M.; Asa-Awuku, A.; Karavalakis, G. Catalyzed gasoline particulate filters reduce secondary organic aerosol production from gasoline direct injection vehicles. Environ. Sci. Technol. 2019, 53, 3037–3047. [Google Scholar] [CrossRef] [PubMed]
  33. Malloy, Q.G.J.; Nakao, S.; Qi, L.; Austin, R.; Stothers, C.; Hagino, H.; Cocker, D.R. Real-time aerosol density determination utilizing a modified scanning mobility particle sizer—Aerosol particle mass analyzer system. Aerosol Sci. Technol. 2009, 43, 673–678. [Google Scholar] [CrossRef] [Green Version]
  34. Cocker, D.R.; Flagan, R.C.; Seinfeld, J.H. State-of-the-art chamber facility for studying atmospheric aerosol chemistry. Environ. Sci. Technol. 2001, 35, 2594–2601. [Google Scholar] [CrossRef] [PubMed]
  35. Yang, J.; Roth, P.; Ruehl, C.R.; Shafer, M.M.; Antkiewicz, D.S.; Durbin, T.D.; Cocker, D.; Asa-Awuku, A.; Karavalakis, G. Physical, chemical, and toxicological characteristics of particulate emissions from current technology gasoline direct injection vehicles. Sci. Total Environ. 2019, 650, 1182–1194. [Google Scholar] [CrossRef] [PubMed] [Green Version]
  36. Saliba, G.; Saleh, R.; Zhao, Y.; Presto, A.A.; Lambe, A.T.; Frodin, B.; Sardar, S.; Maldonado, H.; Maddox, C.; May, A.; et al. Comparison of Gasoline Direct-Injection (GDI) and Port Fuel Injection (PFI) vehicle emissions: Emission certification standards, cold-start, secondary organic aerosol formation potential, and potential climate impacts. Environ. Sci. Technol. 2017, 51, 6542–6552. [Google Scholar] [CrossRef]
  37. Pirjola, L.; Karjalainen, P.; Heikkilä, J.; Saari, S.; Tzamkiozis, T.; Ntziachristos, L.; Kulmala, K.; Keskinen, J.; Rönkkö, T. Effects of fresh lubricant oils on particle emissions emitted by a modern gasoline direct injection passenger car. Environ. Sci. Technol. 2015, 49, 3644–3652. [Google Scholar] [CrossRef]
  38. Chen, L.; Liang, Z.; Zhang, X.; Shuai, S. Characterizing particulate matter emissions from GDI and PFI vehicles under transient and cold start conditions. Fuel 2017, 189, 131–140. [Google Scholar] [CrossRef]
  39. Duronio, F.; De Vita, A.; Montanaro, A.; Villante, C. Gasoline direct injection engines—A review of latest technologies and trends. Part 2. Fuel 2020, 265, 116947. [Google Scholar] [CrossRef]
  40. Bahreini, R.; Xue, J.; Johnson, K.; Durbin, T.; Quiros, D.; Hu, S.; Huai, T.; Ayala, A.; Jung, H. Characterizing emissions and optical properties of particulate matter from PFI and GDI light-duty gasoline vehicles. J. Aerosol Sci. 2015, 90, 144–153. [Google Scholar] [CrossRef]
  41. Liu, T.; Wang, X.; Deng, W.; Zhang, Y.; Chu, B.; Ding, X.; Hu, Q.; He, H.; Hao, J. Role of ammonia in forming secondary aerosols from gasoline vehicle exhaust. Sci. China Ser. B Chem. 2015, 58, 1377–1384. [Google Scholar] [CrossRef]
  42. Nakao, S.; Shrivastava, M.; Nguyen, A.; Cocker, D., III. Interpretation of secondary organic aerosol formation from diesel exhaust photooxidation in an environmental chamber. Aerosol Sci. Technol. 2011, 45, 964–972. [Google Scholar] [CrossRef] [Green Version]
  43. Bond, T.C.; Doherty, S.J.; Fahey, D.W.; Forster, P.M.; Berntsen, T.; DeAngelo, B.J.; Flanner, M.G.; Ghan, S.J.; Kärcher, B.; Koch, D.; et al. Bounding the role of black carbon in the climate system: A scientific assessment. J. Geophys. Res. Atmos. 2013, 118, 5380–5552. [Google Scholar] [CrossRef]
Figure 1. Tailpipe PM emissions composition.
Atmosphere 13 00433 g001
Figure 2. PM mass composition after 400 min of photooxidation in the environmental chamber.
Atmosphere 13 00433 g002
Figure 3. SOA mass formation after 400 min of photooxidation in the environmental chamber.
Atmosphere 13 00433 g003
Figure 4. Real-time particle size distributions for the FTP (A) and NEDC cycles (B), wall-loss uncorrected particle volume and wall-loss corrected particle mass for the FTP (C) and NEDC (D), and volume fraction remaining (VFR) and effective density of particles for the FTP (E) and NEDC (F).
Atmosphere 13 00433 g004
Figure 5. Real-time particle size distributions for the Caltrans (A) and LA92 cycles (B), wall-loss uncorrected particle volume and wall-loss corrected particle mass for the Caltrans (C) and LA92 (D), and volume fraction remaining (VFR) and effective density of particles for the Caltrans (E) and LA92 (F).
Atmosphere 13 00433 g005
Figure 6. Particle size distribution for experiments conducted at 30 °C and 20 °C (A,B) and bulk composition of non-refractory particles before (C,D) and at the end of photooxidation (E,F) at 30 °C and 20 °C.
Atmosphere 13 00433 g006
Table 1. Tailpipe gaseous and particulate emissions over the different driving cycles.
LA92FTPNEDCCaltrans
Cold-StartHot-RunningHot-StartWeightedCold-StartHot-RunningHot-StartWeightedUDCEUDCWeighted
THC (g/mile)0.0910.0020.0100.0080.0900.0020.0030.0200.1510.0030.0580.004
NMHC (g/mile)0.0700.002−0.0040.0050.0720.0000.0000.0150.1230.0030.0470.003
CO (g/mile)1.2270.2761.0370.3790.9000.1240.2020.3061.5240.1600.6600.859
NOx (g/mile)0.0340.0110.0030.0120.0130.0030.0050.0060.0150.0020.0070.004
PM Mass (mg/mile)---2.85---5.53--8.762.19
Black Carbon (mg/mile)21.550.920.261.9520.630.440.831.2915.980.303.791.69
Total Particle Number (particles/mile)1.39 × 10131.37 × 10126.02 × 10112.09 × 10121.43 × 10131.23 × 10121.67 × 10124.34 × 10121.13 × 10136.78 × 10114.57 × 10123.93 × 1012
Solid Particle Number (particles/mile)1.42 × 10131.23 × 10124.80 × 10111.97 × 10121.09 × 10131.01 × 10121.44 × 10123.41 × 10121.07 × 10135.38 × 10114.26 × 10127.38 × 1011
Publisher’s Note: MDPI stays neutral with regard to jurisdictional claims in published maps and institutional affiliations.

