1. Introduction
Private vehicle ownership has greatly expanded in recent decades, with total annual U.K. vehicle miles increasing from 124.6 to 356.5 billion from 1970 to 2019 [
1]. The transport sector remains the largest contributor to U.K. domestic greenhouse gas (GHG) emissions, responsible for 34% of carbon dioxide (CO
2) in 2019, the majority due to private vehicle usage. The achievement of rapid and accelerated transport sector decarbonisation towards legally binding net zero targets is a key national government priority, with the Net Zero Strategy setting a goal of ending the sale of new petrol and diesel cars and vans by 2030 and a requirement that all vehicles will have zero tailpipe emissions by 2035 [
2]. Yet, achieving an emissions reduction in the transport sector presents a complex global public policy challenge, with benefits of technological advances offset by an increasing population and economic growth, and a rising demand for the movement of people, goods, and services [
3].
Private vehicle dependency is also widely recognised to cause significant health harms at individual, community, and national levels. Compared to other modes of transport, these include increased direct risks of physical injury and death, and exposure to air and noise pollution, as well as influences on physical inactivity, community severance and wider environmental and socio-economic consequences of their effects on climate change [
4]. Replacing car travel with walking and cycling (active travel) could significantly reduce risks of premature mortality and morbidity from cardiovascular disease, obesity, diabetes, osteoporosis and lung cancer [
5]. Traffic congestion, generated during periods in which traffic volume exceeds road capacity, is also consistently linked to poor mental health outcomes, including risks of depression, stress, anxiety, and lack of family cohesion [
6].
It is also increasingly recognised that transport, air quality, climate change and health have complex related linkages, enacted over short- and long-term time horizons. Failure to adequately identify these links can lead to unintended public policy consequences in the longer term. Climate mitigation initiatives enacted to address climate change in the early 2000s, including promotion of fuel-efficient diesel vehicles, subsequently contributed to increased health risks arising from nitrogen dioxide (NO
2) exposure in urban areas [
7]. Although the planned phasing out of petrol and diesel (Internal Combustion Engine—ICE) vehicles results in clear benefits by reducing NO
2 exposure, non-exhaust emissions (NEEs), including particulate matter (PM), continue to pose significant health risks and additional mitigation efforts are required [
8]. Targeted place-based emissions control policies, e.g., Clean Air Zones, are intended to reduce ambient NO
2 concentrations and achieve legal compliance with U.K. air quality objectives; however, broader impacts on PM concentrations, travel behaviours and public health outcomes remain uncertain. It is therefore critical that transport decarbonisation policies are holistic and synergistic, optimising co-benefits and avoiding trade-offs for both air quality and public health. For this to be possible, potential paths of causal interaction between policy and broader outcomes must be understood and account in policy making.
Transport systems are embedded in and interact with social, economic, political, environmental, and physical systems composed of multiple interacting factors. The impacts of policy initiatives on health and air quality cannot therefore be considered separately to their physical, geographical, social, cultural, political, and economic contexts. Such complex, socio-technical systems are highly interconnected and interdependent systems with multiple interactions and feedbacks between their components. There are frequently unanticipated indirect effects on other parts of such systems when policies or interventions are applied to them [
9]. If we wish to understand these effects at the policy formulation and appraisal stage, we need to identify these links and interdependencies, to enable beneficial outcomes to be optimised and unintended negative consequences to be mitigated.
Characterising these multiple outcomes requires a methodological approach, which provides a broader whole-systems picture of surface transport systems [
10]. Understanding probable causal connections between ‘system factors’ (i.e., anything that is considered to be important in how the system behaves) allows us to trace possible indirect impacts of transport policy intervention or change, such as those that incentivise an increased uptake and/or usage of electric vehicles (EVs) in preference to ICE vehicles. Practical knowledge of these connections is often distributed amongst diverse stakeholders, including those with operational, on the ground knowledge, such as transport operators and users, as well as those who would not typically be directly engaged with policymakers. This means that a complete picture of the system complexity is not typically brought to bear on decision making processes. To capture this knowledge, we use a qualitative participatory modelling approach to work with stakeholders in creating a shared formalised representation of their system [
11,
12]. Specifically, Participatory Mapping (PSM), which provides us with a means to capture and integrate these diverse types of systems knowledge, to provide a fuller whole systems picture of factors and their interconnections that can be analysed to support the policymaking process.
Adopting such a whole systems approach also provides an opportunity to assess or ‘stress test’ policies at an early stage, therefore avoiding potentially harmful or costly negative consequences occurring at implementation or beyond. This approach is also particularly suitable for those settings in which empirical or quantitative data to validate or parameterise causal connections are not available, are inaccessible, or relate to parameters that are believed to be important, but are challenging to quantify, and in which expert domain knowledge exists that may be utilised for system characterisation. The rapid consolidation and integration of diverse knowledge also enables the complexity and interconnectedness of a system to be explored by policymakers using an accessible visual format.
Our primary aim is to create a participatory systems map of the existing U.K. personal surface transportation system that integrates knowledge from a diverse range of stakeholders to generate a fuller ‘whole systems’ picture. Ultimately, we seek to identify potential unanticipated consequences or indirect effects of contemporary transport decarbonisation policies, including negative outcomes for air quality and health. The rationale for this research, and PSM as the selected approach, is the central importance of the transport system in achieving U.K. net zero targets, alongside the recognition of the system’s complexity and potential to deliver multiple social, economic, and public health benefits. In addition, many important social, behavioural and on-the-ground aspects of the system’s function are not currently captured in empirical models or incorporated into policy thinking, due to both a lack of available data, but also simply a narrow focus in decision making. PSM has been successfully used in the U.K. government in a number of policy domains, which share similar properties of complexity, multiple interconnected domains and lack of empirical data or focus on important parts of the system, and in which trade-offs between different outcomes or stakeholder interests may need to be negotiated, for example, agriculture and environmental land management, energy security and carbon emissions, mobility as a service, the local management of marine resources and water catchment governance [
13,
14,
15,
16,
17,
18].
We present initial findings from this novel PSM application, visually characterising linkages within the U.K. surface transport system. Map construction allowed us to focus on capturing the interactions and trade-offs between carbon emissions, air quality, health impacts and inequalities. Map analysis, by a combination of causal tracing and network centrality analysis, allowed us to selectively identify the potential indirect effects of EV-focussed transport policies, including how these might impact on air quality, health, community severance and liveability, and the suggested causal pathways by which they do so. We also consider the potential negative implications of these changes for physical and mental health and the broader implications for public transport financial viability due to increased traffic congestion in the long term. Finally, we discuss the potentially disproportionate distribution of policy impacts across vulnerable population sub-groups and the effect on health inequity in the U.K.
3. Results
3.1. The Surface Transport Systems Map
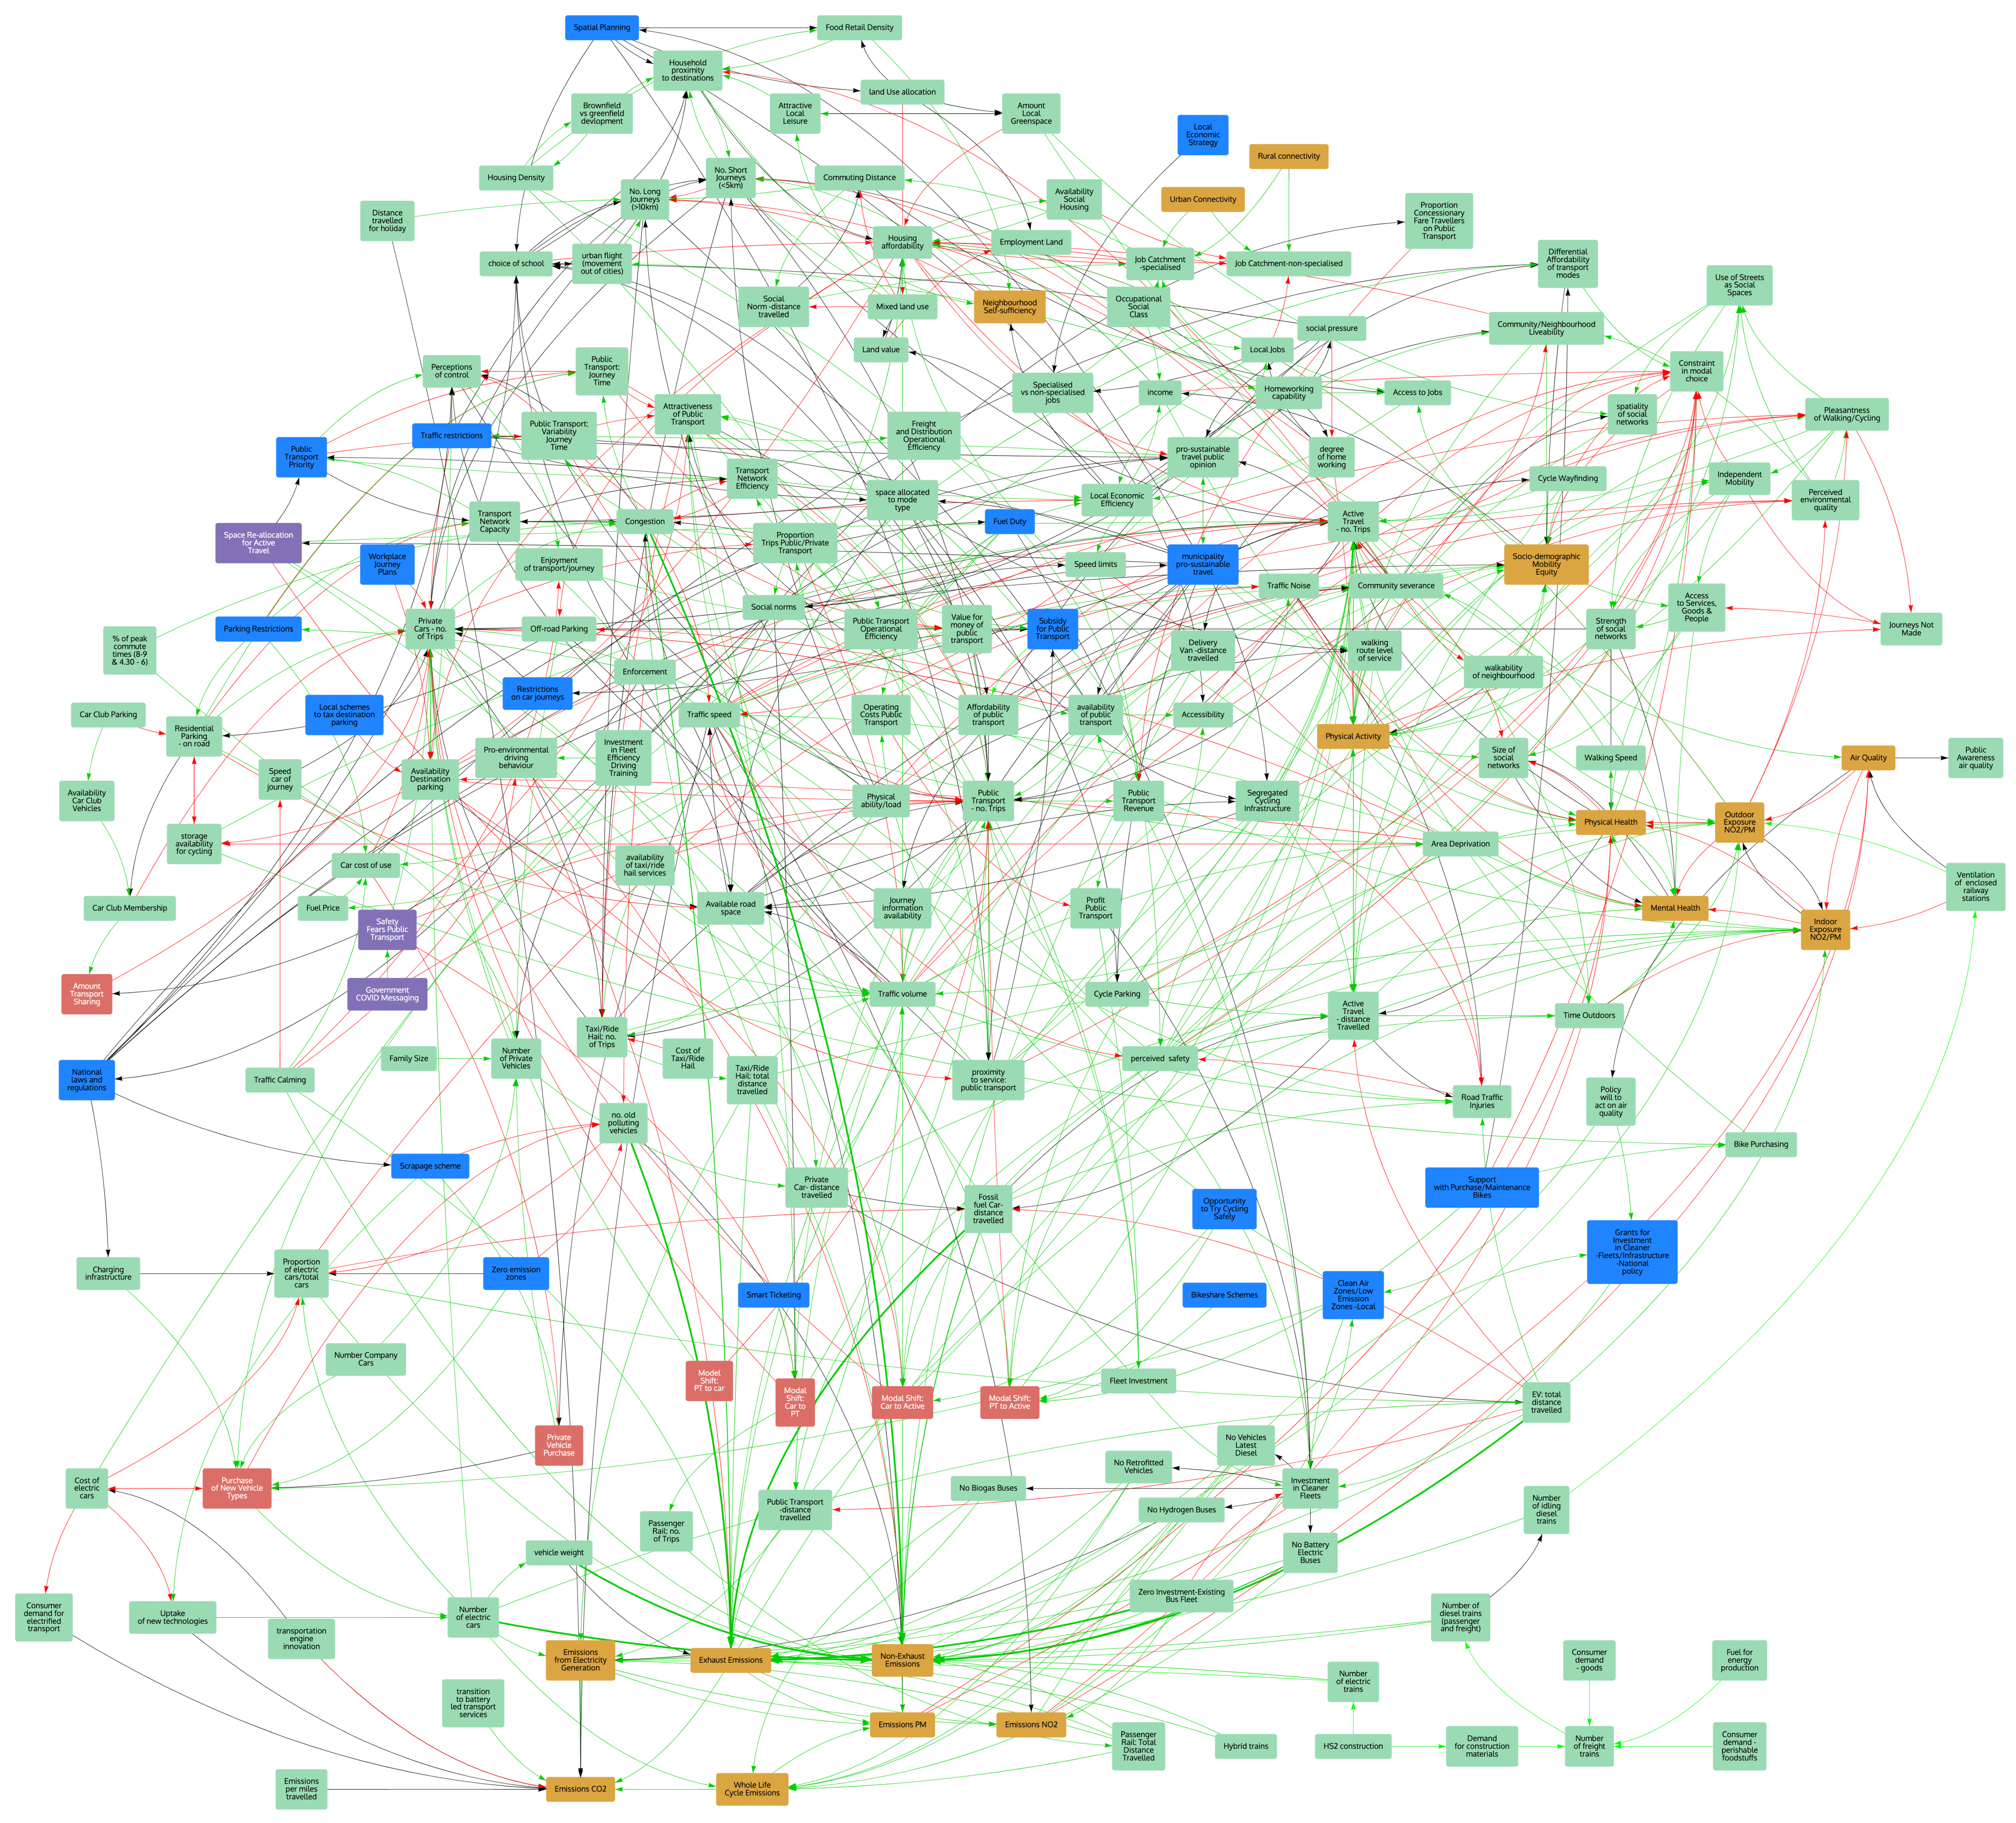
Figure 1 shows the full systems map generated as of 28 January 2022. The complete map may be accessed online at:
https://www.prsm.uk/prsm.html?room=OIH-PEX-URN-LFV (accessed on 28 January 2022). The factors are colour coded: the important system functions or outcomes are orange, general factors are green, factors relevant to the government’s Transport Decarbonisation Plan are red, factors that relate to policy, regulation or local authority influences are blue, and COVID-19-impacted factors are purple. Factors are connected by causal links (arrows) indicating a mechanism connecting them. The direction of the arrows indicates the causal flow. Green indicates a positive relationship; if one factor increases or decreases, then so does the other. Red indicates a negative relationship; if one factor increases, then the other decreases and vice versa. Black arrows indicate connections that were felt to be either uncertain or complex, for example, with thresholds contingent on other circumstances. Links here for the most part only show that a causal connection exists. However, the effects that were felt to be particularly strong are highlighted with thicker lines. Activities, technologies or modes that produce an emission of some kind are represented as having a positive causal link to that emission. This reflects the fact that emissions are considered in this paper in absolute rather than relative terms. A lower, but non-zero, emissions technology does not decrease emissions, but increases them to a lesser extent.
3.2. Map Analysis: Overview
As described in
Section 2.1, a full PSM analysis involves the flexible combination of network centrality and causal flow information combined with stakeholder information on factors in order to answer context-specific questions. This bespoke analysis ideally forms part of an ongoing collaborative process with stakeholders, in which we iteratively develop analysis tools and questions for the intersection between what is possible, what they want to explore in their system and what sorts of insights would be most usable in practice (for example, in a policy context). For this paper, we are presenting the results of a first-pass analysis, which has not yet been presented to stakeholders. However, this still allows us to explore important themes in the systems map, which address the interests of the Special Issue.
Drawing from the typology presented in
Table 1, we used downstream analysis to explore the potential indirect effects of changes to the system that the current EV policy aims to promote: an increased number of electric cars and an increase in the distance travelled by EVs. We then identified the key potential impacts of increased EV use from these downstream maps. Additionally, using the maps as a tool for system exploration, we began to follow the causal flows downstream from these factors, digging deeper into the potential effects. In the present study, we examine congestion and discuss its potential impacts.
Then, switching direction, we used upstream analysis to examine what might be the influencing key outcomes in the system that are not the direct focus of the decarbonisation policy, but, nevertheless, are important societal outcomes connected to the transportation system. We pull out and discuss the potential influences on physical health, PM emissions and socio-demographic mobility equity. Although we believe that the map has some structural biases due to the nature of the online process, we also performed a preliminary network centrality analysis to determine what factors are most structurally important in the map as it stands.
A staged causal flow and network structure analysis of this map illustrates well the power of this method, and of interactive mapping tools. That is, to allow the exploration of a system and the progressive uncovering of new directions for map exploration as one ‘travels’ through the map along causal pathways, how a broader system context and implications of that can be made visible to stakeholders, and, ultimately, how this allows us to generate new questions for investigation, highlight where we have knowledge gaps and reflect on how we might need to reframe our approaches and thinking for a systems context. The analysis and discussion below and the subsequent suggestions of new questions that could be addressed through the mapping, or in other further work, illustrate a stage in this exploratory process rather than providing definitive predictions or answers.
The key considerations when exploring a map include:
Are the factors that matter in a path or paths downstream from a change and, hence, can they be impacted?
Are these factors likely to be driven up or down by expected change, following the signs of the whole path?
Are multiple important factors affected and are they driven in the same or opposing directions?
Are there unexpected impacts of change?
Looking upstream from an important factor, look at what influences it and how it is likely to be driven. Is it being pushed in opposing directions by different drivers? Are its influences supported or vulnerable to change? Who controls its different influences? Is it impacted by unexpected factors?
For all analyses, check to see whether feedback loops are present. Are these reinforcing change (positive overall) or suppressing change (negative overall)?
Are there hub factors through which many paths of influence travel? Are these controllable or subject to change? Who controls them? Are they vulnerabilities or potential levers to use? Are they being driven in multiple different directions or supported by many inputs pushing in the same direction?
3.3. Downstream Map Analysis: What Do Interventions or System Changes Influence?
3.3.1. Downstream Map Analysis: Electric Vehicles—Total Distance Travelled
We explored the downstream linkages of EV distance travelled to generate insights into the potential impacts of policies that incentivise the increased uptake and/or usage of EVs in the U.K., as presented in
Figure 2. Looking at direct connections, we observe a mixture of factors that would be influenced by any mode, although potentially weighted differently, and those that are specific to EVs. An increase in EV distance travelled has a strong positive influence on NEEs and, as for any mode, potentially increases indoor exposure to NO
2 and PM pollution (although note the uncertainty around this point discussed below) and road traffic injuries. Impacts specific to EVs are emissions from electricity generation, a decrease in ICE vehicle distance-travelled cars, and decreases in public transport and active travel distance travelled, as people switch to using their EVs.
The complex interplay between NO2 emissions from ICE vehicles and PM emissions from EVs is already visible here. Although we can observe a strong positive influence on NEEs, and a potential increase in indoor exposure to NO2 and PM pollution (due to increased time spent in vehicles) as EV travel increases, the map shows a simultaneous overall negative effect on exhaust emissions as ICE car travel decreases. However, our consideration of air quality co- and dis-benefits should not be confined to pollutant emissions arising directly from EV operation, but should include those throughout the whole life cycle, including electricity-generation processes. This is highlighted by the direct causal connection to emissions from electricity generation.
We also observe a direct relationship with an increased risk of road traffic injuries, again not specific to EV-powered vehicle technology (it also exists for ICE vehicles). There is limited empirical data about the relative risks of EVs, given the differences in driving characteristics and the potential risks to vulnerable road users (e.g., pedestrians, pedal cyclists, and horse riders) due to lesser vehicle noise, despite noise policy mitigation measures, such as EV warning sounds [
33].
More complex indirect impacts of EVs on physical and mental health are also identified, due to the reductions in physical activity levels as a result of fewer miles travelled by active modes (e.g., walking and cycling). These changes in travel behaviours increase chronic disease risks (e.g., cardiovascular morbidity and mortality) alongside negative impacts upon mental health due to the reduced time spent in outdoor environments [
34]. Although the map shows a reduction in outdoor exposure to emissions and thus potential health benefits from reduced active travel, evidence suggests that exposure to both NO
2 and fine/coarse particles is higher for car users compared to active travel commuters, due to an increased proximity to traffic and high air interchange [
35]. Physical activity benefits arising from active commuting also exceed any dis-benefit arising from an increased inhaled dose of fine particles in most settings [
36]. Further, evidence suggests those who travel to work by active and public modes of transport have a significantly lower BMI and body fat than counterparts using private transport [
37]. Increased EV mileage, notably if arising from a modal shift to EV (car) travel from active and public transport modes, therefore has negative impacts on physical activity and obesity at a population level. More broadly, it is also apparent from the downstream map that increased EV vehicle mileage contributes to wider impacts on social networks and connectivity, including the reduced liveability and walkability in local areas, and a decreased use of public spaces, with negative implications for community cohesion, physical and mental wellbeing.
3.3.2. Downstream Map Analysis: Number of Electric Cars
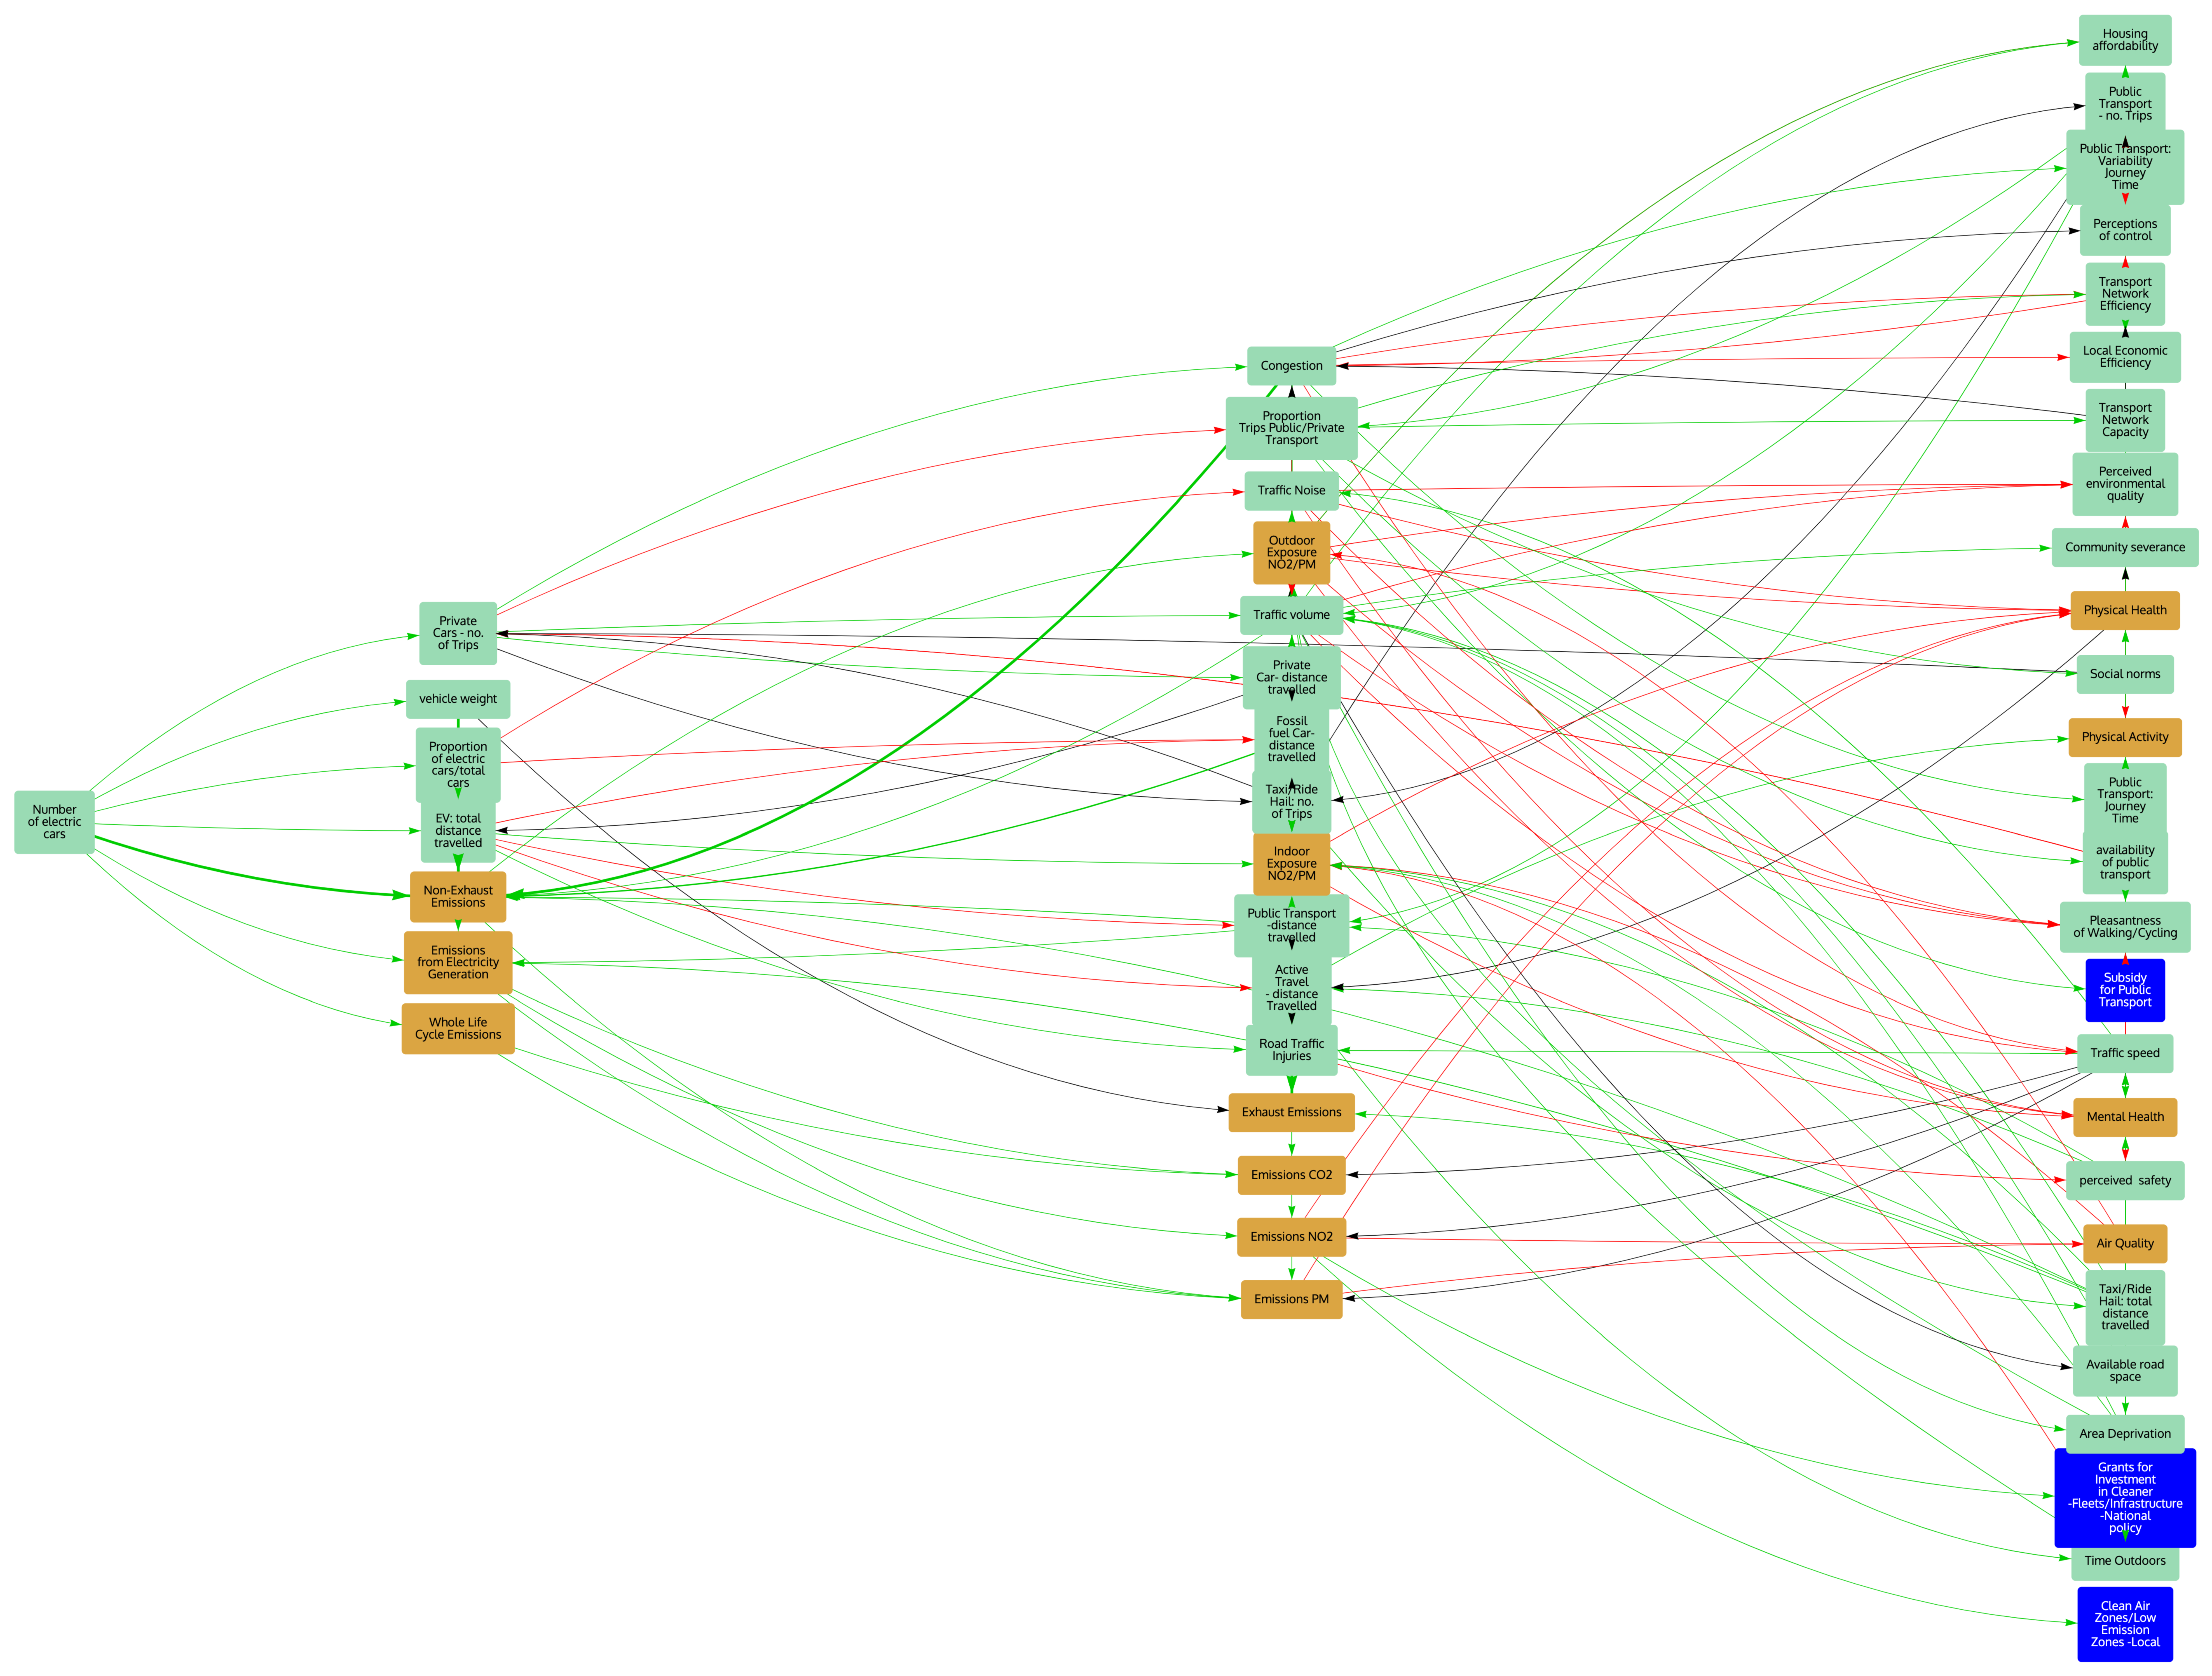
Moving to explore the downstream impacts of the total number of EVs (
Figure 3), it is clear that there is a direct effect on increasing the number of trips made by private vehicles and therefore traffic congestion. We can observe that NEEs are thus increased by EVs in two ways. We expect increased PM emissions from EVs themselves due to their higher weight and greater tyre and brake wear, and also indirectly via a greater number of private vehicles and thus increased congestion. Although this trend of increasing numbers of private vehicles is not confined to EVs (1.7 million new cars were registered in the U.K. in 2021), EV sales continue to increase at a more rapid rate than ICE vehicles and now account for 1 in 6 new registrations [
38]. On the basis of this upward trend, total vehicle numbers are likely to further increase in the U.K., another unintended consequence of EV technology. Traffic congestion also contributes to both increased NEEs (due to increased frequency of acceleration/deceleration) and reduced pollutant dispersion, notably in urban areas [
39]. Further, traffic congestion also influence in-vehicle pollutant exposure due to the increased proximity of vehicles and time duration spent in stationary (or slow moving) vehicles [
40].
Alongside a modal shift away from active travel and public transport (as observed for EV distance travelled), an increase in EV numbers has wider negative repercussions for public transport services, due to reduced service reliability (arising from traffic congestion) and therefore an increased risk to the economic viability of service provision. In addition, the conditions generated by increased vehicle congestion exert negative social impacts, necessitating the additional allocation of public space for road and parking schemes, contributing to community severance and unfavourable conditions for active travel. This negative feedback loop may in turn lead to reduced investment in active travel schemes in those areas with a high number of EVs, reinforcing a negative feedback loop with net dis-benefits for physical and mental health. Such changes will also influence housing demand and quality, and therefore wellbeing (e.g.,increased addictive behaviours, crime, and depression as is well known from the literature on community severance) [
41].
3.3.3. Downstream Map Analysis: Traffic Congestion
In the previous sections, we identified traffic congestion as a key impact of EV-focussed policies. As shown in
Figure 4, 13 important system outcomes arise within 3 steps of this single factor (coloured orange) and 75 system factors arise in total, showing that this factor is strikingly influential in the system as mapped.
As is clearly visible in the submap, congestion exerts multiple negative impacts on air quality and health, in both the short and longer term. The immediate effects include those arising from limited pollutant dispersion and a closer proximity between vulnerable receptors and emissions sources (e.g., in traffic jams or at roadside). Further ripple effects include reduced public transport attractiveness (due to uncertain journey times) and reduced service revenue, and therefore financial viability (not shown on this map). In turn, these changes will contribute to reduced public transport patronage and increase private vehicle use generating a reinforcing feedback loop for public transport services in the long term. With regard to air quality impacts, in addition to direct effects, reduced financial viability reduces the ability of transport operators to invest in cleaner fleets (including EV technology). This, in turn, jeopardises efforts to achieve incremental gains in improving air quality in the context of the recently updated WHO health-based Global Air Quality Guidelines [
42].
A detailed map showing some of these public transport feedback loops is presented in
Figure 5. The main, positive, reinforcing feedback loop is from the number of trips in private cars via their negative impacts on public transport through increased congestion and is highlighted with bold links. Increased private car use is shown to reduce availability of public transport and thus further increase the number of car trips, through increased public transport journey times, increased variability and thus decreased attractiveness and perceived value for money of public transport, leading to fewer trips taken and decreased revenue and withdrawal of services. The positive feedback is further strengthened by an additional positive feedback loop: as the number of trips decrease, revenue and availability of public transport decrease, leading to even fewer trips and yet further reduced revenue, meaning that we would expect this effect to be very powerfully reinforced. Although the loop is initiated by number of trips in private vehicles, and the same results would be expected for any type of vehicle, an increasing number of EVs, although not on the main loop, can be seen to be the initiator for what becomes a ‘death spiral’. It is also noticeable that a balancing, negative, feedback loop might also be present, with reduced mobility equity, potentially reducing income and the ability for new cars to be purchased. Whether such a feedback loop would come into play to ameliorate the situation would depend on the price of EVs as well as the total number of vehicles in the fleet.
Returning to the congestion map,
Figure 4, we can see that high levels of traffic congestion also negatively impacts on neighbourhood liveability, the aesthetic quality of neighbourhoods and attractiveness of walking and cycling, thus further reducing physical activity. Severance of communities (due to impacts upon neighbourhood connectivity and walkability) also fragments social networks, and reduces community cohesion, independent mobility, physical and mental health. These effects are caused by the presence of vehicles (as opposed to vehicle emissions) and encompass a range of negative (yet unintended) public health outcomes arising from EV-focused decarbonisation policies [
41].
3.4. Upstream Map Analysis: What Influences the Outcomes That We Care About?
In order to investigate what influences some of the key systems outcomes that might be impacted by a transition towards EVs, we extracted two upstream causal maps showing the factors from the broader system that influence both physical health and PM emissions (
Figure 6 and
Figure 7). We also extracted an upstream sub-map of a key social outcome, which a functioning transport system should provide: socio-demographic mobility equity (
Figure 8). These upstream causal maps allow us to examine the influences on factors that matter to system stakeholders, which may be outside of the ‘eyeline’ of what is normally considered in policy or intervention design.
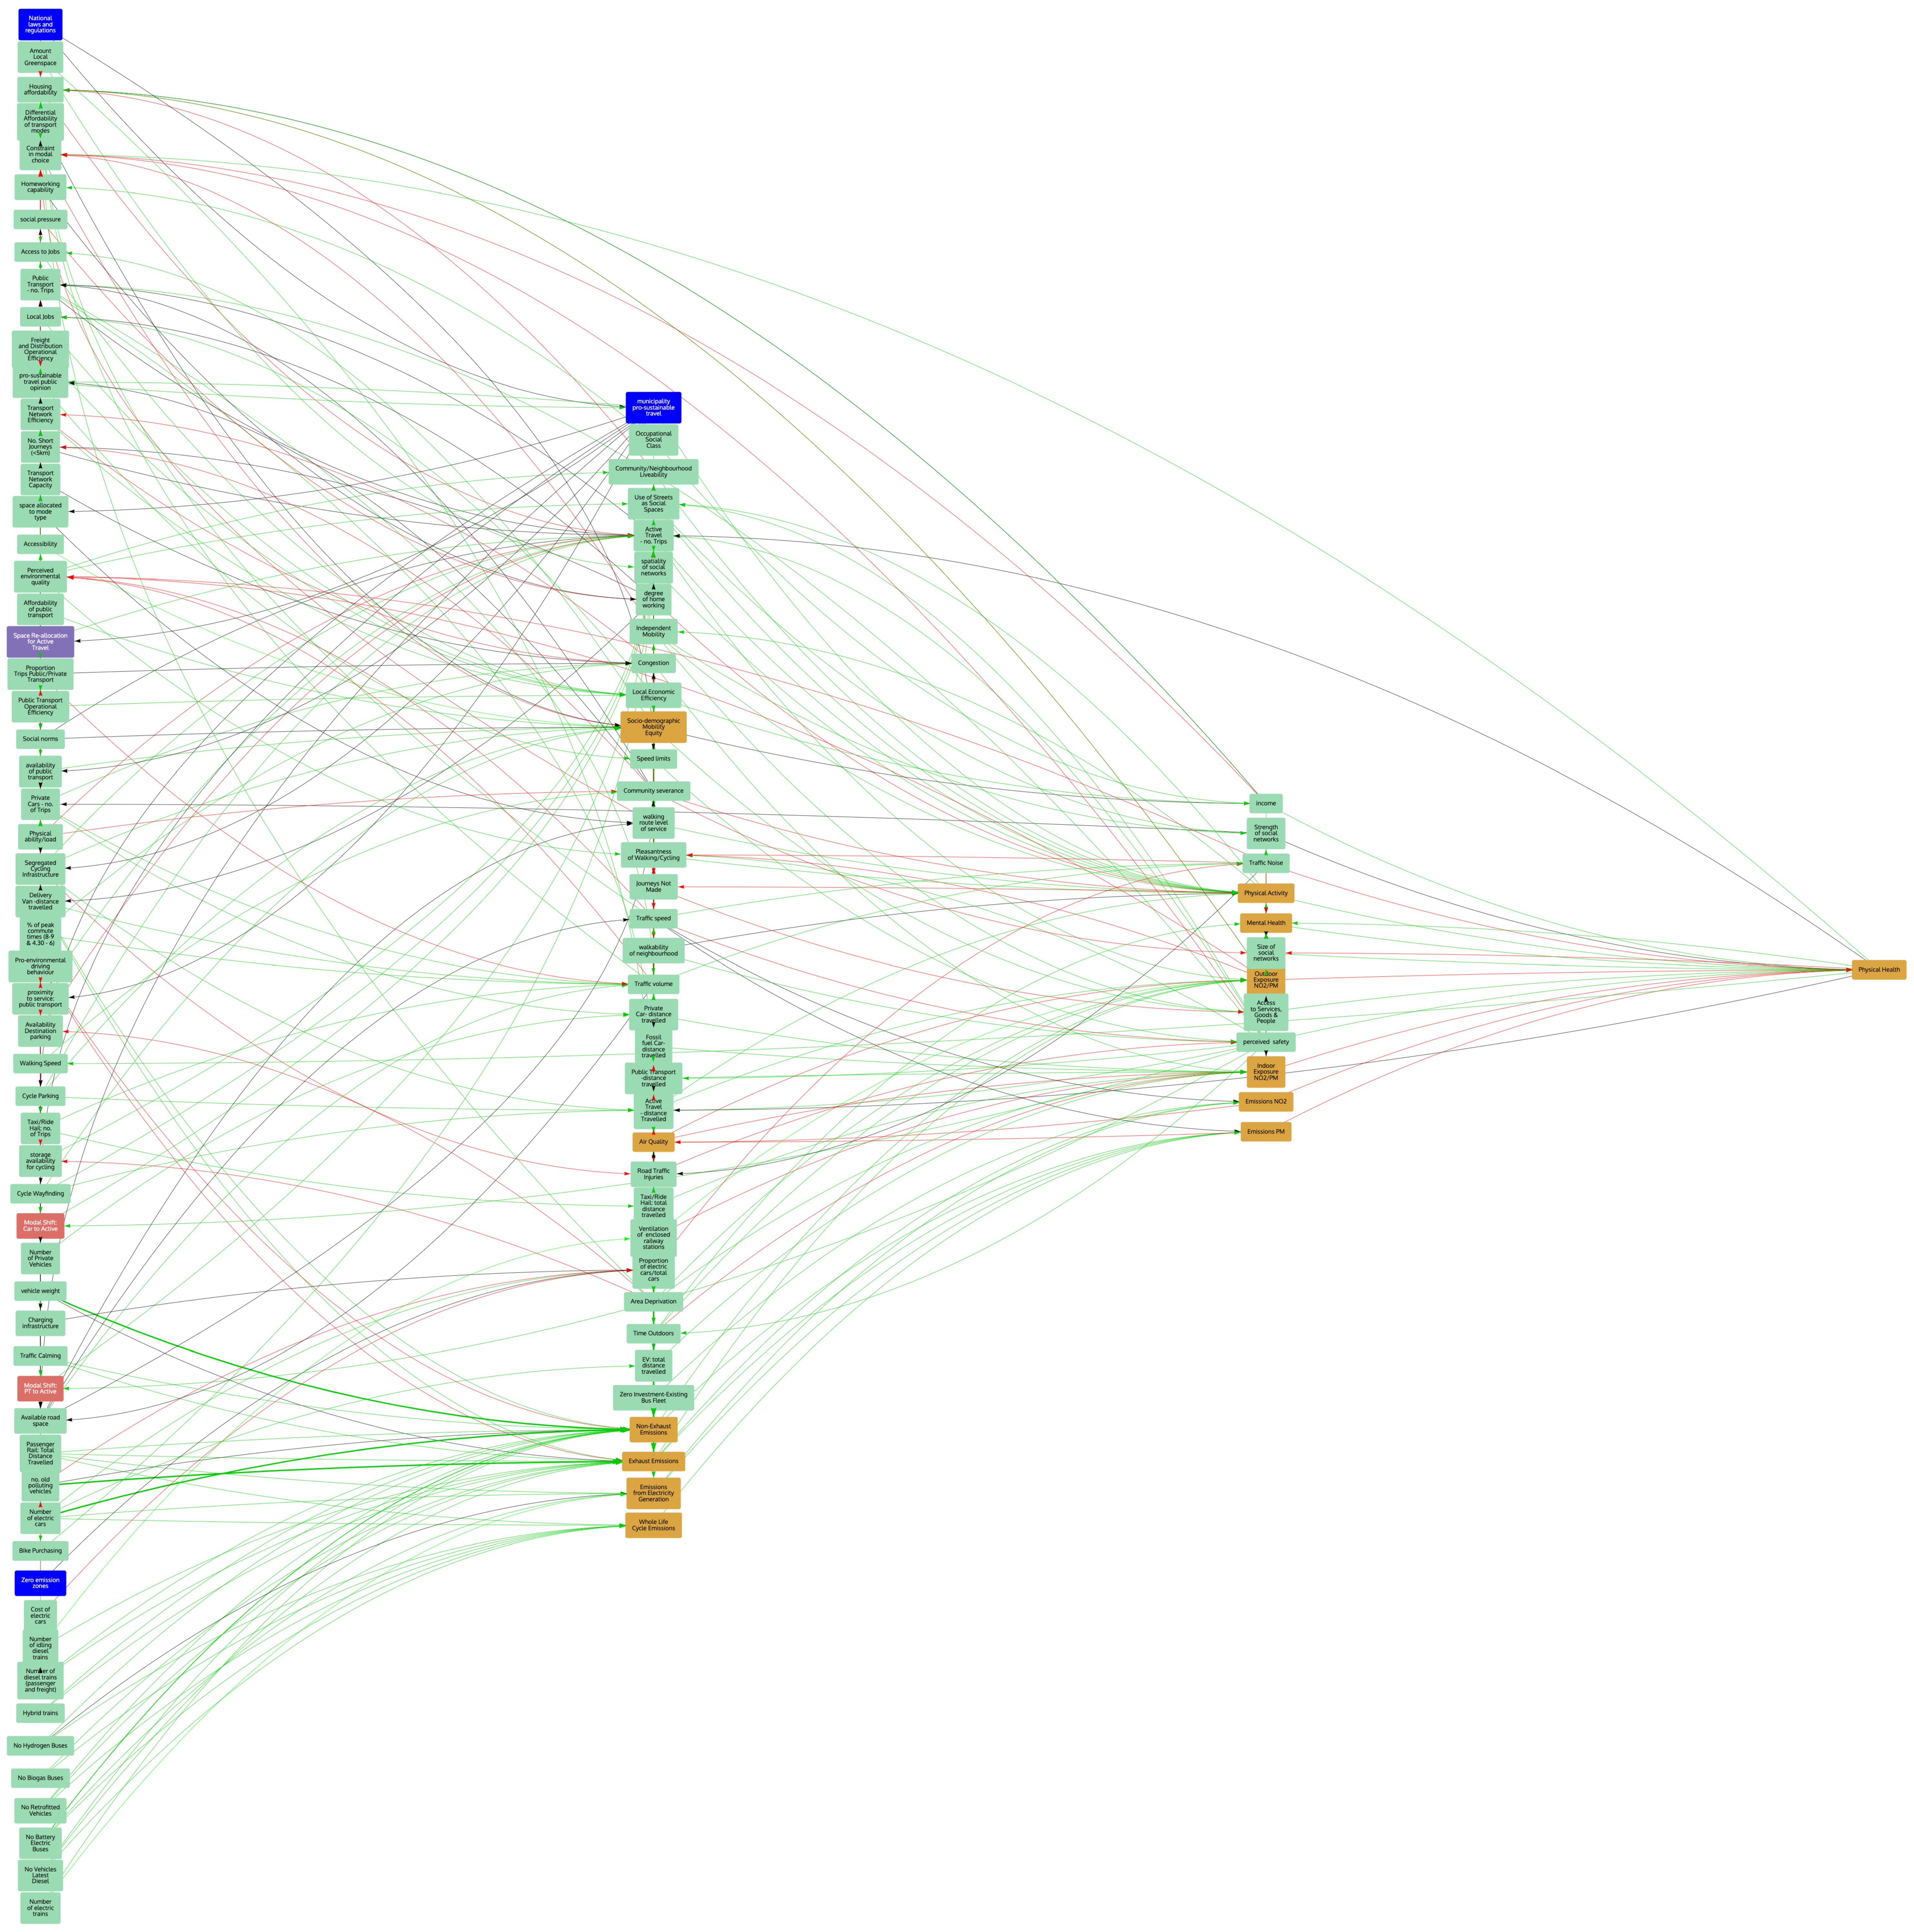
3.4.1. Upstream Map Analysis: Physical Health
The map of causal influences three steps upstream from physical health (
Figure 6) makes it clear that health is a product of a complex system and must be considered as such. There are 107 factors spanning many domains within the 3 steps upstream of physical health.
Looking at the direct inputs on health in the first step upstream, we see not just emission factors, but also income, access to services, goods and people, size and strength of social networks, perceived safety and physical activity and mental health. These factors span economic, geographical, and social influences as well as those that we might expect to be more straightforwardly connected. Further upstream, we identify the very broad array of factors that we need to put emissions in perspective when considering interventions, which are focussed on optimising health outcomes.
Many factors influencing physical health are also familiar from previous downstream maps, including the negative influences of EVs on physical activity as a consequence of increased car use in preference to active travel modes, which ultimately influences acute and chronic disease health outcomes. In addition, there are links with exposure to poor air quality, including increased indoor and ambient NEE exposure because of EV use. It is therefore evident that a more holistic investigation and characterisation of the health impacts arising from an increasingly EV-dominated transport system are required, which may be achieved by scenario analysis and health impact assessment methods [
43].
Many of the factors in the second tier describe the interconnected aspects of place and physical locality in local areas, again featuring the liveability and walkability of neighbourhoods, but also the use of streets as social spaces, spatiality of social networks, perceived safety and the impacts of all of these on physical activity, social networks and mental and physical health. Greater equity with respect to mobility is also visible as an impact on health, both via increasing the equity of accessibility to goods, services and people, and via income and the availability of opportunities. An increased penetration of EVs will reduce transport choices available to vulnerable and low-income groups, further widening existing inequity by reducing access to vital services.
Several ‘hubs’—factors through which multiple incoming influences are routed—are also visible in the upstream health map (
Figure 6). These include all the main types of air pollutant emission sources and indoor and outdoor exposure. These are, in turn, influenced by multiple types of vehicle technology in both public and private transport contexts, and traffic flow, speed and volume (PM emissions are explored in detail in the next submap). Other hubs include the multiple influences of active travel and the nature of places, infrastructure and services, which facilitate movement by foot and bike. Active travel is itself also influenced by many factors, including the effects of infrastructure provision and the attractiveness and accessibility of walking and cycling. It is well known that physical activity has a major beneficial impact on health and therefore the impact on active travel ought to be considered in EV policy development.
Local economic efficiency is another hub mediating multiple influences concerning the operational efficiency of the transport system. It is decreased by congestion, but increased by access to jobs, and feeds into income, which is an important wider determinant of health. All these influences may also be moderated by the distribution of mobility benefits among different population sub-groups (socio-demographic mobility equity), because adverse household and community level impacts are most likely to occur for poor and marginalised groups. This is also shown in the EV downstream map (
Figure 3), with the mobility benefits of EV access being greatest among the most economically advantaged, and those with already limited mobility options (including the 40% of households in the lowest income decile with no car access) [
44], potentially experiencing a net mobility dis-benefit because of both the public transport ‘death spiral’ and reduced active travel provision. To summarise, physical health is affected by many factors that are influenced by EV-focused policies, both directly and by exerting wider changes in the social and structural ecosystems in which people live, work and travel. Key hubs identified in the sub-map, including air pollutant emission sources and changes in the relative contribution of indoor and outdoor exposure (including in-vehicle exposure), should be an important focus for future health and economic impact assessment studies.
3.4.2. Upstream Map Analysis: PM Emissions
The direct upstream influences on PM emissions (
Figure 7) are emission sources, such as vehicle exhaust and NEEs, and electricity generation, with traffic speed also being an influence. Looking one step back, however, we observe an explosion of factors driving these emission sources and pushing them in different directions.
The factors divide into a number of categories: firstly, influences on traffic volume, flow and speed, such as the network capacity, space allocation, congestion and restrictions such as traffic calming, speed limits and availability of parking; secondly, vehicle power technologies across private vehicles; and thirdly, public transport, including buses and trains.
As previously discussed, PM emissions could be driven in multiple ways by different modal shares and types of traffic movement. The map shows strong influences on both exhaust and NEEs from older ICE vehicles, and from congestion and total distance travelled. The magnitude of impacts from emissions from electricity generation, and thus how different modes might impact via this route are as yet uncertain as they depend strongly on the means used for power generation. However, primary PM emissions for power generation are likely to be released at a location more distant from receptors (e.g., people), in comparison to PM emissions generated by traffic at the roadside. In addition, there are important differences in the size and composition of particles, the respective contributions of primary and secondary PM sources, and the demographic distribution of exposure, all of which are relevant to impacts upon human health.
Although well-known drivers of PM emissions are clearly visible in the map, the map also highlights how the interplay between changes in private vehicle use and associated traveller behaviour affects the viability and cost effectiveness of public transport, and thus the ability of operators to invest in cleaner fleet technology to reduce exhaust emissions. Investment in cleaner public transport fleets, and the amount of money available and incentives to do so, is a key factor determining whether and which specific cleaner bus technologies are adopted in fleet renewal cycles. Inputs into this investment decision are the level of enforcement, expected revenue and operational efficiency (not shown on this map but discussed previously). In a possible future scenario, highlighted in the set of downstream maps above, increased congestion due to increased numbers of private (electric) vehicles and the consequent decrease in public transport journeys, could result in decreased revenue and financial viability of public transport, decreased operational efficiency, and thus a decreased availability to invest in cleaner fleets. There exists a risk that increasingly cash strapped public transport may not therefore be upgraded (or retrofitted) with cleaner engine technology (requiring substantive capital investment) in the context of declining passenger numbers, necessitating increased fares to generate adequate revenue for operative costs. This presents a reinforcing vicious cycle with decreasingly accessible and attractive public transport options, leading to more car trips, more congestion and increased NEEs from EVs. This is in contrast with a more effective overall emissions reduction strategy arising from investment in cleaner, reliable and more affordable public transport services, which could delivery universal mobility benefits and therefore public health gains.
3.4.3. Upstream Map Analysis: Socio-Demographic Mobility Equity
Socio-demographic mobility equity is a key function of a transportation system, allowing equitable access to jobs, people, goods and services and thus supporting local economic efficiency, strong social networks, physical and mental health and well-being and a variety of other desirable social outcomes). Any changes to the U.K.’s transport system ought to maintain the ability of the whole population to access and use the system for their needs [
44].
Looking upstream from socio-demographic mobility equity (
Figure 8), it is noticeable how many blue (policy or regulatory) factors are involved. Many factors also appear in previous EV-related maps, implying that a synergistic approach to optimising them all should be taken.
One step upstream are those factors that influence transport modal choice, such as differential cost of modes, affordability, the availability and accessibility of public transport and the provision of infrastructure to allow safe and accessible active travel. Many of these are, in turn, influenced by local authorities and spatial planning decisions, alongside community liveability.
However, the accessibility and affordability of public transport is at risk from an increased number of EVs, if steps are not taken to provide appropriate structural and economic support mechanisms. This has been discussed above in the context of the upstream and downstream maps. However, the differential affordability of modes is explicitly visible here as a key input. EV prices are currently relatively high (compared to ICE vehicles), with even the entry level models out of the reach of many U.K. citizens [
45]. If their potential negative impacts on public transportation are realised and EV prices do not sufficiently drop to make them accessible to all, including children and those with specific disabilities or lifestyle choices who do not hold a driving licence, then a proportion of the population will remain excluded from this transport mode. This risks a further reduction in inclusivity, accessibility and the remediation of existing inequalities in U.K. mobility, with lower levels of car ownership among more deprived households, those with female household heads, children, younger/older people, black and minority ethnic (BAME) demographic groups, people with disabilities and other groups that are more likely to be reliant upon public transport and active travel by necessity rather than by choice [
44]. Further, the wider constraints on modal choice and negative community liveability aspects of a high traffic, congested, private vehicle-dominated transportation system remain problematic for underprivileged and marginalised population sub-groups [
41]. The societal implications of this scenario are unappealing.
A question that remains to be answered with regard to EVs in the transportation system is therefore whether reinforcing feedbacks might come into play, in which mobility equity is driven increasingly downwards by the reinforcing negative impacts of EV-centred polices on public transport and active travel.
Figure 8 also shows that these upstream influences span wider social factors, with pro-sustainable transport opinion, social pressure, and social norms also visible. These also impact on the likelihood of traffic restrictions and provision of infrastructure for active travel, and thus community liveability, perceived safety and mobility equity, for example, by differential engagement in consultation processes and competitive funding mechanisms for cycling infrastructure improvements. Existing levels of walking and cycling are strongly patterned by area-level socio-demographic characteristics, with the highest prevalence of cycling at least once a week in Cambridge (55%) and Oxford (40%), and the lowest rate in Barking and Dagenham (3%) in 2019 [
46]. Areas with a relatively high cycling rate are also likely to have more organised advocacy, campaigning and pressure groups, which strengthens political pressure to allocate a higher proportion of funding to active travel compared to the U.K. average. Increasing the proportion of those walking and cycling may also reinforce positive social trends towards wider acceptability of active travel, thereby generating a positive feedback loop.
A key question arising is how we should reframe the transport problem to facilitate synergies between these multiple outcomes, reinforce positive feedback links to support a modal shift towards more inclusive transport modes (e.g., walking and cycling) and advancing access to mobility services across the socio-demographic population spectrum.
3.5. Network Centrality Analysis: What Factors Are Structurally Significant in the Map?
Although the map has some structural biases due to the nature of the online mapping process and follow-up small group interactions (see the discussion below), a network centrality analysis is nevertheless informative. Although the network is a subjective model and strongly influenced by what participants believed to be most interesting and important, network centrality results present us with an indication of the factors that are most influenced or influential, most important, or most causally central in the map as constructed.
In
Table 5, we show the results of performing four basic forms of network centrality analysis on the map: in-degree—the total number of incoming connections of all factors; out-degree—the total number of outgoing connections of all factors; total degree—total number of connections for all factors (the sum of in-degree and out-degree); and betweenness centrality—a measure of what proportion of all the shortest paths through a network (between all pairs of nodes), any given factor is on. In-degree is often used as a basic measure of the extent to which factors are influenced by others; out-degree of how influential individual factors are; total degree of factors’ overall importance and connectivity within the network; and betweenness centrality of factors’ importance in the causal flow through the network. Our network analysis shows that the number of trips made using the various modes, public transport, private cars and active travel, are highly connected, with high degree, and therefore potentially influential in our map. Traffic volume, which is related to those factors, is also highly connected. Traffic volume, and the numbers of trips by public transport and private car also have a high betweenness centrality, that is, they play a role in many chains that connect other factors across different areas of the map, again suggesting their importance in mediating causal flows in this system. While not unexpected, this suggests that it is not the technology that is used to move around that is most important, but the mode of transport. Increased or even maintained levels of private car use could present a real threat to many of the aims of the government regarding cleaner air, levelling up, increased active travel, liveable neighbourhoods and a healthier population.
It is notable that housing affordability also emerges as a highly connected factor in the system. It not only has a high total degree, but is both highly influenced (in-degree), influential (out-degree) and has a high betweenness centrality, meaning that it bridges multiple parts of the network. The closely related factor of area deprivation is also highly influential. Examining the direct connections of this factor, it can be seen that affordability has been used as an analogue for house prices and in turn socio-economic level and desirability of an area. The multiple connections represent the influences of high emissions, traffic volume and speed, and a lack of active travel infrastructure and other facilities in keeping house prices low, but also that poorer areas tend to experience higher volumes of traffic and worse air quality, as well as an increased likelihood of poor health outcomes, including those promoted by physical activity and active travel. The factors are embedded in several reinforcing feedback loops in the map, including many via public opinion, which represent the well-known dynamics of more wealthy and educated communities pushing for and obtaining traffic restrictions and active travel infrastructure (as touched on above in the discussion of socio-demographic mobility equity). The high connectedness and betweenness of this factor, meaning that it mediates multiple effects in the map, suggests how important the role of heterogeneity of places is in how the experiences and impacts of negative outcomes of the traffic system are unequally distributed across the population between poor polluted, unhealthy areas, and wealthy, clean and healthy ones. The reinforcing feedback loops emphasise the entrenched nature of this effect. Understanding these dynamics on the ground and disrupting the local ‘vicious cycles’ is crucial in making a policy that has equitable impacts.
Municipality pro-sustainable travel was also perceived as being highly influential. In the map, it influences many factors pertaining to the provision of infrastructure for active travel, support for public transport and measures, such as traffic restrictions, which implement modal shares. These factors are known to be influential in achieving a modal shift. It is also a direct influence on spatial planning, with many important knock-on effects on demand for transport and modal shares. This suggests that changing the opinions of local authorities would be a significant leverage point in achieving modal shift. It is important to consider whether, in reality, the local authority perspective is as influential as stakeholders perceived it to be. Local authorities are of course operating under the constraints of national policy and regulation, but also in the context of larger economic and societal processes, which might reduce their freedom to act.
4. Discussion
4.1. Policy Challenges for Transport Decarbonisation, Air Quality and Public Health
In this case study, we applied an online PSM process to characterise the U.K. surface transport system, integrating knowledge from diverse stakeholders to generate illustrative maps to explore the impacts of EV-focused decarbonisation policies on a broad range of social, environmental, and behavioural outcomes. The PSM process, associated analysis and interpretation enabled the identification of highly influential factors and both positively and negatively reinforcing feedback loops, thereby highlighting the importance of adopting a whole systems approach to policymaking in the transport sector. Feedback loops include critical ‘death spirals’ generated by unintended consequences of EV focused policies, which ultimately risk widening unfair and unjust differences in health and the quality of life among groups of people in the U.K.
In contrast, the Government Transport Decarbonisation Plan [
2] outlines a vision that moving to EVs with no tailpipe emissions and less noise will ‘support levelling-up and help re-invent the high streets as enjoyable places to live, work, visit and spend leisure time’. However, those policies that seek to encourage as many people as possible to purchase and use EVs could lead to multiple and wide-ranging undesirable impacts occurring at individual and systems levels. Incentivising increased EV uptake to achieve ambitious net zero targets risks rebound effects, whereby savings from more efficient operation are overcompensated by changes in individual behaviours arising from complex interactions between consumer preferences and policy initiatives [
47]. Vehicle mileage may increase further due to the attractiveness of EVs, perceptions of reduced environmental impacts and reduced per-mile driving costs, with implications for levels of physical inactivity and PM exposure. At a community level, adverse effects of increased (EV) traffic volume include traffic congestion, reduced neighbourhood liveability and reduced uptake of active travel, thereby further reinforcing social norms of private car travel. A failure to achieve significant modal shift away from private cars also jeopardises the financial viability of public transport in the longer term. Further evidence regarding the behavioural response of consumers to EV ownership is urgently required. A panel study undertaken in Germany suggested decreased household EV usage resulting from households’ desire to reduce environmental impacts [
48]. On the other hand, MOT data in Great Britain indicates a higher average annual mileage for EVs compared to petrol vehicles, although lower than diesel counterparts [
49].
Many, if not all, these negative outcomes will have the greatest impact on more deprived and marginalised communities who already experience a disproportionately high burden of disease arising from road transport emissions [
50], and who are most likely to be reliant on public transport and active travel for essential mobility needs. There are then further chains and cascades of impacts from those initial responses that influence wider determinants of health, such as access to green spaces, leisure opportunities and fragmentation of social networks. In a policy context, it is essential to consider such broad and diverse outcomes (including unintended effects) alongside the benefits of EVs, such as a reduction in noise pollution, tailpipe emissions and (although beyond the scope of this case study) employment opportunities associated with manufacturing, distribution, and sales.
Regarding air quality, we identified multiple complex relationships, including potential synergies and trade-offs. Although there are clear benefits of EVs in reducing NOx emissions and achieving compliance with legal limit values (if considered on a vehicle for vehicle replacement basis), uncertainties prevail regarding overall air quality impacts due to the relatively greater magnitude contribution of EVs to NEEs because of increased kerb weight (and therefore tyre and road wear friction) for a journey of the same distance. There is, however, limited knowledge about the specific toxicological effects of particulates arising from exhaust, compared to non-exhaust sources [
8]. A shift in vehicle usage (and driving styles) will also influence the duration of exposure to pollutants in specific microenvironments, including outdoor spaces and in-vehicles, with exposure magnitude potentially of greater intensity in a high EV scenario due to increased congestion and stationary traffic. We can seek to understand and quantify these air quality trade-offs associated with increased EV penetration by developing EV-specific emissions factors (including a consideration of regenerative braking) and improving our understanding of behavioural impacts to enable a quantitative scenario evaluation [
51].
It is also important to consider the whole life cycle of EV emissions within the context of a ‘net zero’ policy-making processes. Whilst in this case study we did not attempt to capture offshore emissions (focussing only on domestic U.K. road transport), power plant emissions will be greater as EVs become more common, with the air quality impacts highly dependent upon the energy source. Battery and fuel production for an EV typically generate higher per-vehicle manufacturing emissions than for an ICE counterpart. However, over a vehicle’s lifetime, this cost is offset by reduced-per-mile CO
2 emissions in settings where a substantive proportion of energy production is from renewable sources [
52]. Therefore, when considering lifetime climate impacts, there exists a trade-off between the increased energy intensity of vehicle production (compared to ICE vehicles), and the environmental benefits of usage, with the greatest lifetime benefit achieved by fewer vehicles each being used for travelling a greater distance. Greater mileage also increases power source emissions, although the health impacts arising from electricity generation are typically more distant from areas of high population density, and therefore have a lesser health burden compared to roadside exposures.
Despite the potential existence of the feedback loops and vicious cycles identified here, which may ultimately lead to ever-increasing car dependency, catastrophic decline of public transport services and widened health inequity, there currently exist no structural policy mechanisms or fiscal incentives to encourage cooperation between the private and public transport sectors to achieve a system that optimizes the benefits for climate, air quality and public health. Indeed, there are several structural issues that discourage cooperation. Firstly, public transport services in the U.K. are operated by private providers (outside London) and therefore services must be profitable, which, in the context of reduced patronage, may only be achieved by increasing fares, service costs or provision. Secondly, replacing existing ICE vehicles with EVs delivers economic benefits, including support for vehicle and battery manufacturing, notably including generating jobs in areas of high socio-economic deprivation and strongly reflecting the U.K. government’s ‘levelling up’ agenda and economic strategy in the short-to-medium term. Thirdly, it is well recognised that physical and mental health costs arising due to the direct and indirect effects of pollutant emissions are normally incurred by the NHS and social services (aside from productivity costs), typically over longer time horizons (e.g., 20–30 years), and therefore are of limited economic benefit to those organisations required to fund policy intervention measures, including bus operators and local authorities.
This highlights the important point that changes in individual behaviours cannot be relied upon to solve system problems. System-level optimisation, which here would require a balance of modes to produce optimal outcomes, cannot be achieved through relying on individual behaviours, especially when these individual behaviours produce self-perpetuating positive feedback loop effects on a single mode. It is inevitable that if such self-reinforcing dynamics are set into motion, then without the addition of negative feedbacks (which should be provided by higher level policy), the self-reinforcing mode will ‘out-compete’ the others. Individual level interactions will self-organise to produce higher-level outcomes, but, as is well known in ecology, there is no reason why these emergent outcomes should be optimal for the whole system or optimise multiple outcomes. Systems mapping can help us to uncover where such feedback loops are present and how they interact, thus highlighting where such disconnects between optimisation at different levels may occur. The challenge remains, however, to produce a system-level policy when intervention through individual behaviour is culturally strongly preferred.
4.2. How Participatory Systems Mapping Can Best Be Used to Support System Approaches to Policy Making for the Transport System
When using participatory systems maps, it is crucial to understand what they are and what they are not. Participatory systems maps are not models that produce definitive results via a standard analysis process. Rather, they are thinking tools for generating new questions, enhancing collective understanding and aiding participants or users in reframing or reorienting their thinking towards a more system-appropriate views. Rather than producing for example a quantitative prediction of impacts on the selected outcomes of interest, they present a qualitative indication of what might be impacted by an intervention, including the wide array of impacts that were not previously thought of. They show us what we do not know, but also help us to identify how we might understand more and reflect on where our current thinking is constrained. They also allow us to understand how, that is, by which causal paths, these impacts might occur, and what sort of system dynamics might be at work through an understanding of probable system causal structure. For example, they can show how an intervention might set feedback loops in motion that magnify detrimental effects or cascading change in a system. Conversely, they can help to identify possible points in a system, which could produce synergies or policy co-benefits if interventions were targeted there. Or, indeed, whether reinforcing feedback loops leading to beneficial change, virtuous cycles, can be identified and supported or even created. None of these insights has the empirical status of a validated model or experiment, but they provide a usable map for complex system territories. Complex socio-technical or socio-economic systems, including all real-world policy domains, and of course the transportation system, are characterised by long causal chains combined with uncertainty about what impacts what, sparseness of empirical or quantitative data for important parts of the system and constant change. This makes systems maps particularly suitable for use in policy contexts where decision making must take place rapidly, under uncertainty and where siloed thinking, driven by organisational structure or a narrow focus on where data is available, is rife.
Some of the most striking messages from our analysis presented above concern the breadth and importance of the whole-systems context, which must be taken into account when considering the potential impacts of EVs on air quality, health and important societal outcomes. By simply showing the number of different sorts of factors across different domains that changes in EV use could influence, we can already show the need for a broader perspective in policy making. The system does not contain simple, straightforward pathways from intervention to single desired outcome, but rather a myriad of unfolding effects. Many of these connect to other policy outcomes (some from different government departments) or other issues, which matter to stakeholders. The visualisation of this complexity is a sharp wake-up call in its own right. It is particularly powerful when policy makers have been involved in constructing the maps themselves, but is still impactful when presented as the outcome of a mapping process with expert stakeholders having specific domain knowledge. It clearly shows that we need to step out of narrow silos when making policies in complex domains. It also presents a signpost to the sorts of factors, which could be indirectly affected and the paths by which this might happen. In the transport domain, we noted the potential indirect effects on health, community liveability and mobility equity, via decreased physical activity, increased congestion and community severance and potential profoundly negative effects on public transport. This understanding of potential causal paths allows a consideration of how to buffer or mitigate against unexpected indirect effects, or how to co-opt them to make system-sensitive policy. It also allows for the identification of evidence and knowledge gaps, shows where extra monitoring is required and, crucially, signals who needs to be brought into policy-making processes to both understand what is happening on the ground and to form coalitions that can enact change. These collaborators could involve other government departments, to match policy thinking to system structure, as well as external stakeholders.
Conversely, when working from the perspective of what influences societally desirable outcomes, such as physical health, it is clearly visible how broad and how interlinked the set of influences are, including, for example, not just emissions, but liveable places, strong social networks, safety, economic security and access to goods, services and people, as well as other more tangible factors, such as physical activity and traffic noise. This demonstrates the need to set desired policy outcomes, such as health, in a systems context. It also demonstrates the need in this case to put emissions from transport in perspective with regard to other social, economic and infrastructural issues when considering health outcomes. Again, this shows us the need to broaden our thinking on what we target and how we design health interventions. There are multiple pathways simultaneously affecting what matters in the system and multiple interactions between them. Attempting to isolate single influences and target them to produce change is unlikely to be sufficient. The interconnectedness of these outcomes and the fact that many outcomes appear as upstream influences of others indicates that a synergistic policy approach must be taken to address these factors effectively.
The multiple feedback loops identified in this system have implications for policy making. Although recent U.K. government work used systems maps to look at feedbacks involving the economics of EV uptake, the coverage of those maps is highly constrained. By uncovering feedbacks which, although triggered by EVs, span different modes, and affect communities and even social equity, we can demonstrate that the dynamics set in motion by a policy can have broad and self-reinforcing impacts. Consideration can then be given to how to disrupt vicious cycles or even how to create virtuous ones.
Often in an exploratory participatory analysis, we work by stepping through a map to further investigate factors which emerge as important. We emulated this here by following downstream investigations of EV impacts, extracting a submap for congestion. This allowed us to travel through causal chains and networks, which can quickly become overwhelmingly large, in a tractable and understandable way. This sort of dynamic investigation, particularly in interactive map interfaces, such as PRSM, which can be driven by what participants find intriguing or is most important to them, is a powerful tool to generate understanding of complex systems structure. It allows users to investigate what matters to them. It is useful both in policy and in other contexts in which expert research or models do not address what matters to stakeholders. Of course, the usefulness depends on the contents of the map. It is crucial to design the mapping process so that the map captures and expresses what matters and provides access points via factors relevant to users. It is also important that the users have sufficient breadth of knowledge to be able to make unexpected connections to other parts of the system. In many policy contexts, a reluctance to speak freely with stakeholders can hamper collaborative mapping, and hence the value of a map in challenging assumptions. Strategies must be devised to overcome this. The inclusion of policy relevant factors, such as TDP priorities and EV uptake, in a map built without policy makers, can help bridge the gap between policy and stakeholder groups.
In participatory mapping, in which the map produced consists of what stakeholders prioritise, involving a diversity of stakeholders, with different knowledge, experience or perspectives on a system, is a vital part of producing a quality output. Participants are thus specifically invited so as to try to prevent systematic blind spots. As well as domain expertise, this includes issues, such as gender (role) or disability-related mobility needs, which are likely to be prioritised by stakeholders from these groups. In the present study, we attempted to maintain coverage of the required role expertise, whilst also enhancing representations as far as we were able. However, our participants broadly reflected the U.K. transport sector, where only 20% of the workforce are female, and minority ethnic groups are recognised to be underrepresented [
53]. Other forms of diversity are equally important for producing an in-depth picture of the transportation system in use in society. Maps, such as this one, which are created by ‘expert’ groups, tend to be more acceptable to policy makers and are particularly useful for providing high-level overviews of a system. The inclusion of ‘non-expert’ citizen stakeholders affected by the transport system are, however, important for any future PSM work on policy impacts on different groups and for local policy development. Representative participatory processes, including citizens, are particularly important in place-based approaches in which peoples’ decision making and impacts on the ground in local contexts strongly affect outcomes. Including those from disadvantaged socio-economic backgrounds who are often disproportionately affected by these policies in a non-tokenistic fashion remains a challenge. This would need to be taken into account in any follow-up participatory work on local policy or strategy development and appraisal. And, ideally, it should be integrated into systems mapping for policy more generally.
4.3. Learning from Online PSM Implementation
As described in the Methods section, the mapping workshops was originally been planned as an in-person event. However, restrictions due to COVID-19 meant that all work had to be moved online. This meant both that an online mapping interface had to be used, and also that the workshop process had to be redesigned substantially to take account of the very different group dynamics and affordances presented by online meetings. Although challenging, this presented a useful opportunity for learning. Some of our modifications and key learning points are presented here.
To facilitate online interactions, we modified the traditional PSM process to run in much shorter workshop sessions, as whole day workshops were felt to be too tiring online. We split the larger group into smaller breakout groups in an attempt to overcome the barriers to participation that an online environment can create. We worked with a larger number of facilitators than usual, using three facilitators/observers per breakout group of six people, plus additional technical support. This high ratio was to ensure that group dynamics were monitored, participants’ issues with the mapping software could be addressed and that the developing map, the factors and causal connections and their meanings, and any gaps or issues could be monitored and brought to the attention of the group. We also had to be prepared to adapt the workshop process dynamically during the workshop itself in response to issues which arose. This high facilitator-to-participant ratio was found to be both necessary and effective. Although it was still noticeable that some participants felt inhibited from contributing, this remained more difficult to spot and deal with effectively in an online context (although it is likely that this would be less of an issue with groups who already knew each other). To overcome this, participants were invited to meet with us again after the group workshops for one-to-one or small group sessions to present their input. This was effective in gathering information. However, it did mean that the mapping focussed more on smaller areas of interest to particular stakeholders.
Working in smaller parallel groups required that we design the process so that each breakout group would be working with the same system factors, so that the different maps that they created could be meaningfully combined. The process of factor generation, definition, consolidation, and agreement can often take half a day in a standard, in person, PSM workshop process and was substantially constrained here to a 40 min session. Although a shared factor set was produced, it was found that groups created many more additional factors when mapping themselves. This meant that maps were more difficult to merge, and that some very similar, but differently expressed, factors were duplicated in parallel groups leading to disconnections between the related map areas. A solution might have been to advise participants more strongly against adding new factors, although this might have been frustrating and too constraining. Alternatively, we might have allowed more time for agreeing factors in the larger group, although this is difficult in a short workshop. Another possibility would have been to have shorter mapping periods with agreed fixed factors, asking the small groups to bring new factors back to everyone for agreement at intervals. In highly engaged groups, factor generation can be performed offline in advance, although this was a challenge for us due to the limited availability of our stakeholders.
We made further design decisions to shorten the time in the workshops by sending out introductory materials and soliciting impact in advance. We provided participants with an overview of the PSM mapping process with simple example maps, our aims, the system definition and a list of outcome factors for the surface transportation system. We also asked for feedback on the factors we had chosen. Several participants suggested that we had sent out too much academic information and that they found it difficult to understand. It was thus not an effective way to save time.
Engaging the attention and support of stakeholders is usually achieved by making a convincing case for the value of a PSM process at physical meetings, preliminary workshops and personal contact. When working purely online, achieving engagement remains a challenge and depends on prior stakeholder relationships. It is vitally important to create buy-in early in the process, by demonstrating how it could be useful and building enthusiasm to increase the probability of stakeholders contributing their limited time. What is valuable to them and when is an appropriate time to ask for input must be taken into account in any process design.
We used an online, systems mapping environment PRSM (available at
https://prsm.uk, accessed on 28 January 2022), created by one of our team, which allows several people to collaborate on creating causal maps via a browser-based interface. Users access a shared map via a weblink and all can observe and edit the map at the same time. Some participants felt comfortable with the software. Others found it difficult to work with or did not feel confident to use it, perhaps because the software was still under development and was brought into use unexpectedly early, meaning that some technical issues remained. In the course of the workshops, we found it easier to allocate one person to edit the map rather than having several editors. This reduced the speed of mapping as it meant that people could not work in parallel with different discussions being managed simultaneously. Advantages of the software were that people who might have struggled to travel to attend a workshop were able to do so, the laborious process of transferring a physical map from paper to analysis software is removed and dynamic individual exploration of the resulting maps is possible.
We did however find that the physical nature of mapping on a small computer screen, as opposed to a very large physical map, changed the focus, and hence map structure considerably. During an in-person workshop, maps are usually created on a large table around which people can gather, with the map itself the size of the entire table surface. This sizing is deliberate as it means that all participants can observe and read the whole map simultaneously and thus obtain a sense of the whole system as it develops. This encourages cross-system connections to be generated and a higher-level, less detail-focussed understanding of the system structure to emerge. Using a browser-based map on a laptop screen meant that only small parts of the map could be viewed collectively and edited at any one time with the consequence that attention focussed on small sections of the map sequentially. This resulted in a map structure with many highly connected subsections or clusters that were only weakly connected into the rest of the map. Structured exercises to move around the map and to pull back to focus on the whole picture are likely to be needed to address this unless maps are constrained to be small with few factors or large, high-resolution screens become common.
In the future, online participatory system mapping will need to be designed to facilitate the ‘whole system’ picture and cross system connections that usually emerge naturally in face-to-face groups, in which the majority of mapping is conducted collectively and all participants can observe the entirety of a large physical map. This is not only to produce a better map structure and system coverage, but also to ensure that participants can experience the benefits of understanding how they and their area of work fit into a shared complex system context and the new perspectives that this helps foster. At the same time, the benefits of online mapping, such as inclusion without geographical constraints and the ability for participants to easily analyse and explore their own maps, should be exploited as much as possible. Much learning and design is required to achieve this balance.
4.4. Future Research: Needs and Priorities for Effective Transport Policy Making
The transportation system is a complex socio-technical system and requires approaches to policy making that take this into account. Using PSM to generate an understanding of this complex system is a useful first step. However, to provide input to policy-making processes, the map needs to be used to provide actionable insights and clear messages that are meaningful to policy makers. This involves analysis that is focussed upon questions that interest them, such as what the risks to a programme are, what influences their desired outcomes and what are the indirect effects of their policies. This requires a participatory, ‘actionable complexity’ approach, ideally situated within a co-production process.
Many practical next steps for work on this map are suggested by our analysis. Further map investigations targeting potential policy clashes or trade-offs as well as synergies and policy levers would be possible. We identified numerous hubs and structurally influential factors through the analysis. We could focus on how hubs are driven, for instance, whether they are pushed in different directions and how buffered from change they might be. This would produce a first indication of system resilience and vulnerability to change, as well as indicating how change might be created. The need for, and possibility of, synergistic policy in transport decarbonisation, health and mobility is identified in several of the maps. We are particularly interested in using the map to explore potential synergistic approaches, such as place-based approaches, and how to support active travel. Interesting insights emerged on the role of local government in the system, and we would like to explore the causal pathways and thus outcomes that are within the remit of local government or controlled by other actors. Such controllability analysis may tell us something about how, and by whom, public health issues can usefully be addressed.
We currently make use of dynamic map exploration with the PRSM software to help stakeholders navigate the complexity of the system, whilst preserving the visualisation of its breadth. However, pared down ‘meta-maps’ highlighting the strongest or most significant links could be produced as an aid to understanding. However, as this is a participatory model, the choice of the links that should be considered as most important, and hence those that should be included in a high-level map, should be made by a diverse set of participants in a workshop or online data collection setting, rather than by us, the facilitators, or by particular groups of actors. This would have to be carefully conducted to avoid introducing bias, but could form part of the future work.
Work connecting the mapping with simulation methods would also be useful, including a further elaboration and investigation of the indirect effects and feedback loops, with the possibility of using systems dynamics simulation of these parts of the system to explore how these could play out over time. This would require the specification of differential equations for the interactions between component parts; this is relatively straightforward for physical components of the map, but notoriously difficult for social and other qualitative components and relationships. It also necessarily involves a reduction in the number of variables included and model scope, and thus must be performed with care to avoid a misleading reduction in complexity. Defining parts of a system that correspond to meaningful dynamical problems and considering them appropriately within the context of real system complexity is a fundamental challenge in system dynamic approaches [
20]. Bespoke workshop processes in which stakeholders generate proposed functional forms for qualitative or data-poor connections could be possible for defined subsections of the map. Hybridising the PSM and system dynamic approaches, with contextual connections from the PSM used to generate scenarios in which feedback loops are embedded, might also be possible with further methodological developments. This hybrid approach could be particularly useful in contexts with a limited IT infrastructure or local data availability, enabling the appraisal of proposed air quality interventions.
Linking qualitative causal mapping to empirical traffic emissions models, by demonstrating the additional causal influences, which have an impact on emission model variables and perhaps using semi-quantitative approaches to produce various model scenarios, could also be explored.
Our goal was to develop our participatory processes, modelling and analysis techniques, which together constitute PSM in order to foster system-appropriate policies. These techniques include many other system methods and approaches, but we strongly believe that this is the direction in which systems work for policy, and indeed policy making itself must move in order to face the multiple societal, complex systems challenges of our time.


 ,
, 


