Article

Evaluation of Ground-Based Models for Estimating Surface Albedo with In-Situ Radiometric Measurements across China

1
Water Resources Research Center, Department of Planning, Yunnan Survey and Design Institute of Water Conservancy and Hydropower, Kunming 650021, China
2
State Key Laboratory of Water Resources and Hydropower Engineering Science, Wuhan University, Wuhan 430072, China
*
Author to whom correspondence should be addressed.
Atmosphere 2022, 13(3), 412; https://doi.org/10.3390/atmos13030412
Submission received: 16 January 2022 / Revised: 27 February 2022 / Accepted: 2 March 2022 / Published: 3 March 2022
(This article belongs to the Special Issue Agrometeorology)

Abstract

:
Surface albedo is an essential parameter in many solar radiation applications. Although several models are available, it remains debatable whether they are applicable to other locations. Using long-term daily measurements of radiation acquired by observational networks in China, this study examined the applicability of six existing albedo models: Ineichen model (IeM), Gueymard model (GM), Dong model (DeM), Iziomon-Mayer model (IMM), Morton model (MM), and Zhou model (ZeM). The evaluation results of model performance through statistical analysis showed that among the available ground albedo models, ZeM had the best overall performance at 12 selected stations, IeM was shown to provide acceptable estimations for locations where albedo records are readily available. The statistical results of individual station have shownthat the number of input parameters is not the only key factor for determining the predictive performance of ground albedo models. In other words, a simple model has potential for accurate estimation of ground albedo with appropriate model parameters. Therefore, the simple two-parameter DeM was selected to re-calibrate with in-situ radiometric measurements, which can be adopted as a surrogate for ZeM to predict surface albedo in China.

1. Introduction

Increasing application of solar energy in various respects for environmental and economic proposes has highlighted the importance of reliable estimation of solar radiation incident on a target surface [1,2,3], which consists primarily of direct, diffuse, and reflected components [4]. The most direct method for achieving such estimations is to conduct in situ measurements, which entails implementation of a set of various instruments to sample the temporal variations of these components at the measured surface [5]. Of the three components of solar radiation, the reflected component is the most complex because it is strongly conditioned by surface properties and diverse external factors [6], making it inappropriate to apply site-specific measurements to other unmonitored locations [7]. Furthermore, the high costs of instrumentation and technical constraints have meant that reflected radiation was measured only at limited scientific stations in earlier studies [8,9]. Owing to a lack of observational data, pioneering researchers (e.g., Liu and Jordan [10]) usually quantified the reflected component of radiation in terms of surface albedo, defined as a fraction of the accessible global solar radiation [11]. This alternative has been used widely in subsequent radiation-related studies.
As an essential climate variable for controlling the surface energy budget, surface albedo has been measured routinely at an increasing number of meteorological stations around the world [12,13]. Meanwhile, certain databases such as the Global Energy Balance Archive have been developed through systematic extraction of solar radiation data measured at globally distributed observing stations [14]. Continuous measurements of surface albedo with high temporal resolution have been achieved following the increase in coverage of regional and global radiometric networks, e.g., Fluxnet [15], the Greenland Climate Network [16], and the Baseline Surface Radiation Network [17]. Nevertheless, ground-based radiometric measurements have limited spatial resolution because it is not possible to install the expensive instrumentation required at all locations necessary [6,18]. Understanding the spatial heterogeneity of surface albedo at regional and global scales requires remotely sensed measurements, which could be acquired using airborne [19] and/or satellite instruments [12]. Recently, together with the increasing availability of multi-decadal satellite data, the derivation of albedo from satellite-based products has become the most practical method for estimation of regional and global surface albedo in climate and biogeochemical modelling [20,21]. The retrieval of surface albedo from remote sensing measurements entails the removal of the effects of coupled atmosphere–surface scattering processes, which involves applying corrections for both atmospheric effects and anisotropic surface reflections [22]. The inherent complexity of land surface processes results in considerable uncertainty in the albedo retrieved using satellite products, which should be evaluated carefully prior to use [23]. It has become common to use radiometric measurements for validation of satellite-derived albedo via direct point-to-pixel comparisons [12,24,25,26] or upscaling methods [23]. In addition, radiometric measurements have been proven important in the following respects: (1) detection of decadal changes in surface radiative components [13,27]; (2) generation of spatiotemporally continuous albedo datasets for use in combination with regional and global satellite-based albedo products [28,29]; (3) validation of simulated results of surface albedo in physical models [6]; and (4) use in applications such as solar power generation and agricultural water management [1,30]. These applications highlight the importance of systematic and continuous radiometric measurements. However, most areas of the world remain unmonitored. The practical needs of solar radiation applications in unmonitored regions rely strongly on the development of predictive models for estimation of solar radiation components including surface albedo.
Over previous decades, numerous studies have investigated parameterization of surface albedo using different model parameters at different timescales. Gueymard [31] presented a regression equation to estimate monthly average surface albedo as a function of latitude. Paltridge and Platt [32] proposed a general exponential equation to describe the dependence of surface albedo on solar height angle, which has been applied to estimation of surface albedo over certain land cover types, e.g., grassland [30,33], cropland [34], and bare soil [35]. Nkemdirim [8] proposed an exponential function to describe diurnal, latitudinal, and seasonal variations of surface albedo with the position of the Sun in terms of solar zenith angle (SZA). Alnaser [36] calculated monthly average albedo as a function of relative sunshine duration. Morton [37] determined daily average surface albedo by integrating the Nkemdirim equation over the range of SZAs, weighted with the diurnal course of extraterrestrial radiation, and by incorporating the relative sunshine duration to take the impact of cloud cover into account. Zhou et al. [7] modified the Morton model by adding a function of the leaf area index (LAI) to account for the effect of vegetation phenology on seasonal variation of surface albedo. They applied their proposed model to estimation of the zonal surface albedo of a hypothetical reference surface in different agricultural zones across China. In general, these ground-based models adopted surface albedo parameterized to certain accessible ground-based measurements, e.g., geographic information (i.e., latitude, longitude, and elevation), sunshine duration, and precipitation. In addition, other influential factors have increasingly been taken into consideration as a reflection of the progress in the understanding of surface-reflected processes. Recently, some physical models, which can simulate reflected processes precisely, have been developed for surface albedo estimation for any climate and receiver geometry without need of site-dependent measurements [6]. However, ground-based models remain the primary tool in many respects owing to the simplicity in their application and the relatively less computational effort involved.
Evaluation of the performance of such ground-based surface albedo predictors against ground-based measurements has been undertaken in sporadic studies. For example, Ineichen et al. [38] used six databases of multi-year measurements from four countries to examine five surface albedo estimation models, obtaining the best results with a site-dependent constant mean value. Psiloglou and Kambezidis [4] evaluated eight models for surface albedo estimation against in-situ measurements that were obtained at the National Observatory of Athens. They found adaptation to the local conditions of models that were more complex was superior to models that used a constant albedo value. However, some critical issues remain: which is more appropriate among these existing models, is the model parameter more, the better the model performance?
In China, a network of 105 stations has been established to measure radiation components over all major climatic zones [7]. Multi-decadal data measured by this network are available online, providing the opportunity to address the outstanding issues highlighted above. Therefore, the main objective of this study was to assess existing models for surface albedo estimation with in-situ radiometric measurements across China during 1993–2015. The findings of this study could provide an important reference for future model development in large regions with different conditions.

2. Materials and Methods

2.1. Observational Sites and Data Processing

Among the present-day network of 105 radiation stations, only the 21 first-level stations have measured simultaneously the reflected and global radiation components required for surface albedo estimation since 1993 [7]. Excluding one pair of stations with close geographic location (i.e., Shanghai and Chengdu) and shorter records of observations, daily observations of radiation and meteorological parameters recorded at the remaining 19 stations were obtained for use in this study from the National Meteorological Information Centre (NMIC), a central depository of meteorological data sponsored by the China Meteorological Administration. Observed surface albedo can be computed directly using reflected and global radiation:
α Dm k , i = R r k , i R g k , i
where α Dm is the daily mean value of measured surface albedo, R r and R g are measured values of daily reflected and global radiation, respectively, and superscripts k and i are used to denote parameters on the kth day and in the ith year, respectively.
Among the various influencing factors of surface albedo, snow cover has notable impact on the surface properties of the radiation layer by directly replacing its underlying surface [21,26]. It introduces considerable uncertainty for surface albedo estimation because the surface albedo of snow cover can fall from 0.90 to 0.50 or less, depending on snow condition [39]. Therefore, this study focused on snow-free surface albedo, referred to as ground albedo. All measured data required for surface albedo computation are examined by NMIC through standard processes for data quality control. However, when computing daily mean values of measured ground albedo using Equation (1) for model evaluation, the following six types of measured data were discarded:
  • Missing values of daily global radiation component;
  • Missing values of daily reflected radiation component;
  • Zero values of daily global solar radiation and/or daily reflected solar radiation
  • Measured values of daily reflected radiation near the minimum detection limits of the instrumentation;
  • Values observed during snow-covered seasons;
  • Values when corresponding meteorological variables as model inputs were unavailable.
After quality control processing, four stations located in cold regions (i.e., Urumchi Mohe, Shenyang, and Harbin stations) were identified as receiving rainfall and frequent snowfall with air temperatures below zero during winter-spring seasons. Consequently, daily measurements from these four stations acquired during the cold seasons were largely discarded. Therefore, daily measurements from 12 stations with valid data available for all days of the year during 1993–2015 were selected to evaluate the predictive performance of the studied models. Details of the geographic locations and solar radiation datasets of the 12 selected stations are listed in Table 1 and illustrated in Figure 1.
The predictive performance of ground-based models for surface albedo estimation is commonly evaluated through comparison of modelled results conducted for several specific sites against in situ measurements obtained at those sites [7,40]. However, it has been shown that almost everything forming the surroundings of a specific site affects the surface albedo of that site [6]. This dependence of ground albedo on multiple factors makes it impossible to develop a ground-based model that integrates all relevant influencing factors. Actually, for most proposed predictive models, the anisotropy of surface albedo is described by only one or two model variables [7,41]. It is impracticable to use point-to-point comparison methods to assess the performance of ground-based models with consideration of only a limited number of influencing factors against in situ measurements that were obtained under the effect of all influencing factors. Moreover, in situ measurements used for computing surface albedo themselves have inherent uncertainties related to instrument precision and data processing [42]. In this context, multi-year mean values of daily ground albedo are recommended for use as true values in model evaluation, which can be determined as follows:
α Ym k = 1 L k i = 1 L k α Dm k , i
where α Ym is the multi-year mean value of daily ground albedo, and L is the number of years with valid data after data quality control.

2.2. Surface Albedo Prediction Models

2.2.1. Ineichen Model (IeM)

In pioneering studies of the solar energy balance over a large land area, it was customary to use a constant (i.e., 0.20) as an a priori value of zonal mean albedo because of the scarcity of ground albedo observations [1,4]. Following the development of advanced instrumentation for measuring radiation, Ineichen et al. [38] used site measurements of radiation components to examine the applicability of the default value. Their comparative results showed ground albedo is generally site-dependent and should be replaced by a value more representative of the measurement site. Following the suggestions of Psiloglou and Kambezidis [4], geometric mean value is used in the evaluation, i.e.,
α IeM = k = 1 K α Ym k 1 / K
where α IeM is IeM-estimated ground albedo, K is the number of days with valid measured data.

2.2.2. Gueymard Model (GM)

Gueymard [31] attributed the site variation of surface albedo to latitude dependence and parameterized the monthly regional albedo as a function of latitude through polynomial fitting of site measurements of surface albedo in North America as follows:
α GM φ = C Φ T
where α GM is GM-estimated ground albedo, Φ = 1 , φ , φ 2 , φ 3 is the variable matrix, in which φ (deg.) is latitude, and C = (c0, c1, c2, c3) is the coefficient matrix. When latitude is < 30°, C = (−0.18, 0.024, −0.0004, 0); when 30° < φ < 60°, the coefficient matrix C is specific for each month, as provided by Gueymard [31]. In addition, daily values can be obtained through interpolation. Although GM was proposed originally to estimate regional ground albedo, it has been extended to prediction of local ground albedo [4].

2.2.3. Dong Model (DeM)

Paltridge and Platt [32] examined the dependence of surface albedo on solar height angle and proposed an exponential equation for determining surface albedo; however, they did not provide values of the model parameters for detailed land types. Subsequently, Dong et al. [30] collected meteorological data from a network of 53 stations in California (USA) to examine the efficacy of the exponential equation through nonlinear regression analysis, and a modified exponential equation was proposed:
α DeM k = 0.0905 h k + 0.3860 exp 1.0772 h k
where α DeM is DeM-estimated ground albedo, h (rad) is the solar height angle, which is determined as follows:
h k = π 2 δ k π 180 φ
in which δ is solar declination

2.2.4. Iziomon-Mayer Model (IMM)

Iziomon and Mayer [33] recognized that the limitation of DeM in estimating surface albedo results from its ignorance of certain elevation-dependent factors, and they modified DeM by incorporating an elevation term:
α IMM k = 0.0905 h k + 0.3860 exp 1.0772 h k + 0.00002 H
where α IMM is IMM-estimated ground albedo, H (m) is the altitude of the target location.

2.2.5. Morton Model (MM)

Nkemdirim [8], who found that surface albedo is largely dependent on SZA, expressed the instantaneous clear-sky ground albedo as an exponential function of SZA. By integrating the Nkemdirim equation over the range of SZA, Morton [37] developed an empirical model for determining daily average albedo:
α MM k , i = α 0 MM k S k , i + 1 S k , i a MM + b MM Z k
where α MM is MM-estimated ground albedo, S is the relative sunshine duration, Z (=0.5π − h) (rad) is the SZA at noon, aMM and bMM are constants, and α 0 MM k is the daily mean value of ground albedo under clear sky conditions determined as follows:
α 0 MM k = α z F ω 0 , Z k
F ω 0 , Z k = exp 0.5 π ω 0 exp ω 0 Z k ω 0 cos Z k + sin Z k 1 + ω 0 k 1 sin Z k
where ω0 is a constant associated with radiation layer characteristics. In the procedure of Morton [37], constant ω0 = 0.6875, aMM = 1, bMM = −6/(11π), and αz is determined as follows:
α z = 0.11 α zd 0.17 for α zd < 0.11 for 0.11 α zd 0.17 for α zd > 0.17
where azd is the zenithal clear-sky ground albedo in the dry season given by:
a zd = 0.26 0.00012 p s 0.5 P 1 + φ / 42 + φ / 42 2
in which P (mm) is the mean annual precipitation, and ps is the relative atmospheric pressure.

2.2.6. Zhou Model (ZeM)

Zhou et al. [7] used the same form of equation as shown in Equation (8) to estimate ground albedo of a grassy surface but with the following three modifications:
  • ZeM uses different values of two coefficients from those used in the MM (i.e., aZeM = 0.832, bZeM = 0.032) to take the effect of cloud cover into consideration.
  • ZeM treats a vegetated surface as a mixture of vegetation and its underlying bare soil to incorporate the effect of vegetation phenology, weighted by the proportions of bare soil and vegetation coverage. The daily mean ground albedo under clear sky conditions is thus determined as follows:
    α 0 ZeM k = α s k ( 1 f 0 k ) + α v k f 0 k
    in which f0 is the fraction of vegetation cover given by [7]:
    f 0 k = 1 exp ζ ψ k
    where ψ is the daily LAI, ζ is the canopy extinction coefficient, α s and α v are the daily mean values of clear-sky ground albedo over the bare soil surface and over the vegetated surface, respectively.
  • ZeM notes the discrepancy in form between Nkemdirim’s exponential function and the regression equations of numerous subsequent observations for describing the variation of instantaneous ground albedo with SZA, and it modifies the exponential function by adding a constant term. The computational formulae of α v and α s thus become
    α v k = A v F ω v , Z k + B v 0.5 π Z k
    α s k = A s F ω s , Z k + B s 0.5 π Z k
    where ωs and ωv are statistically estimated coefficients, and Av, As, Bv, and Bs are empirical constants. In the calculation procedure, ωs =0.4732, ωv =0.6090, and the empirical coefficients As and Av can be determined as follows:
    A s = C 1 s P r 0.5 ξ s + C 2 s
    A v = C 1 v P r 0.5 ξ v + C 2 v
    where ξs and ξv are constants, and C1s, C2s, C1v, and C2v are constants that need to be calibrated. The values of these constants have been calibrated against meteorological observations across China.

2.3. Statistical Evaluation

The performance of the studied models was evaluated using six dispersion indicators and one global performance indicator (GPI). The dispersion indicators included the mean absolute percentage error (MAPE), root mean square error (RMSE), relative root mean square error (RRMSE), t-statistics (TS), uncertainty at 95% (U95), and coefficient of determination (R2). Details of these dispersion indicators are listed in Table 2. The closer the R2 value is to 1, and the smaller the values of all other indicators, the better the model performs.
The GPI, proposed by Despotovic et al. [2] to compare the performance of various different models, combines all the selected dispersion indicators into a single indicator, i.e.,
GPI m = j = 1 6 κ j η ^ j η j , m
where GPI m is the GPI value for model m, η j , m is the scaled value of indicator j for model m, 0 is scaled for the minimum value, and 1 for the maximum value; η ^ j is the median of the scaled value of indicator j, κ j is equal to 1 for all indicators except it is equal to −1 for j = 6 (R2). A higher value of the GPI indicates greater model accuracy.

3. Results and Discussion

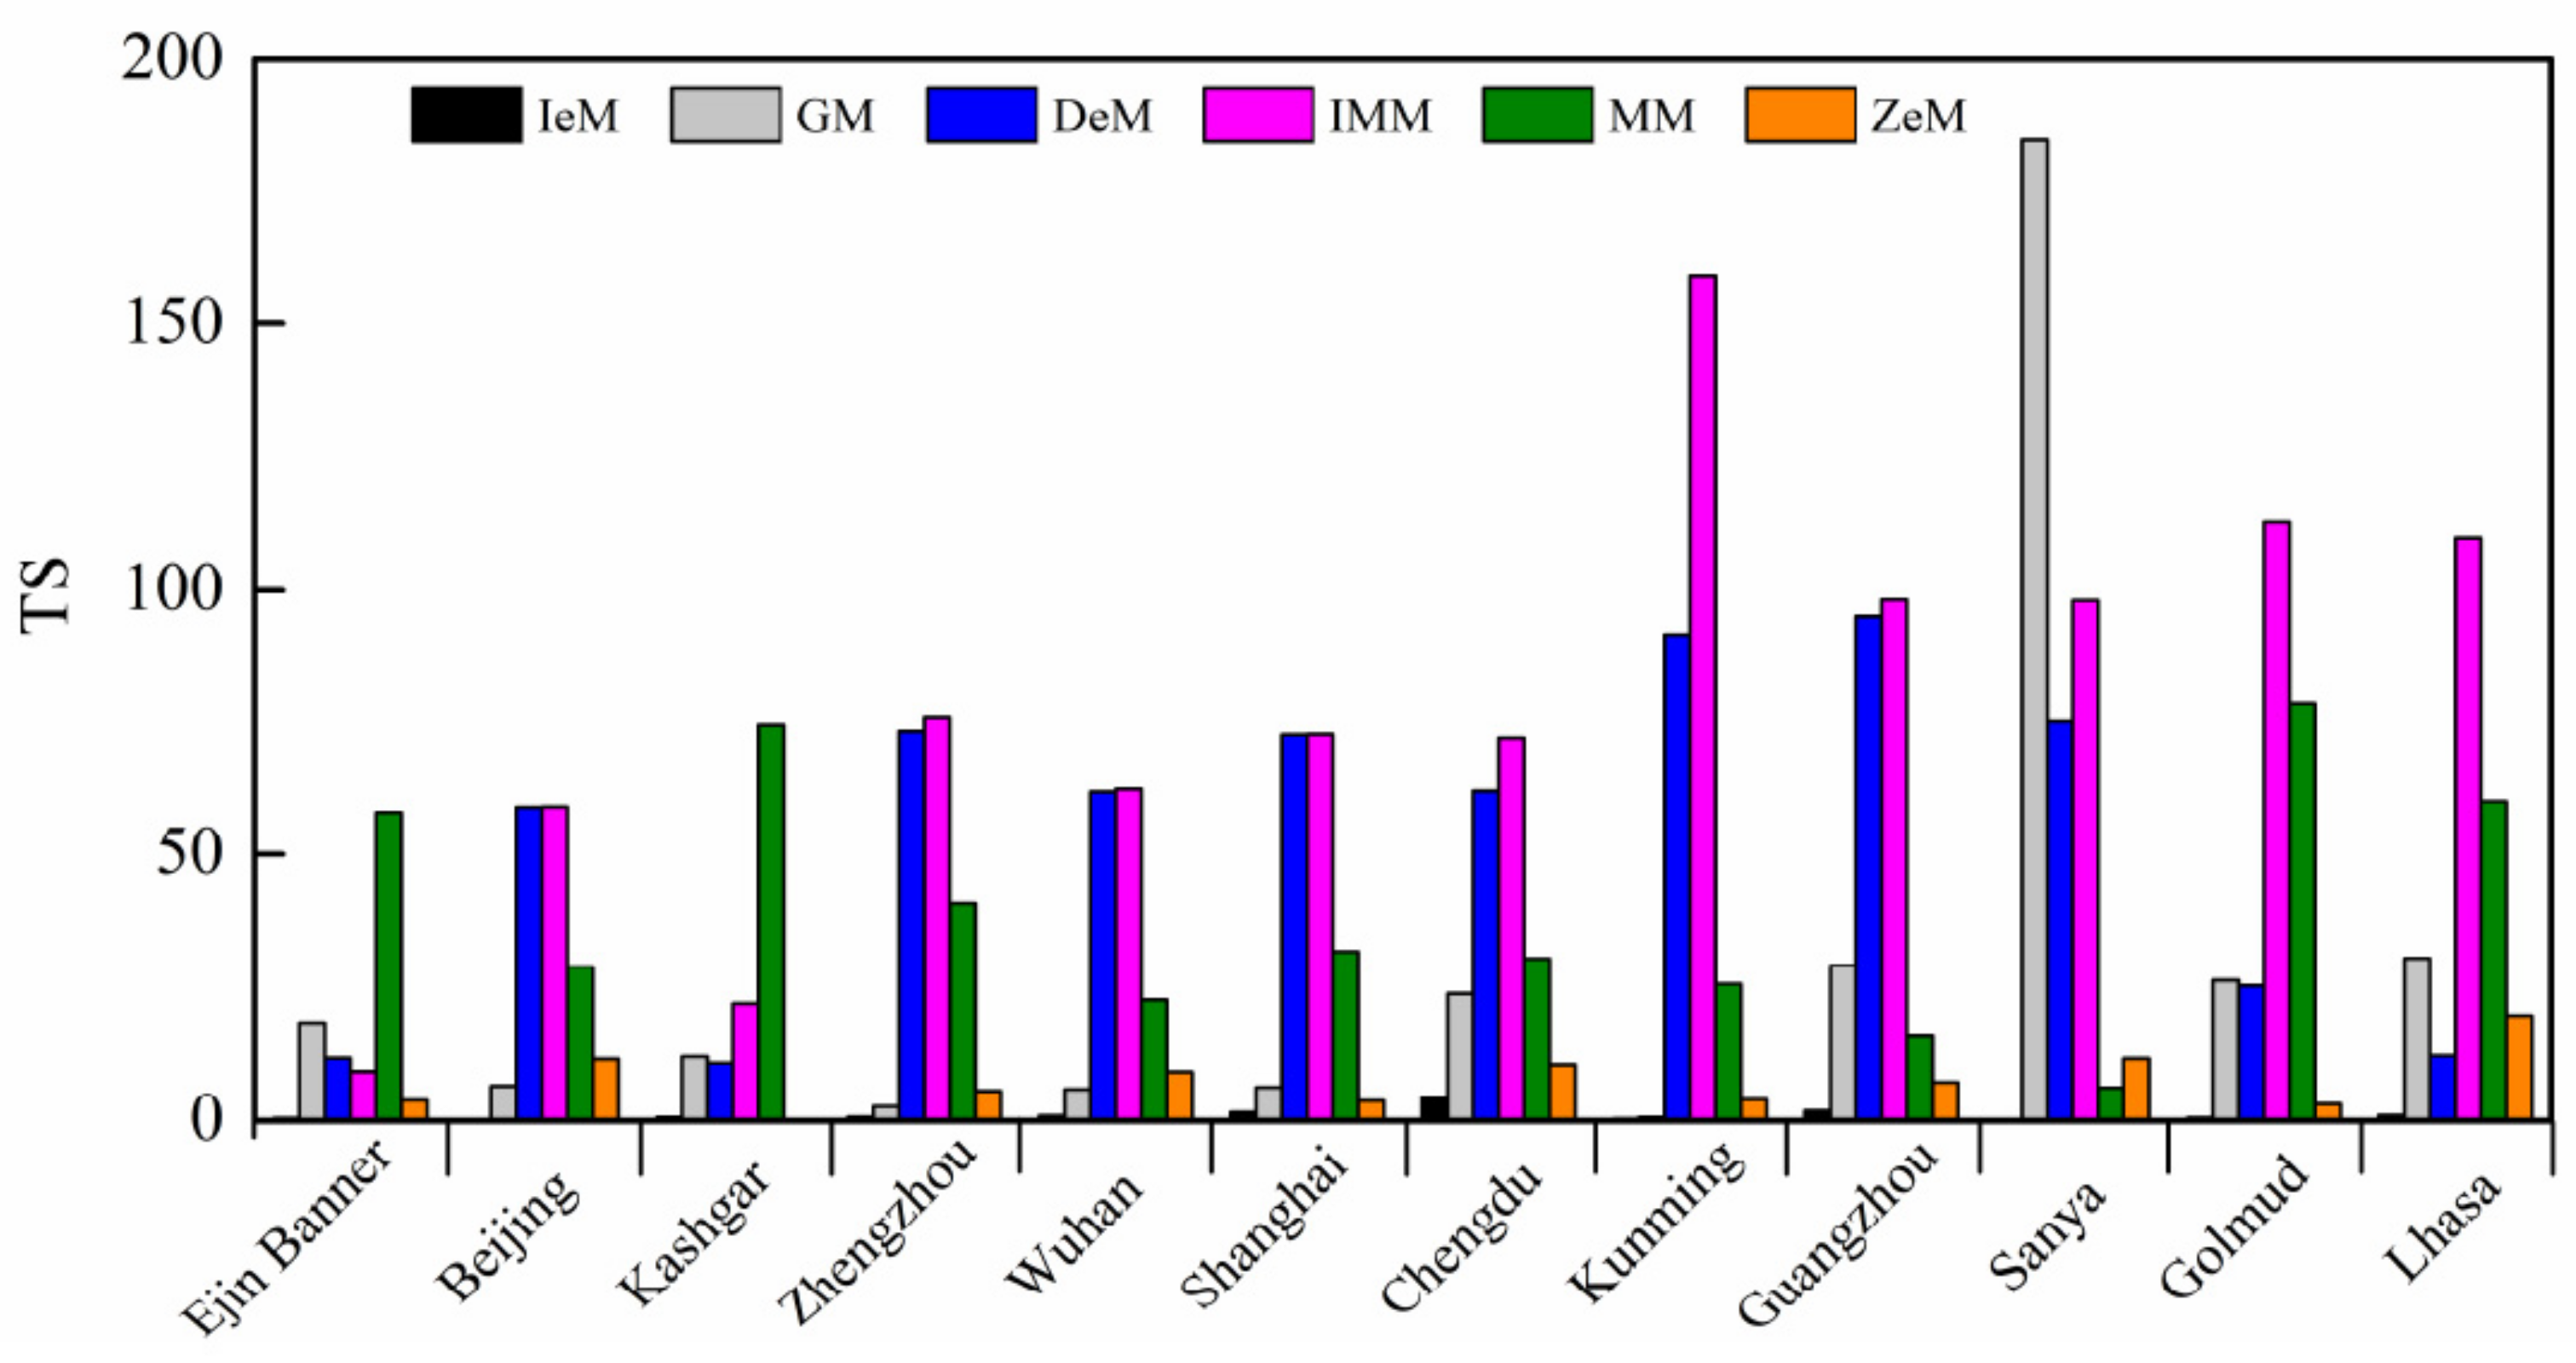
3.1. Model Evaluation

Figure 2 depicts graphically the MAPE values for the six models. It can be seen from the figure that the best MAPE was obtained with ZeM, which produced the smallest MAPE at 10 out of 12 selected stations with mean MAPE of 3.76% ranging from 2.00% (Golmud) to 6.10% (Chengdu). IeM also produced acceptable estimations of surface albedo at all selected stations with mean MAPE of 4.82% ranging from 3.02% (Sanya) to 9.28% (Lhasa). For the remaining models, i.e., GM, DeM, IMM, and MM, the MAPE values were in the range 3.35–34.58%, 6.55–43.03%, 6.11–52.55%, and 6.23–48.98%, respectively.
The lowest values of RMSE were obtained for ZeM at 9 out of 12 selected stations with mean RMSE of 0.0087 varying from 0.0055 (Golmud) to 0.0152 (Kashgar). For IeM, GM, DeM, IMM, and MM, the RMSE values were in the range 0.0068–0.0225, 0.0070–0.0664, 0.0170–0.0702, 0.0188–0.0898, and 0.0134–0.1094, respectively. In terms of RRMSE, as presented in Figure 3, ZeM showed the lowest values at 11 out of 12 selected stations with mean RRMSE of 4.62% ranging from 2.54% (Golmud) to 7.62% (Chengdu). IeM also provided reasonably small values of RRMSE (mean: 5.99%). However, the mean RRMSE values of the remaining four models were dramatically higher than both ZeM and IeM, ranging from 18.34% (GM) to 32.03% (IMM). Jamieson et al. [44] used the criteria “excellent”, “good”, “fair”, and “poor” to test the goodness-of-fit between estimated results and measured data. For solar radiation time series, a RRMSE values of <10%, 10–20%, 20–30%, and >30% are considered excellent, good, fair, and poor, respectively [45]. According to these criteria, the RRMSE indicator ranked ZeM excellent at all selected stations. Although the RRMSE ranked GM fair at high-latitude stations (e.g., Ejin Banner, Beijing, Kashgar, and Golmud stations), the model was ranked excellent or good at certain mid-latitude stations (e.g., Kunming, Wuhan, and Shanghai stations). Similar results were found based on the estimated results from the other five models.
The mean U95 values were 0.0312, 0.0869, 0.0903, 0.1196, 0.1065, and 0.0230 for IeM, GM, DeM, IMM, MM, and ZeM, respectively, i.e., IeM produced the lowest U95 value. In terms of individual stations, the estimated TS values for the GM, DeM, IMM, MM and ZeM models significantly greater than 1.96 (except ZeM that produced TS value of <1.96 at the Kashgar station, Figure 4), indicating statistically significant difference between the paired values of estimated and measured data at the 95% confidence level. However, for the IeM model, the calculated TS values for the 12 selected stations are generally less than 1.96.
In terms of R2, ZeM showed the highest degree of agreement between the estimations and measurements with mean R2 of 0.3942. Despite being the model with the best overall performance, the R2 values of ZeM, which ranged from 0.0029 to 0.9459, reflected that the model produced an almost perfect linear relationship between the modelled results and measured data at certain studied stations (e.g., Ejin Banner, Guangzhou, Golmud, and Lhasa stations), while it performed poorly at other stations (e.g., Chengdu, Wuhan, and Kashgar stations). The R2 value for IeM was zero at each selectedstation, and the remaining models (i.e., GM, DeM, IMM, and MM) had R2 values of around zero at most selected stations, indicating absence of a linear relationship between the modelled results and measured data. Comparisons of the modelled results with measured data at 12 selected stations are shown in Figure 5.
The calculated GPI values for the studied models are presented in Figure 6. Based on the composite indicator GPI, ZeM was found the best-performing model for ground albedo estimation in China with mean GPI of 1.58 varying from 0.95 (Ejin Banner) to 2.29 (Beijing). The second most accurate model was IeM with mean GPI of 0.68, followed by GM (−0.78), MM (−1.22), and DeM (−1.65); the model with the poorest performance was IMM (−2.64). It should be noted that the two most accurate models, i.e., ZeM and IeM (in essence), were developed using in situ measurements from meteorological stations in China, whereas the remaining four models (i.e., GM, DeM, IMM, and MM), which produced unsatisfactory predictions of ground albedo in China, were proposed based on measurements processed from sites outside China. It is emphasized that existing ground- based albedo models are generally site-specific and are thus inapplicable to other locations without model re-calibration. It is also important to note that some simple models with poor overall performance produced the best GPI value at certain individual stations. For instance, GM produced the best GPI value at Chengdu station. It reveals that for large-scale areas with different conditions, it is impossible for a fixed-parameter model, even a complex one, to perform well everywhere, whereas even a simple model has potential for accurate estimation of ground albedo with appropriate model parameters.

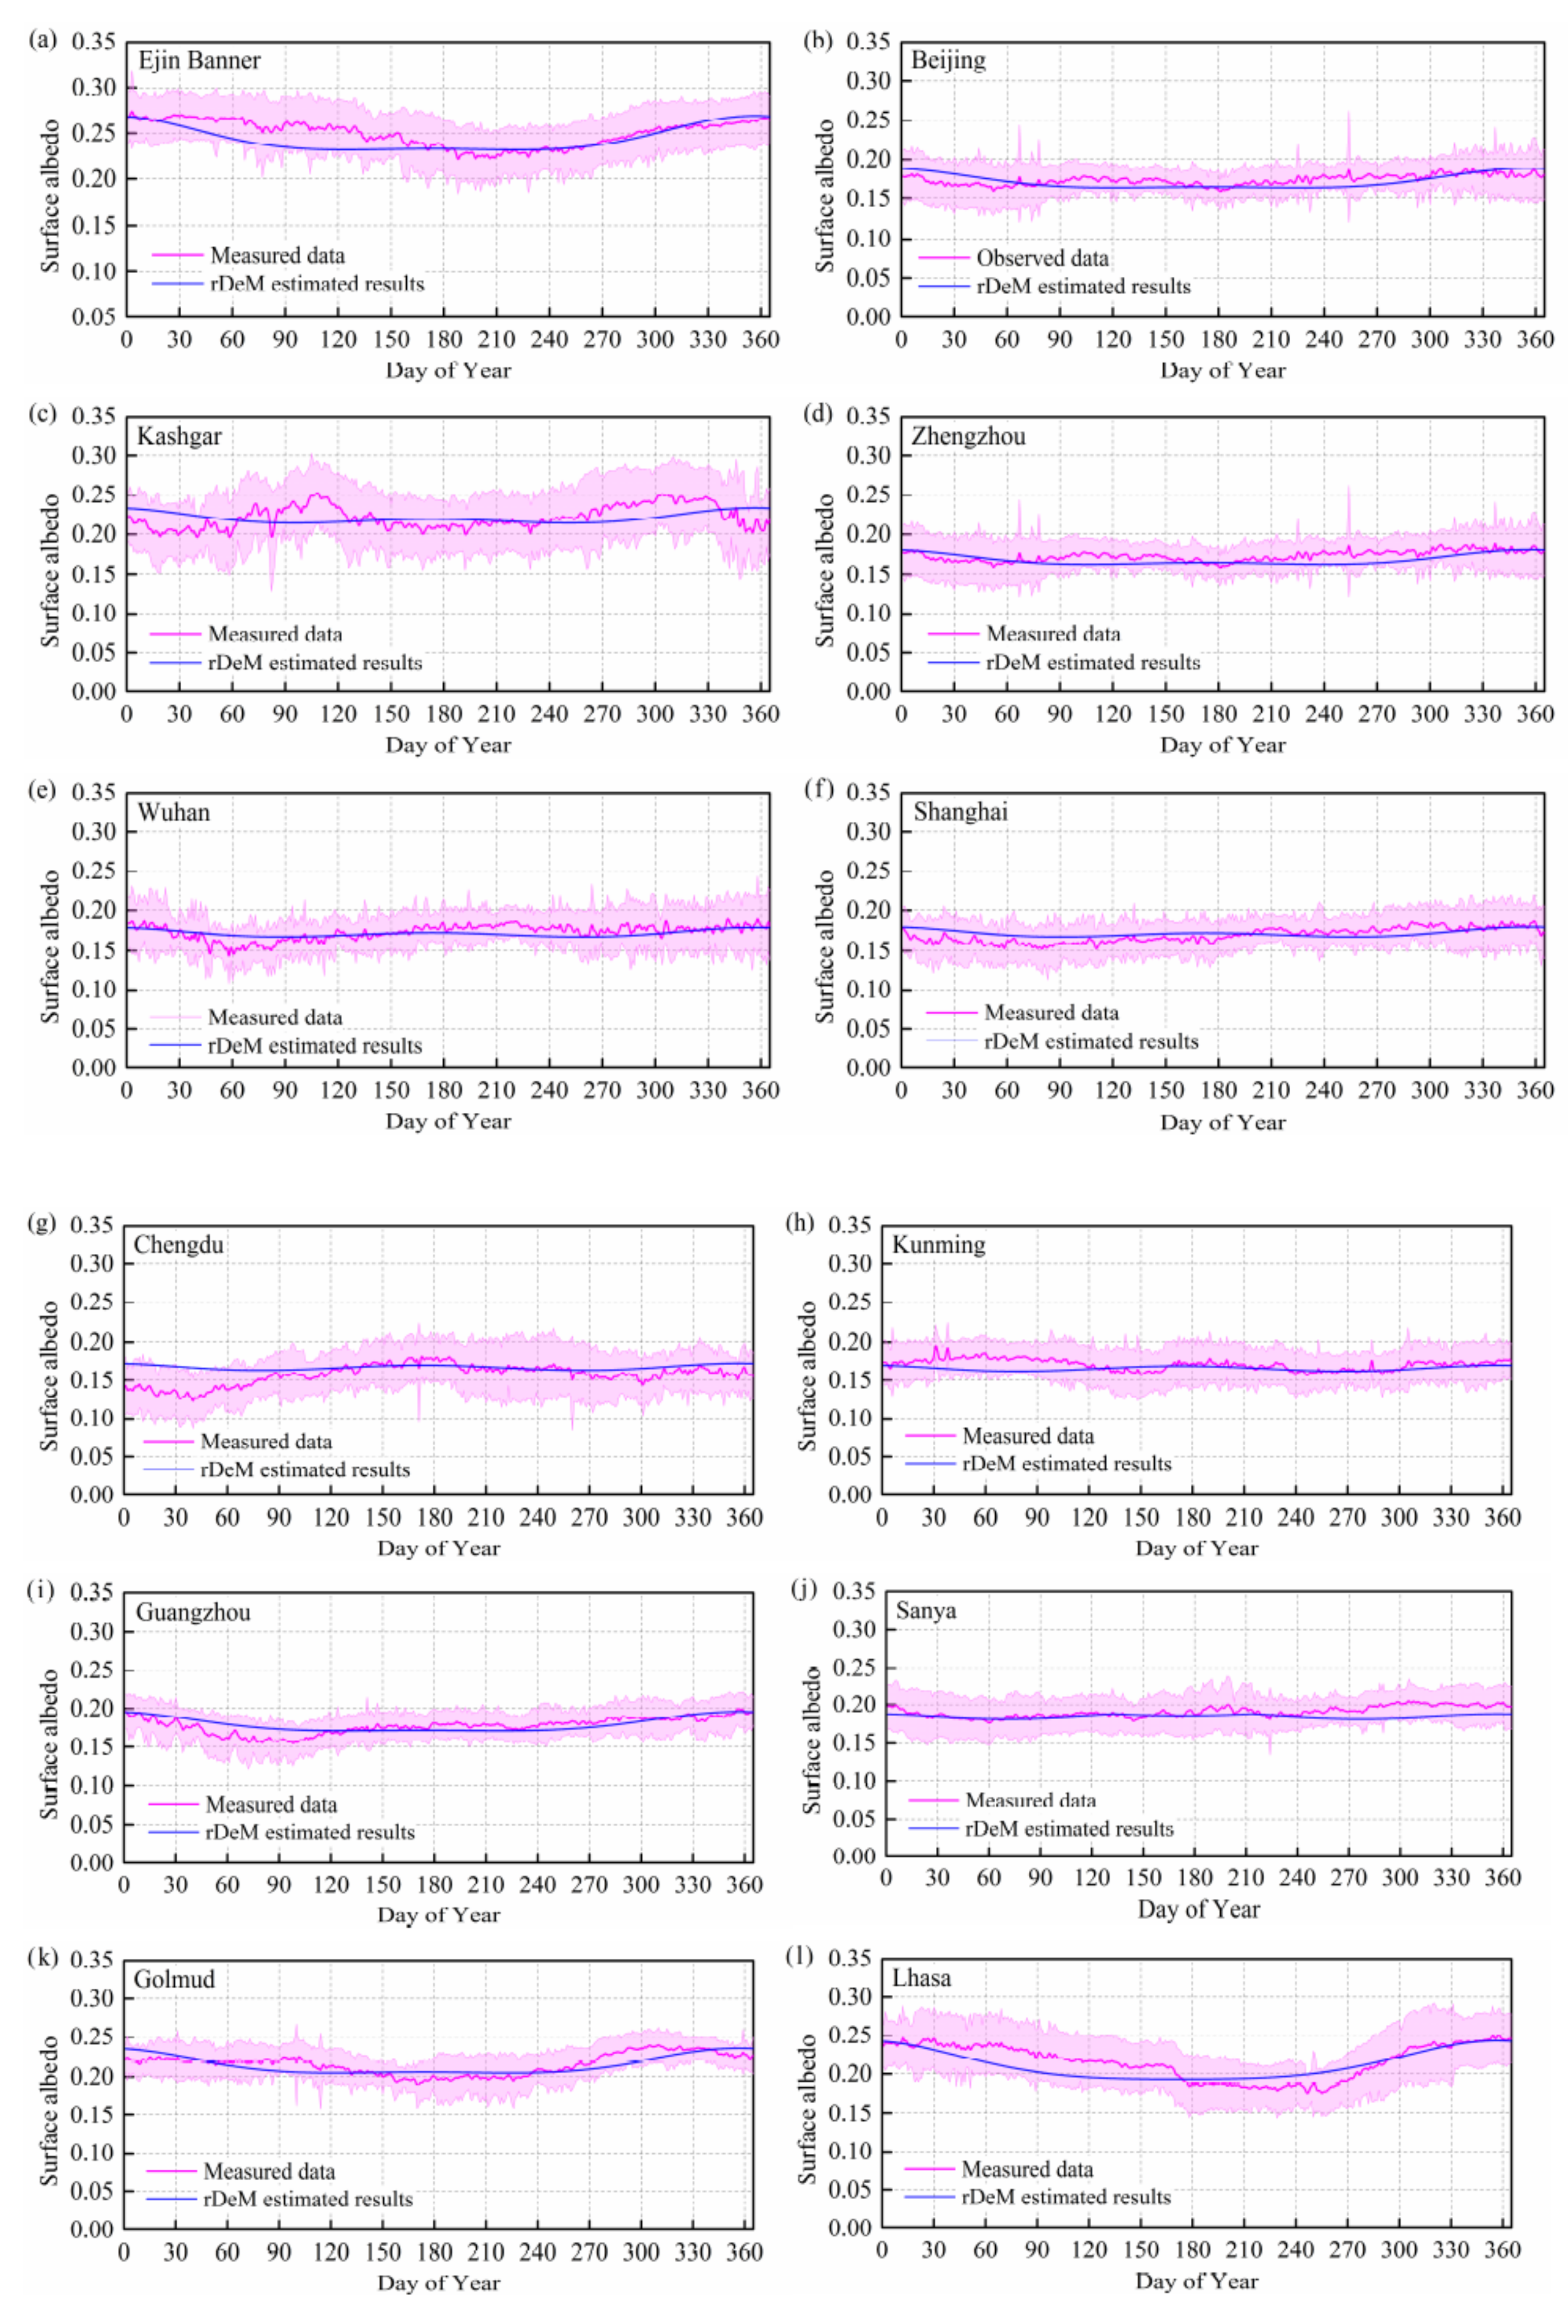
3.2. Re-Calibration with In-Situ Measurements

Previous studies have shown that ground albedo is largely dependent on solar height angle. In addition, the use of the solar height angle has the advantage that this single easily accessible variable can account for both the spatial and the temporal variations of surface albedo with latitude and solar seasonal variation, respectively. Therefore, DeM was selected to re-calibrate (referred to as rDeM) with in-situ measurements across China. The general equation of rDeM can be written as
α rDeM k = a n k H k + b n k exp 1.0772 H k
where α rDeM is rDeM-estimated daily ground albedo, a and b are constants to be calibrated against measured data, and subscript n denotes parameters for the nth station.
The general equation for each delineated region was calibrated against the measured data from the 12 selected stations. The values of an and bn were adjusted repeatedly until the calculated results of the selected statistical indictors were as close as possible to their ideal values. The calibrated values of an and bn for all studied stations are listed in Table 3. Figure 7 depicts the comparisons between the estimated results and the measured data with acceptable values of MAPE in the range from 2.99% to 6.28%, RMSE from 0.0075 to 0.0168, RRMSE from 4.03% to 7.57%, U95 from 0.0116 to 0.0463, TS from 1.19 to 9.11, and R2 from 0.0078 to 0.7879, as listed in Table 3. With consideration of the indicator GPI illustrated in Figure 8, rDeM has the potential to predict surface albedo as accurately as a complex model (ZeM). The results indicate that rDeM can be adopted as a surrogate for ZeM to predict surface albedo in China.

3.3. Temporal Stability Analysis

Surface albedo varies with everything that forms the local surroundings. These are impossible to parameterize fully into a simple model, whilst in situ measurements used for model development would be conducted under the effect of all possible factors. Therefore, in this paper multi-year mean daily values of time series data were used to evaluate and calibrate the studied models. Given the vulnerability of time series dynamics to alterations in the mean and variance [48], particular care should be taken to check the temporal stability of the time series data obtained from all the selected stations. To eliminate the effect of short-term random fluctuations and daily data gaps arising from data quality control, monthly mean values of measured ground albedo were used for the analysis, which were derived as follows:
α Mm r , k = 1 N r i = 1 N r α Dm k , i
where α Mm is the monthly mean value of daily ground albedo, Nr is the number of days in the rth month.
For the rth month, the Θr-year accumulated mean and corresponding variation coefficient were determined as follows:
μ r , Θ r = 1 Θ r i = 1 Θ r α Mm r , i ,   1 < Θ r I
σ r , Θ r = 1 μ Mm r , Θ r 1 Θ r 1 i = 1 Θ r α Mm r , i μ r , Θ r
where I is the number of years in the period, μ r , Θ r and σ r , Θ r are the mean and the variance, respectively. If a value of Θr exists that is less than I and makes the following two formulae true, and where the formulae are also satisfied for an arbitrary value greater than Θr, the time series tested in the rth month can be considered temporally stable:
Δ μ r , Θ r = μ r , Θ r μ r , I / μ r , I ε μ
Δ σ r , Θ r = σ r , Θ r σ r , I / σ r , I ε σ
where Δ μ and Δ σ are the relative differences for the mean and the variation coefficient in the rth month, and ε μ and ε σ are acceptable relative differences. Taking two stations as examples, the variations of μ r , Θ r and σ r , Θ r with Θr are shown in Figure 9.
It can be seen that the values of Δ μ r , Θ r and Δ σ r , Θ r in each month tend to be stable as i increases. The minimum Θr value was defined as the critical value of observation years for collecting time series data with temporal stability in the rth month, denoted as Θ * r . Hence, the maximum value of the critical values for all months throughout the year is the shortest year for observing data with temporal stability, that is,
Θ * = max Θ * r
where Θ * represents the critical value of observation years for collecting stable time series data at selected stations. The mean and standard deviation of Θ * r for each station are shown in Figure 10. Most generally, if one station in China continuously observes albedo data for more than 10 years, the time series obtained is considered temporally stable.

4. Conclusions

This study investigated the applicability of six available models for ground albedo estimation with long-term measurements of global and reflected radiation components acquired by the network for solar radiation observation across China. Comparative results indicated that model performance does not rely merely on the number of model parameters, that is, a simplemodel with appropriate model parameters has the potential to predict surface albedo as accurately as a complex model. Hence, the simple two-parameter DeM was re-calibrated for surface albedo estimation in China. The detailed conclusions derived from this study are summarized as follows.
  • The evaluation results of model performance through statistical analysis showed that among the available ground albedo models, ZeM had the best overall performance at 12 selected stations for model evaluation. IeM was shown to provide acceptable estimations for locations where albedo records are readily available, which limits its scope of application. However, the simple models with fixed parameters (i.e., GM, DeM, and IMM) are site-specific. Therefore, when applied to other locations, these models should be re-calibrated with measured data.
  • In the re-calibration procedure of DeM, multi-year mean daily values of time series data were used in this paper. Special care was taken to examine the temporal stability of these series. It was found that, in general, a time series of in situ measurements extending over a period greater than 10 years could be considered temporally stable.
  • The performance of re-calibrated DeM was as acceptable as that of the complex ZeM in China. This simple model offers an alternative for surface albedo estimation with easily accessible inputs and less computational effort.

Author Contributions

Conceptualization, G.C. and M.Z.; methodology, G.C.; software, J.C.; validation, G.C., S.G. and J.C.; formal analysis, M.Z.; investigation, G.C. and L.W.; resources, M.Z.; data curation, L.W.; writing—original draft preparation, G.C. and M.Z.; writing—review and editing, S.G.; visualization, L.W.; supervision, S.G.; project administration, G.C.; funding acquisition, G.C. All authors have read and agreed to the published version of the manuscript.

Funding

This research was funded by the National Key R&D Program of China (Grant no. 2021YFC3000205) and the Yunnan Innovation Talents Program (202005AD160017).

Institutional Review Board Statement

Not applicable.

Informed Consent Statement

Not applicable.

Data Availability Statement

Not applicable.

Acknowledgments

We thank James Buxton, M.S, from Liwen Bianji, Edanz Group China (www.liwenbianji.cn/ac, accessed on 15 January 2022), for editing the Englishtext of a draft of this manuscript. The authors are grateful tothe three anonymous reviewers for providing numerous constructive suggestions.

Conflicts of Interest

The authors declare no conflict of interest.

References

  1. Zhang, H.; Xu, Q.; Bian, H. Generation of typical radiation data for difficult climates of China. Solar 2012, 38, 236–248. [Google Scholar]
  2. Despotovic, M.; Nedic, N.; Despotovic, D.; Cvetanovic, S. Review and statistical analysis of different global solar radiation sunshine models. Renew. Sustain. Energy Rev. 2015, 52, 1869–1880. [Google Scholar]
  3. Behar, O.; Khellaf, A.; Mohammedi, K. Comparison of solar radiation models and their validation under Algerian climate–The case of direct irradiance. Energy Convers. Manag. 2020, 117, 236–251. [Google Scholar] [CrossRef]
  4. Psiloglou, B.E.; Kambezidis, H.D. Estimation of the ground albedo for the Athens area, Greece. J. Atmos. Sol. Terr. Phys. 2009, 71, 943–954. [Google Scholar] [CrossRef]
  5. Iqbal, M. An Introduction to Solar Radiation, 3rd ed.; Academic Press: Toronto, ON, Canada, 1983. [Google Scholar]
  6. Ziar, H.; Sӧnmez, F.F.; Isabella, O.; Zeman, M. A comprehensive albedo model for solar energy applications: Geometric spectral albedo. Appl. Energy 2019, 255, 113867. [Google Scholar] [CrossRef]
  7. Zhou, M.; Chen, G.; Dong, Z.; Xie, B.; Gu, S.; Shi, P. Estimation of surface albedo from meteorological observations across China. Agric. For. Meteorol. 2020, 281, 107848. [Google Scholar] [CrossRef]
  8. Nkemdirim, L.C. A note on the albedo of surfaces. J. Appl. Meteor. 1972, 85, 386–392. [Google Scholar] [CrossRef] [Green Version]
  9. Arnfield, A.J. A note on the diurnal, latitudinal and seasonal variation of the surface reflection coefficient. J. Appl. Meteor. 1975, 14, 1603–1608. [Google Scholar] [CrossRef] [Green Version]
  10. Liu, B.Y.H.; Jordan, R.C. The long-term average performance of flat plate solar energy collectors. Sol. Energy 1963, 7, 53–74. [Google Scholar] [CrossRef]
  11. Gueymard, C.A.; Lara-Fanegob, V.; Senguptac, M.; Xie, Y. Surface albedo and reflectance: Review of definitions, angular and spectral effects, and intercomparison of major data sources in support of advanced solar irradiance modeling over the Americas. Sol. Energy 2019, 182, 194–212. [Google Scholar] [CrossRef]
  12. He, T.; Liang, S.; Wang, D.; Cao, Y.; Gao, F.; Yu, Y.; Feng, M. Evaluating land surface albedo estimation from Landsat MSS, TM, ETM +, and OLI data based on the unified direct estimation approach. Remote Sens. Environ. 2018, 204, 181–196. [Google Scholar] [CrossRef]
  13. Wang, L.; Lu, Y.; Zhou, L.; Fan, L.; Wei, J.; Qin, W. Prediction of diffuse solar radiation based on multiple variables in China. Renew. Sustain. Energy Rev. 2019, 103, 151–216. [Google Scholar] [CrossRef]
  14. Gilgen, H.; Wild, M.; Ohmura, A. Means and trends of shortwave irradiance at the surface estimated from Global Energy Balance Archive Data. J. Clim. 1998, 11, 2042–2061. [Google Scholar] [CrossRef]
  15. Baldocchi, D.; Falge, E.; Gu, L.; Olson, R.; Hollinger, D.; Running, S.; Anthoni, P.; Bernhofer, C.; Davis, K.; Evans, R.; et al. FLUXNET: A new tool to study the temporal and spatial variability of ecosystem-scale carbon dioxide, water vapor, and energy flux densities. Am. Meteorol. Soc. 2001, 82, 2415–2434. [Google Scholar] [CrossRef]
  16. Steffen, K.; Box, J. Surface climatology of the Greenland Ice Sheet: Greenland Climate Network 1995–1999. J. Geophys. Res. 2001, 106, 33951–33964. [Google Scholar] [CrossRef]
  17. Driemel, A.; Augustine, J.; Behrens, K.; Colle, S.; Cox, C.; Cuevas-Agulló, E.; Denn, F.M.; Duprat, T.; Fukuda, M.; Grobe, H.; et al. Baseline Surface Radiation Network (BSRN): Structure and data description (1992–2017). Earth Syst. Sci. Data 2018, 10, 1491–1501. [Google Scholar] [CrossRef] [Green Version]
  18. Despotovic, M.; Nedic, N.; Despotovic, D.; Cvetanovic, S. Evaluation of empirical models for predicting monthly mean horizontal diffuse solar radiation. Renew. Sustain. Energy Rev. 2016, 56, 246–260. [Google Scholar] [CrossRef]
  19. Webb, A.R.; Kylling, A.; Wendisch, M.; Jäkel, E. Airborne measurements of ground and cloud spectral albedos under low aerosol loads. J. Geophys. Res. 2004, 109, D20205. [Google Scholar] [CrossRef] [Green Version]
  20. Tasumi, M.; Allen, R.G.; Trezza, R. At-surface reflectance and albedo from satellite for operational calculation of land surface energy balance. J. Hydrol. Eng. 2008, 13, 51–63. [Google Scholar] [CrossRef]
  21. Rechid, D.; Raddatz, T.J.; Jacob, D. Parameterization of snow-free land surface albedo as a function of vegetation phenology based on MODIS data and applied in climate modelling. Theor. Appl. Climatol. 2009, 95, 245–255. [Google Scholar] [CrossRef] [Green Version]
  22. Hay, J.E. A revised method for determining the direct and diffuse components of the total short-wave radiation. Atmosphere 1976, 14, 278–287. [Google Scholar] [CrossRef] [Green Version]
  23. Wu, X.; Xiao, Q.; Wen, J.; Liu, Q.; You, D.; Dou, B.; Tang, Y. Upscaling in situ albedo for validation of coarse scale albedo product over heterogeneous surfaces. Int. J. Digit. Earth 2017, 10, 604–622. [Google Scholar] [CrossRef]
  24. Stroeve, J.C.; Box, J.E.; Fowler, C.; Haran, T.; Key, J. Intercomparison between in situ and AVHRR polar pathfinder-derived surface albedo over Greenland. Atmosphere 2001, 75, 360–374. [Google Scholar] [CrossRef] [Green Version]
  25. Cescatti, A.; Marcolla, B.; Vannan, S.K.S.; Pan, J.Y.; Román, M.O.; Yang, X.; Ciais, P.; Cook, R.B.; Law, B.E. Intercomparison of MODIS albedo retrievals and in situ measurements across the global FLUXNET network. Remote Sens. Environ. 2012, 121, 323–334. [Google Scholar] [CrossRef] [Green Version]
  26. Wang, Z.; Schaaf, C.B.; Strahler, A.H.; Chopping, M.J.; Román, M.O.; Shuai, Y.; Woodcock, C.E.; Hollinger, D.Y.; Fitzjarrald, D.R. Evaluation of MODIS albedo product (MCD43A) over grassland, agriculture and forest surface types during dormant and snow-covered periods. Remote Sens. Environ. 2014, 140, 60–77. [Google Scholar] [CrossRef] [Green Version]
  27. Wild, M.; Folini, F.; Schär, C.; Loeb, N.; Dutton, E.G.; Kӧnig-Langlo, G. The global energy balance from a surface perspective. Clim. Dyn. 2013, 40, 3107–3134. [Google Scholar] [CrossRef] [Green Version]
  28. Salazar, G.; Gueymard, C.; Galdino, J.B.; Vilela, O.C.; Fraidenraich, N. Solar irradiance time series derived from high-quality measurements, satellite-based models, and reanalyses at a near-equatorial site in Brazil. Renew. Sustain. Energy Rev. 2020, 117, 109478. [Google Scholar] [CrossRef]
  29. Liu, N.F.; Liu, Q.; Wang, L.Z.; Liang, S.L.; Wen, J.G.; Qu, Y.; Liu, S.H. A statistics-based temporal filter algorithm to map spatiotemporally continuous shortwave albedo from MODIS data. Hydrol. Earth Syst. Sci. 2013, 17, 2121–2129. [Google Scholar] [CrossRef] [Green Version]
  30. Dong, A.; Grattan, S.R.; Garroll, J.J.; Prashar, C.R.K. Estimation of daytime net radiation over well-watered grass. J. Irrig. Drain. Eng. 1992, 118, 466–479. [Google Scholar] [CrossRef]
  31. Gueymard, C. Mathematically integrable parameterization of clear-sky beam and global irradiances and its use in daily irradiation applications. Sol. Energy 1993, 50, 385–397. [Google Scholar] [CrossRef]
  32. Paltridge, G.W.; Platt, C.M.R. Radiation Processes in Meteorology and Climatology; Elsevier Science: London, UK, 1976. [Google Scholar]
  33. Iziomon, M.G.; Mayer, H. On the variability and modelling of surface albedo and long-wave radiation components. Agric. For. Meteorol. 2002, 111, 141–152. [Google Scholar] [CrossRef]
  34. Liu, H.; Tu, G.; Dong, W. Three-year changes of surface albedo of degraded grassland and cropland surfaces in a semiarid area. Chin. Sci. Bull. 2008, 53, 1246–1254. [Google Scholar] [CrossRef] [Green Version]
  35. Zheng, Z.; Wei, Z.; Wen, Z.; Dong, W.; Li, Z.; Wen, X.; Zhu, X.; Dong, J.; Chen, C.; Yan, D. Inclusion of solar elevation angle in land surface albedo parameterization over bare soil surface. J. Adv. Model. Earth Syst. 2017, 9, 3069–3081. [Google Scholar] [CrossRef] [Green Version]
  36. Alnaser, W.E. Calculation of the surface albedo of Bahrain from solar energy data. Energy 1989, 14, 551–556. [Google Scholar] [CrossRef]
  37. Morton, F.I. Operational estimates of areal evapotranspiration and their significance to the science and practice of hydrology. J. Hydrol. 1983, 66, 1–76. [Google Scholar] [CrossRef]
  38. Ineichen, P.; Guisan, O.; Perez, R. Ground-reflected radiation and albedo. Sol. Energy 1990, 44, 207–214. [Google Scholar] [CrossRef] [Green Version]
  39. Wiscombe, W.J.; Warren, S.G. A model for the spectral albedo of snow: Pure snow. J. Atmos. Sci. 1980, 37, 2713–2733. [Google Scholar] [CrossRef] [Green Version]
  40. Zhou, L.; Dickinson, R.E.; Tian, Y.; Zeng, X.; Dai, Y.; Yang, Z.L.; Schaaf, C.B.; Gao, F.; Jin, Y.; Strahler, A.; et al. Comparison of seasonal and spatial variations of albedos from Moderate-Resolution Imaging Spectroradiometer (MODIS) and Common Land Model. J. Geophys. Res. 2003, 108, 4488. [Google Scholar] [CrossRef] [Green Version]
  41. Ineichen, P.; Perez, R.; Seals, R. The importance of correct albedo determination for adequately modelling energy received by tilted surfaces. Sol. Energy 1987, 39, 301–305. [Google Scholar] [CrossRef] [Green Version]
  42. Gueymard, C.A. A review of validation methodologies and statistical performance indicators for modeled solar radiation data: Towards a better bankability of solar projects. Renew. Sustain. Energy Rev. 2014, 39, 1024–1034. [Google Scholar] [CrossRef]
  43. Fan, J.; Wu, L.; Zhang, F.; Cai, H.; Ma, X.; Bai, H. Evaluation and development of empirical models for estimating daily and monthly mean diffuse horizontal solar radiation for different climatic regions of China. Renew. Sustain. Energy Rev. 2019, 105, 168–186. [Google Scholar] [CrossRef]
  44. Willmott, C.J.; Matsuura, K. Advantages of the mean absolute error (MAE) over the root mean square error (RMSE) in assessing average model performance. Clim. Res. 2005, 30, 79–82. [Google Scholar] [CrossRef]
  45. Jamieson, P.D.; Porter, J.R.; Wilson, D.R. A test of the computer simulation model ARC-WHEAT1 on wheat crops grown in New Zealand. Field Crop Res. 1991, 27, 337–350. [Google Scholar] [CrossRef]
  46. Li, M.F.; Tang, X.P.; Wu, W.; Liu, H.B. General models for estimating daily global solar radiation for different solar radiation zones in mainland China. Energy Convers. Manag. 2013, 70, 139–148. [Google Scholar] [CrossRef]
  47. Stone, R.J. Improved statistical procedure for the evaluation for solar radiation estimation models. Sol. Energy 1993, 51, 289–291. [Google Scholar] [CrossRef]
  48. Dalla, V.; Giraitis, L.; Phillips, P.C.B. Testing Mean Stability of Heteroskedastic Time Series; Working Paper No. 765; Queen Mary University of London: London, UK, 2015. [Google Scholar]
Figure 1. Geographical distribution of the solar radiation observation stations used in this study.
Atmosphere 13 00412 g001
Figure 2. MAPE values for the six models at 12 selected stations.
Atmosphere 13 00412 g002
Figure 3. RRMSE values for the six models at 12 selected stations.
Atmosphere 13 00412 g003
Figure 4. TS values for the six models at 12 selected stations.
Atmosphere 13 00412 g004
Figure 5. Comparisons of estimated results with measured data at (a) Ejin Banner, (b) Beijing, (c) Kashgar, (d) Zhengzhou, (e) Wuhan, (f) Shanghai, (g) Chengdu, (h) Kunming, (i) Guangzhou, (j) Sanya, (k) Golmud, and (l) Lhasa stations.
Atmosphere 13 00412 g005
Figure 6. GPI values for the six models at 12 selected stations.
Atmosphere 13 00412 g006
Figure 7. Comparisons of rDeM predictions with measured data at (a) Ejin Banner, (b) Beijing, (c) Kashgar, (d) Zhengzhou, (e) Wuhan, (f) Shanghai, (g) Chengdu, (h) Kunming, (i) Guangzhou, (j) Sanya, (k) Golmud, and (l) Lhasa stations.
Atmosphere 13 00412 g007
Figure 8. GPI values for each station when DeM is replaced by rDeM for model comparison.
Atmosphere 13 00412 g008
Figure 9. Temporal stability checks of accumulated mean surface albedo at (a) Kunming and (b) Guangzhou stations.
Atmosphere 13 00412 g009
Figure 10. Mean and standard deviation of Θ * r for collecting temporally stable time series at 12 selected stations.
Atmosphere 13 00412 g010
Table 1. Geographical locations and datasets of the 12 stations used in this study.
No.LocationLatitude
(deg., N)
Longitude
(deg., E)
Altitude
(m)
Tmean
(°C)
P
(mm)
n
(h)
Rg
(MJ m−2 day−1)
KD1Measured Albedo
PeriodMean 2
1Ejin Banner41.95101.07940.59.73359.1217.830.321993–20150.25
2Beijing39.80116.4731.313.285886.7613.510.481993–20150.17
3Zhengzhou34.72113.65110.415.356395.1512.920.601993–20150.17
4Kashgar39.4875.75754.512.74667.9815.560.441993–20150.22
5Wuhan30.60114.0523.617.4712594.9611.710.601993–20150.17
6Shanghai31.40121.455.517.1811644.7712.510.561993–20150.17
7Guangzhou23.22113.4870.722.4617374.2411.680.631993–20150.18
8Chengdu30.75103.87547.721.179054.339.880.732004–20150.16
9Kunming25.02102.651888.116.029896.0215.440.461993–20150.17
10Sanya18.22109.58419.425.2913406.1016.520.461993–20150.19
11Golmud36.4294.922807.66.37408.3218.770.351993–20150.22
12Lhasa29.6791.133648.99.054348.2220.470.301993–20150.21
1Tmean represents mean air temperature, P mean annual precipitation, Rg mean global radiation, KD mean ratio of diffuse radiation to global radiation; 2 Measurements obtained on February 29 in each leap year have been discarded from analysis for convenience.
Table 2. Statistical indicators for performance evaluation of ground albedo models.
IndicatorConceptEquation 1FunctionIdeal ValueAuthor(s)
Mean bias error
(MBE)
Arithmetic mean of the errors MBE = 1 K k = 1 K α De k α Dm k A statistical indicator for testing the long-term tendency of the models 0Behar et al. [3]
Mean absolute percentage error (MAPE)Arithmetic mean of magnitude of relative errors MAPE = 1 K k = 1 K α De k α Dm k α Dm k A statistical indicator for comparing predictive errors of different models0Gueymard [42]
Fan et al. [43]
Root mean square error (RMSE)Square root of the mean square errors RMSE = 1 K k = 1 K α De k α Dm k 2 A measure of error-magnitude variance for examination of the short-term performance of the models0Willmott and Matsuura [44]
Relative root mean square error (RRMSE)RMSE divided by the average value of measured data RRMSE = RMSE α m A measure of the overall relative accuracy of the models0Jamieson et al. [45]
Li et al. [46]
t-statistics
(TS)
Statistical significance of model estimates at a particular confidence level TS = K 1 MBE 2 RMSE 2 MBE 2 A conjunction of the RMSE with MBE for more reliable assessment of model performance0Stone [47]
Uncertainty at the 95% level (U95)Expanded uncertainty with 95% confidence U 95 = 1.96 SD 2 + RMSE 2 1 / 2 An indicator representing information of model deviation0Gueymard [42]
Coefficient of determination(R2)Square of the correlation coefficient R 2 = k = 1 K α De k α e α Dm k α m 2 k = 1 K α De k α e 2 k = 1 K α Dm k α m 2 A measure of model linearity relative to measured data1Behar et al. [3] Gueymard [42]
1K is the number of days with valid measured data, SD represents the standard deviation of the difference between estimated results and observed data, αm and αe represent the annual mean values of measured and estimated ground albedo, respectively.
Table 3. Calibrated values of rDeM parameters for selected stations.
StationModel ParametersStatistical Indicators
anbnMAPE (%)RMSERRMSE (%)U95TSR2
Ejin Banner0.11400.3543.550.01164.630.03107.360.6944
Beijing0.07790.2504.750.00945.420.02518.140.1666
Kashgar0.11120.3006.280.01687.570.04632.630.0128
Zhengzhou0.07220.2505.060.01046.190.01161.190.1362
Wuhan0.08540.2503.920.00864.940.02381.280.2201
Shanghai0.08310.2504.440.00935.460.02487.710.0753
Chengdu0.07910.2325.550.01096.860.02994.570.0078
Kunming0.08140.2503.370.00754.420.02081.920.0002
Guangzhou0.08310.2584.790.01035.810.02777.220.3848
Sanya0.08820.2852.990.00774.030.02038.840.0073
Golmud0.09630.3253.540.00914.230.02512.860.5104
Lhasa0.07560.3865.830.01527.040.04029.110.7879
Publisher’s Note: MDPI stays neutral with regard to jurisdictional claims in published maps and institutional affiliations.

