Article

Response of Potential Evapotranspiration to Warming and Wetting in Northwest China

1
College of Atmospheric Sciences, Lanzhou University, Lanzhou 730000, China
2
Key Laboratory of Arid Climate Change and Reducing Disaster of Gansu Province/Key Open Laboratory of Arid Climate Change and Disaster Reduction, Institute of Arid Meteorology, China Meteorological Administration, Lanzhou 730020, China
3
Lanzhou Regional Climate Center, Gansu Provincial Meteorological Bureau, Lanzhou 730020, China
4
Department of Meteorology, Lanzhou Resources & Environment Voc-Tech College, Lanzhou 730021, China
*
Author to whom correspondence should be addressed.
Atmosphere 2022, 13(2), 353; https://doi.org/10.3390/atmos13020353
Submission received: 30 December 2021 / Revised: 5 February 2022 / Accepted: 14 February 2022 / Published: 19 February 2022
(This article belongs to the Section Climatology)

Abstract

:
In the last few decades, the climate in Northwest China has exhibited a warming–wetting tendency, which has been particularly prominent since the beginning of the 21st century. In this context, we analyzed the change in potential evapotranspiration (PET)in the corresponding period and its response to warming and wetting, which revealed clear periodic changes. The most significant changes occurred in the 1970s and 1980s, when PET decreased in the humid climate zone and increased in the semi-arid climate zone. Factor effect analysis showed that PET had a positive response to temperature; the highest and lowest temperatures in the region continued to rise. Relative humidity reduced the overall PET in the region, especially in the humid zone. Sunshine duration has continued to decrease rapidly since the 1980s, especially in humid and arid zones, resulting in a corresponding decrease in PET. Similarly, corresponding to the consistent wind speed decrease, there has also been a significant decrease in PET, with the largest decrease in the arid zone, followed by the humid zone. In general, PET in the central and eastern parts of Northwest China has mainly been affected by the temperature, whereas wind speed has been the main factor in the western part of the region. Relative humidity and sunshine duration have had relatively little effect on the PET (below 20% in most places). The reasons and processes that affect PET are very complicated. Owing to the unique climate characteristics and underlying surface energy mechanisms in Northwest China, it is still difficult to offer a scientific explanation for its warming and wetting. Therefore, the extent to which PET impacts climate change in this region is currently unclear, and systematic and scientific research on this is needed.

1. Introduction

The terrain of Northwest China is complex. At the intersection of the Qinghai-Tibet Plateau, the Loess Plateau, and the Inner Mongolia Plateau, this area comprises three natural regions: the arid and semi-arid region in the west; the monsoon region in the east; and the Qinghai-Tibet Alpine Region. This region includes arid, semi-arid, subhumid, and humid climate zones [1]. Northwest China, similar to other regions around the world, has been experiencing rising temperatures for more than a century since the Industrial Revolution, but the increase in temperature has been greater than that around the world; especially since the 1980s, the increase in temperature has accelerated significantly [2]. As part of the arid region of east Central Asia, this area is more sensitive to climate change and is ecologically vulnerable [3,4,5]. The precipitation in the eastern part of Northwest China is largely affected by the East Asian summer monsoon [6,7,8]; the water vapor in the west is mainly transported from the Atlantic Ocean by the westerly circulation system, which has clearly strengthened in the last thirty years [9], and provided favorable conditions for more precipitation [10]. This change is possibly related to both natural variability and global warming, to some extent. The dynamic and thermal effects of the Qinghai-Tibet Plateau in the southwest also have an important impact on the precipitation and temperature in the northwest [11,12,13,14]. In the mid-1980s, precipitation in the western part of this region, roughly bounded by the Yellow River, began to increase in volatility. This signal of climate change was first noticed in 2002 by Chinese academician Shi Yafeng, who proposed a scientific judgment on Northwest China transitioning from a warm/dry to warm/wet climate [15]. However, academia did not form a broad consensus on this judgment, then. Based on paleoclimate research, the most recent decades have been the wettest in the past 3500 years, at least [16]. The Guliya and Dunde ice cores contain temperature and precipitation records for close to the past 2000 and 400 years, respectively, with a 10-year resolution [17]. They show that most of the centennial changes were a combination of either warm and wet or cold and dry, with a few being cold and wet or warm and dry [18]. In addition, although the warming and wetting in the western and eastern parts of Northwest China have different temporal and spatial characteristics, degree, and evolution stages, wetting in this region has significantly increased and expanded eastward, and this signal has been particularly prominent in the 21st century [19]. In fact, among the nine arid regions in the world [20], the drylands in the Americas became wetter during 1948–2008, due to enhanced westerlies [21,22]. However, the wetting in northwest China is more obvious, while drought in east Central Asia has not alleviated [23,24,25]. By exploring its mechanism, the assessment and conclusion of global drought can be re-understood [26,27].
As temperature and precipitation directly affect the energy cycle, soil humidity, water cycle, and air humidity, warming and wetting will inevitably bring about changes in surface evapotranspiration, which, in turn, affects the local climate and environment [28]. PET is the theoretical upper limit of actual evapotranspiration and is widely used in climatology research [29,30,31]. It determines the water and energy exchange between land–vegetation–atmosphere [32]. PET is also widely used in research on agricultural crop water demand and production management [33] and the ecological environment [34], making it vital for climate change research and applied research on water resources [35]. There have been some meaningful research results on PET [36,37,38] and actual pan evaporation in Northwest China [39,40]. However, with the current new characteristics of climate change in Northwest China, how is PET changing and how does it respond to this warming and wetting? This study gives a comprehensive analysis of PET characteristics, multiyear trends, and the effects of related meteorological elements on PET, for an in depth understanding of climate change in this region. Section 2 describes the data and methods used in this study. The changes in PET and response of PET to warming and wetting in Northwest China are presented in Section 3. The limitations of the study are discussed in Section 4, followed by the conclusion in Section 5.

2. Materials and Methods

2.1. Materials

Daily meteorological data (from 8 p.m. to 8 p.m. the next day) from 360 weather stations in five provinces and regions in Northwest China from 1961 to 2019, including average temperature, highest and lowest temperatures, precipitation, average wind speed, sunshine duration, and average relative humidity, were analyzed. The screening criterion was that missing data from each station must cover no more than three days per year. In the case of missing data, the average of the two days before and after was used for interpolation. If there were two consecutive days of missing data, the data from two adjacent days were used for equal interpolation. The data were provided by the Meteorological Information Center of China Meteorological Administration (Beijing, China); the temperature and precipitation data have passed quality control [41] and have been widely used in research [42]. A total of 102 stations met the screening requirement. The locations of the weather stations in the researched region are shown in Figure 1. Diverse climate types exist in the vast area of Northwest China. To prepare for analysis of the differences in the response of PET to warming and wetting in different climate zones, Figure 1 also shows the zoning of the researched region based on the index of aridity. According to this classification, 8 of the 102 weather stations were in the humid zone, 23 were in the subhumid zone, 36 were in the semi-arid zone, and 35 were in the arid zone. (Details in Supplementary Figure S1).

2.2. Methods

2.2.1. Calculation of PET

The Food and Agriculture Organization (FAO, Rome, Italy.) Penman–Monteith equation was used to calculate PET, which is a standard method that can be applied anywhere in the world if the required daily meteorological data are available (FAO56). Research has shown that this equation can fully reflect the comprehensive influence of various meteorological elements and yield accurate results, and it is suitable for calculating PET in different climate types [43,44,45]. The equation is as follows [44]:
PET = 0.408 Δ ( R n G ) + γ 900 T mean + 273 u 2 ( e s e a ) Δ + γ ( 1 + 0.34 u 2 )
where PET is potential evapotranspiration (mm·d−1), ∆ is the slope of the saturation vapor pressure curve, γ is the psychrometric constant (kPa·°C−1), Rn is net surface radiation (MJ·m−2·d−1), G is the soil heat flux (MJ·m−2·d−1), Tmean is the daily average temperature (°C), u2 is the wind speed at 2 m height (m·s−1), es is the saturation vapor pressure (kPa), and ea is the actual vapor pressure (kPa). The following calculation should be noted: (1) the daily average temperature, Tmean, is the average of the daily highest temperature (Tmax) and lowest temperature (Tmin), not the average value of the 24 h hourly (or four or eight times a day) observations; (2) as the equation for saturation vapor pressure is nonlinear, the average saturation vapor pressure of a given period (daily, ten-day, monthly) should be the average of the saturation vapor pressures calculated from the daily highest and lowest temperatures during that period; (3) in a period between one day and ten days, the soil heat capacity of the reference grassland is small enough that the daily G value can be neglected. The daily PET of 102 meteorological stations from 1961 to 2019 was calculated using Equation (1), and the multiyear average value was further obtained.

2.2.2. Factor Effect Analysis of PET

Equation (1) indicates that four meteorological factors affect PET: temperature (the equation requires this to be calculated using the average of the highest and lowest temperatures of a given day), actual vapor pressure and saturation vapor pressure (which can be calculated using relative humidity), wind speed at 2 m height, and sunshine duration (which affect net radiation) [44]. To analyze the respective effects that these four variables have on PET, we programmed the computer, the years 1961 to 1970 were used as the reference period to calculate the PET of each weather station, and the average PET for the 10-year period was obtained. Then, the original measurements of the daily highest and lowest temperatures of each station were kept unchanged, and the daily relative humidity, sunshine duration, and wind speed at 2 m height were replaced date to date with data between 1961 and 1970, taking out 29th February in leap years. Thereafter, the PET for each day and 10-year averages were calculated for the intervals 1971–1980, 1981–1990, 1991–2000, 2001–2010, and 2010–2019 (as the data were for up to 2019, to obtain the 10-year average, the most recent decade included 2010, and similarly thereafter), and the 1961–1970 averages were subtracted. Since the temperature related data were actual measurements from each weather station that had not been replaced with the 1961–1970 numbers, the interdecadal difference sequence obtained included only the impact of temperature on PET. Similarly, the relative humidity of each weather station was kept unchanged, and the daily highest and lowest temperatures, sunshine duration, and wind speed at 2 m height from later decades were replaced with 1961–1970 data. These steps were repeated to calculate the averages. After the subtraction, the effect of relative humidity on PET was obtained. Treating sunshine duration and wind speed at 2 m height similarly yielded the impact of sunshine duration and wind speed on PET. Qiang Fu adopted this method to calculate the difference in PET between land and oceans globally using data from multiple models [46]. In this study, measured values from weather stations were used to analyze the response of PET to warming and wetting in Northwest China. (see detailed procedures in Supplementary Method S1).

2.2.3. Statistical Analysis

Variance analysis is used in this study. The variance in PET caused by four variables, including average of Tmax and Tmin, relative humidity, sunshine duration and wind speed, was calculated. The effect of each variate was estimated by variance ratio. It used the subscripts “t”, “h”, “s”, “w” to represent the variance due to average of Tmax and Tmin, relative humidity, sunshine duration and wind speed in Equation (2), and relative humidity effect obtained by Equation (2). The effect of other variates is estimated similarly to that for relative humidity.
E h = V h V t + V h + V s + V w

2.2.4. Index of Aridity

Index of aridity is an indicator of the dryness of the climate in a certain area and is generally defined as the ratio of annual potential evapotranspiration to annual precipitation. The equation to calculate this is:
K = PET P
where K is index of aridity, PET is potential evapotranspiration, and P is precipitation. Index of aridity between 0 and 1 indicates a humid zone, 1 to 1.5 indicates a subhumid zone, 1.5 to 4 indicates a semi-arid zone, and greater than 4 indicates an arid zone [1].

2.2.5. Climate Trend Coefficient

In equation (4), rxt is the correlation coefficient between the factor sequence of n times (years) and the sequence of natural numbers 1, 2, 3, x ¯ , n; n is the number of years; xi is the factor value of the ith year and is its sample mean. A positive (or negative) rxt means that the factor has a linear increasing (or decreasing) trend in the n years calculated.
r xt = i = 1 n ( x i   x ¯ ) ( i   t ¯ ) i = 1 n ( x i   x ¯ ) 2 i = 1 n ( i   t ¯ ) 2
where t ¯ = (1 + n)/2.

3. Results

3.1. Spatial Distribution and Trend of PET in Northwest China

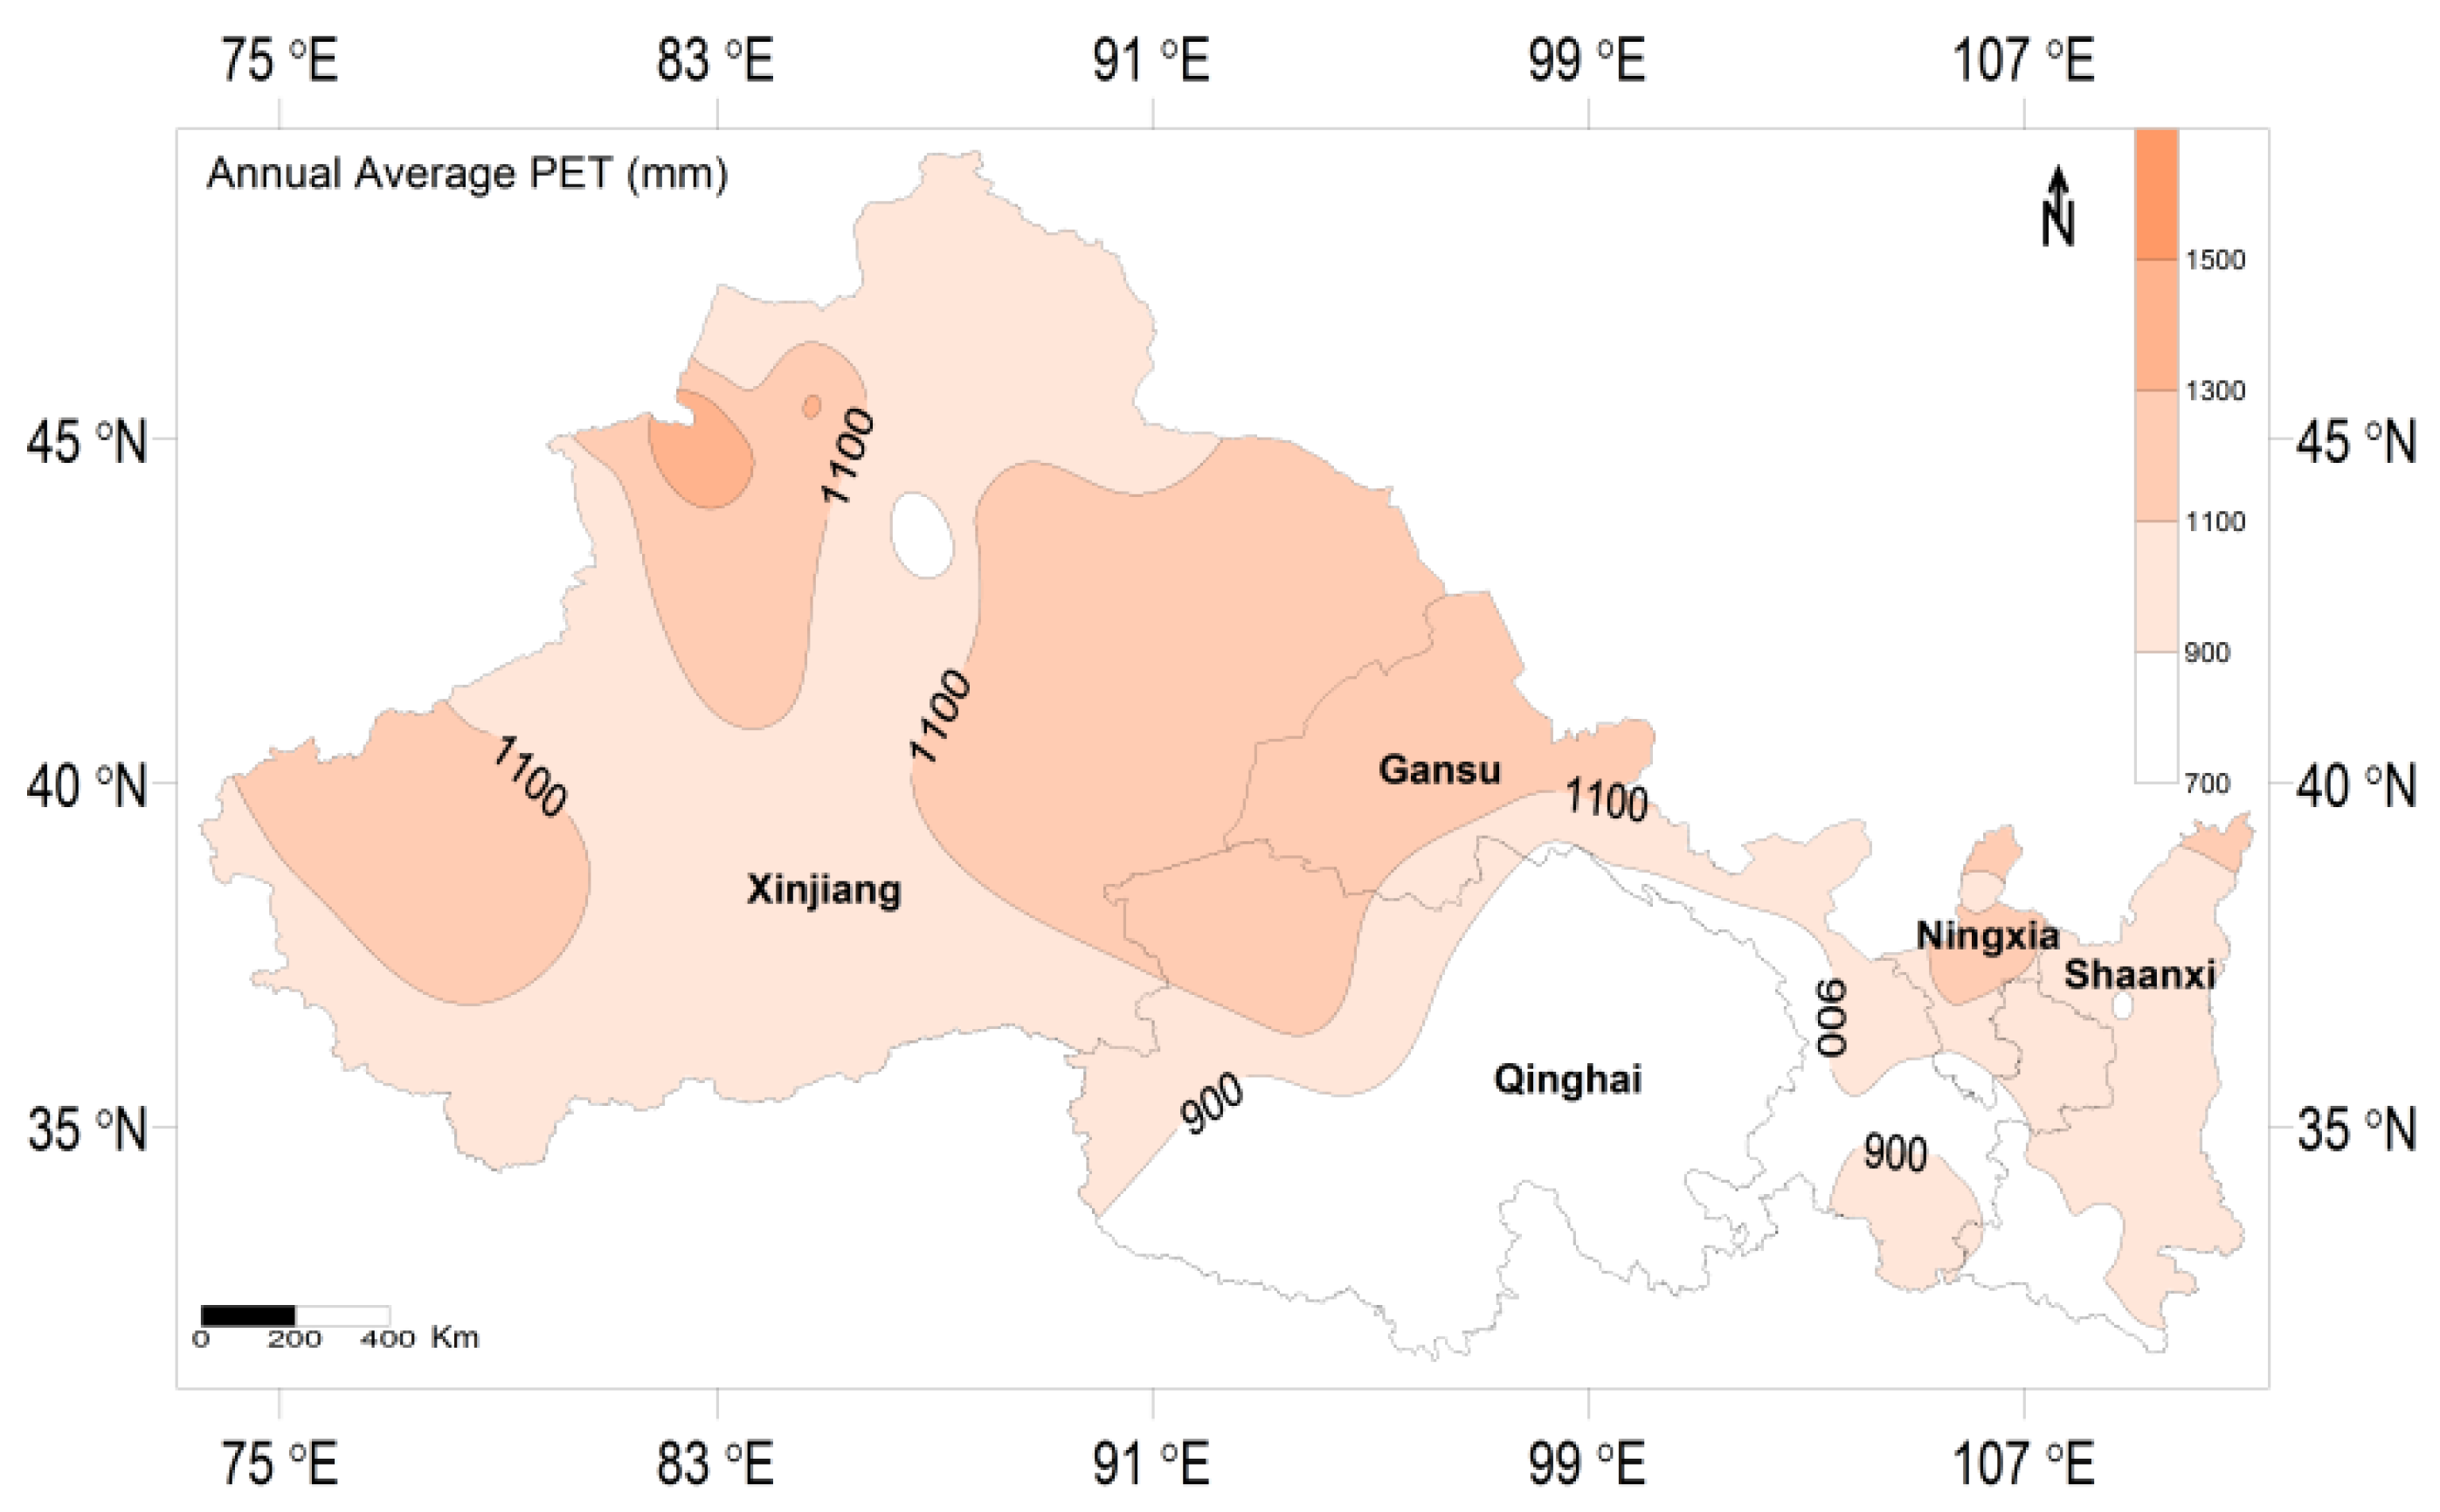
3.1.1. Spatial Distribution of PET in Northwest China

Figure 2 shows that the annual mean PET in Northwest China from 1961 to 2019 was between 740 mm·a−1 and 1543 mm·a−1. There was relatively little PET in the south (less than 900 mm·a−1); it was relatively high in other regions (more than 900 mm·a−1), especially in the west part of Northwest China, where it was more than 1100 mm·a−1 in all areas.

3.1.2. Characteristics of PET in Northwest China

The spatial distribution of PET climate trends in Northwest China (Figure 3) shows that, during the period from 1961 to 2019, 47.7% of the stations recorded an upward trend in PET, whereas 52.3% recorded a downward trend, showing little difference. However, considering different climatic periods, there is still a clear change in the number of stations recording an upward versus downward trend in PET. In the four climatic periods, the proportion of stations with a positive PET climate trend coefficient was 26.2%, 34.6%, 73.8%, and 59.8%, respectively, exhibiting clear periodic changes. PET in the eastern part of Northwest China mainly exhibited a downward trend in the 1961–1990 and 1971–2000 periods. The number of stations wherein PET increased was highest in the 1981–2010 period, accounting for almost three fourths of all stations. From 1991 to 2019, more than half the stations showed an upward trend. The biggest change occurred from the climatic period 1971–2000 to 1981–2010, when many stations switched from a downward to an upward trend in PET.
To characterize the normal distribution of PET changes in each period, Figure 4 shows the normal distribution curves of the PET climate trends at different stations in Northwest China from 1961 to 2019 as a whole and in the four climatic periods. This figure shows that PET from 1961 to 2019 is generally located at the center of the normal distribution. We observed a clear difference between each climate period. During the 1961–1990 and 1971–2000 periods, PET mainly decreased, as the climate trend coefficient was mostly negative; PET trends were opposite during the 1981–2010 and the 1991–2019 periods, as the climate trend coefficient was mostly positive; the 1981–2010 curve lies farthest to the right, with its average between 0.2 and 0.4. Furthermore, from 1971–2000 to 1981–2010, the climate trend of PET underwent the most significant changes, from more weather stations exhibiting a downward trend to more weather stations exhibiting an upward trend. Figure 3 and Figure 4 illustrate that changes in PET in Northwest China have clear periodic and spatial characteristics, consistent with the clear regional and periodic characteristics of warming and wetting in this region.

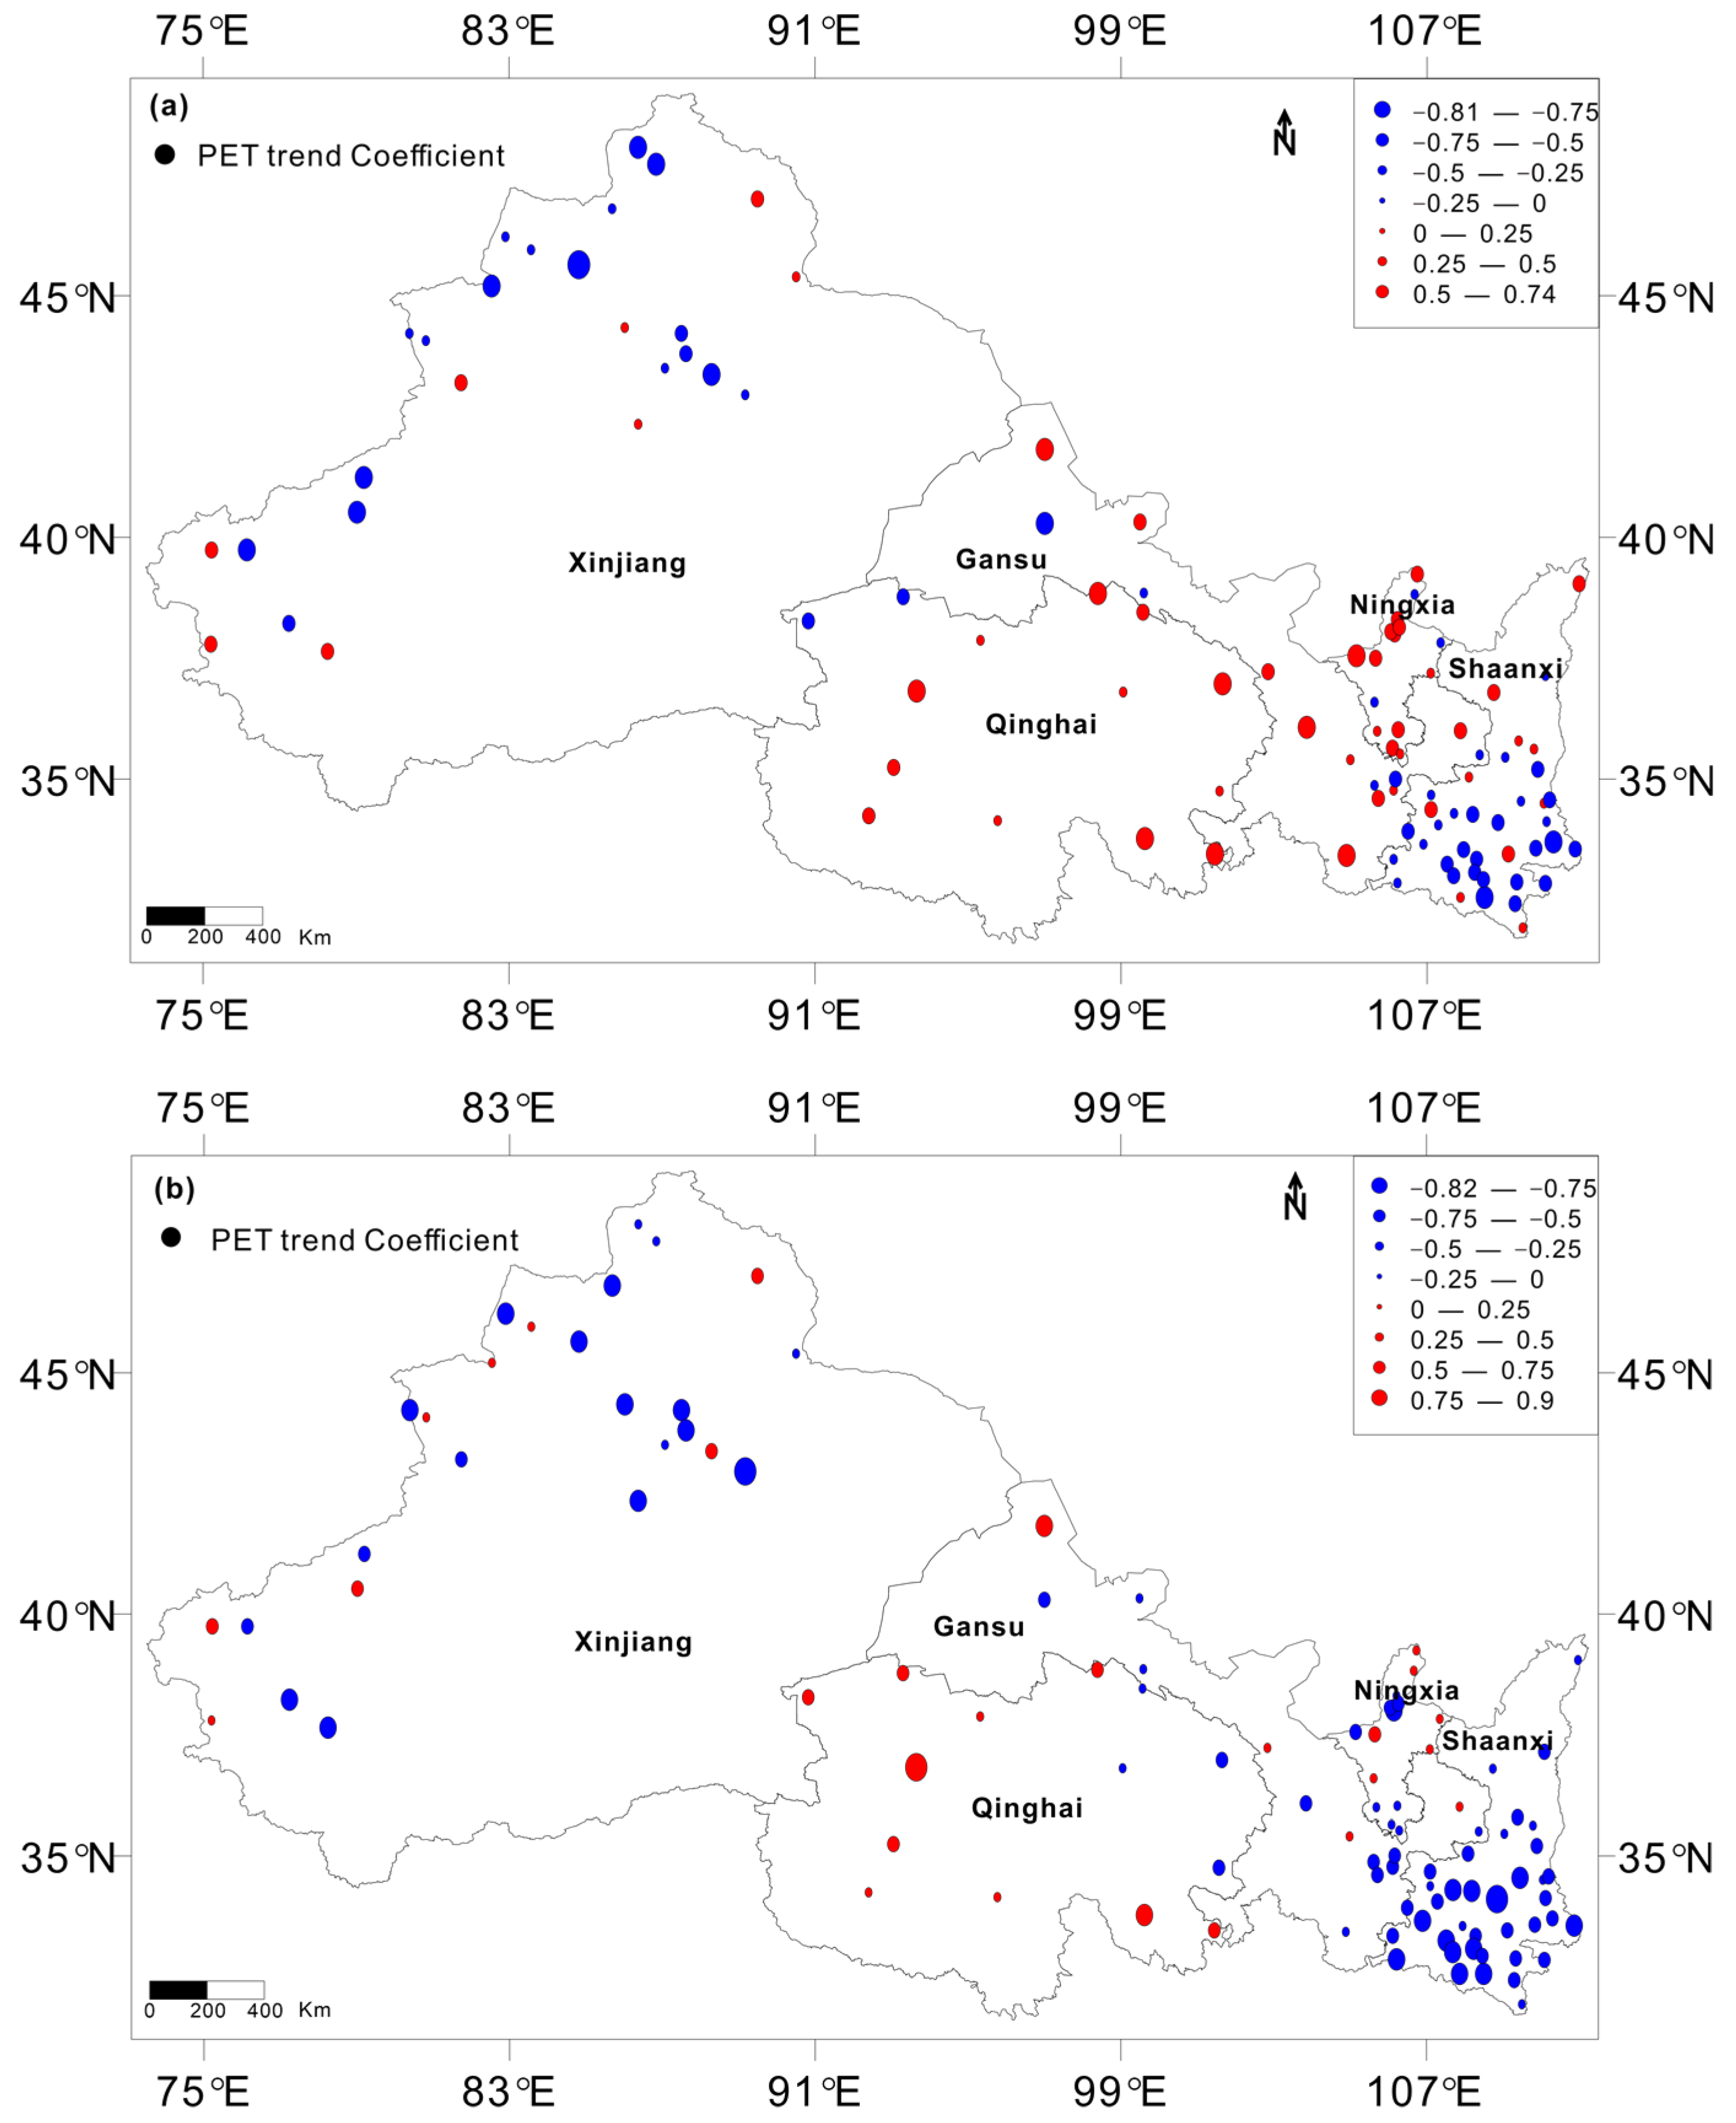
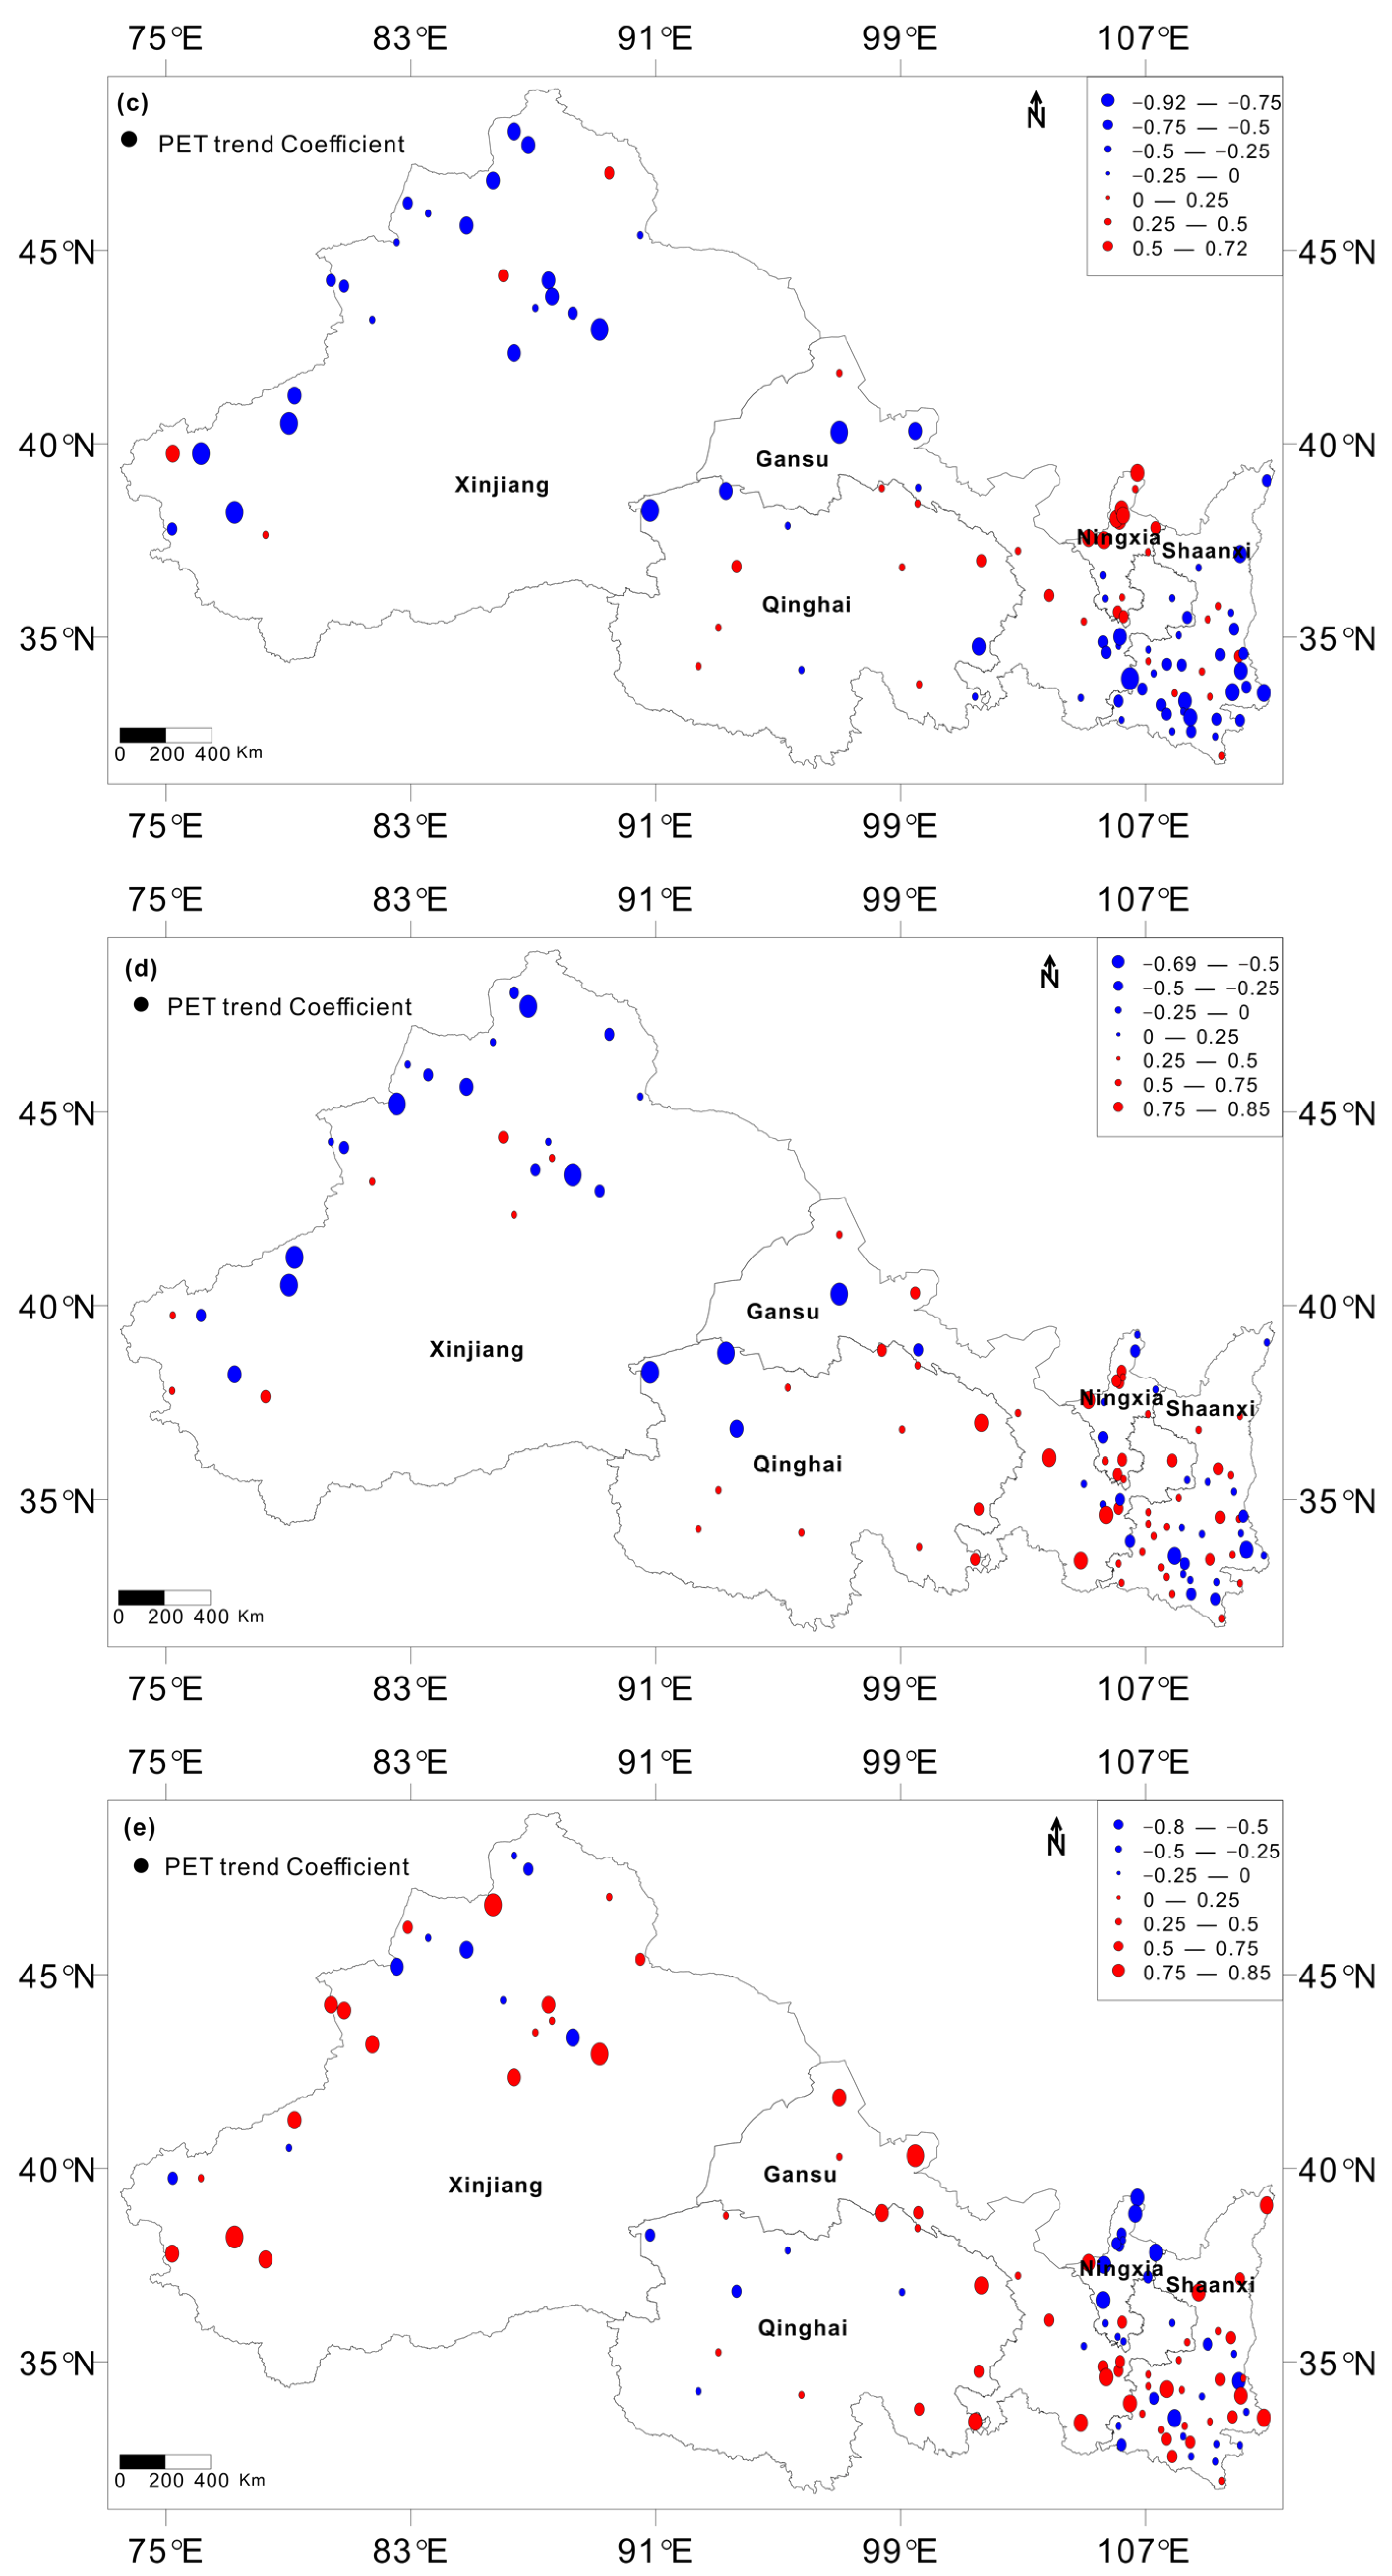
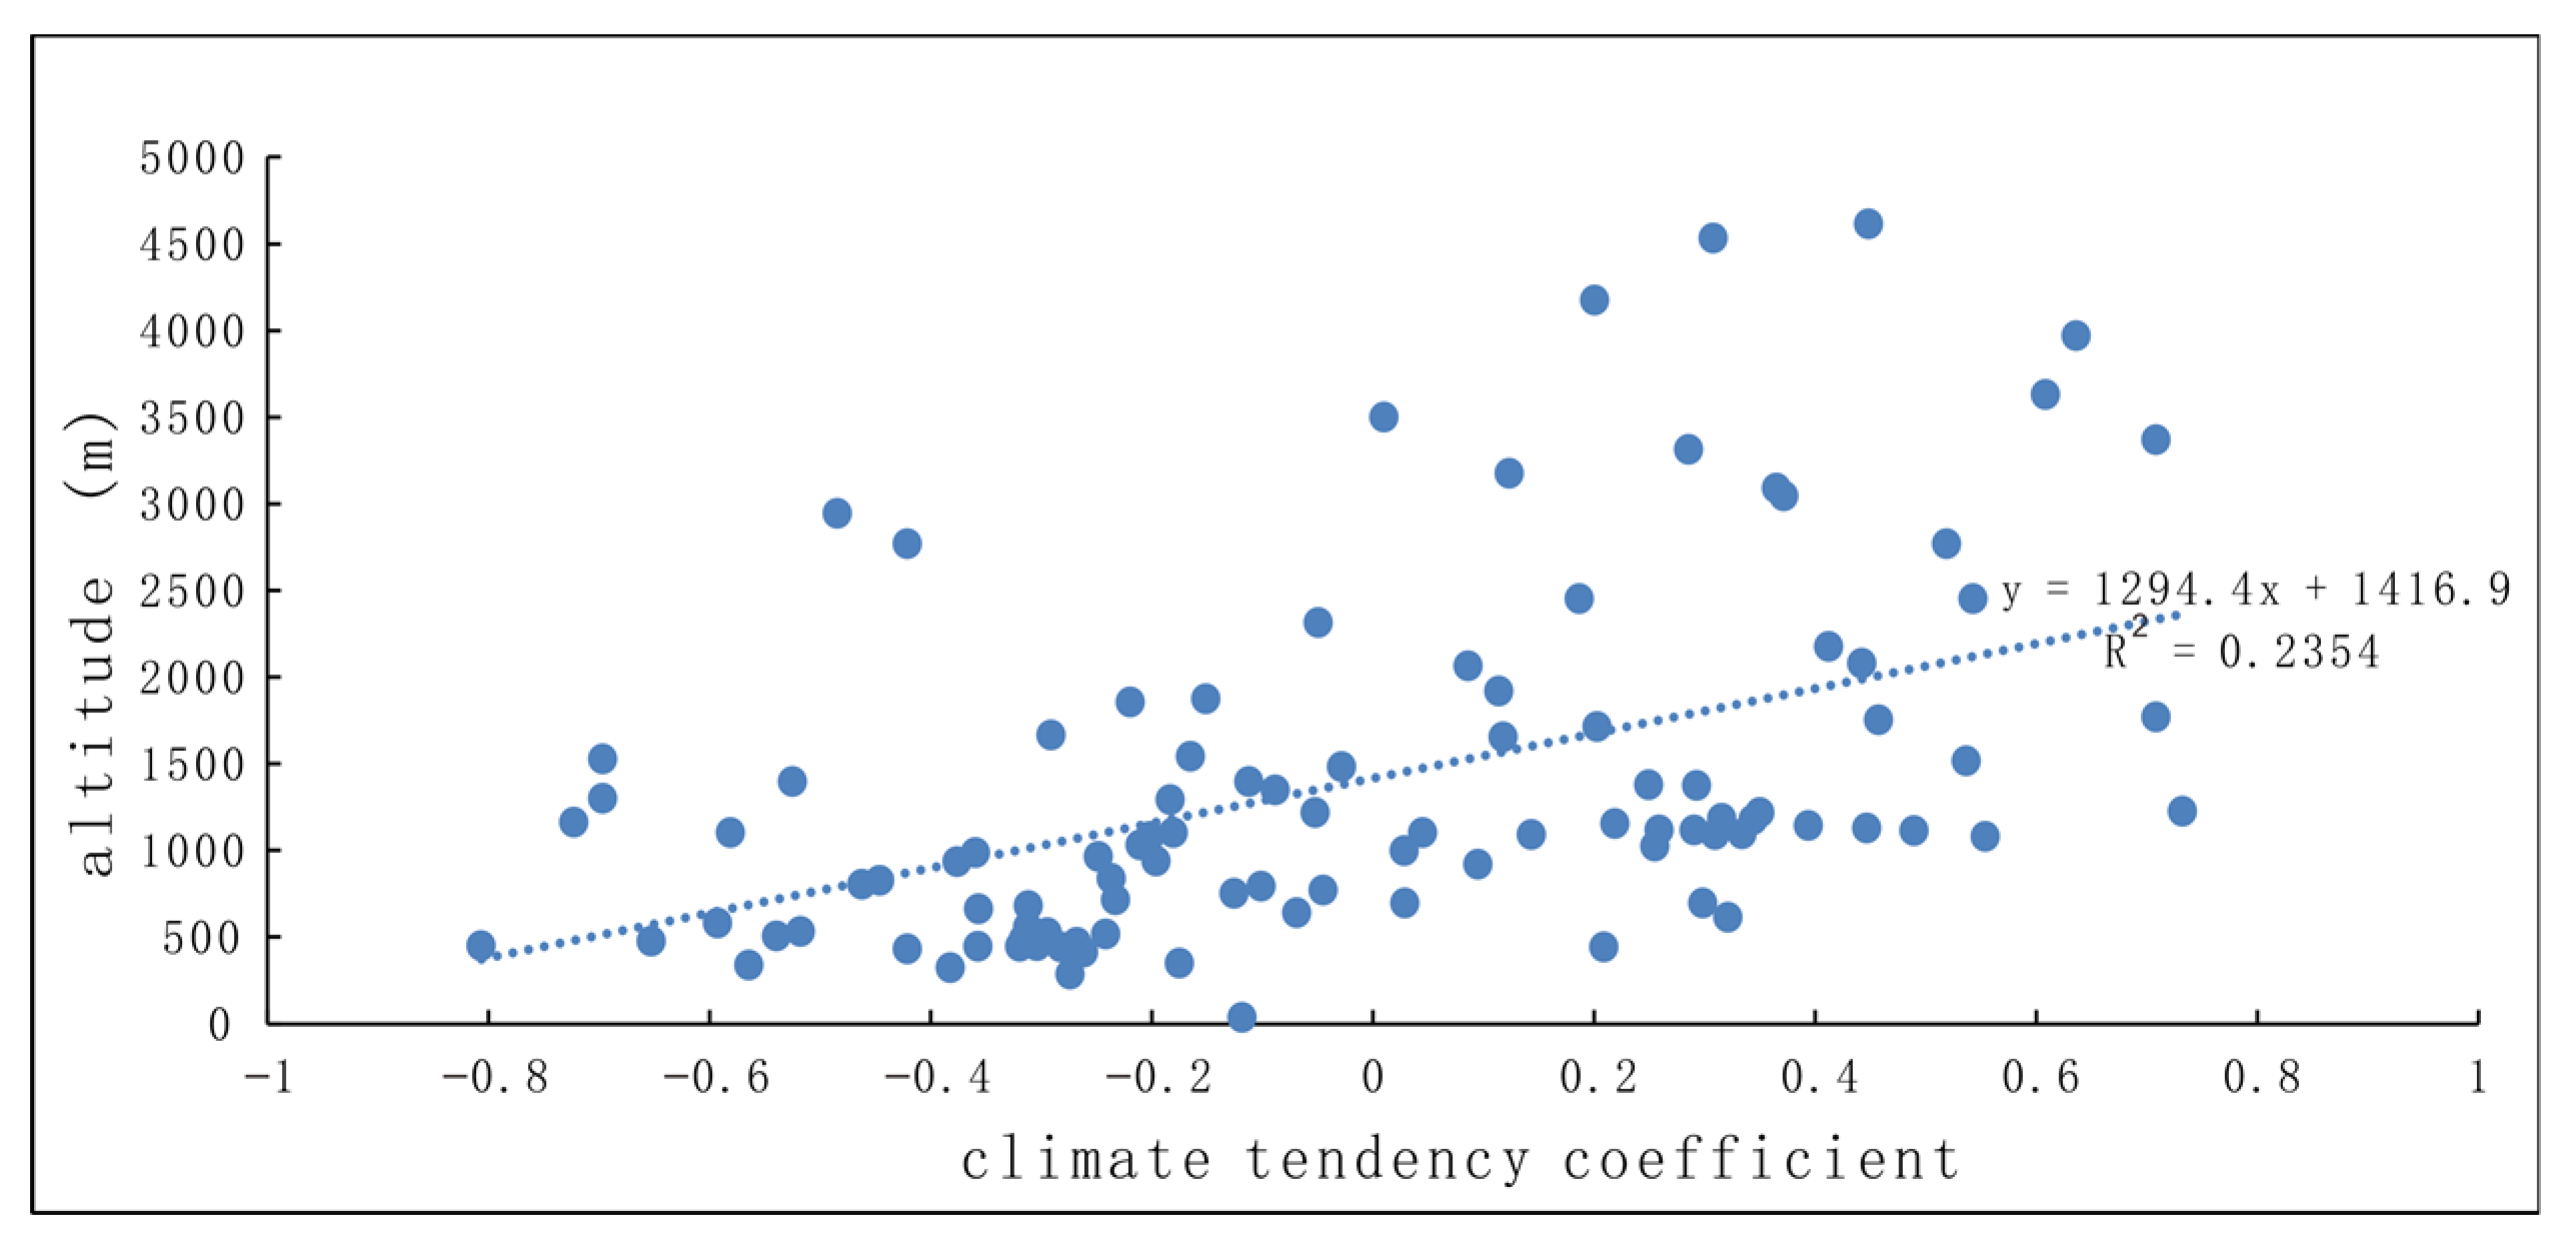
3.1.3. Characteristics of Variation in PET Climate Trend Coefficient with Altitude in Northwest China

In different time periods, the PET climate trend coefficients of each weather station exhibited periodic changes. The large variation in altitude and significant difference in underlying vegetation in Northwest China directly affect PET. Figure 5 shows the relationship between the climate trend coefficient of PET and altitude in Northwest China from 1961 to 2019. This figure shows that the stations where PET has decreased in the past sixty years are at a relatively low altitude, whereas the stations with an upward trend of PET are at a relatively high altitude; weather stations with an altitude higher than 3500 m all exhibited an upward trend in PET. This suggests, from another perspective, that climate change in Northwest China in recent decades possibly had a greater impact on PET in high altitude areas. (Details in Supplementary Figures S2–S5).

3.2. Response of PET to Warming and Wetting

To analyze the magnitude of the impact of each meteorological element that affects PET in Northwest China, the factor effect analysis method mentioned earlier was used, with 1961–1970 as the reference period. These meteorological elements were kept unchanged one by one and the others were replaced to calculate PET according to Equation (1); then, the average for every 10 years was taken and the PET in the reference period (1961–1970) was subtracted. In addition, the averages of the meteorological elements in Northwest China were calculated based on 10-year intervals and the 1961–1970 reference period numbers were subtracted, so that the results could be compared with the actual changes in PET. Table 1 lists the meteorological elements and the calculated 10-year average PET in Northwest China during the reference period (1961–1970); these served as the benchmark for subsequent comparisons. It is notable that the meteorological elements related to the calculation of PET in Equation (1) are the highest and lowest temperatures (this equation requires the average temperature to be calculated by averaging the daily highest and lowest temperatures rather than averaging the four or more measurements per day from the weather station), relative humidity, sunshine duration, and wind speed. As a supplement, average temperature (average of the four or more measurements per day from the weather stations) and precipitation are listed for reference. (see detailed in Supplementary Table S1).

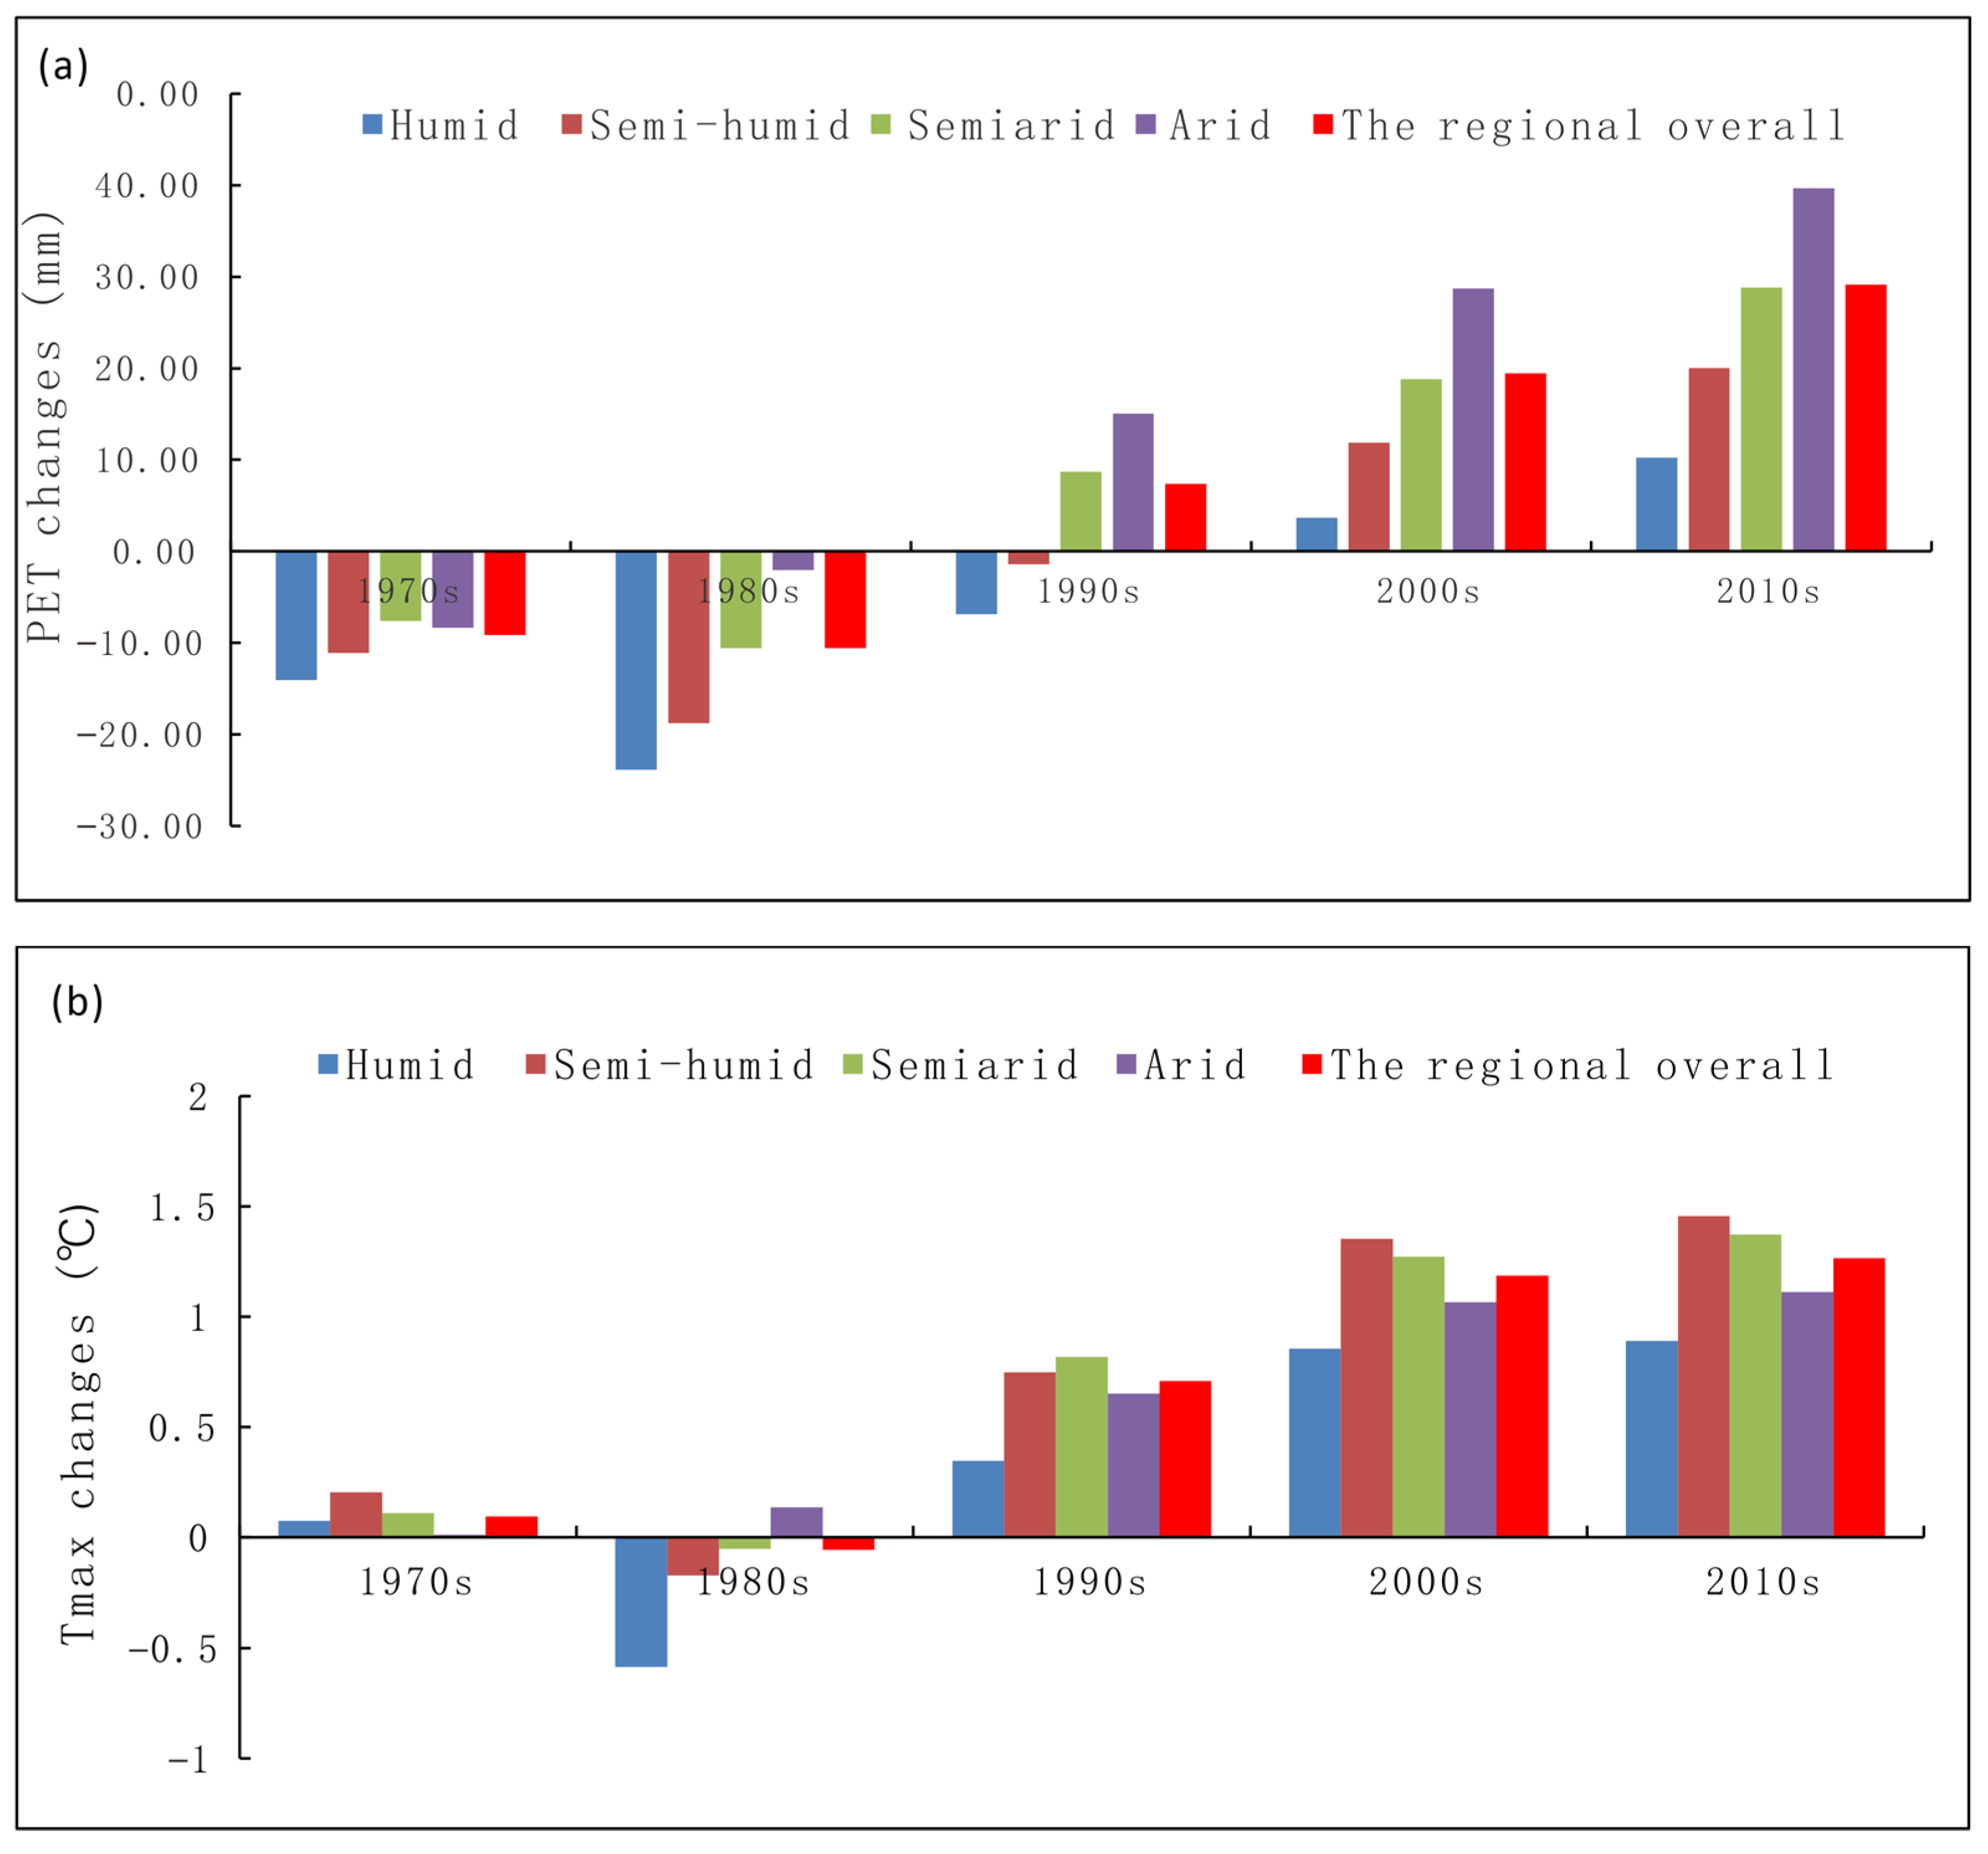
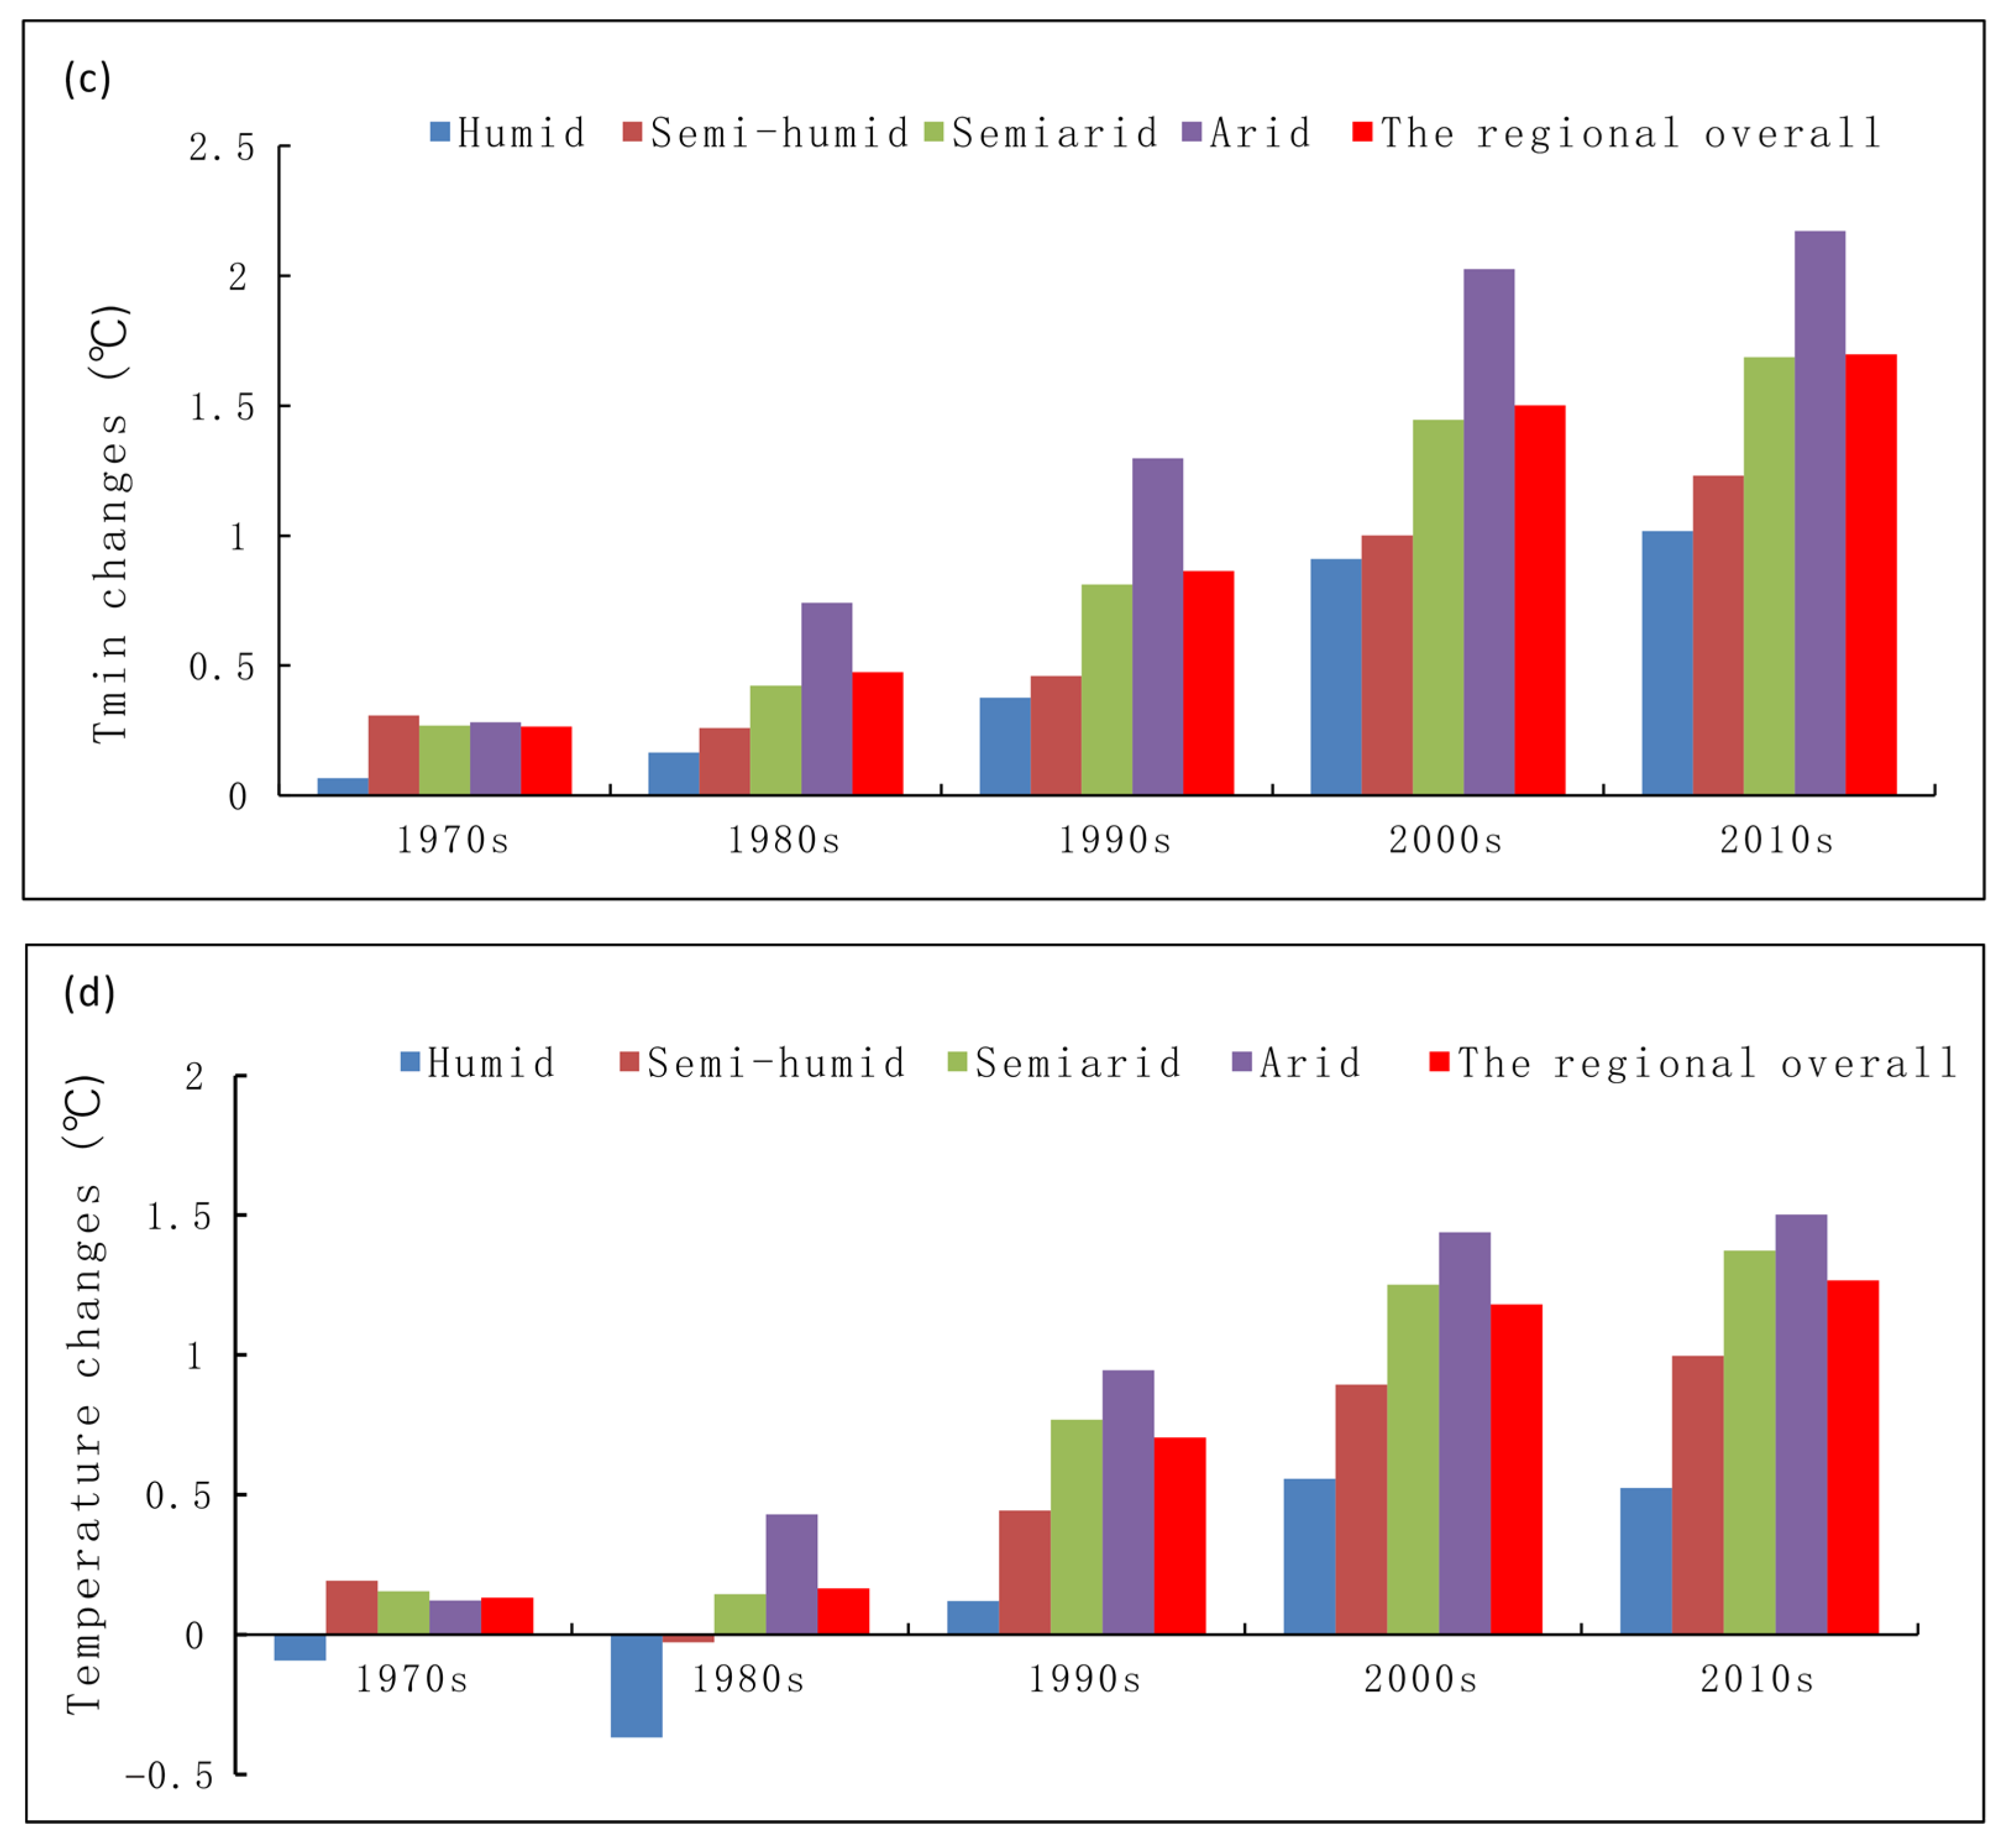
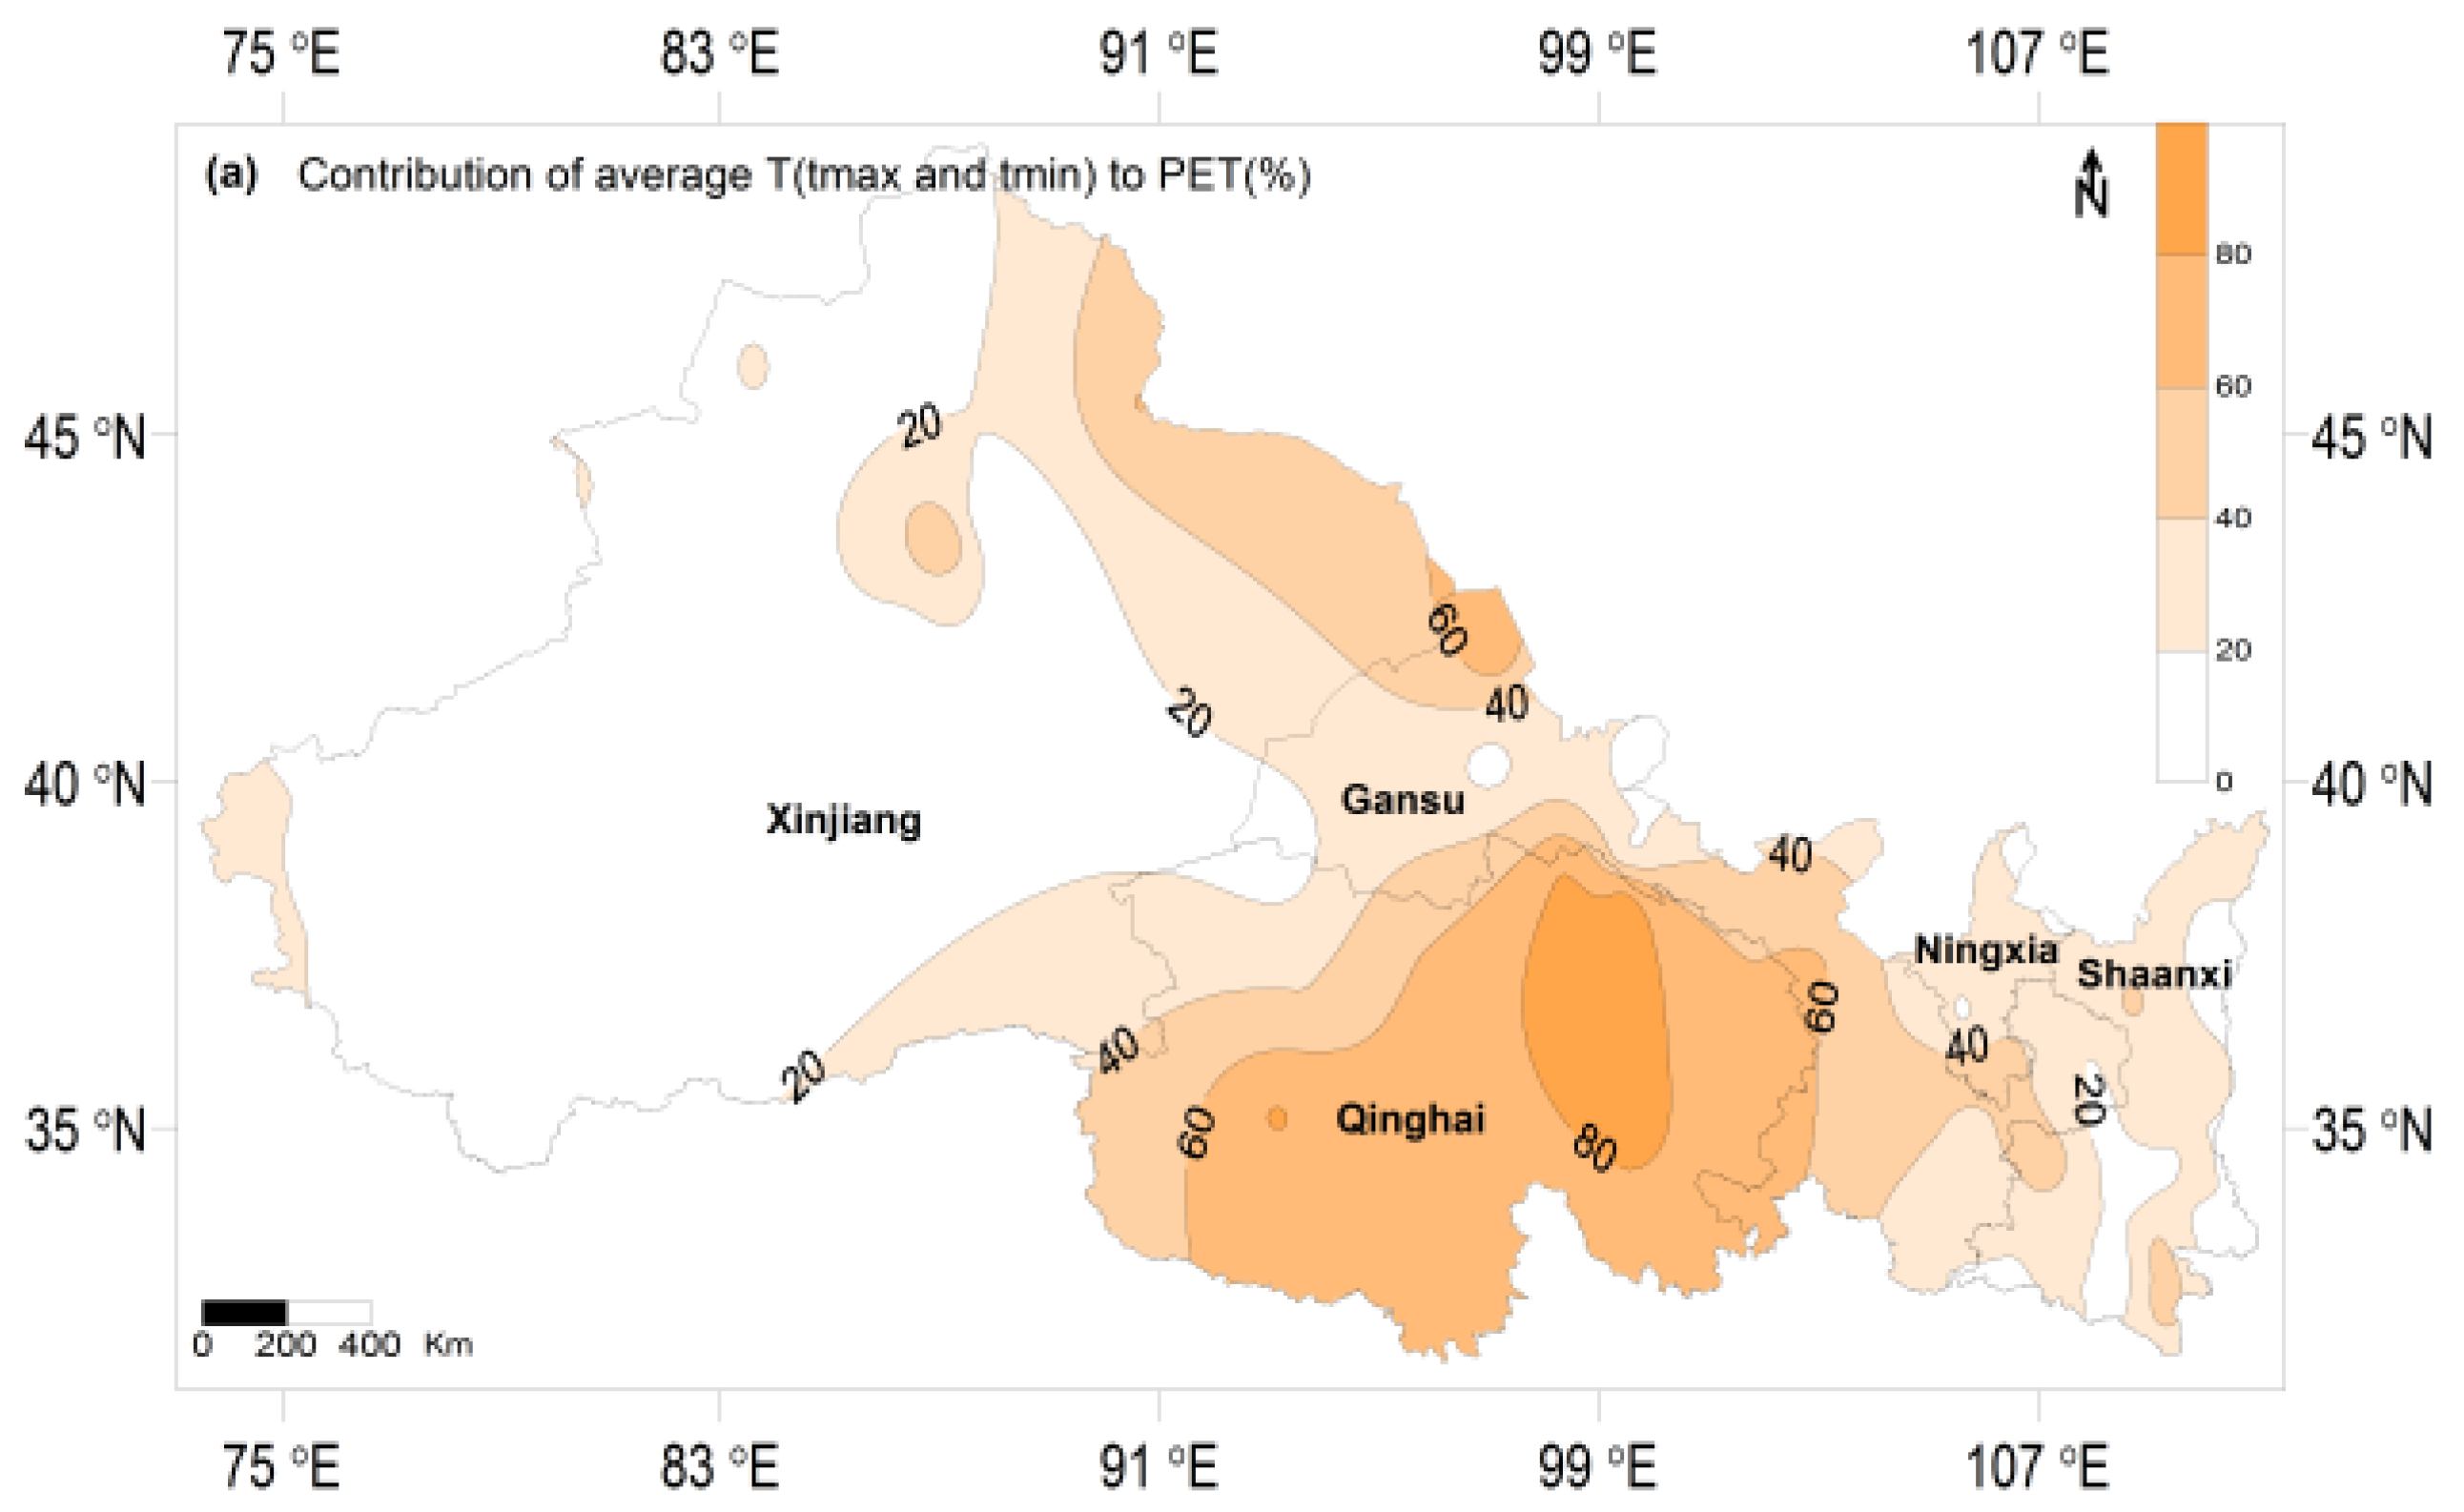
3.2.1. Response of PET to Highest and Lowest Temperatures

The responses of PET to the highest and lowest temperatures are shown in Figure 6. In Figure 6a, the actual highest and lowest temperatures remain unchanged, whereas the other meteorological elements affecting PET (relative humidity, sunshine duration, and wind speed at 2 m height) are replaced with the corresponding daily measurements from each weather station between 1961 and 1970. After calculating the daily PET, the 10-year average was obtained and the reference numbers for the 1961–1970 period were subtracted. The figure shows that the temperature caused a slight decrease in PET in Northwest China in the 1970s and 1980s, and a rapid increase in the 1991–2000, 2001–2010, and 2010–2019 periods. Figure 6b,c are the 10-year trends of the highest and lowest temperatures. The highest temperature (Figure 6b) and the lowest temperature (Figure 6c) began to increase significantly in the 1990s and 1970s, respectively. In the most recent period (2010–2019), the highest temperature increased by 1.26 °C compared with that in 1961–1970, whereas the lowest temperature increased by 1.70 °C. The increase was most significant in arid areas, reaching 2.17 °C in 2010–2019, which is consistent with the finding in recent studies that the most significant temperature increase in North China is the rapid increase in the lowest temperature [47,48]. The increase in the highest and lowest temperatures is in accordance with the increase in PET caused by the temperature, as shown in Figure 6a, indicating that the PET responds positively to temperature changes, with the degree of response mostly following the trend arid zone > semi-arid zone > subhumid zone > humid zone; the increase in the lowest temperature in different climate zones in the region also follows the same trend. Figure 6d shows the trend of average temperature. Although not in Equation (1), it is listed here as well. Clearly, average temperature changes are in sync with the highest and lowest temperatures, as they all increased slightly in the 1970s and 1980s, and then rapidly starting from the 1990s. (Details in Supplementary Figure S6).

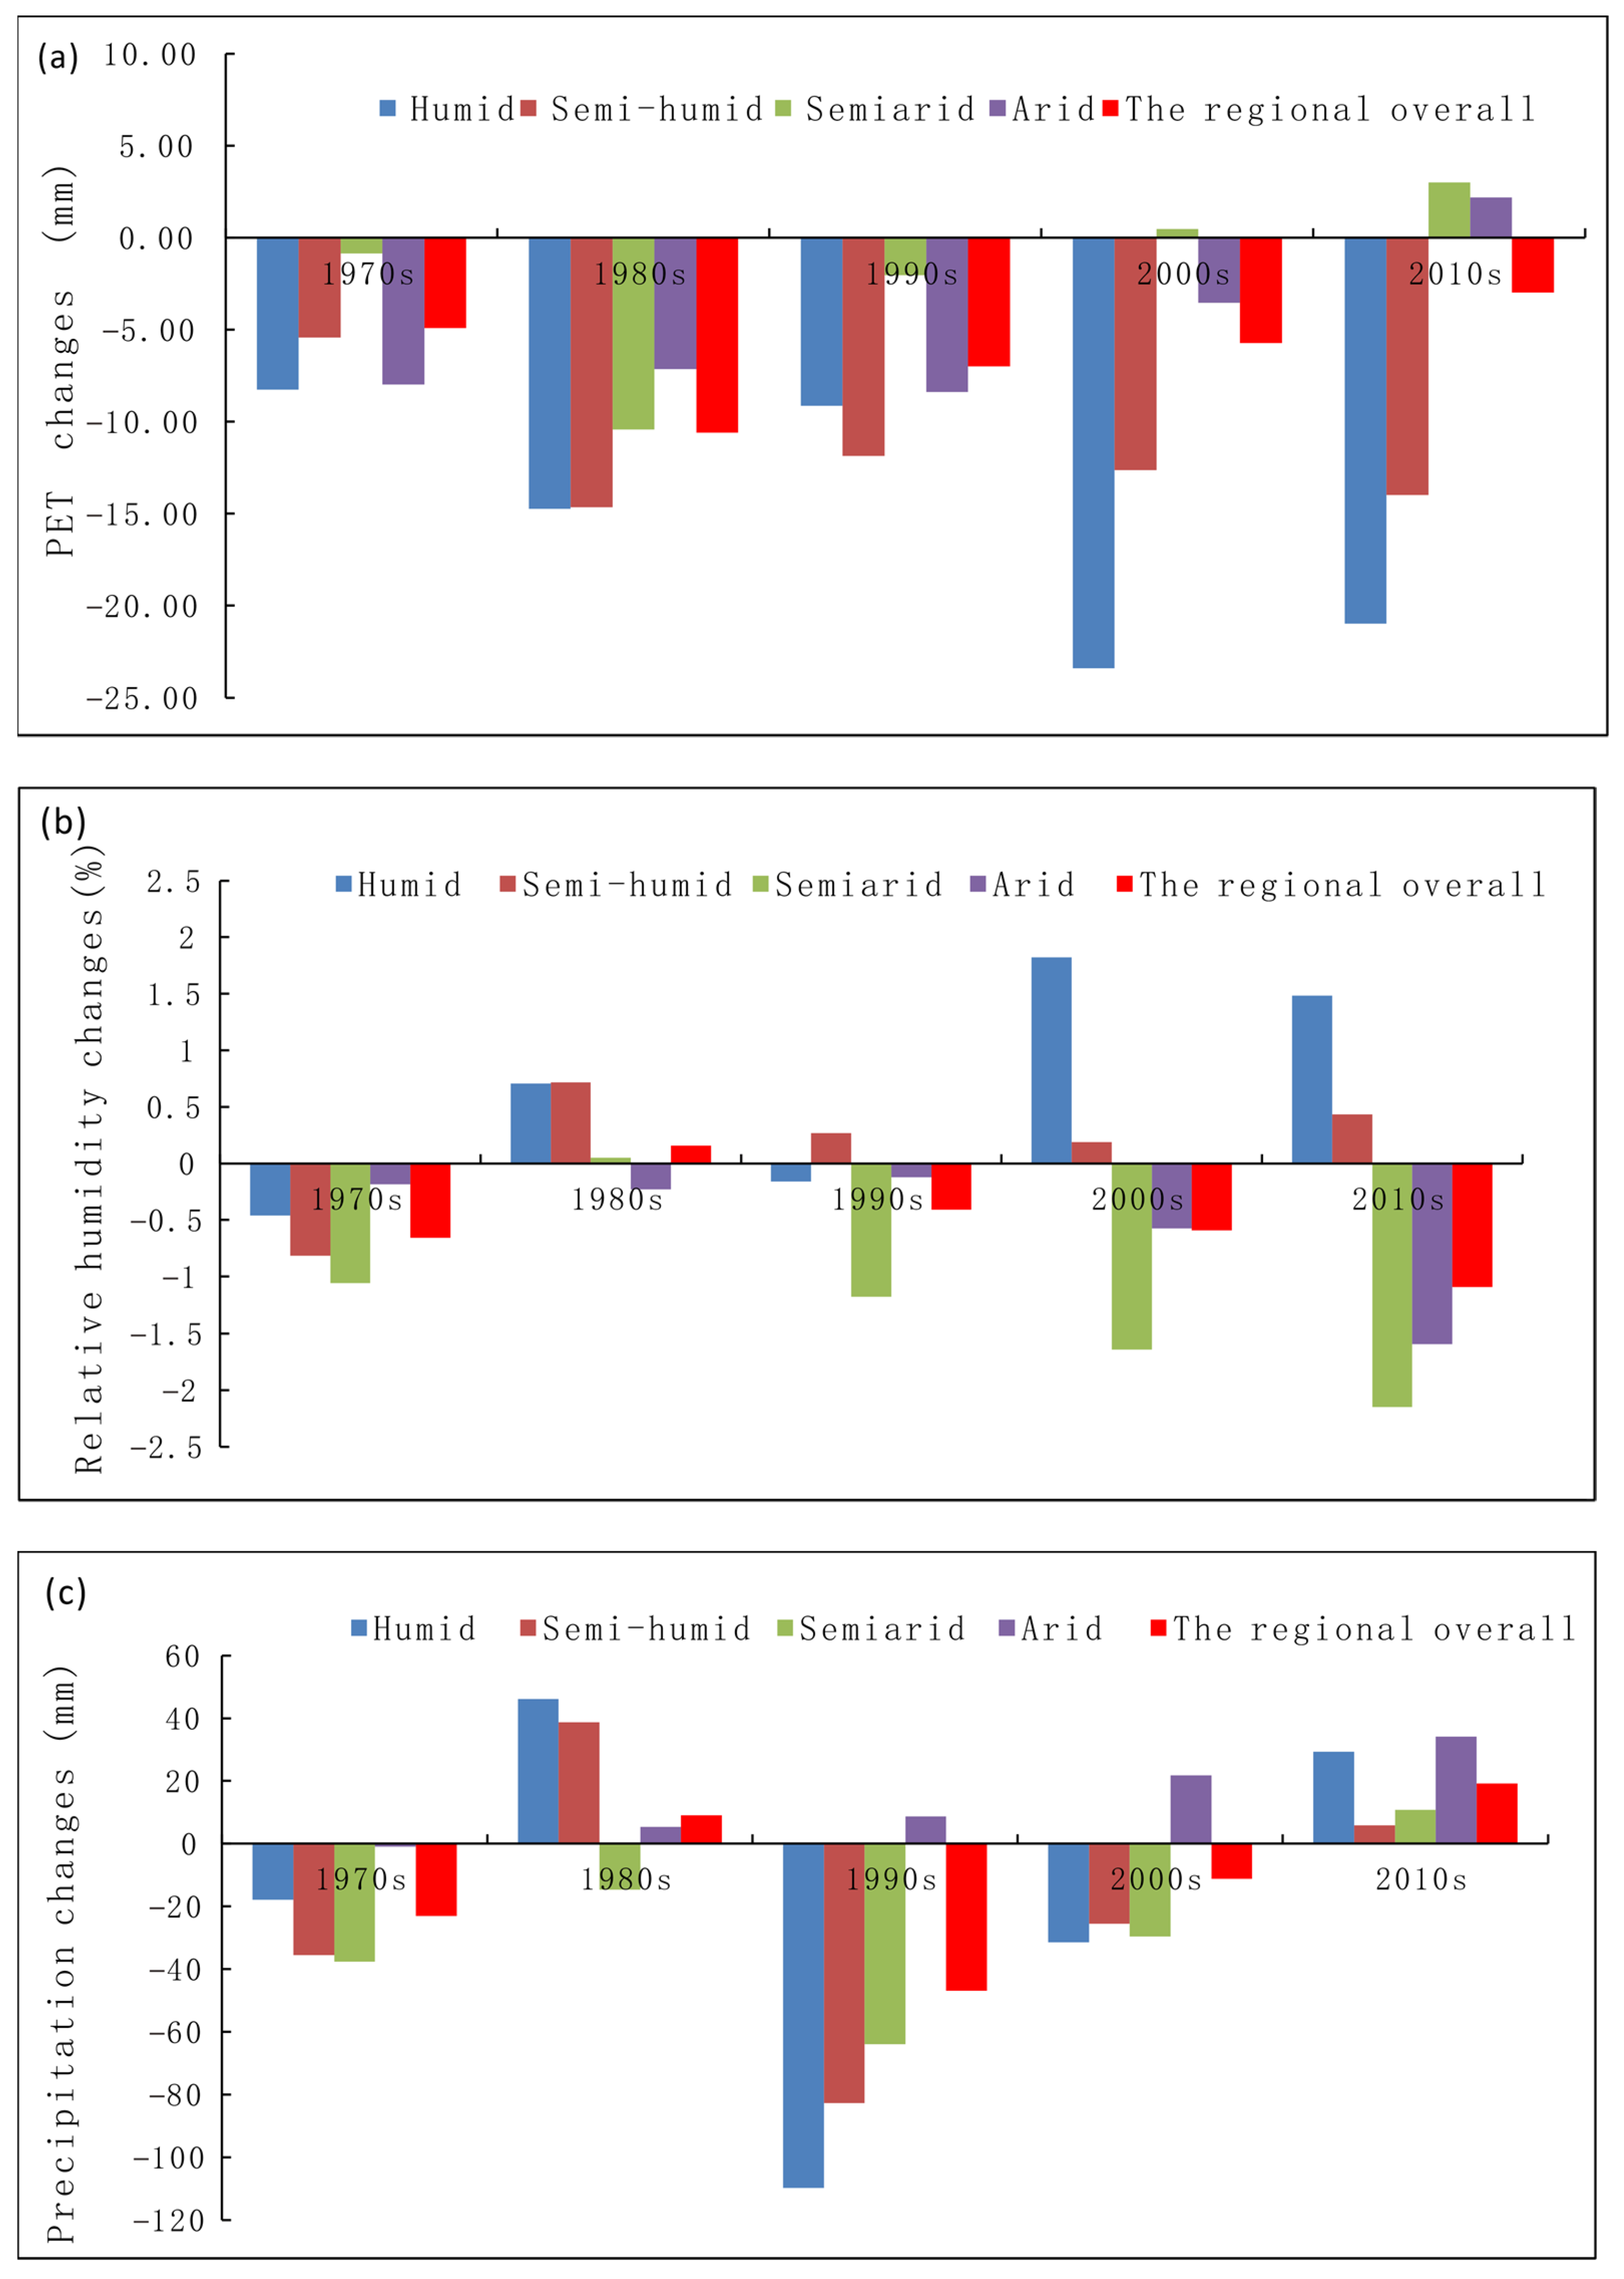
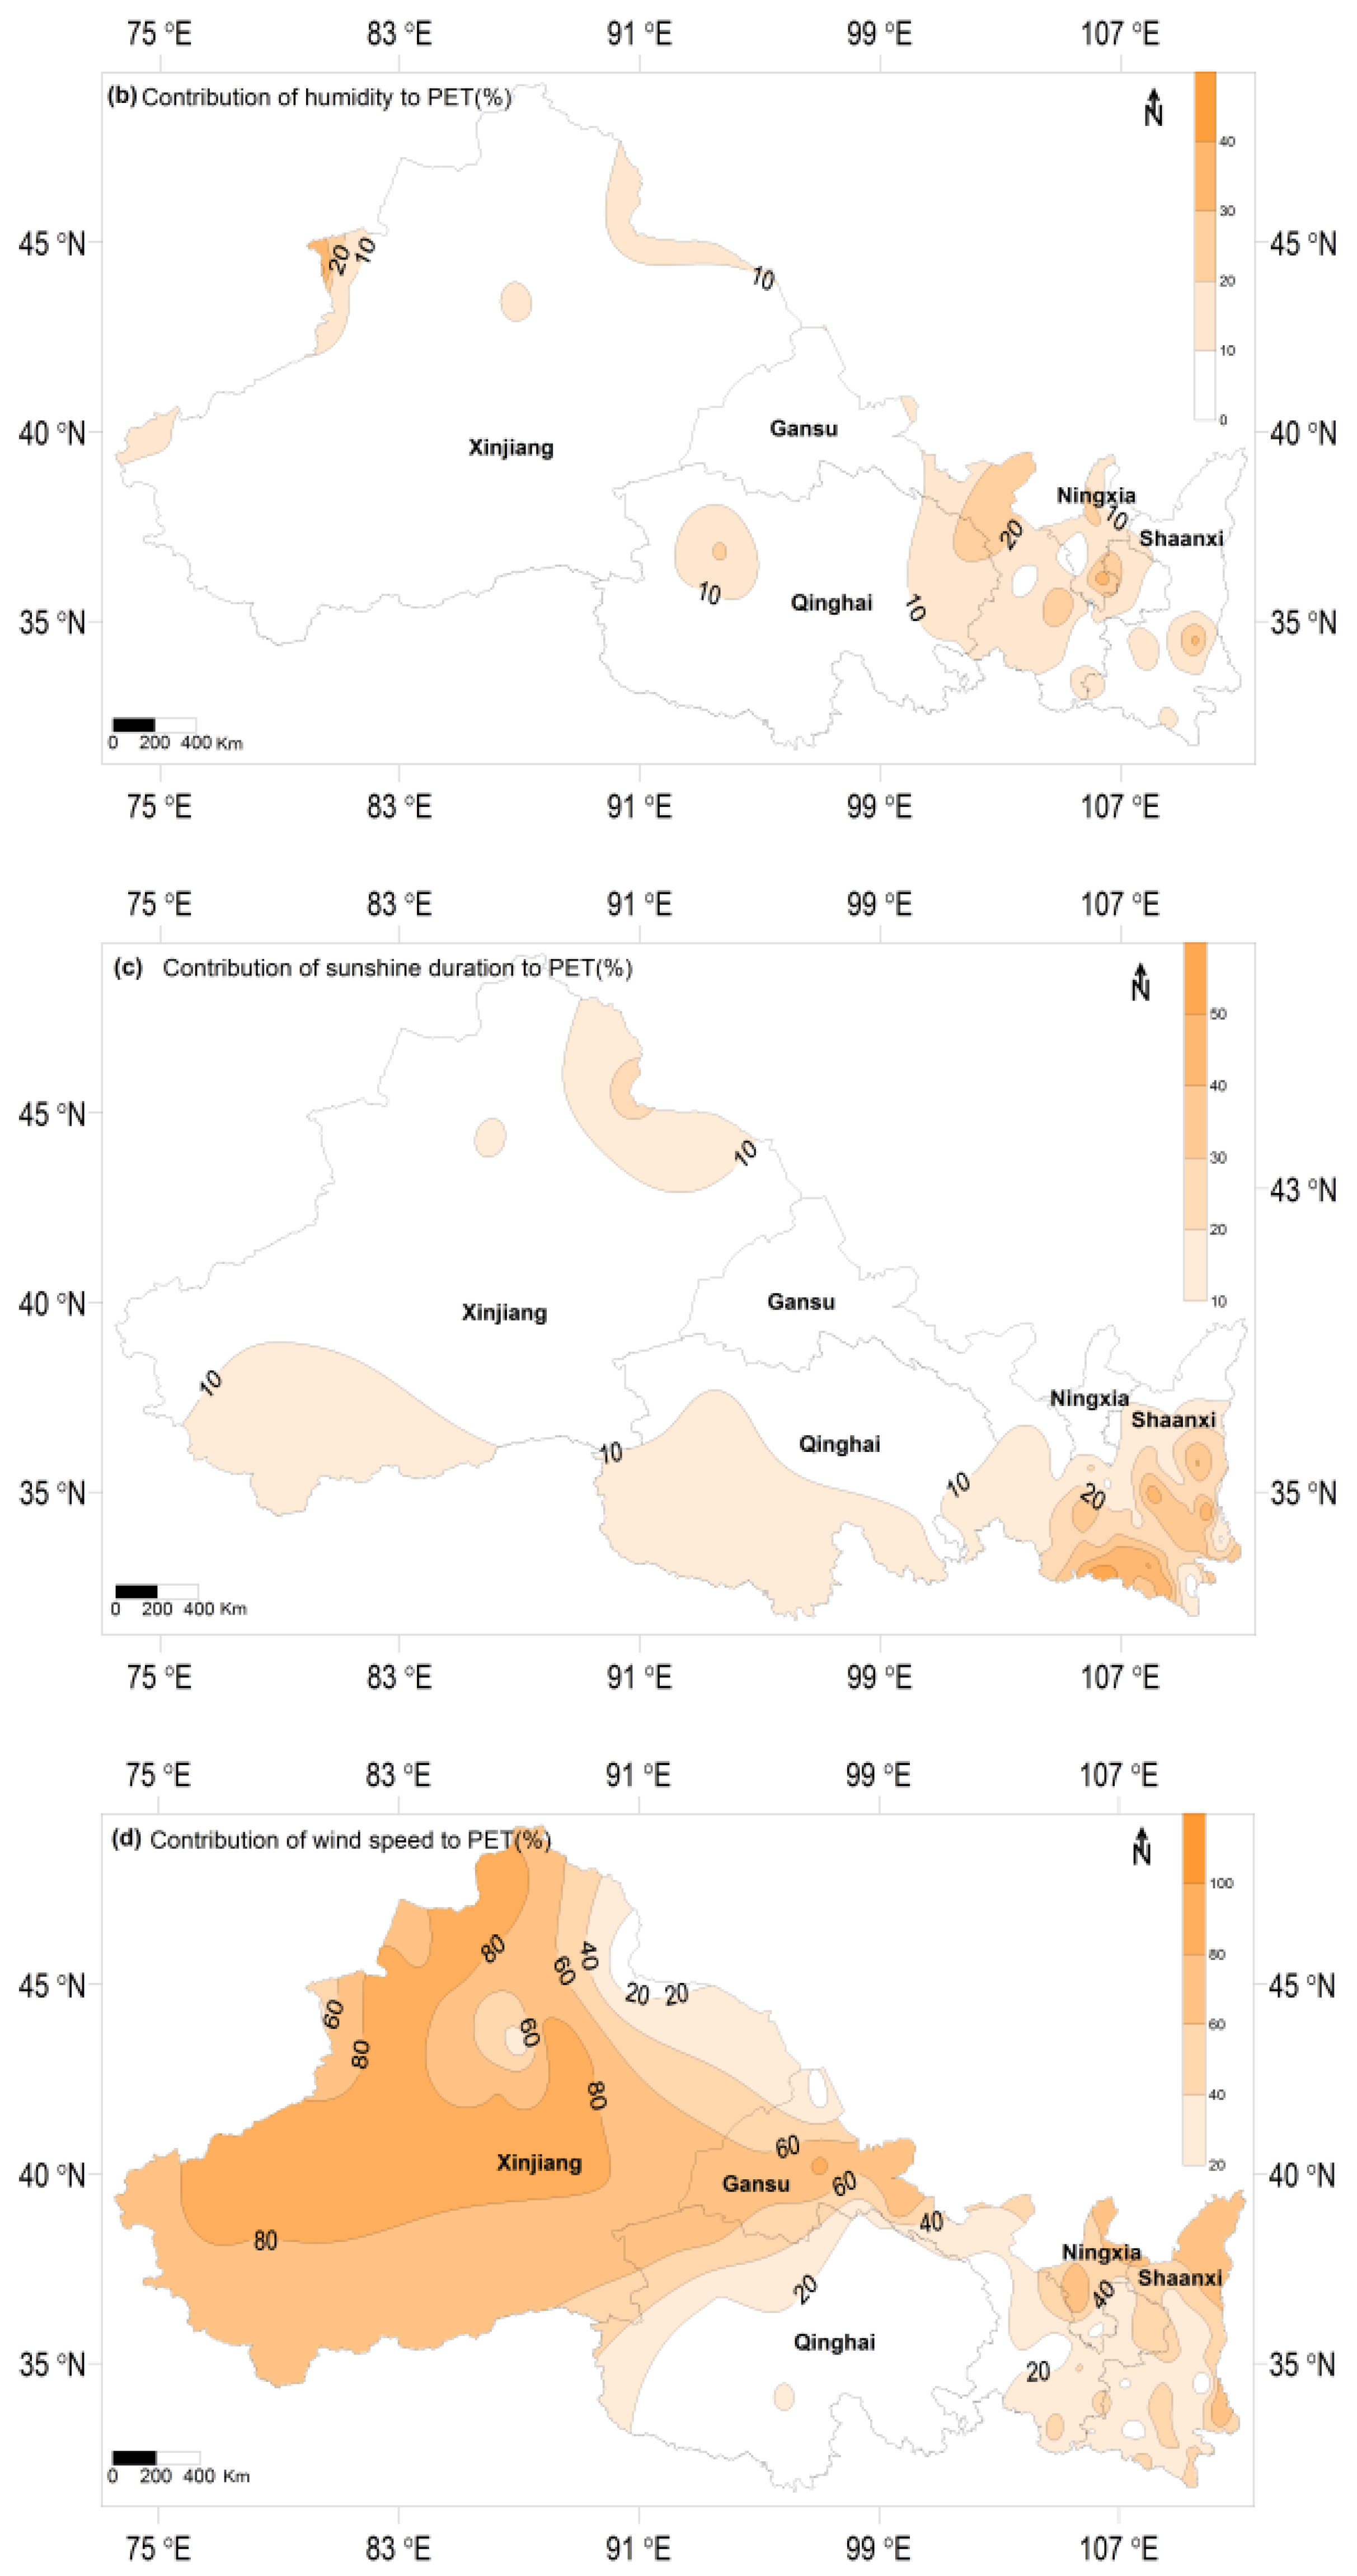
3.2.2. Response of PET to Humidity

In Figure 7a, the actual relative humidity remains unchanged, whereas the other meteorological elements affecting PET (highest and lowest temperatures, sunshine duration, and wind speed at 2 m height) were replaced with the corresponding daily measured values from each weather station between 1961 and 1970. The results were obtained after the same averaging and subtracting mentioned above. Figure 7b shows the 10-year change in relative humidity, and Figure 7c shows the decadal change in precipitation. As precipitation directly affects soil and the relative humidity of air, and because the water and energy cycle are complex, the trend in precipitation is also included here for reference. Figure 7a shows that the relative humidity continuously reduced the overall PET in the region, especially in the humid zone; the decrease was relatively small in the semi-arid and arid zones. Therefore, PET responds negatively to relative humidity. Figure 7b shows that the change in relative humidity in Northwest China has been polarized, that is, the relative humidity of the air in the humid area has increased, whereas that in the semi-arid area has decreased significantly. This is consistent with the research conclusion of Huang et al., which states that the vast semi-arid area of Northwest China is gradually becoming drier, whereas the humid zones are becoming wetter [49]. The higher the relative humidity of the humid zone in this region, the lower the PET. A comparison of Figure 7a,b indicates that in 2001–2010 and 2010–2019, when the increase in relative humidity in the humid zone was the most significant, the corresponding decrease in PET was also the most significant. (see details in Supplementary Figure S7).

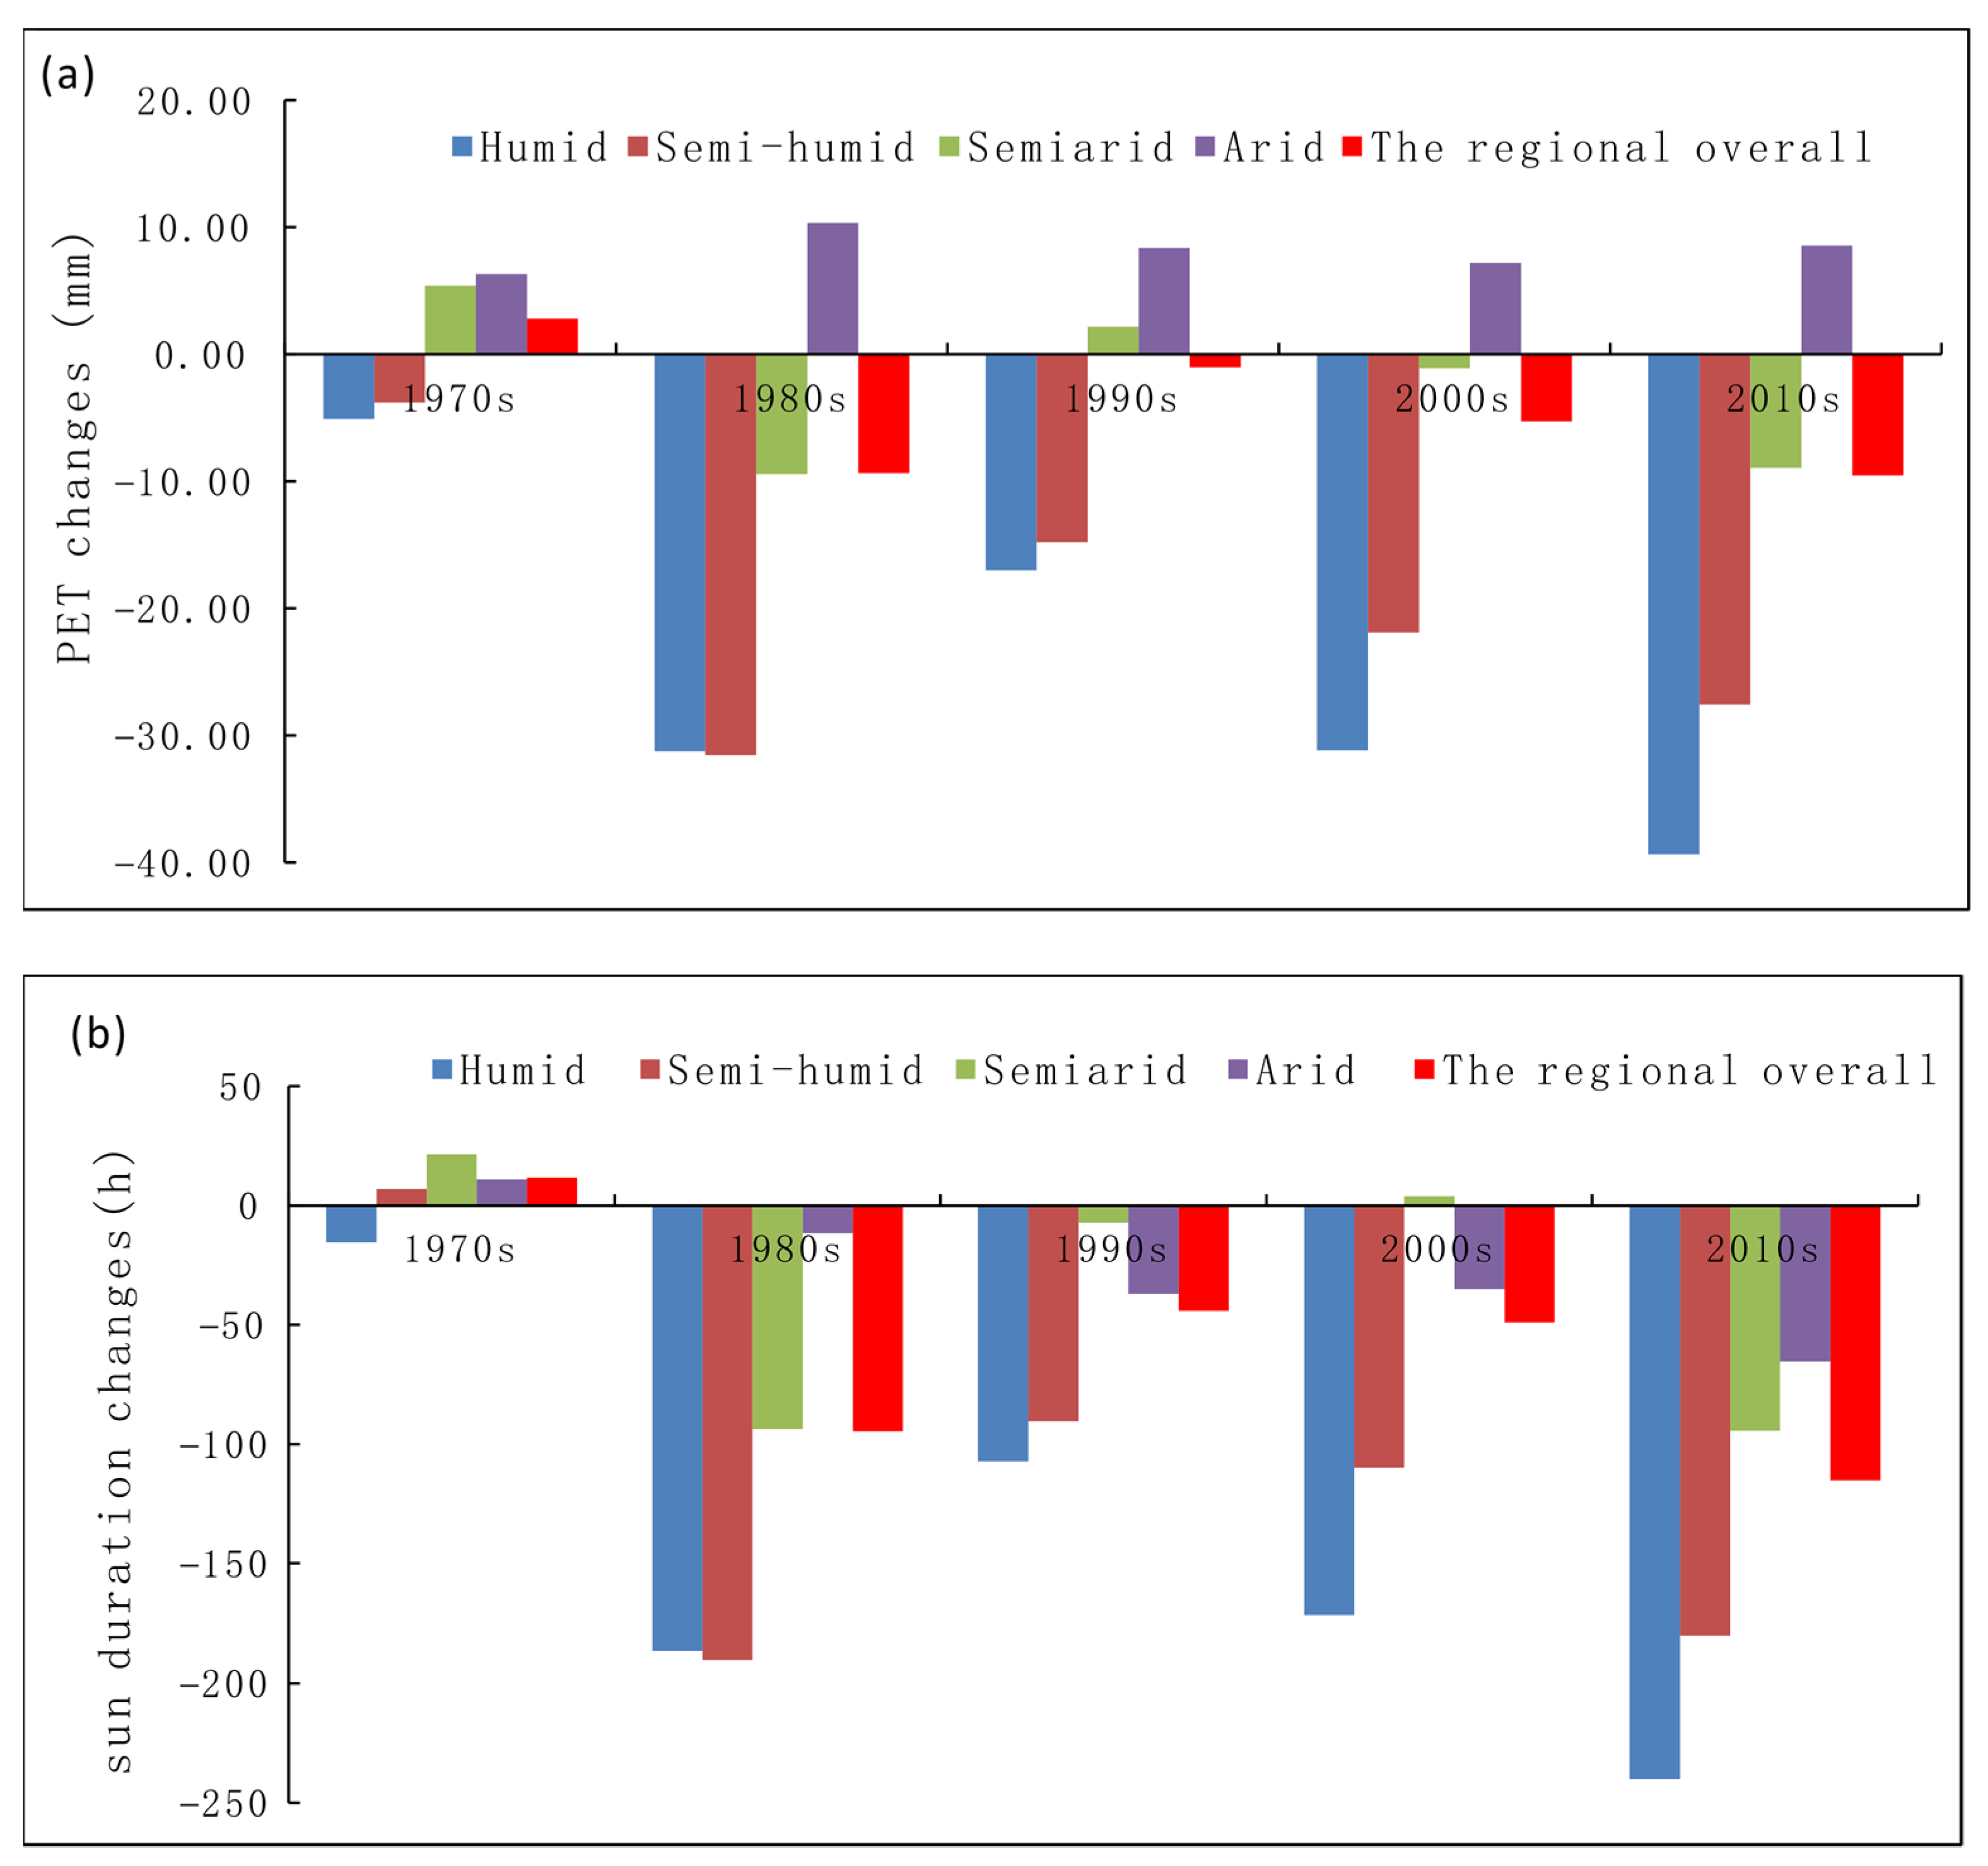
3.2.3. Response of PET to Sunshine Duration

The results in Figure 8a were obtained by keeping actual sunshine duration unchanged while replacing the other meteorological elements affecting PET (highest and lowest temperatures, relative humidity, and wind speed at 2 m height). Figure 8b shows the decadal changes in sunshine duration. Figure 8a shows that the amount of sunshine duration also mostly reduced PET in the region; only the PET in the arid zone increased slightly. The sunshine durations (Figure 8b) have declined rapidly since the 1980s; the decrease was slightly smaller in the 1990s. It has continued to decrease since the beginning of the 21st century, especially in humid and arid zones. This corresponds well with the change in PET due to sunshine duration (Figure 8a). (Details in Supplementary Figure S8).

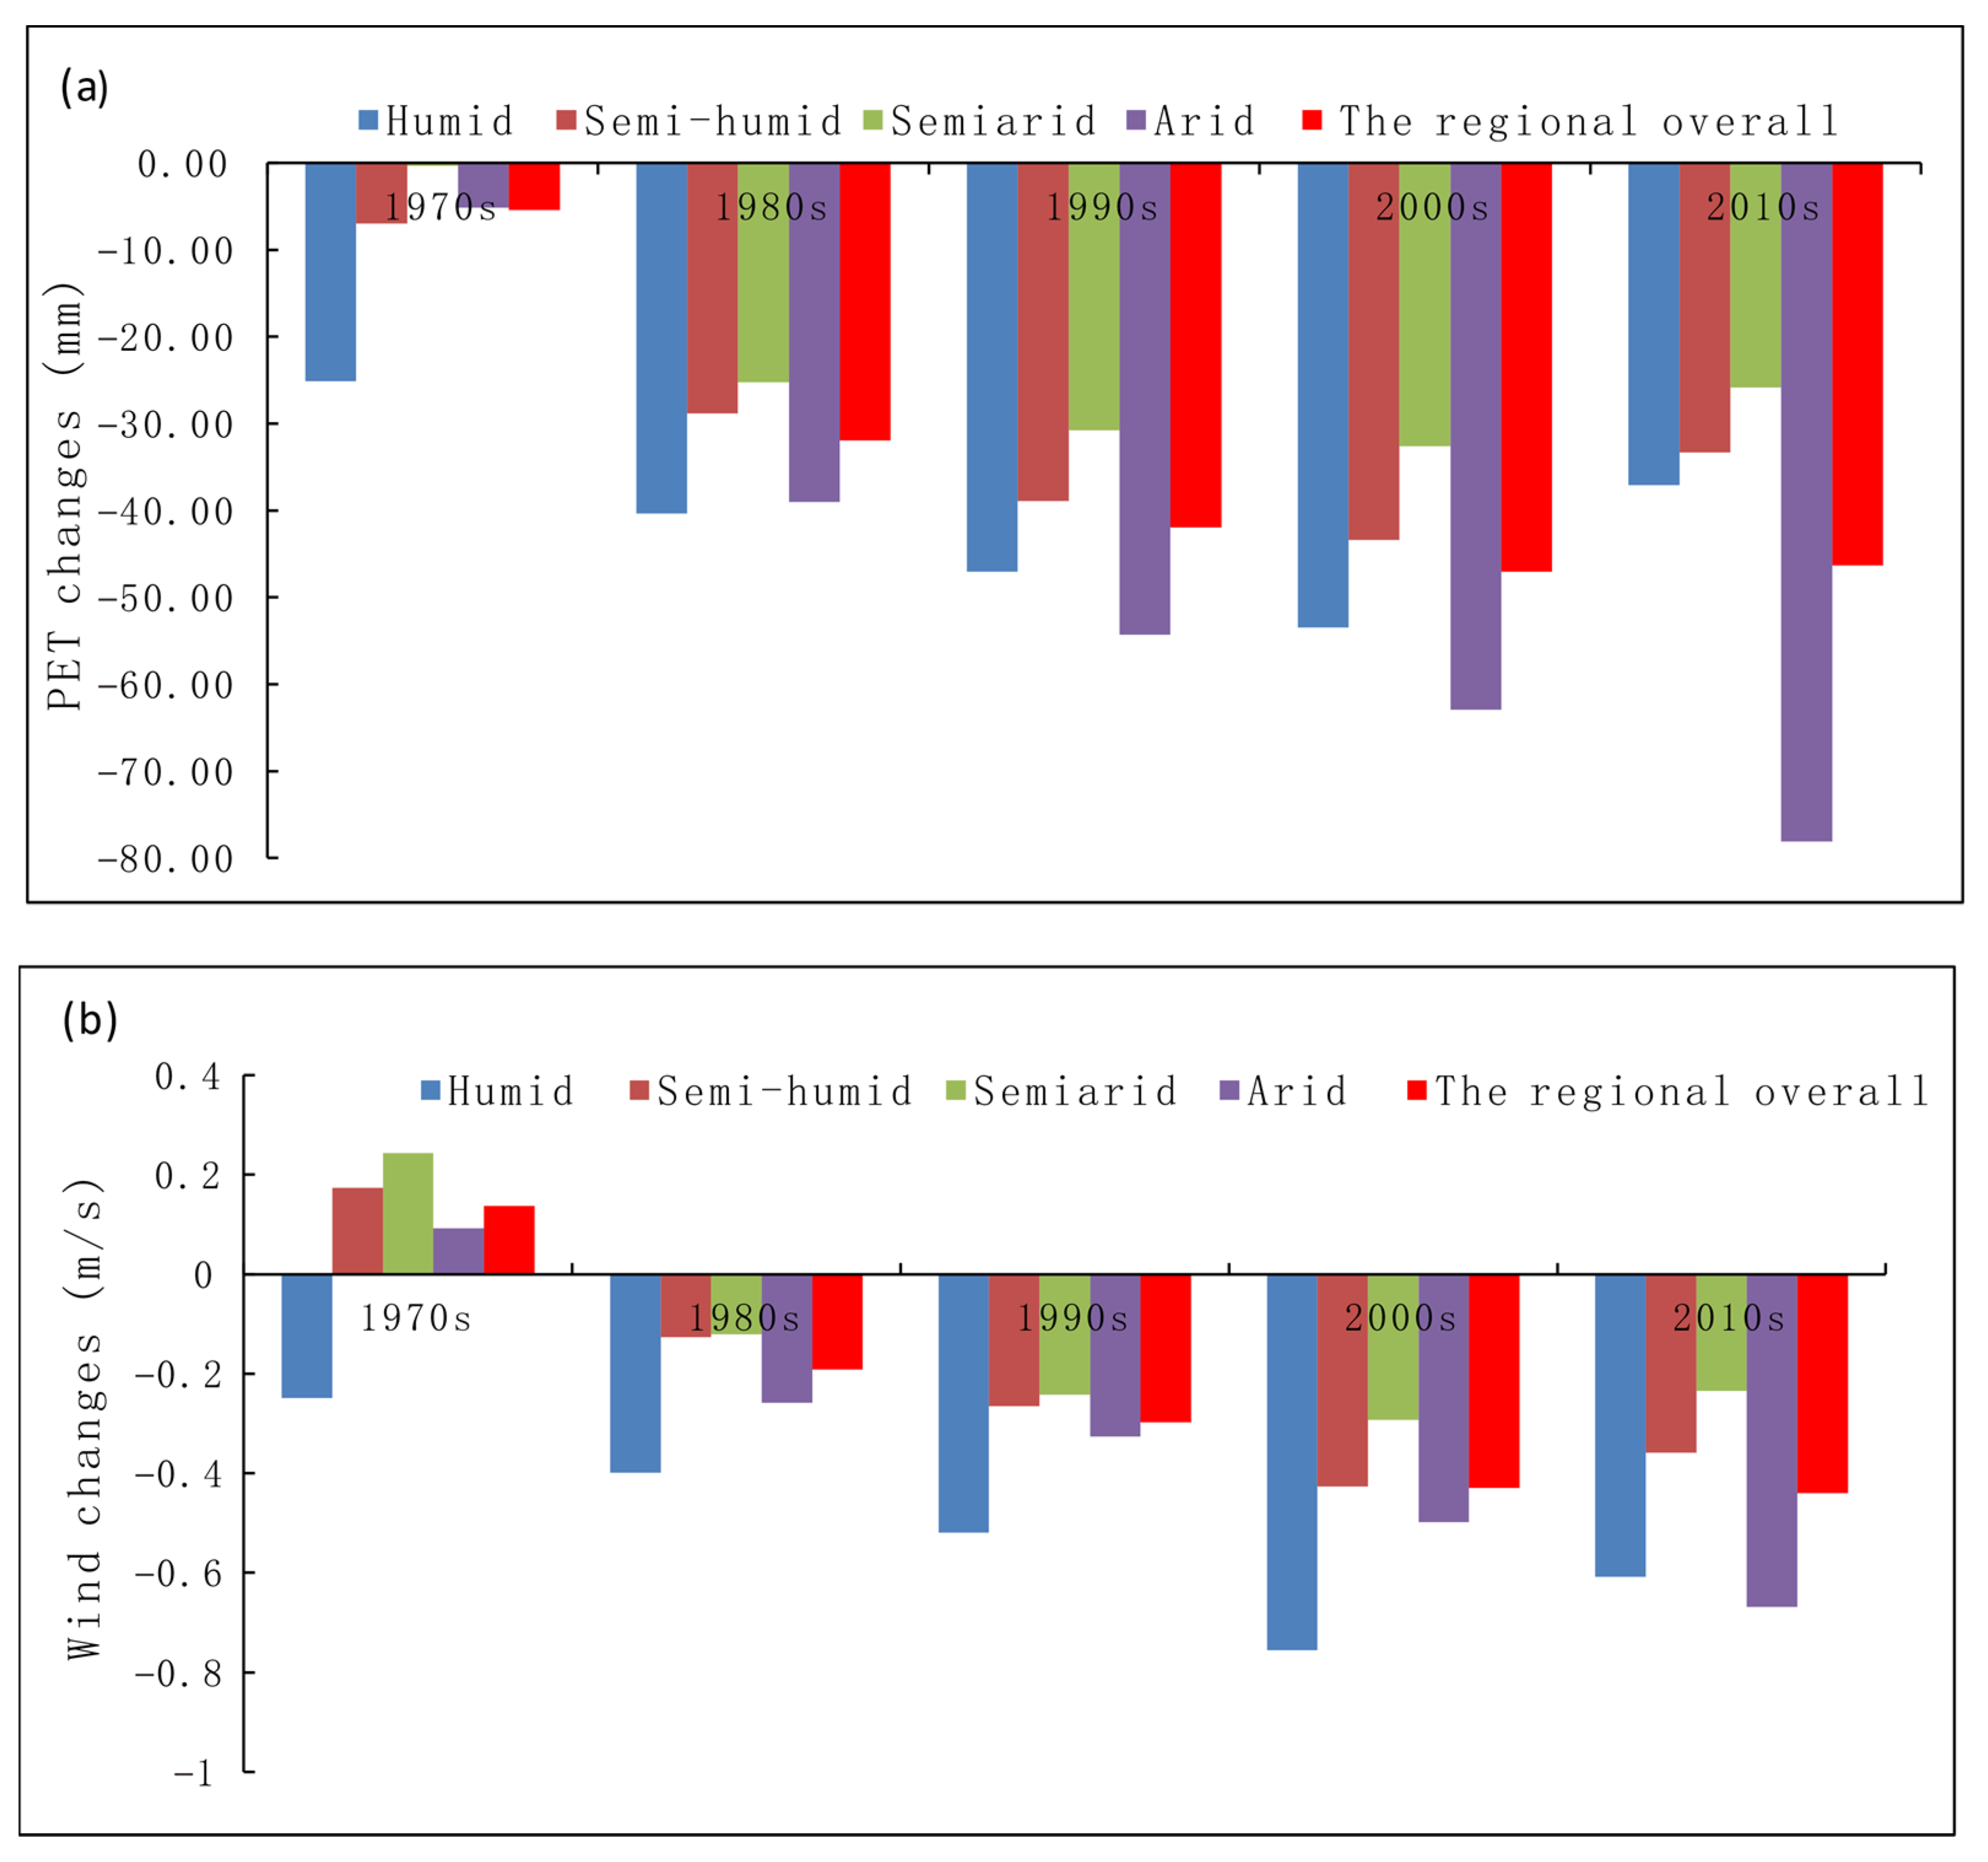
3.2.4. Response of PET to Wind Speed

The results in Figure 9a were obtained by keeping actual wind speed unchanged while replacing the other meteorological elements affecting PET (highest and lowest temperatures, relative humidity, and sunshine duration). Figure 9b shows the decadal changes in wind speed. Figure 9a shows that, in terms of wind speed, the PET in Northwest China has always been decreasing when the other variables are constant, and the decrease has been relatively large. The wind speed in this region (Figure 9b) decreased in the humid zone in the 1970s and slightly increased in other climate zones. Then, wind speed in this region generally continued to decrease; it decreased the most in the humid zone, followed by the arid region. Corresponding to the decrease in wind speed, PET also decreased; it decreased the most in the arid zone, followed by the humid zone. (see details in Supplementary Figure S9).
In general, PET has different responses to highest and lowest temperatures, relative humidity, sunshine duration, and wind speed, as listed in Table 2. The responses of PET to each meteorological element were most significant in arid and humid zones and milder in the other climate zones.

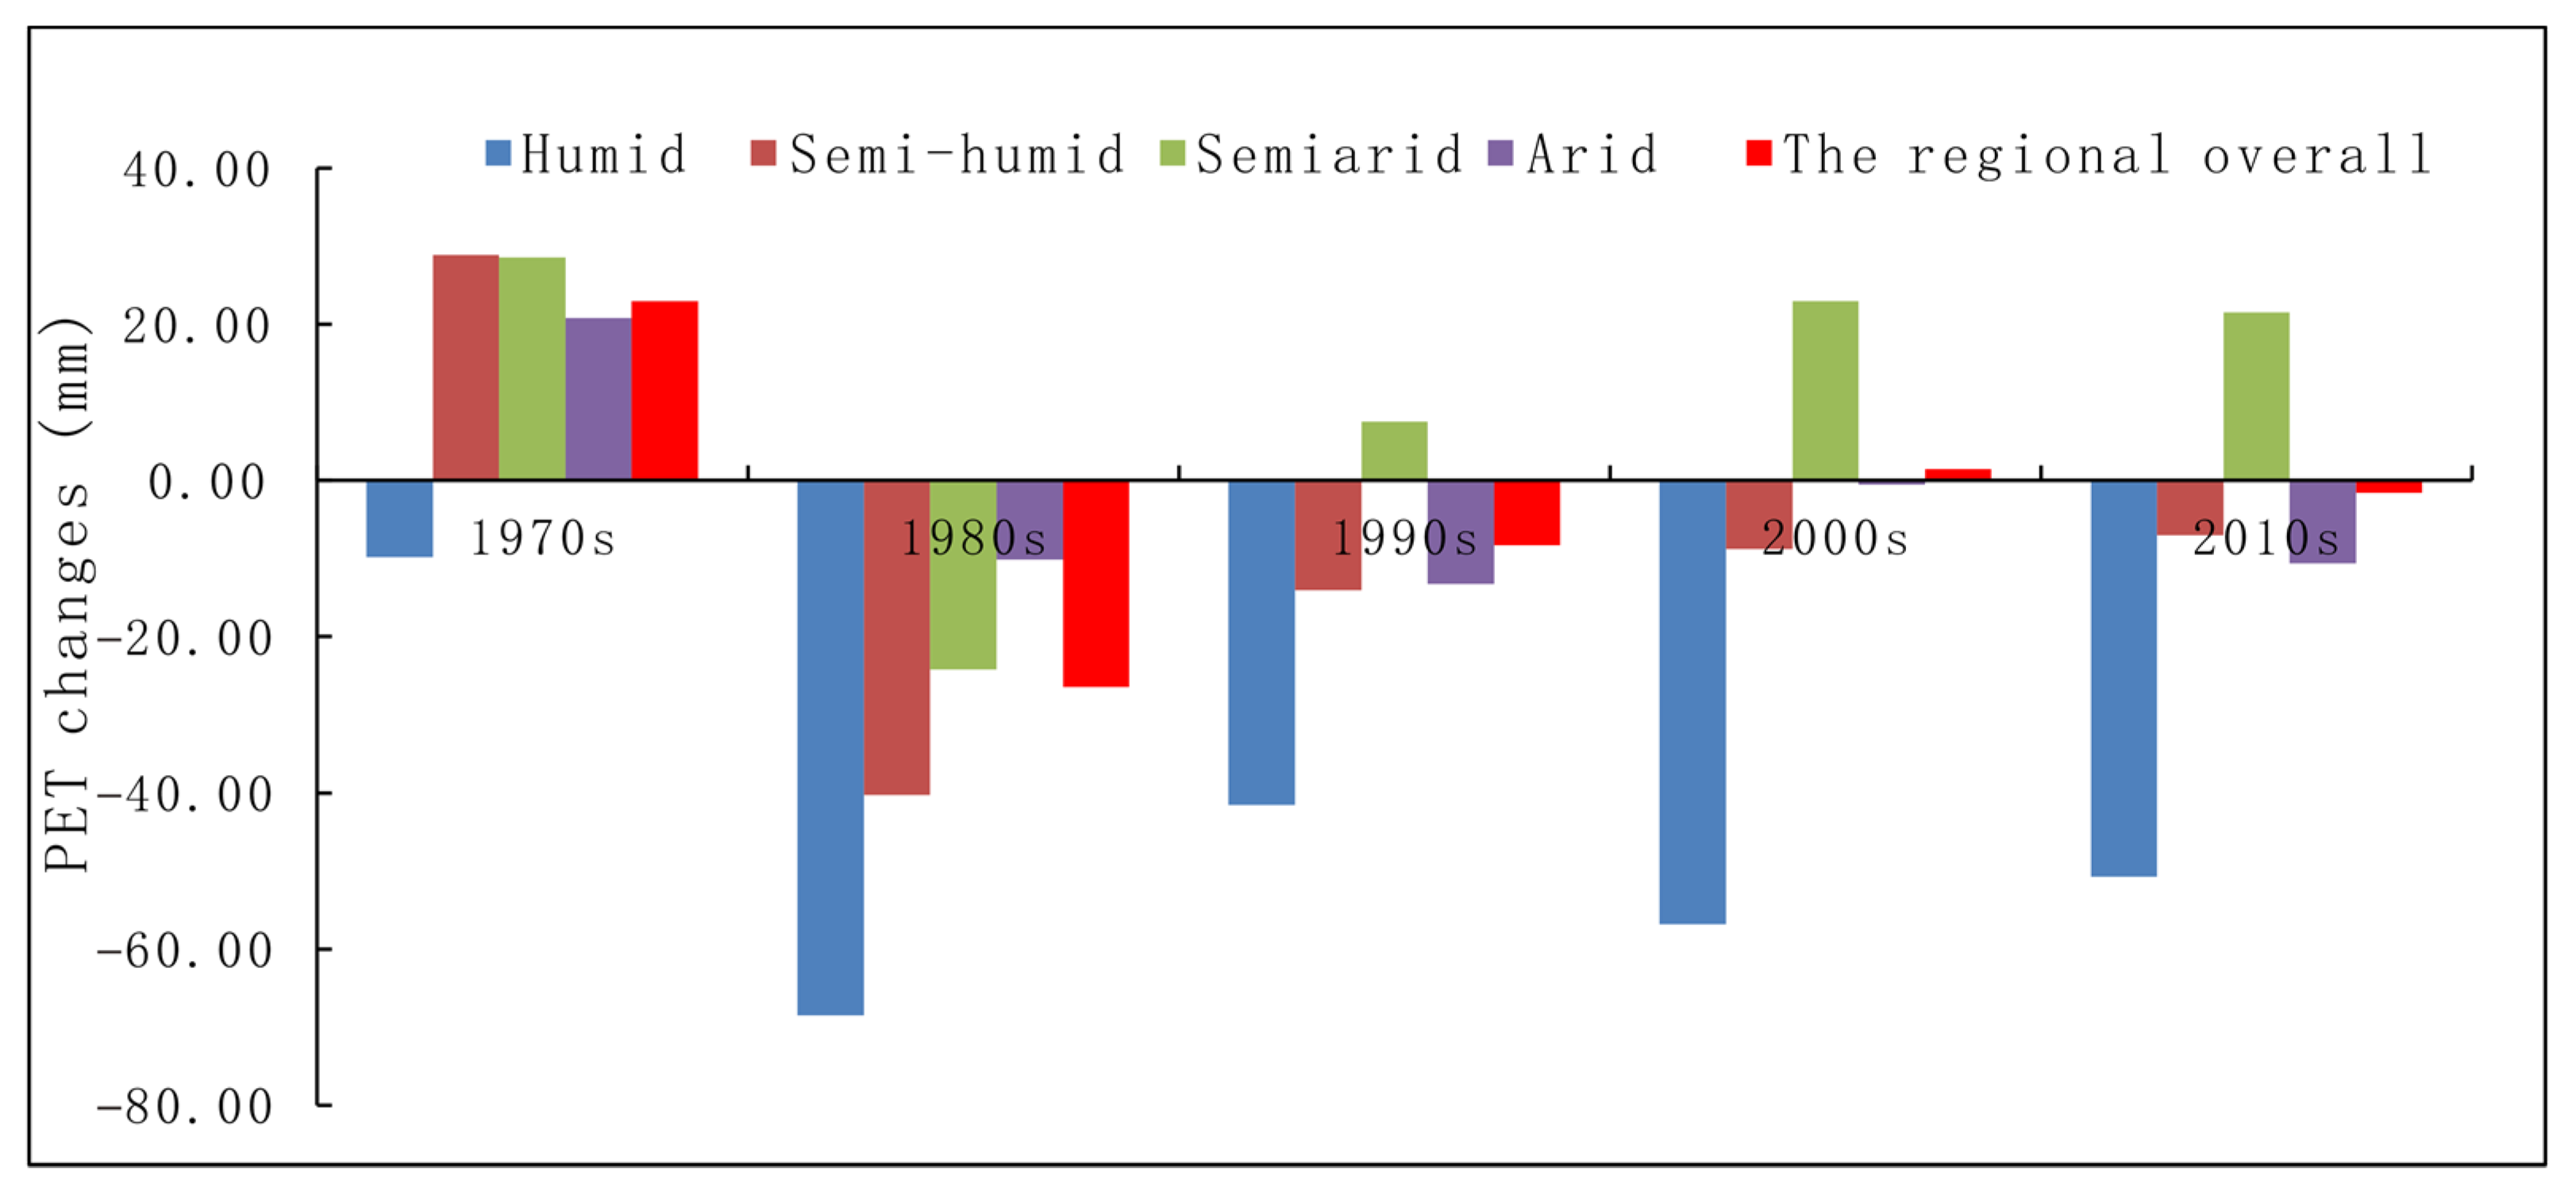
3.2.5. Actual Changes in PET in Northwest China and Their Contribution Factors

Clearly, PET in Northwest China responds differently to warming, wetting, and the continued decrease in sunshine duration and wind speed in the region. Figure 10 shows the actual decadal change in PET in this region for the past 50 years, compared with that in the reference period of 1961–1970. The figure shows that the overall PET in Northwest China has not dropped significantly, and the most significant change only occurred in the 1970s and 1980s, the decadal average of the PET decreased from positive 23 mm to negative 26 mm. PET has been close to that in the reference period of 1961–1970 during the past 30 years in the region. It is worth noting that the decadal average of PET has dropped significantly in the humid climate zone of this region, by about 40–70 mm compared with that in the reference period, but has increased significantly in the semi-arid zones, by about 20 mm. (Details in Supplementary Figure S10).
Since the warming, wetting, and continued decrease in sunshine duration and wind speed in Northwest China all affect PET to varying degrees, Figure 11 shows the effect proportion of each factor from variance analysis. The figure shows that PET in the central and eastern parts of Northwest China is largely affected by the temperature factor, which accounts for more than 40% of the impact, whereas relative humidity and sunshine duration have a relatively small impact (below 20% in most places). The high wind speed in the western part of this region throughout the year accounts for more than 40% of the impact on PET, and more than 80% in some places. Wind speed is the main factor affecting PET in the western part of Northwest China. (see details in Supplementary Figure S11).

4. Discussion

4.1. Comparison of Actual Changes and Factor Analysis Results of PET in Northwest China from 2010 to 2019

To verify the reliability of the results obtained using the method mentioned above, the actual measured value of each weather station was used to calculate the average PET of the most recent decade (2010–2019). Then, the 1961–1970 10-year average PET was subtracted, and the spatial distribution map of PET in 2010–2019 compared with that in 1961–1970 was drawn (Figure 12a). Furthermore, the 2010–2019 decadal average of PET when the highest and lowest temperatures, relative humidity, sunshine duration, and wind speed were kept unchanged were obtained, respectively, and further averaged; then, the 1961–1970 baseline values were subtracted to obtain the spatial distribution map of changes in PET from the 1961–1970 period to 2010–2019 period (Figure 12b). The comparison shows that the spatial distribution of the two results is very consistent, and, especially, that the zero line of PET (the thick solid line in the figure) is almost in the same position. (Details in Supplementary Figure S12). This indirectly illustrates that it is reasonable to determine the impact of a certain meteorological element on PET by keeping the actual values of that element in Equation (1) unchanged while replacing the others with data from a set period (1961–1970 in this study). Figure 12 shows that PET in the western (mainly Xinjiang) and southeastern parts of Northwest China (mainly Shaanxi) decreased significantly in 2010–2019 compared with those in 1961–1970, whereas most areas of the northern and central parts of Northwest China experienced an increase in PET in the 2010–2019 period. Comparing Figure 12a,b, the actual change in PET in the 2010–2019 period is larger than that in the multifactor analysis results (compared with the reference period 1961–1970), which indicates that some factors affecting PET are not included in Formula (1), such as low cloud cover and aerosols that affect net radiation. Moreover, the impact of precipitation on air humidity is very complex and nonlinear, and the phase changes in soil moisture also affect the energy process; this may have caused the difference in the magnitude of the two results.

4.2. Uncertainties and Limitations

Factors affecting PET are far more complex than those in Equation (1). The contribution analysis in the study is a variate replacement method to decompose the contributions of temperature (average of Tmax and Tmin), relative humidity, sunshine duration, wind speed to PET, respectively, that cannot explain the feedback mechanism between different meteorological elements. There are certain uncertainties and limitations caused by the method. Owing to the unique climatic characteristics and underlying surface energy mechanism in Northwest China [50,51,52], it is difficult to give a scientific explanation about the warming and wetting in the region. Therefore, the extent to which PET affects climate change in this region is presently unclear. On the one hand, studies have shown that the increase in precipitation in the zones of northwest China has mostly been caused by the internal circulation formed by the accelerated melting of snow and ice in the surrounding mountains [53,54]. The melting and retreat of glaciers caused by global warming have had a major impact on the region’s water resources and ecological environment [55,56,57]. On the other hand, some studies have claimed that the increase in precipitation in this region may have been only partly or not at all in response to global warming [15]. Nevertheless, PET undoubtedly plays an important role. As climate change is an inevitable result of atmospheric circulation within a certain range [58], the climate in Northwest China is affected by both the East Asian summer monsoon and the westerlies. Therefore, attention to both the westerly circulation and the East Asian summer monsoon circulation is needed [59,60], and further attention toEl Niño–Southern Oscillation [61], as they impact climate change in this region.

5. Conclusions

(1)
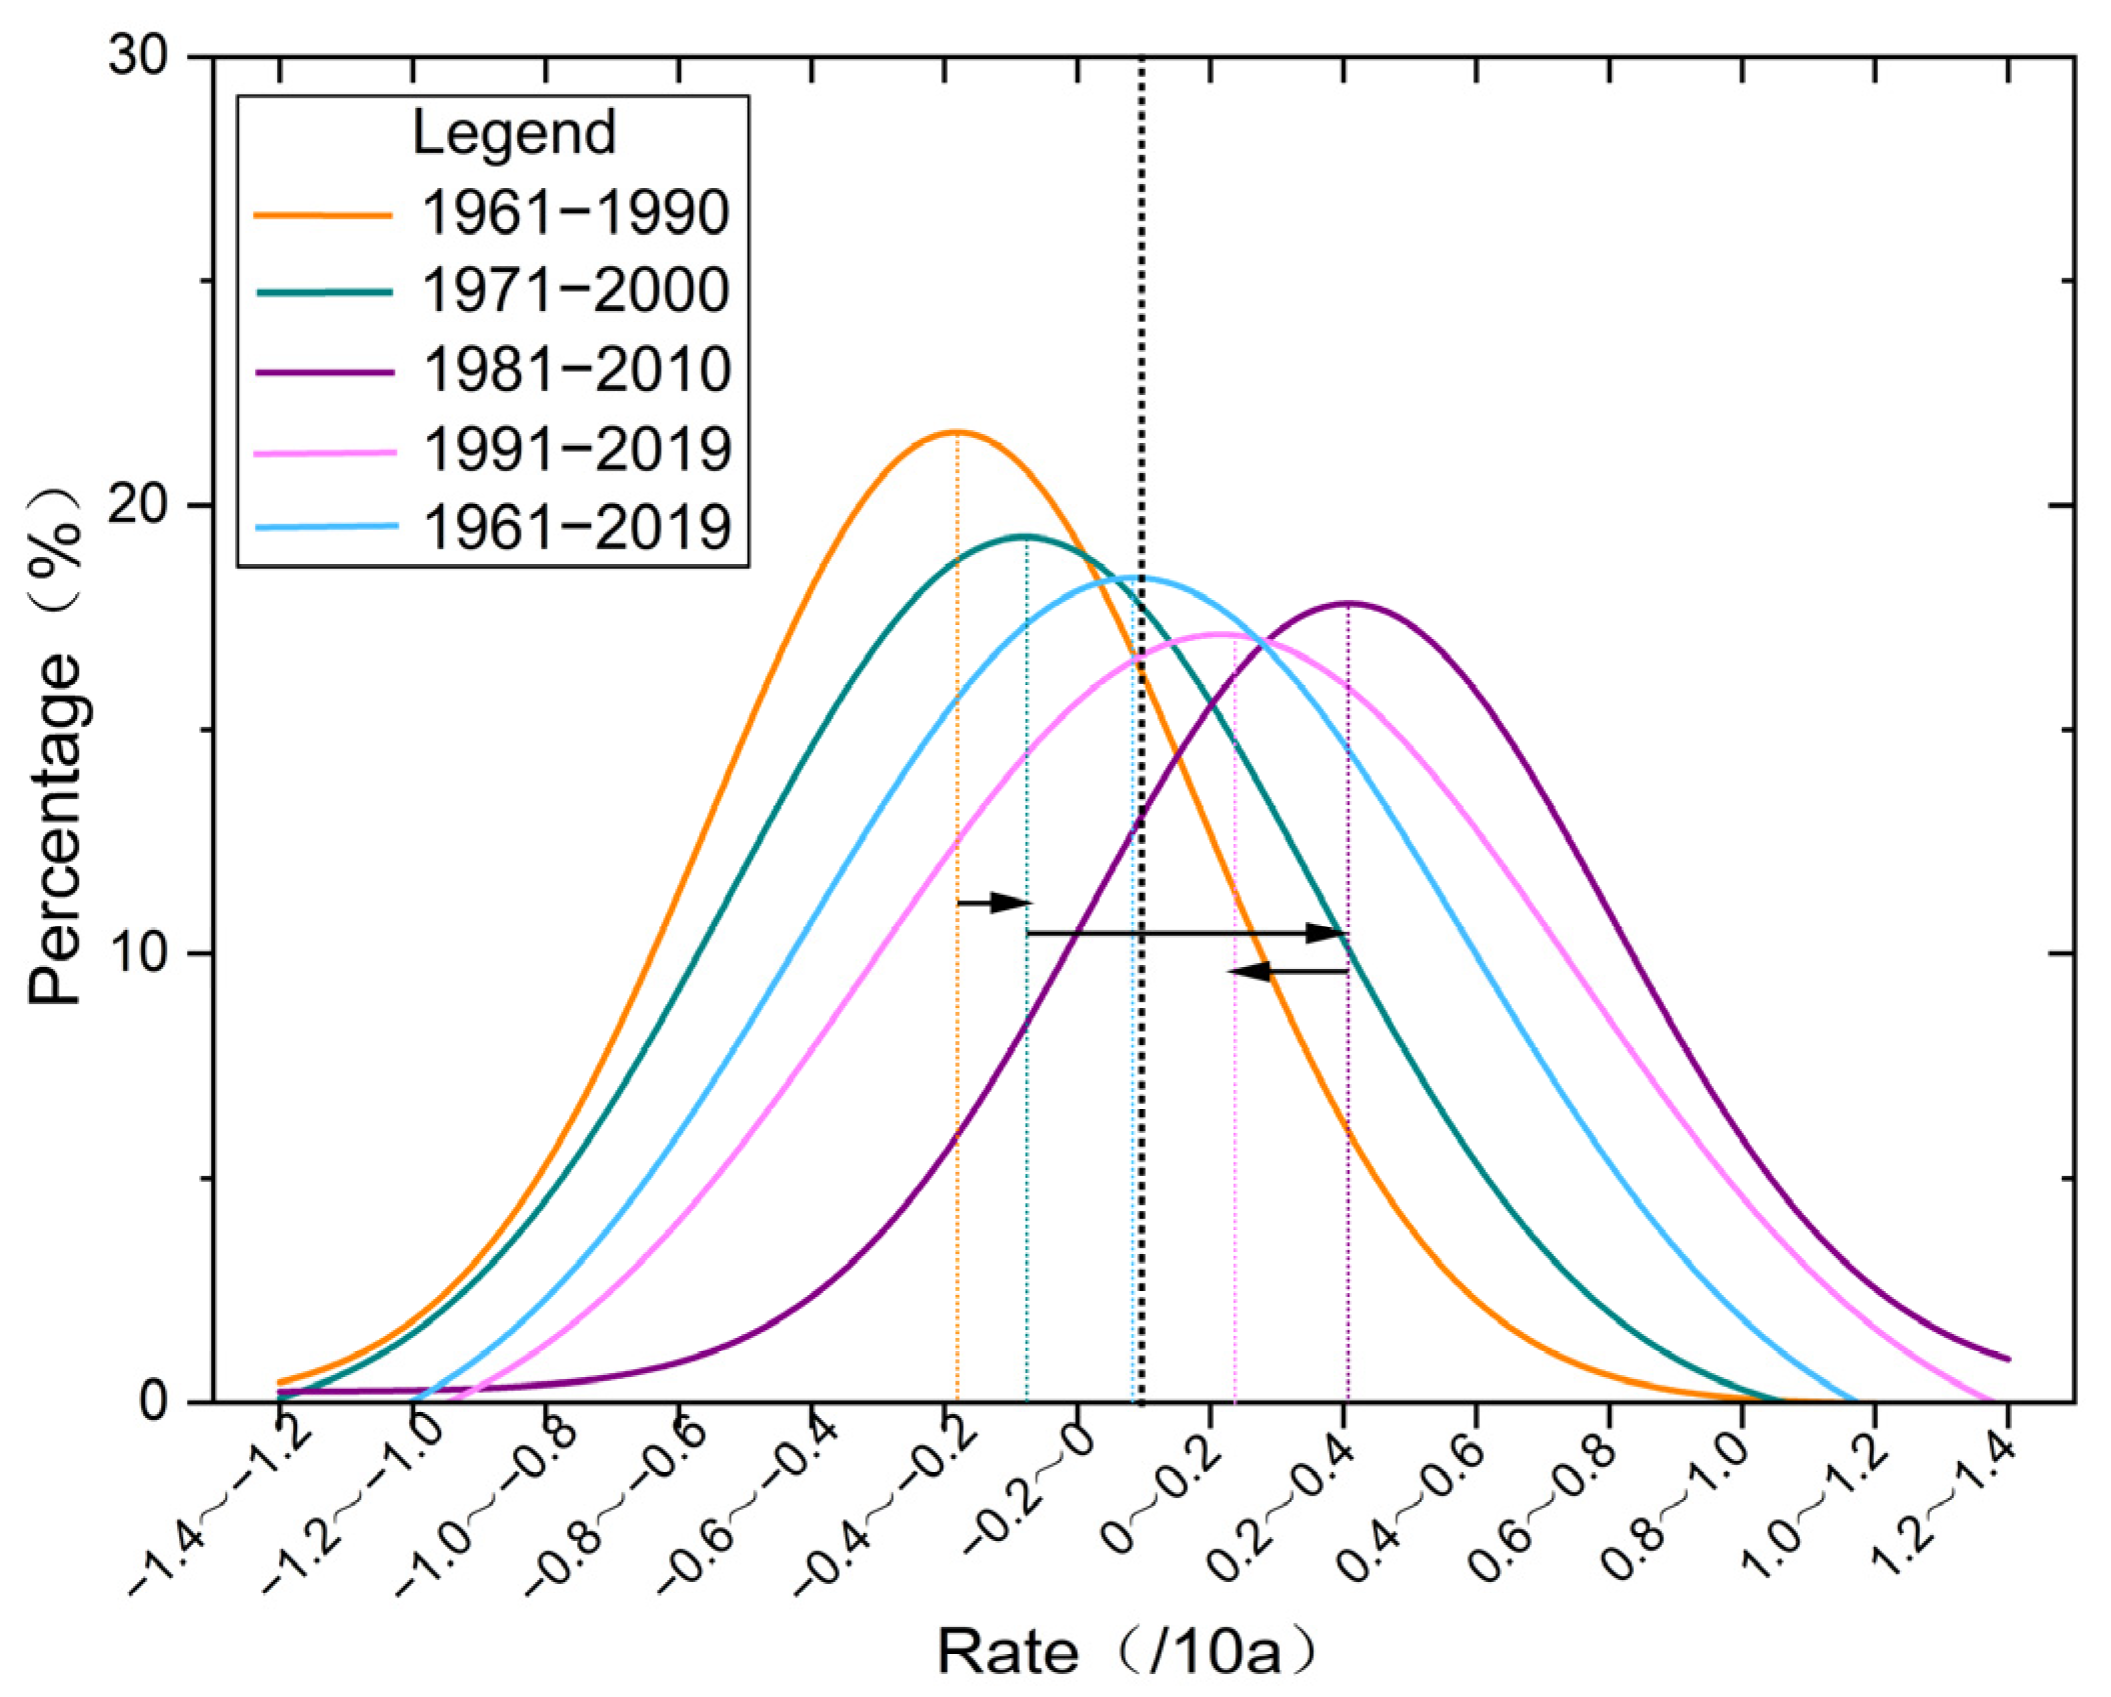
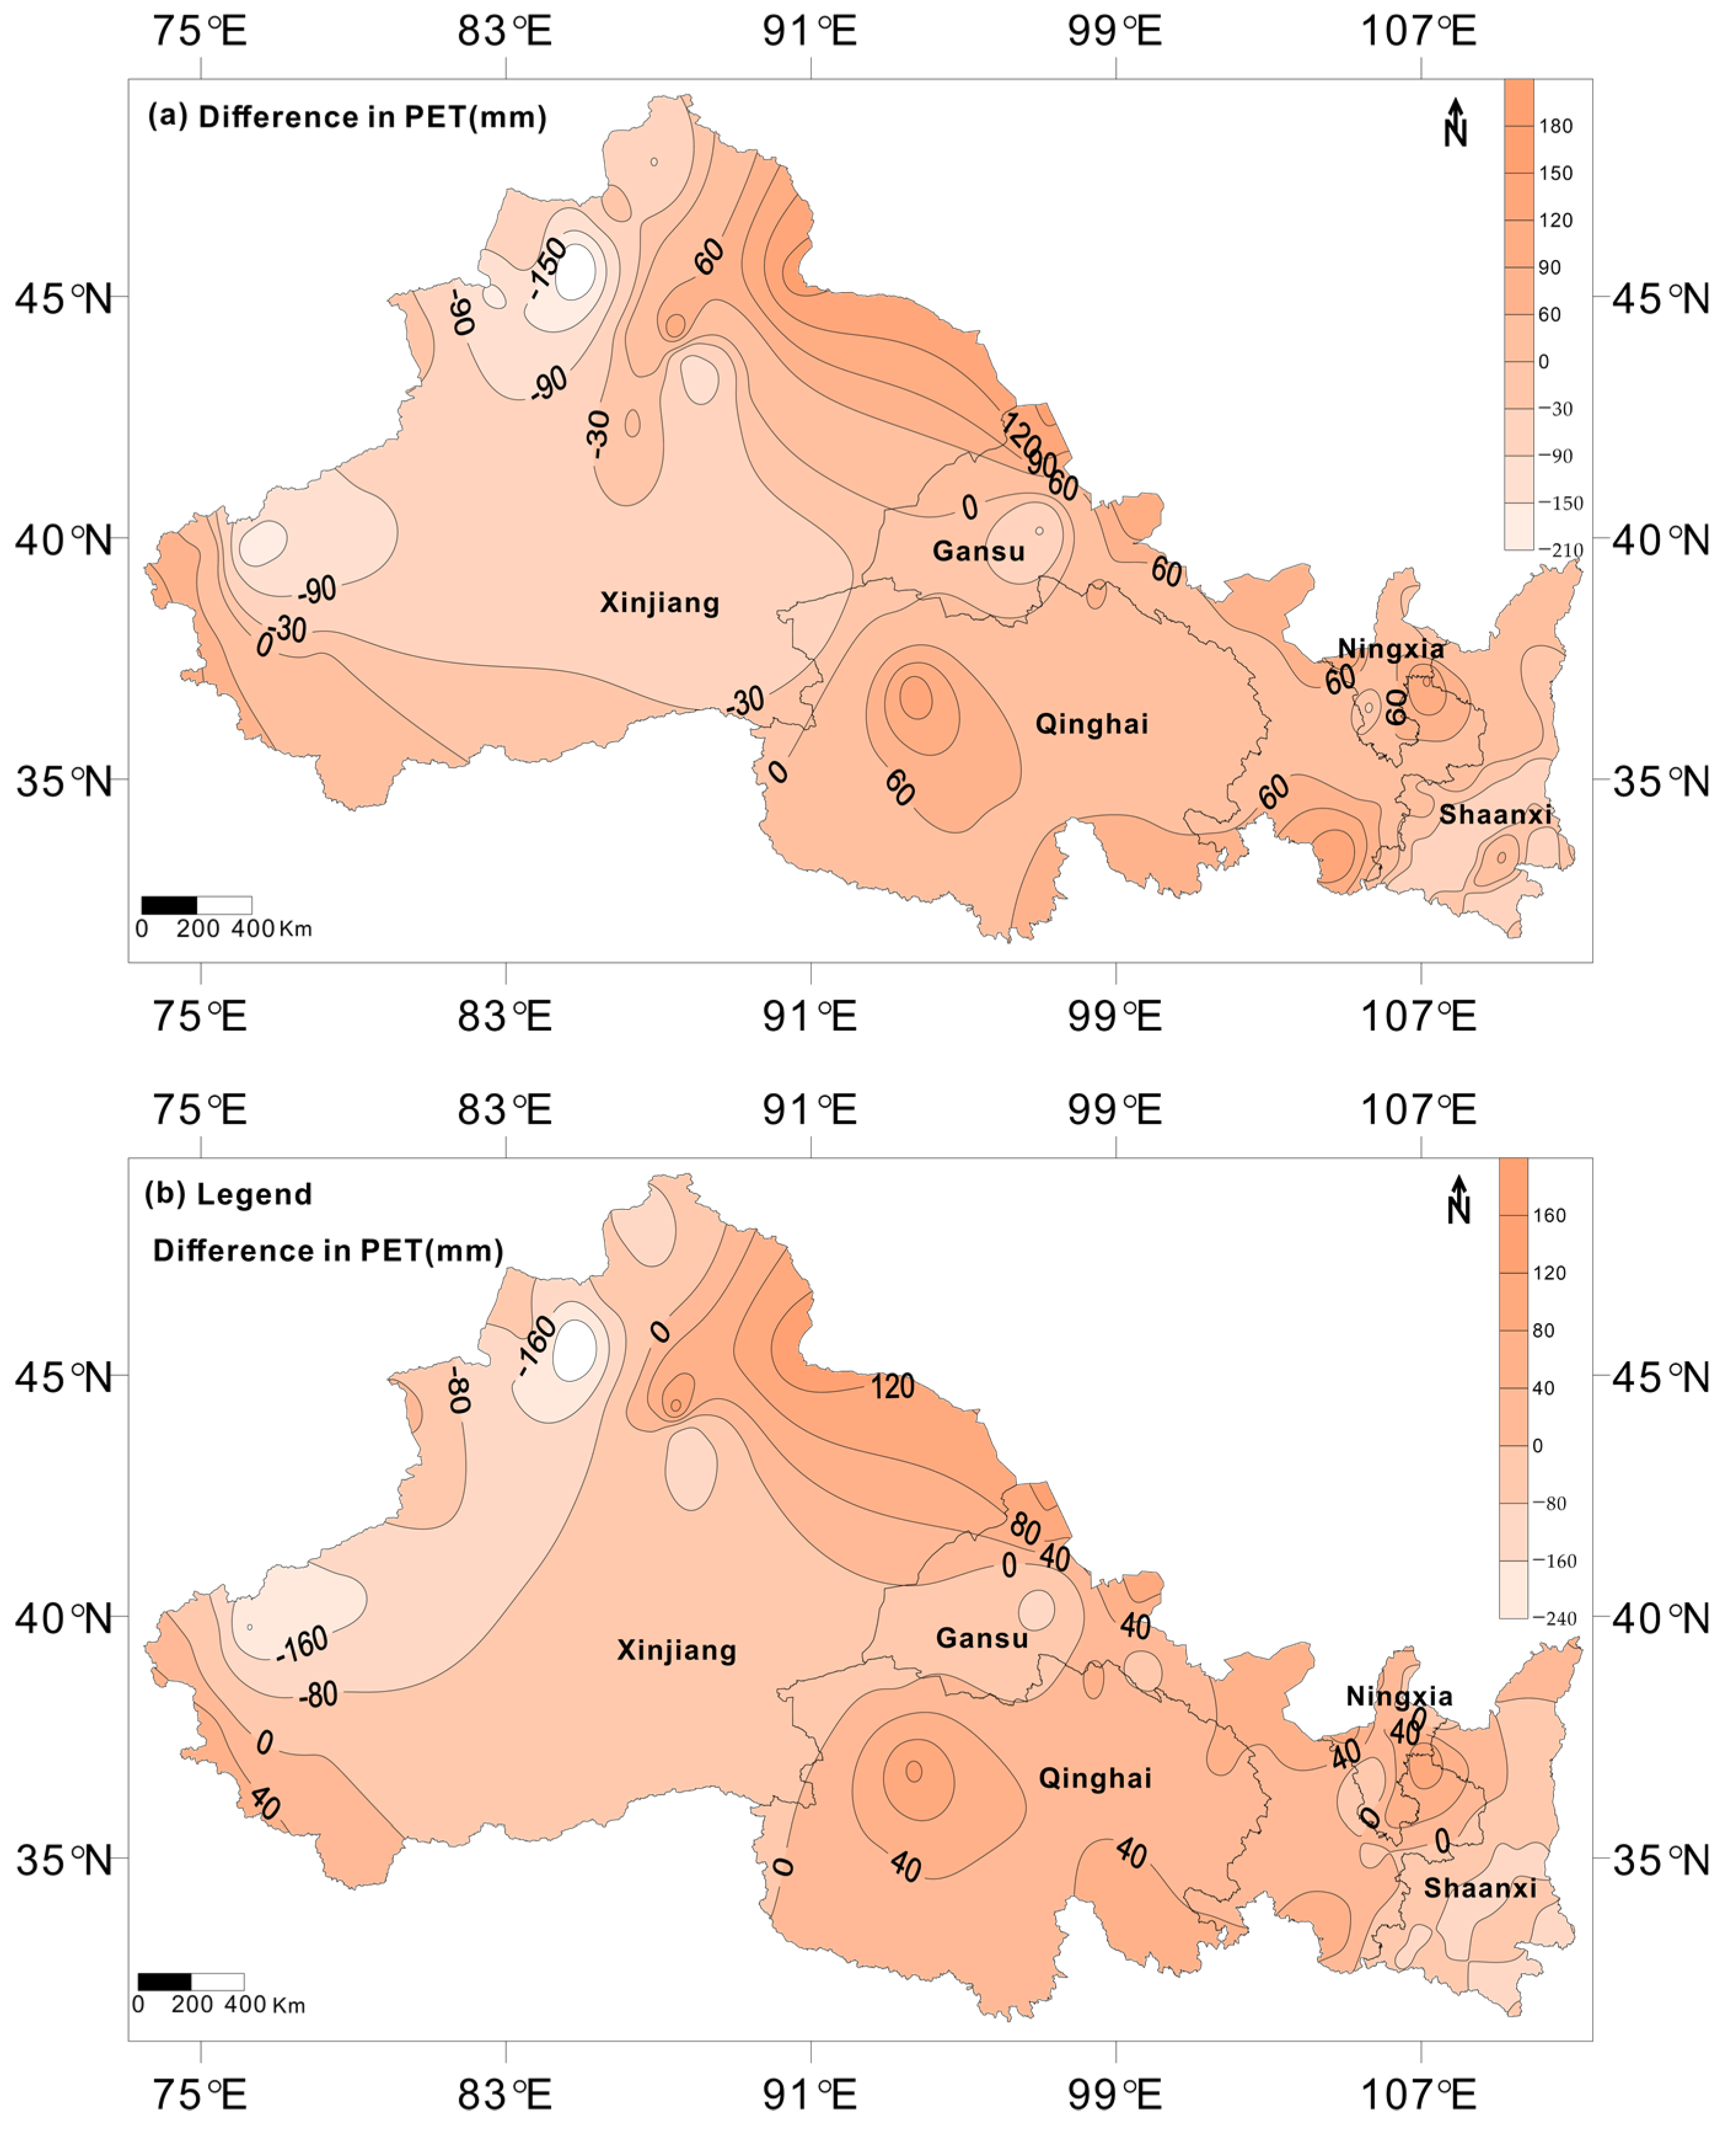
By analyzing the spatial distribution of PET and climate change trends in Northwest China in the past sixty years, this study revealed that the changes in both PET and the warming and wetting in Northwest China were clearly regional and periodic. In the periods 1961–1990 and 1971–2000, PET mainly decreased; in the periods 1981–2010 and 1991–2019, the trend was opposite, especially during 1981–2010, when the climate trend coefficient of PET was, on average, between 0.2 and 0.4. From 1971–2000 to 1981–2010, the change in the climate trend of PET was the most significant.
(2)
This study analyzed the response of PET to warming and wetting in Northwest China using the factor analysis method and the 1961–1970 period as the reference. It was found that PET increased and responded positively to the temperature. A rapid increase mainly occurred in the 1990s, corresponding well with the highest and lowest temperatures changes. Relative humidity increased significantly in the humid zones and decreased significantly in the semi-arid zones, leading to a continued decrease in overall PET in the region, especially in the humid zone; however, the magnitude of PET decrease was generally not large, and it gradually rebounded in the last three decades. The amount of sunshine duration has continued to decline rapidly since the 1980s, especially in humid and arid zones, leading to a corresponding decrease in PET in the region. Similarly, as the wind speed decreased in the region, PET also decreased significantly; the largest magnitude of decrease was in the arid zone, followed by the humid zone.
(3)
Temperature is the only factor that has caused PET to increase; changes in all the other meteorological factors have reduced PET in Northwest China. However, the most significant changes in overall PET in this region occurred in the 1970s and 1980s. In general, PET in the humid climate zone has decreased significantly, while that in the semi-arid climate zone has increased.
(4)
PET in the central and eastern parts of Northwest China was mainly affected by the temperature. As the wind speed is high throughout the year in the western part of this region, it has also been a major factor affecting PET. The impacts of relative humidity and sunshine duration have been relatively small (below 20% in most places).
Systematic and scientific research is required to determine the cause of the clear warming and wetting in Northwest China in recent decades, especially in the last thirty years. The resulting changes in the surface energy mechanism and their positive and negative feedbacks on the climate system are scientific issues that deserve special attention in the future [62,63]. The next step is to combine actual evapotranspiration with PET, further to comparison with the meteorological elements effects to PET between northwest China and east Central Asia by using reanalysis data, in order to more deeply understand the warming and wetting in northwest China. In addition, a new method without need for interpolations can be tried [64], using more observation data to support relevant studies, and results would be more reasonable and reliable. Only with a solid understanding of the climate change mechanisms in Northwest China can scientific judgments on the future climate trends of the region be made. Otherwise, any scientific understanding obtained from interim analyses will still be preliminary, incomplete, and in need of further study.

Supplementary Materials

The following are available online at https://www.mdpi.com/article/10.3390/atmos13020353/s1, Figure S1.xls, Method S1, Figures S2–S5.xls, Table S1.xls, Figure-S6.xls, Figure-S7.xls, Figure-S8.xls, Figure-S9.xls, Figure-S10.xls, Figure-S11.xls, Figure-S12.xls.

Author Contributions

Q.Z., B.Z., J.-H.Y. and C.-H.L. were involved in the design of the study. B.Z. and J.-H.Y. prepared and processed the data. B.Z., J.-H.Y. and C.-H.L. conducted the statistical analysis and created the tables and the figures in the report. B.Z. wrote the first draft. Q.Z., J.-H.Y. and C.-H.L. helped to revise the paper. Q.Z. acquired funding and supervised the project. All authors have read and agreed to the published version of the manuscript.

Funding

This work was funded by National Natural Science Foundation of China (41630426).

Institutional Review Board Statement

Not applicable.

Informed Consent Statement

Not applicable.

Data Availability Statement

The data that support the findings of this study are available from the corresponding author upon reasonable request.

Acknowledgments

We would like to express our sincere thanks to Haipeng Yu for his helpful comments and suggestions.

Conflicts of Interest

The authors declare no conflict of interest.

References

  1. Ding, Y.; Wang, S.; Zheng, J.; Wang, H.; Yang, X. Chinese Climate, 1st ed.; Science Press: Beijing, China, 2013; pp. 49–51. [Google Scholar]
  2. Ding, Y.; Zhang, L. Intercomparis on of the time for climate abrupt change between the Tibetan Plateau and other regions in China. Chin. J. Atmos. Sci. 2008, 32, 794–805. [Google Scholar]
  3. Zhang, M.; Yu, H.; Huang, J.; Wei, Y.; Zhang, T. Comparison of extreme temperature response to 0.5 °C additional warming between dry and humid regions over East-Central Asia. Int. J. Climatol. 2019, 39, 3348–3364. [Google Scholar] [CrossRef]
  4. Zhang, M.; Yu, H.; King, A.; Wei, Y.; Huang, J.; Ren, Y. Greater probability of extreme precipitation under 1.5 °C and 2 °C warming limits over East-Central Asia. Clim. Change 2020, 162, 603–619. [Google Scholar] [CrossRef]
  5. Lu, S.; Hu, Z.; Yu, H.; Fan, W.; Fu, C.; Wu, D. Changes of extreme precipitation and its associated mechanisms in Northwest China. Adv. Atmos. Sci. 2021, 38, 1665–1681. [Google Scholar] [CrossRef]
  6. Zhang, Z.; Kang, J.; Wang, S.; Zuo, H.; Wei, G. Atmospheric Circulation and Water Vapor Characteristics of the Precipitation Anomaly in Eastern Part of Northwest China. Desert Oasis Meteorol. 2019, 13, 87–92. [Google Scholar] [CrossRef]
  7. Yang, J.; Jin, R.; Liu, X. Inter-seasonal distribution pattern of rainy season precipitation in the east region of northwest China. Arid. Land Geogr. 2017, 40, 21–29. [Google Scholar] [CrossRef]
  8. Zhang, Q.; Lin, J.; Liu, W.; Han, L. Precipitation seesaw phenomenon and its formation mechanism in the eastern and western parts of Northwest China during flood season. Sci. China Earth Sci. 2019, 62, 2083–2098. [Google Scholar] [CrossRef]
  9. Zhu, X.; Sun, Y.; Tan, Z.; Liu, J. The Variation Characteristics of Somali Cross-Equatorial Flow (SML) and Its Impact on Summer Precipitation in the East of Northwest China. Desert Oasis Meteorol. 2019, 13, 7–12. [Google Scholar] [CrossRef]
  10. Xu, D.; Kong, Y.; Wang, C. Changes of Water Vapor Budget in Arid Area of Northwest China and Its Relationship with Precipitation. J. Arid. Meteorol. 2016, 34, 431–439. [Google Scholar]
  11. Fan, G.; Cheng, G. Reason Analysis of the Influence of Qinghai-Xizang Plateau Uplifting on Arid Climate Forming in Northwest China (I): Influence on General Circulation of Atmosphere. Plateau Meteorol. 2003, 22, 45–57. [Google Scholar]
  12. Fan, G.; Cheng, G. Simulation of Influence of Qinghai-Xizang Plateau Uplifting on NW China Arid Climate Forming (II):Changing of atmosphere hydrological cycle and Dynamical and Thermal Effects of Plateau. Plateau Meteorol. 2003, 22, 58–66. [Google Scholar]
  13. Xia, X.; Ren, R.; Wu, G. An analysis on the spatio-temporal variations and dynamic effects of the tropopause and the related stratosphere-troposphere coupling surrounding the Tibetan Plateau area. Acta Meteorol. Sin. 2016, 74, 525–541. [Google Scholar]
  14. Ren, G.; Yuan, Y.; Liu, Y.; Ren, Y.; Wang, T.; Ren, X. Changes in Precipitation over Northwest China. Arid. Zone Res. 2016, 33, 1–19. [Google Scholar] [CrossRef]
  15. Shi, Y.; Shen, Y.; Li, D.; Zhang, G.; Ding, Y.; Hu, R.; Kang, E. Discussion on the present climate change from warm-dry to warm-wet in northwest china. Quat. Sci. 2003, 23, 152–164. [Google Scholar]
  16. Yang, B.; Qin, C.; Wang, J.; Min, H.; Melvin, T.M.; Osborn, T.J.; Briffa, K.R. A 3500-year tree-ring record of annual precipitation on the northeastern Tibetan Plateau. Proc. Natl. Acad. Sci. USA 2014, 111, 2903–2908. [Google Scholar] [CrossRef] [PubMed] [Green Version]
  17. Shi, Y.; Yao, T.; Yang, B. Decadal climatic variations recorded in Guliya ice core and comparison with historical documentary data from East China during the last 2000 years. Sci. China Ser. D 1999, 42, 303–312. [Google Scholar] [CrossRef]
  18. Shi, Y.; Shen, Y. Signal, Impact and Outlook of Climatic Shift from Warm-Dry to Warm- Humid in Northwest China. Sci. Technol. Rev. 2003, 2, 54–57. [Google Scholar]
  19. Zhang, Q.; Zhu, B.; Yang, J.; Ma, P.; Liu, X.; Lu, G.; Wang, Y.; Yu, H.; Wang, D.; Liu, W. New characteristics about the climate humidification trend in Northwest China. Chin. Sci. Bull. 2021, 66, 3757–3771. [Google Scholar] [CrossRef]
  20. Hulme, M. Recent climatic change in the world’s drylands. Geophys. Res. Lett. 1996, 23, 61–64. [Google Scholar] [CrossRef]
  21. Allen, R.J.; Anderson, R.G. 21st century California drought risk linked to model fidelity of the El Niño teleconnection. Clim. Atmos. Sci. 2018, 1, 21. [Google Scholar] [CrossRef]
  22. Huang, J.; Li, Y.; Fu, C.; Chen, F.; Fu, Q.; Dai, A.; Shinoda, M.; Ma, Z.; Guo, W.; Li, Z.; et al. Dryland climate change: Recent progress and challenges. Rev. Geophys. 2017, 55, 719–778. [Google Scholar] [CrossRef]
  23. Greve, P.; Orlowsky, B.; Mueller, B.; Sheffield, J.; Reichstein, M.; Seneviratne, S. Global assessment of trends in wetting and drying over land. Nat. Geosci. 2014, 7, 716–721. [Google Scholar] [CrossRef]
  24. Trenberth, K.E.; Dai, A.; van der Schrier, G. Global warming and changes in drought. Nat. Clim. Change 2014, 4, 17–22. [Google Scholar] [CrossRef]
  25. Mishra, A.K.; Singh, V.P. A review of drought concepts. J. Hydrol. 2010, 391, 202–216. [Google Scholar] [CrossRef]
  26. Dai, A.; Zhao, T. Uncertainties in historical changes and future projections of drought. Part I: Estimates of historical drought changes. Clim. Change 2016, 144, 519–533. [Google Scholar] [CrossRef]
  27. Prudhomme, C.; Giuntoli, I.; Robinson, E.L.; Clark, D.B.; Arnell, N.W.; Dankers, R.; Fekete, B.M.; Franssen, W.; Gerten, D.; Gosling, S.N. Hydrological droughts in the 21st century, hotspots and uncertainties from a global multimodel ensemble experiment. Proc. Natl. Acad. Sci. USA 2013, 111, 3262–3267. [Google Scholar] [CrossRef] [PubMed] [Green Version]
  28. Zhang, Q.; Zhang, L.; Huang, J.; Zhang, L.; Wang, W.; Sha, S. Spatial distribution of surface energy fluxes over the Loess Plateau in China and its relationship with climate and the environment. Sci. China Earth Sci. 2014, 57, 2135–2147. [Google Scholar] [CrossRef]
  29. Sentelhas, P.C.; Gillespie, T.J.; Santos, E.A. Evaluation of FAO Penman-Monteith and alternative methods for estimating reference evapotranspiration with missing data in Southern Ontario, Canada. Agric. Water Manag. 2010, 97, 635–644. [Google Scholar] [CrossRef]
  30. Ma, Z.; Hua, L.; Ren, X. The extreme dry/wet events in northern China During Recent 100 years. Acta Geogr. Sin. 2003, 58, 69–74. [Google Scholar]
  31. Shahzada, A.; Kalim, U.; Azmat, H.; Gao, S. Meteorological impacts on evapotranspiration in different climatic zones of Pakistan. J.Arid Land 2017, 9, 938–952. [Google Scholar]
  32. Moran, M.S.; Rahman, A.F.; Washburne, J.C.; Goodrich, D.C.; Weltz, M.A.; Kustas, W.P. Combining the Penman-Monteith equation with measurements of surface temperature and reflectance to estimate evaporation rates of semiarid grassland. Agric. For. Meteorol. 1996, 80, 87–109. [Google Scholar] [CrossRef]
  33. Langensiepen, M.; Fuchs, M.; Bergamaschi, H.; Moreshet, S.; Cohen, Y.; Wolff, P.; Jutzi, S.C.; Cohen, S.; Rosa, L.M.G.; Yan, L.; et al. Quantifying the uncertainties of transpiration calculations with the Penman-Monteith equation under different climate and optimum water supply conditions. Agric. For. Meteorol. 2009, 149, 1063–1072. [Google Scholar] [CrossRef]
  34. Zhou, X.; Zhu, Q.; Sun, Z.; Sun, R. Preliminary study on regionalization desertification climate in China. J. Nat. Disasters 2002, 11, 125–131. [Google Scholar]
  35. Yu, Z.; Zhou, W.; Zhang, X. An Attribution Analysis Of Changes In Potential Evapotranspiration In The Beijing-Tianjin-Hebei Region Under Climate Change. J. Trop. Meteorol. 2019, 25, 82–91. [Google Scholar]
  36. Gao, Y.; Zhao, C.; Muhammad, W.; Ashiq, M.; Wang, Q.; Rong, Z.; Liu, J.; Mao, Y.; Guo, Z.; Wang, W. Actual evapotranspiration of subalpine meadows in the Qilian Mountains, Northwest China. J. Arid Land 2019, 11, 371–384. [Google Scholar] [CrossRef] [Green Version]
  37. Cao, W.; Shen, S.; Duan, C. Temporal-spatial variations of potential evapotranspiration and quantification of the causes in Northwest China. Acta Ecol. Sin. 2012, 32, 3394–3403. [Google Scholar] [CrossRef]
  38. Huang, X.; Zhang, M.; Jia, W.; Wang, S.; Zhang, N. Variations of surface humidity and its influential factors in Northwest China. Adv. Water Sci. 2011, 22, 151–159. [Google Scholar] [CrossRef]
  39. Zhang, Q.; Wang, W.; Wang, S.; Zhang, L. Increasing Trend of Pan Evaporation over the Semiarid Loess Plateau under a Warming Climate. J. Appl. Meteorol. Climatol. 2008, 55, 2007–2020. [Google Scholar] [CrossRef]
  40. Yang, S.; Zhang, Q.; Xi, X.; Qiao, L. Comparative analysis of pan evaporation trends between the summer monsoon transition region and other regions of China. Plateau Meteorol. 2018, 37, 1017–1024. [Google Scholar] [CrossRef]
  41. Li, Q.; Dong, W.; Li, W.; Gao, X.; Jones, P.; Kennedy, J.; Parker, D. Assessment of the uncertainties in temperature change in China during the lastcentury. China Sci. Bull 2010, 55, 1544–1554. (In Chinese) [Google Scholar]
  42. Yang, S.; Li, Q. Improvement in homogeneity analysis method and updata of China precipitation data. Clim. Change Res. 2014, 10, 276–281. (In Chinese) [Google Scholar]
  43. Cai, J.; Liu, Y.; Lei, T.; Luis, S. Estimating reference evapotranspiration with the FAO Penman–Monteith equation using daily weather forecast messages. Agric. For. Meteorol. 2007, 145, 22–35. [Google Scholar] [CrossRef]
  44. The State Standard of the People’s Republic of China; Classification of meteorological drought (GB/T 20481-2017); Standards Press of China: Beijing, China, 2017.
  45. Gao, G.; Chen, D.; Ren, G.; Chen, Y.; Liao, Y. Trend of potential evapotranspiration over China during 1956 to 2000. Geogr. Res. 2006, 25, 378–387. [Google Scholar]
  46. Fu, Q.; Feng, S. Responses of terrestrial aridity to global warming. J. Geophys. Res. Atmos. 2014, 119, 7863–7875. [Google Scholar] [CrossRef]
  47. Tang, H.; Zhai, P.; Wang, Z. On Change in Mean Maximum Temperature, Minimum Temperature and Diurnal Range in China During 1951–2002. Clim. Environ. Res. 2005, 10, 728–735. [Google Scholar]
  48. Wang, L.; Xie, X.; Su, W.; Guo, X. Changes of maximum and minimum temperature and their impacts in northern China over the second half of the 20th century. J. Nat. Resour. 2004, 19, 337–343. [Google Scholar]
  49. Huang, J.; Zhang, W.; Zuo, J.; Bi, J.; Shi, J.; Wang, X.; Chang, Z.; Huang, Z.; Yang, S.; Zhang, B. An overview of the semi-arid climate and environment research observatory over the Loess Plateau. Adv. Atmos. Sci. 2008, 25, 906–921. [Google Scholar] [CrossRef]
  50. Zhang, Q.; Qiao, L.; Yue, P.; Li, Y. The energy mechanism controlling the continuous development of a super-thick atmospheric convective boundary layer during continuous summer sunny periods in an arid area. Chin. Sci. Bull. 2019, 64, 1637–1650. (In Chinese) [Google Scholar] [CrossRef] [Green Version]
  51. Zhao, J.; Zhang, Q.; Wang, S. A simulative study of the thermal mechanism for development of the convective boundary layer in the arid zone of northwest China. Acta Meteorol. Sinica 2011, 69, 1029–1037. [Google Scholar]
  52. Zhang, Q.; Zhao, Y.; Wang, S.; Ma, F. A study on atmospheric thermal boundary layer structure in extremely arid desert and gobi region on the clearday in summer. Adv. Earth Sci. 2007, 22, 1150–1159. (In Chinese) [Google Scholar]
  53. Yao, T.; Xue, Y.; Chen, D.; Chen, F.; Thompson, L.; Cui, P.; Koike, T.; Lau, K.; Lettenmaier, D.; Mosbrugger, V. Recent Third Pole’s rapid warming accompanies cryospheric melt and water cycle intensification and interactions between monsoon and environment: Multidisciplinary approach with observations, modeling, and analysis. Bull. Am. Meteorol. Soc. 2019, 100, 423–444. [Google Scholar] [CrossRef]
  54. Tang, Q.; Lan, C.; Su, F.; Liu, X.; Sun, H.; Ding, J.; Wang, L.; Leng, G.; Zhang, Y.; Sang, Y. Streamflow change on the Qinghai-Tibet Plateau and its impacts. Chin. Sci. Bull. 2019, 64, 2807–2821. [Google Scholar]
  55. Sun, M.; Liu, S.; Yao, X.; Guo, W.; Xu, J. Glacier changes in the Qilian Mountains in the past half-century: Based on the revised First and Second Chinese Glacier Inventory. J. Geogr. Sci. 2018, 28, 206–220. [Google Scholar] [CrossRef] [Green Version]
  56. Ding, Y.; Liu, S.; Li, J.; Shangguan, D. The retreat of glaciers in response to recent climate warming in western China. Ann. Glaciol. 2006, 43, 97–105. [Google Scholar] [CrossRef] [Green Version]
  57. Kang, S.; Guo, W.; Wu, T.; Zhong, X.; Chen, R.; Xu, M.; Chen, J.; Yang, R. Cryo-spheric changes and their impacts on water resources in the Beltand Road Regions. Adv. Earth Sci. 2020, 35, 1–17. [Google Scholar]
  58. Ding, Y. Climate Change Research over China-Science, Impact, Adaptation and Strategy Policy, 1st ed.; China Environmental Press: Beijing, China, 2009; pp. 90–91. [Google Scholar]
  59. Wang, K.; Jiang, H.; Zhao, H. Atmospheric water vapor transport from westerly and monsoon over the Northwest China. Adv. Water Sci. 2005, 16, 432–438. (In Chinese) [Google Scholar]
  60. Wang, H.; Fan, K. Recent changes in the East Asian monsoon. Chin. J. Atmos. Sci. 2013, 37, 313–318. (In Chinese) [Google Scholar]
  61. Fang, G.; Li, X.; Xu, M.; Wen, X.; Huang, X. Spatiotemporal Variability of Drought and Its Multi-Scale Linkages with Climate Indices in the Huaihe River Basin, Central China and East China. Atmosphere 2021, 12, 1446. [Google Scholar] [CrossRef]
  62. Zhang, Q. Scientific View of the Phenomenon of Warming and Humidification in the Northwest. China Meteorological News, 15 January 2020. [Google Scholar]
  63. Wang, C.; Zhang, S.; Zhang, F.; Li, K.; Yang, K. On the increase of precipitation in the Northwestern China under the global warming. Adv. Earth Sci. 2021, 36, 980–989. [Google Scholar] [CrossRef]
  64. Ghaderpour, E. Least-squares Wavelet and Cross-wavelet Analyses of VLBI Baseline Length and Temperature Time Series: Fortaleza–Hartebeesthoek–Westford–Wettzell. Publ. Astron. Soc. Pacifific 2021, 133, 014502. [Google Scholar] [CrossRef]
Figure 1. Locations of weather stations and climate zoning within the research region.
Atmosphere 13 00353 g001
Figure 2. Spatial distribution of annual average PET in Northwest China from 1961 to 2019 (mm·a−1).
Atmosphere 13 00353 g002
Figure 3. Spatial distribution of PET trend coefficient in Northwest China from 1961 to 2019 (a) and four climatic periods: 1961–1990 (b), 1971–2000 (c), 1981–2010 (d), 1991–2019 (e).
Atmosphere 13 00353 g003aAtmosphere 13 00353 g003b
Figure 4. Normal distribution of PET climate trend coefficient in Northwest China from 1961 to 2019 and in each climatic period.
Atmosphere 13 00353 g004
Figure 5. Relationship between climate trend coefficient of PET and altitude in Northwest China.
Atmosphere 13 00353 g005
Figure 6. PET changes due to highest and lowest temperatures in Northwest China (a), highest temperature (b), lowest temperature (c), and decadal temperature changes (d) (each figure is the 10-year average minus the 1961–1970 average).
Atmosphere 13 00353 g006aAtmosphere 13 00353 g006b
Figure 7. PET changes due to relative humidity in Northwest China (a), relative humidity (b), and decadalprecipitation changes (c) (each figure is the 10-year average minus the 1961–1970 average).
Atmosphere 13 00353 g007
Figure 8. PET changes due to sunshine duration in Northwest China (a), sunshine duration decadal changes (b) (each figure is the10-year average minus the 1961–1970 average).
Atmosphere 13 00353 g008
Figure 9. PET changes due to wind speed in Northwest China (a), wind speed decadal changes (b) (each figure is the10-year average minus the 1961–1970 average).
Atmosphere 13 00353 g009
Figure 10. Decadal changes in actual PET in Northwest China (decadal average minus the average of the reference period, 1961–1970).
Atmosphere 13 00353 g010
Figure 11. Contribution of temperature (a), humidity (b), sunshine duration (c), and wind speed (d) to PET in Northwest China (%).
Atmosphere 13 00353 g011aAtmosphere 13 00353 g011b
Figure 12. Spatial distribution of difference in PET between 2010–2019 and 1961–1970 in Northwest China ((a) is the actual difference and (b) is the result from multifactor analysis).
Atmosphere 13 00353 g012
Table 1. Ten-year average of meteorological elements and PET in Northwest China (1961–1970).
Tmax (°C)Tmin (°C)Relative Humidity (%)Sunshine Duration (h)Wind (m/s)PET (mm·a−1)T (°C)P (mm·a−1)
Humid18.929.0176.151646.231.93899.1013.341038.18
Semi humid16.085.4168.562053.381.99899.9410.15746.62
Semi-arid13.341.1361.832481.712.4918.706.64481.56
Arid14.100.3349.702974.1531126.796.87124.18
* The regional overall14.662.4460.312488.572.48984.348.03462.35
* Each value is calculated directly from the observation data of the weather station, not from the table.
Table 2. Response of PET to metrological elements in Northwest China.
Major Cimatic Zones AffectedRegional Global Variation
Tmax, TminArid, semi-arid regionsIncreasing rapidly since the 1990′s
Relative humidityHumid area, subhumid areaDeclined markedly since the 1970′s and increased rapidly since the 1980′s
Sunshine durationHumid area, subhumid areaThe decrease was obvious in humid and semi humid areas, while the change was not obvious in other climate areas
Wind speedArid, humid areasAll climatic regions have been decreasing since the 1980s, the regional overall declined markedly
Publisher’s Note: MDPI stays neutral with regard to jurisdictional claims in published maps and institutional affiliations.

