Article

Multiparametric Sensor Node for Environmental Monitoring Based on Energy Harvesting

1
Department of Information Engineering (DII), University of Brescia, 25123 Brescia, Italy
2
Department of Electrical Engineering (DEE), Qatar University, Doha 2713, Qatar
*
Author to whom correspondence should be addressed.
Atmosphere 2022, 13(2), 321; https://doi.org/10.3390/atmos13020321
Submission received: 11 January 2022 / Revised: 1 February 2022 / Accepted: 11 February 2022 / Published: 15 February 2022
(This article belongs to the Section Atmospheric Techniques, Instruments, and Modeling)

Abstract

:
The heterogeneity and levels of chemicals released into the environment have dramatically grown in the last few years. Therefore, new low-cost tools are increasingly required to monitor pollution and follow its trends over time. Recent approaches in electronics and wireless communications permit the expansion of low-power, low-cost, and multiparametric sensor nodes that are limited in size and communicate untethered in small distances. For such a monitoring system to be ultimately feasible, a suitable power source for these nodes must be found. The present research falls within the frame of this global effort. The study sits within the context discussed above with the particular aim of developing groundbreaking technology-based solutions by means of efficient environmentally powered wireless smart sensors. This paper presents a multiparametric sensor node for indoor/outdoor air quality monitoring, able to work without battery and human intervention, harvesting energy from the surrounding environment for perpetual operation. The complete system design of the sensor and experimental results are reported. The evaluation of the energy-harvesting blocks with a budget allocation of the power consumption is also discussed.

1. Introduction

The link between poor air quality and a number of health diseases was proven in some recent studies [1,2,3,4,5]. The requirements for adequate air-pollutant-monitoring systems that are able to enhance reliability and data availability where traditional monitoring systems are difficult to deploy have led to the design of diverse autonomous structures able to measure outdoor and indoor air quality. Focusing on the process of improving air quality (e.g., HVAC systems, air sanitation, air cleaning), the paramount goal is to correctly identify pollutants present in the air and to define the polluted locations to provide proper remedies. Advances in low-power electronics and new affordable electrochemical sensors linked to low-power wireless techniques have allowed for the improvement of highly efficient, cheap, and low-power water and air quality monitoring systems (devoted to specific target gases), and their distribution in real environments [6,7,8,9,10,11,12,13,14,15,16,17,18,19]. Advances in wireless networking technologies enabled a reduction in installation difficulties and costs, and allowed for the rapid deployment, and the remote and easy reconfiguration of air quality monitoring systems. Low-cost autonomous monitoring systems that are able to operate in any kind of environment, especially in harsh and disruptive ones, are urgently needed for monitoring air quality while reducing human intervention.
Six different examples of existing air quality monitoring systems are briefly summarized below.
Alhmiedat et al. [20] proposed a wireless sensor network architecture to monitor indoor air quality. Four sensor nodes have been used to collect data for more than four weeks. Data were further transferred for analysis via a ZigBee communication protocol. Although more development is needed, with the aim to reduce power consumption and improving the accuracy of monitored parameters.
Wong et al. [21] presented a mobile microscopy together with machine learning algorithms to perform analysis of PM. The module was capable of measuring the particle size with the sizing accuracy of approximately 93%. Shortcomings of the prosed systems are dimensions and power consumption.
Cardinali et al. [22] designed a system with an electronic nose built around the solid-state sensor array. By adopting a combination of pattern recognition techniques, researchers targeted the analysis of VOCs, RH, CO, and NOx. Long-term stability of solid-state gas sensors was a primary concern.
Kim et al. [23] developed a specific platform with seven gases (CO2, VOCs, SO2, NOx, CO, PM, and ozone) to test air pollution in real time. The empiric evidence showed that the proposed sensors featured a high power consumption. Consequently, critical thinking for the selection of appropriate sensor nodes becomes paramount.
Touati et al. [24] proposed an end-to-end air quality monitoring system adopting WSN technology. It was dedicated to RH, Cl2, O3, NO2, and SO2 monitoring. The sensing nodes were made to send data to the gateway via XBee PRO radio modules. Improvement is needed on environmental settings and sensor performances to ensure reliable calibration of the system.
Esfahani et al. [25] focused on the development of a portable environment monitoring system. This study was dedicated to air pollutants such as CO, CO2, VOCs, PM10, and temperature. An Indoor Environment Quality (IEQ) index to estimate the overall percentage of IEQ has been proposed. With the aim of meeting power requirements, authors also designed separate battery units for the sensor network.
As reported above, the primary problem for the installation of wireless sensing nodes is that they require high power efficiency for continuous operation. If nodes are battery-operated, the costs of battery replacement make such systems too expensive to be deployed in wide areas and harsh environments. The design of autonomous monitoring systems relies on “set and forget” scenarios, where minimal or no human intervention is needed. This is the system design we propose in this paper.

2. System Configuration

The proposed system (SERENO, SEnsor REceiver NOde) is portrayed in Figure 1a–c, in which the most important blocks are shown (Figure 1a is related to the power harvesting subsystems, Figure 1b are the blocks depicting the six gas sensors operating on the PCB board, and Figure 1c shows photographs of the realized prototypes). We describe each section below.

2.1. Air Quality Sensors

The main feature of the described system is having an array of gas sensors that can measure the most important pollutants present in the air.
Different types of gas sensors are reported in the literature were examples of advantages and disadvantages are discussed:
-
Electrochemical gas sensors [26,27,28,29];
-
Catalytic gas sensors [30,31];
-
Thermal conductivity gas sensor [32,33];
-
Optical gas sensor [34,35];
-
Infrared gas sensor [36];
-
Semiconductor gas sensor [37,38].
The above investigation on the products present on the market has led to selecting electrochemical gas sensors as a reasonably good and beneficial choice of technology. They exhibit low power consumption (e.g., solid-state sensors require high power consumption because they rely on a heater to regulate the temperature of the metal oxide semiconductor film), small package size (e.g., infrared gas sensors have dimensions three times bigger), and fast response to the target gas (e.g., thermal conductivity type gas sensors have a narrow application range and long stabilization times). Other parameters such as low temperature drift and good cross-sensitivity to other gas elements have been considered. Many manufacturers have a wide electrochemical gas sensor portfolio. The main differentiation factors among them consist of the cost, target gases (cross-sensitivity behavior), and resolution of each sensor in terms of parts per billion (ppb) of gas concentration, satisfying European Environmental Agency (EEA) and Environmental Protection Agency (EPA) requirements. These kinds of sensors do not require any kind of power source, so they are well-suited for low-power applications where wireless nodes are powered by ambient energy. The designed sensor platform is based on the following electrochemical cells: ammonia (NH3), nitrogen dioxide (NO2), carbon monoxide (CO), hydrogen sulfide (H2S), nitrogen monoxide (NO), and chlorine (Cl2) sensors all from Nemoto Sensor Engineering Co., Ltd. Sensirion SHT21 temperature and humidity sensors were also adopted with the aim to compensate thermal drift in electrochemical sensors. A tailored algorithm to reduce the drift during measurement processes was adopted.

2.2. Power Harvesting Section

The designed single board consisted of six gas sensors, temperature and humidity sensors, and a wireless transmission module with a microcontroller on board. With regards to the type of targeted applications, whether using a conventional lithium battery or using a solid-state battery, it is important to define the energy consumption and employed management models so as to ensure either extended battery power longevity or an autonomous energy source (“set and forget” scenario). In the present paper, we focus on the following energy sources (refer to Figure 1a), possibly activated together depending on the deployment conditions:
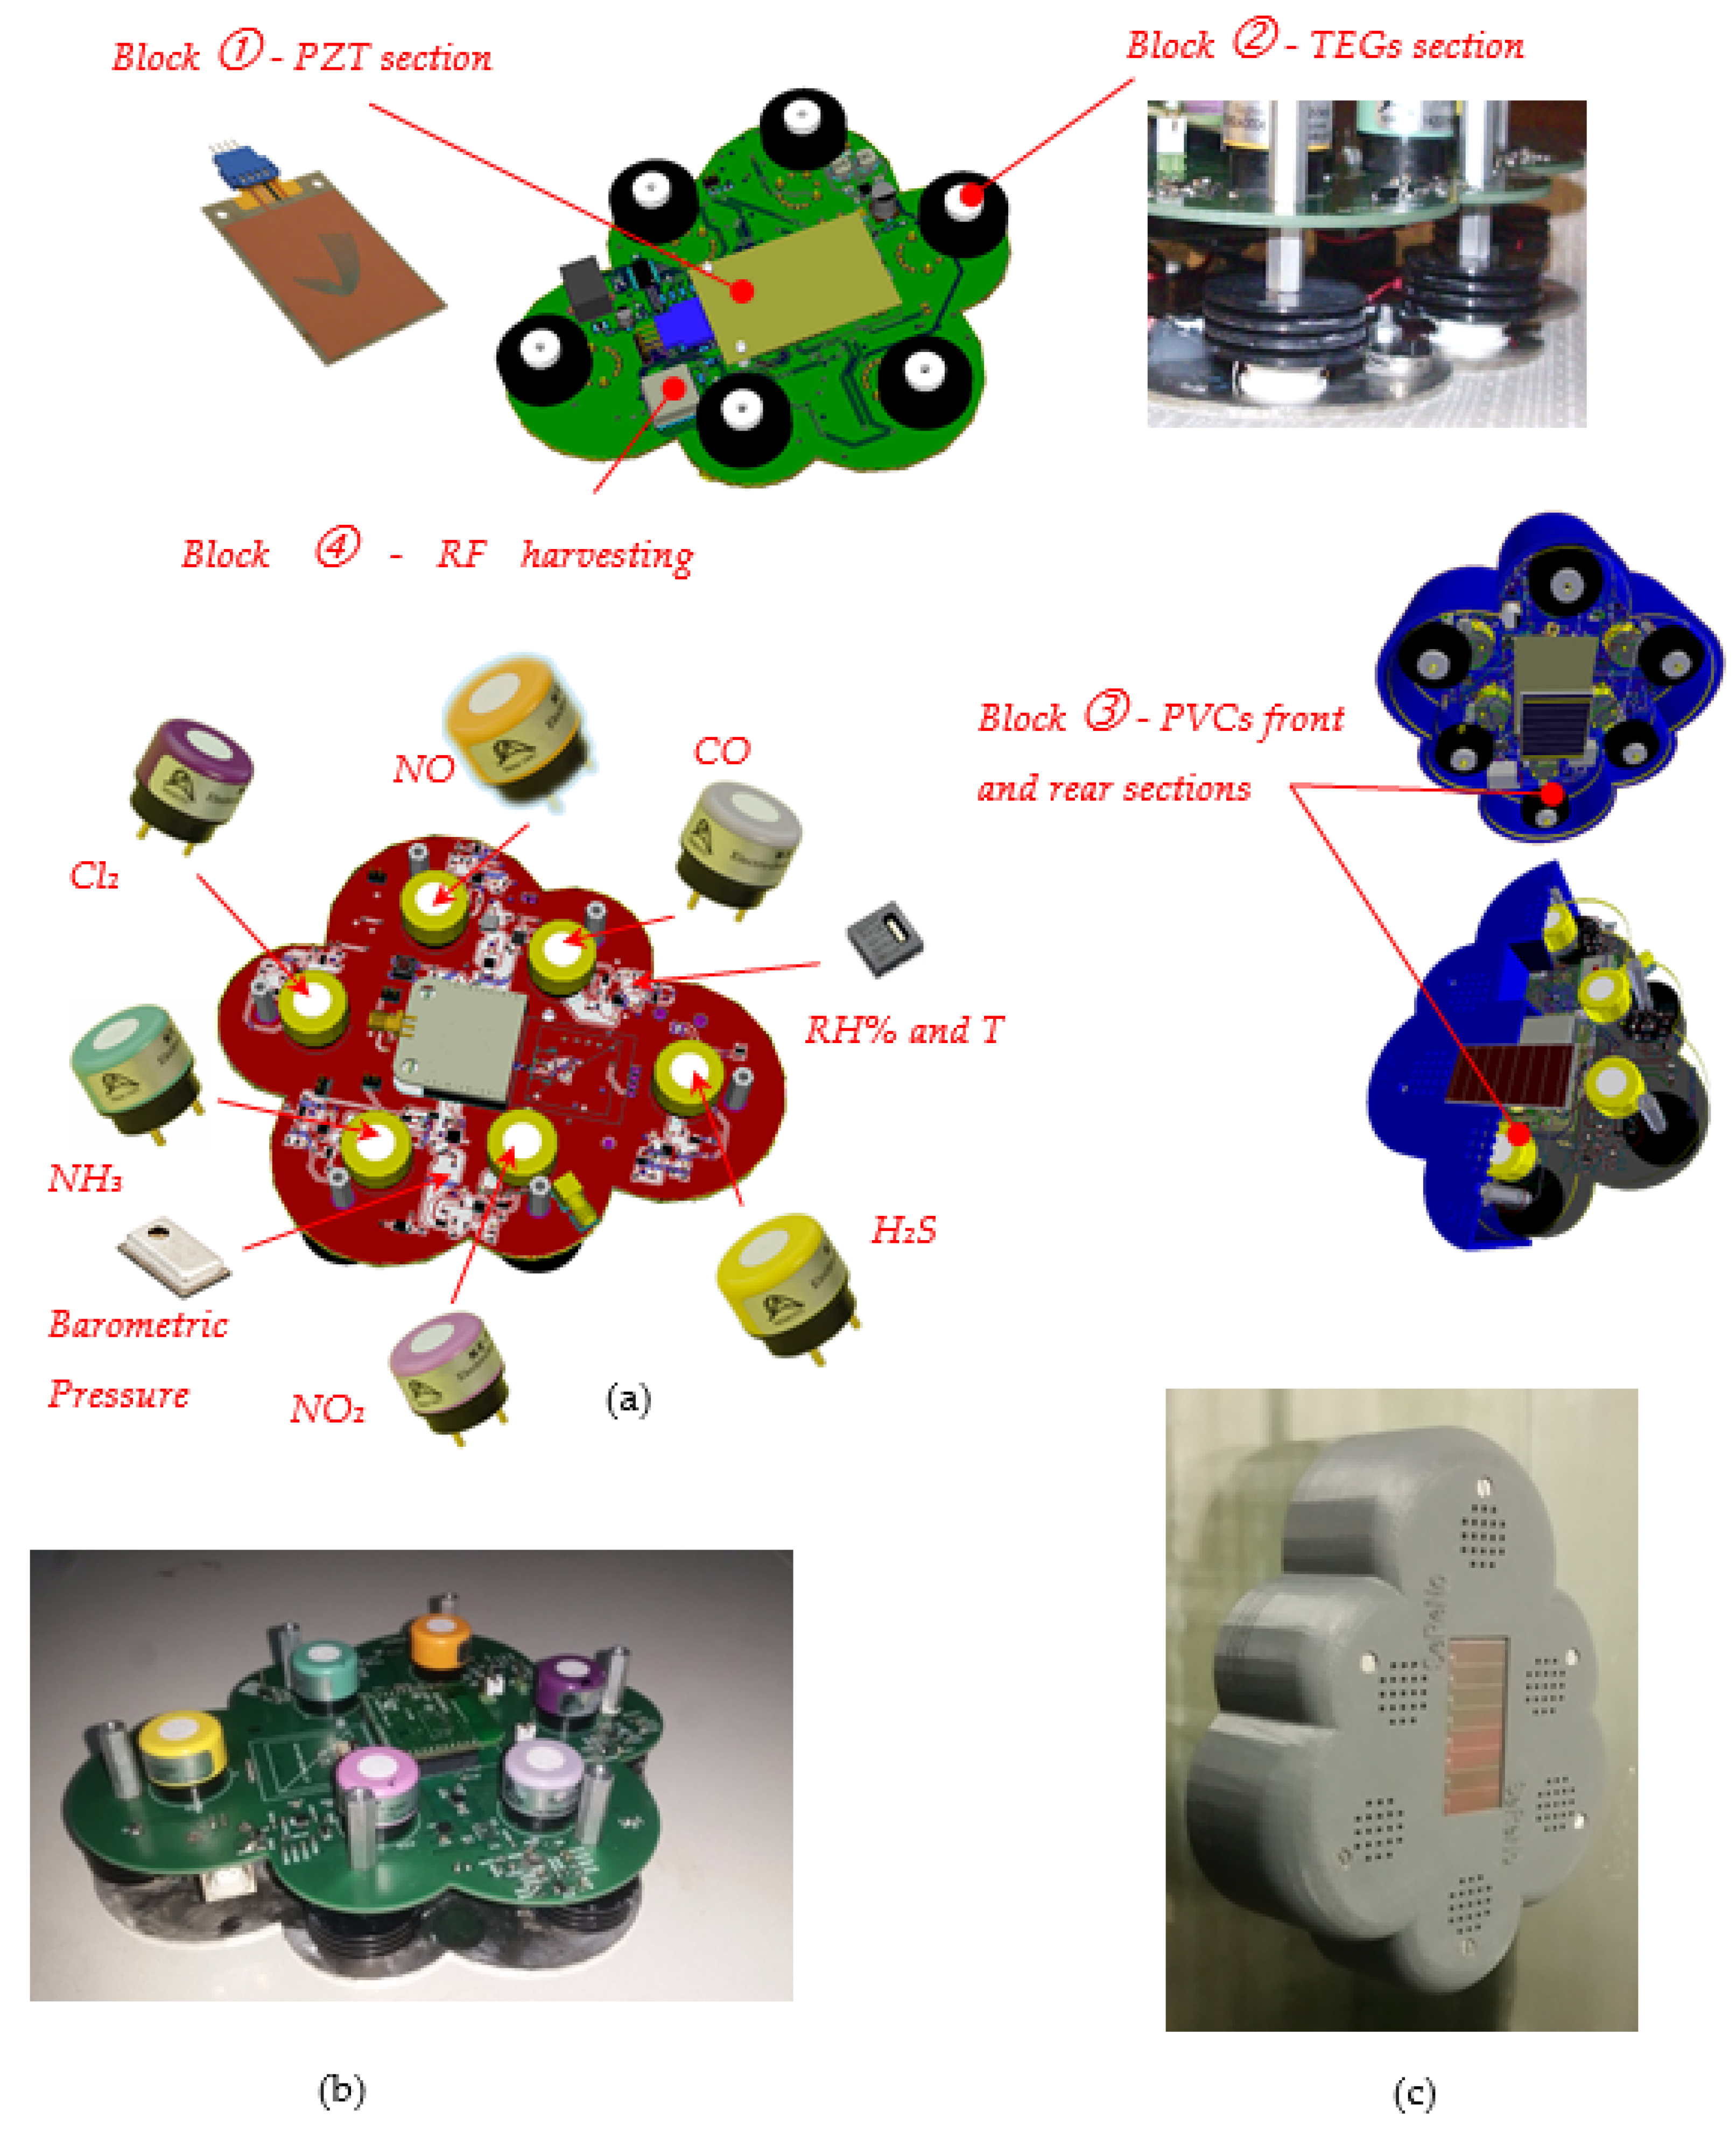
  • A vibration energy harvester (Block ①) devoted to the transformation of otherwise wasted energy from oscillations into usable electric energy. The PZT-based electromechanical resonator was installed in a custom-fit configuration. The goal of this configuration was matching the natural frequency of the harvester with the vibration sources.
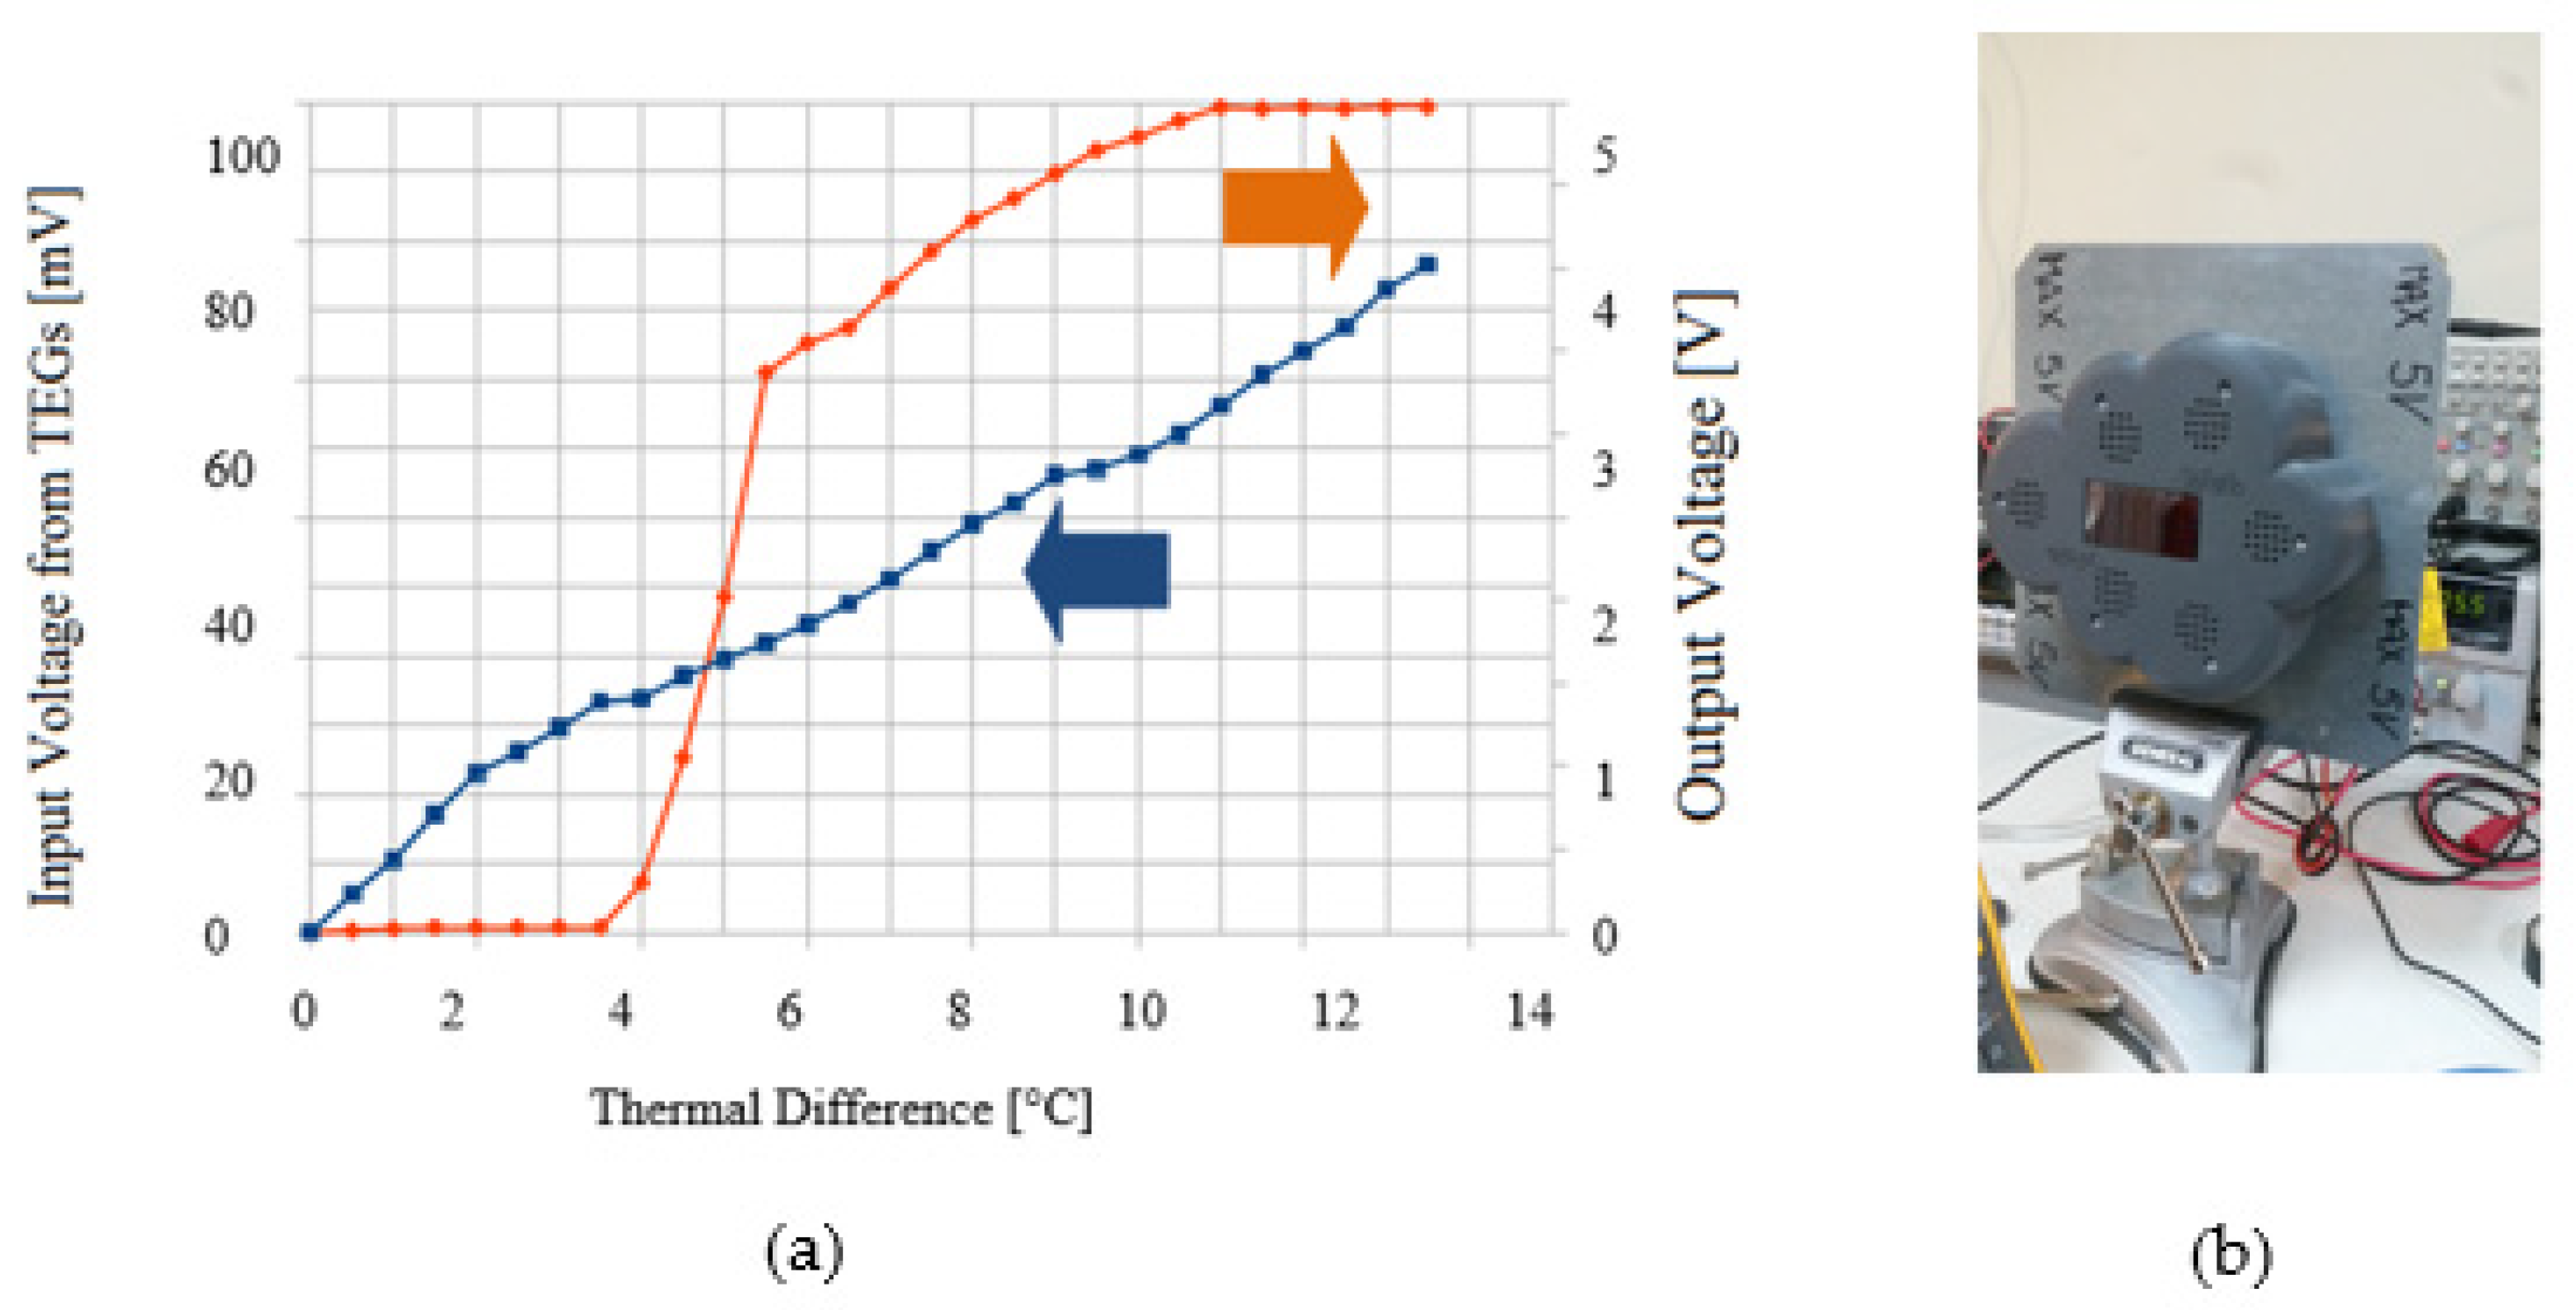
  • Six TEGs generators (Block ②) with highly efficient thermoelectric effect and 17 N&P stacks for each one. An example of peak power generated with a temperature gradient of 15 °C is ≅0.5 mW.
  • One thin-film amorphous silicon solar cell (Block ③ front section) as an energy source for indoor artificial light energy harvesting with power density of 0.042 μW/mm2 @ 200 Lux (reference number AM-1801 from Sanyo semiconductor). The current/voltage ratio under this illumination level was 18.5 μA @ 3.0 Vdc.
  • One (through window) thin-film amorphous silicon solar cell (Block ③ rear section) as an energy source for OUTDOOR solar harvesting with power density of 1 μW/mm2 @ 50 kLux (reference number AM-5904 from SANYO semiconductor). The current/voltage ratio under this illumination level was 4.5 mA @ 5.0 Vdc.
  • One RF power source at 915 MHz (Block ④) based on the Powercast P2110 harvester receiver and RF to DC converter. This module features high efficiency and ultralow power consumption.
As the energy harvesting module, the highly efficient, autopolarity, and ultralow voltage step-up converter LTC3109 was used. This integrated circuit is excellent for power harvesting applications with low-input voltage sources, such as a TEG section. The DC/DC converter uses two miniature external 1:100 transformers with the aim to build an ultralow-input voltage step-up converter. Autopolarity topology enables energy harvesting from TEGs in operations where temperature gradients across the TEG are unknown (i.e., unidentified polarity). This function applies to the case of a SERENO stacked on a window when differences between outside climate temperatures (i.e., high heat produced during the summer season) and indoor temperature (i.e., air-conditioned rooms) can be used as a source of energy harvesting. Another application is the case of SERENO attached to a vending coffee machine or an automatic distributor machine, where the temperature gradient between one side of the machine and the environment temperature could be used to harvest energy and empower a SERENO. The primary task of the energy section is to provide a constant supply to the system that exhibits low average power drainage thanks to the specific power-saving designs adopted in SERENO nodes. However, periodic pulses of high current are required to carry out regular cycles of measurement and transmissions. The system shows a quiescent and extremely low power draw most of the time, while the real energy consumption happens when the system wakes up, performs measurements, and transmits the data. Furthermore, in the design of the SERENO node, we paid particular attention to the RF energy-based harvesting, which can produce a relatively small amount of energy; nevertheless, it exhibited better stability than that of the solar, piezomagnetic, and thermoelectric power sources. The main important frequencies considered in RF harvesting applications are 500 and 900 MHz, and 2.45 GHz.

2.3. The Sensor Board

As stated above, the aim of the present study is batteryless operation. Therefore, a 1 mAh solid-state battery, charged from the energy section at 4.1 Vdc, was used as energy storage. The conditioning circuit of the gas sensors, the digital sensors of temperature and humidity, the microcontroller, and the RF module were powered at 3.3 Vdc. The on-board 10-bit A/D converter (SAR) allows for accurate measurements of the electrochemical sensors. A conditioning circuit for the sensor gases must be used, the signals from sensors are in current, and it must be converted into voltage for the ADC of the microcontroller. Following the datasheet guidelines of the sensors, the conditioning circuit was built using the ST TSU102 operational amplifiers. The main feature that made this component suitable for the designed system is the low power consumption. Supply current was around 600 nA at 3.3 Vdc per channel, and the input bias current of 1 pA maximum is an excellent feature for to use with electrochemical sensors. The input offset voltage of 100 μV maximum with a typical drift of 5 μV/°C only does not affect the response of the sensor gas read by microcontroller at different temperatures. A frequency of 2.4 GHz is used by the wireless transmission system, allowing for more flexibility of the transmission protocol and enabling low power consumption in sleep mode. Very low power single-pole single-throw (SPST) analog switch TS5A3166 with 0.5 µA current consumption from Texas Instrument was used to only power the analog section necessary for the warm-up sensor phase.

2.4. Data Transmission Protocol

Wireless communication over 2.4 GHz is essential to send data to the main controller that gathers the data from the sensors. This is the most power-hungry operation of SERENO tasks. The design of a system able to perform scheduled energy-efficient operations requires that energy is applied to the transmission module only when it is necessary. Moreover, a robust and power-saving transmission protocol is necessary that helps in achieving low consumption in terms of energy ensuring data consistency in noisy environments. To this end, the RF module works with the IEEE 802.15.4 standard that uses the spread spectrum coding technique that is known for its good performance in noisy channels. The IEEE 802.15.4 standard was proposed to support low-cost, low-power devices, and supports scalable mesh topology and lower power consumption.

3. Methods and Results

Four hardware prototypes of SERENO were all mounted and tested to evaluate their functionality in laboratory and in real applications. Each SERENO board was equipped with a harvesting section able to recover energy from the photovoltaic indoor/outdoor solar cell panels, six thermoelectric modules TEGs, a piezoelectric module, and a radio frequency harvester antenna at 915 MHz. All the sources loaded, at the same time, a 1 mAh organic solid-state battery; each test began with an energy level equal to zero. An array of sensors were used that were composed of six electrochemical gas sensors (CO, NO2, NO, NH3, Cl2, H2S), in addition to temperature, humidity, and barometric pressure transducers. Tests were conducted on the prototypes to define the features of the energy harvesting sections and the sensor responses to pollution changes. Tests were conducted in Italy and in Doha (Qatar) in several times periods. Different conditions of pollutions, light emission, vibration levels, temperature gradients, and RF radiation power were examined. First, experiments were conducted on every gas sensor mounted on the board to calibrate the sensor responds to different gases concentration in order to verify repeatability, resolution, reliability, and cross-sensitivity.
The calibration of the gas sensor involved two steps. First, “zero” was defined, and then, “span” was calibrated. There is no established standard that defines “zero” air. We used pure synthetic air to establish the “zero” point. “Span” was calibrated using premixed gas mixtures compressed and stored under pressure cylinders provided with certificates of composition and uncertainty value for each gas concentration. Figure 2a shows the devices under test using calibrated gas cylinders with accurate gas concentrations to check the output signals coming from each electrochemical section.
Sensor boxes were kept inside a Polycontrols gas distributor for automatic gas mass flow control and a climatic chamber for temperature tests. The boards mounting the six sensor arrays were placed inside the chamber; the controlled atmosphere prevented contaminants from affecting the measurements. Electrochemical sensors were tested showing the following sensitivity and response times (T90%):
  • Nemoto NE4–CO electrochemical sensor with a sensitivity of 82 nA/ppm with response time T90% = 28 s (average of six samples);
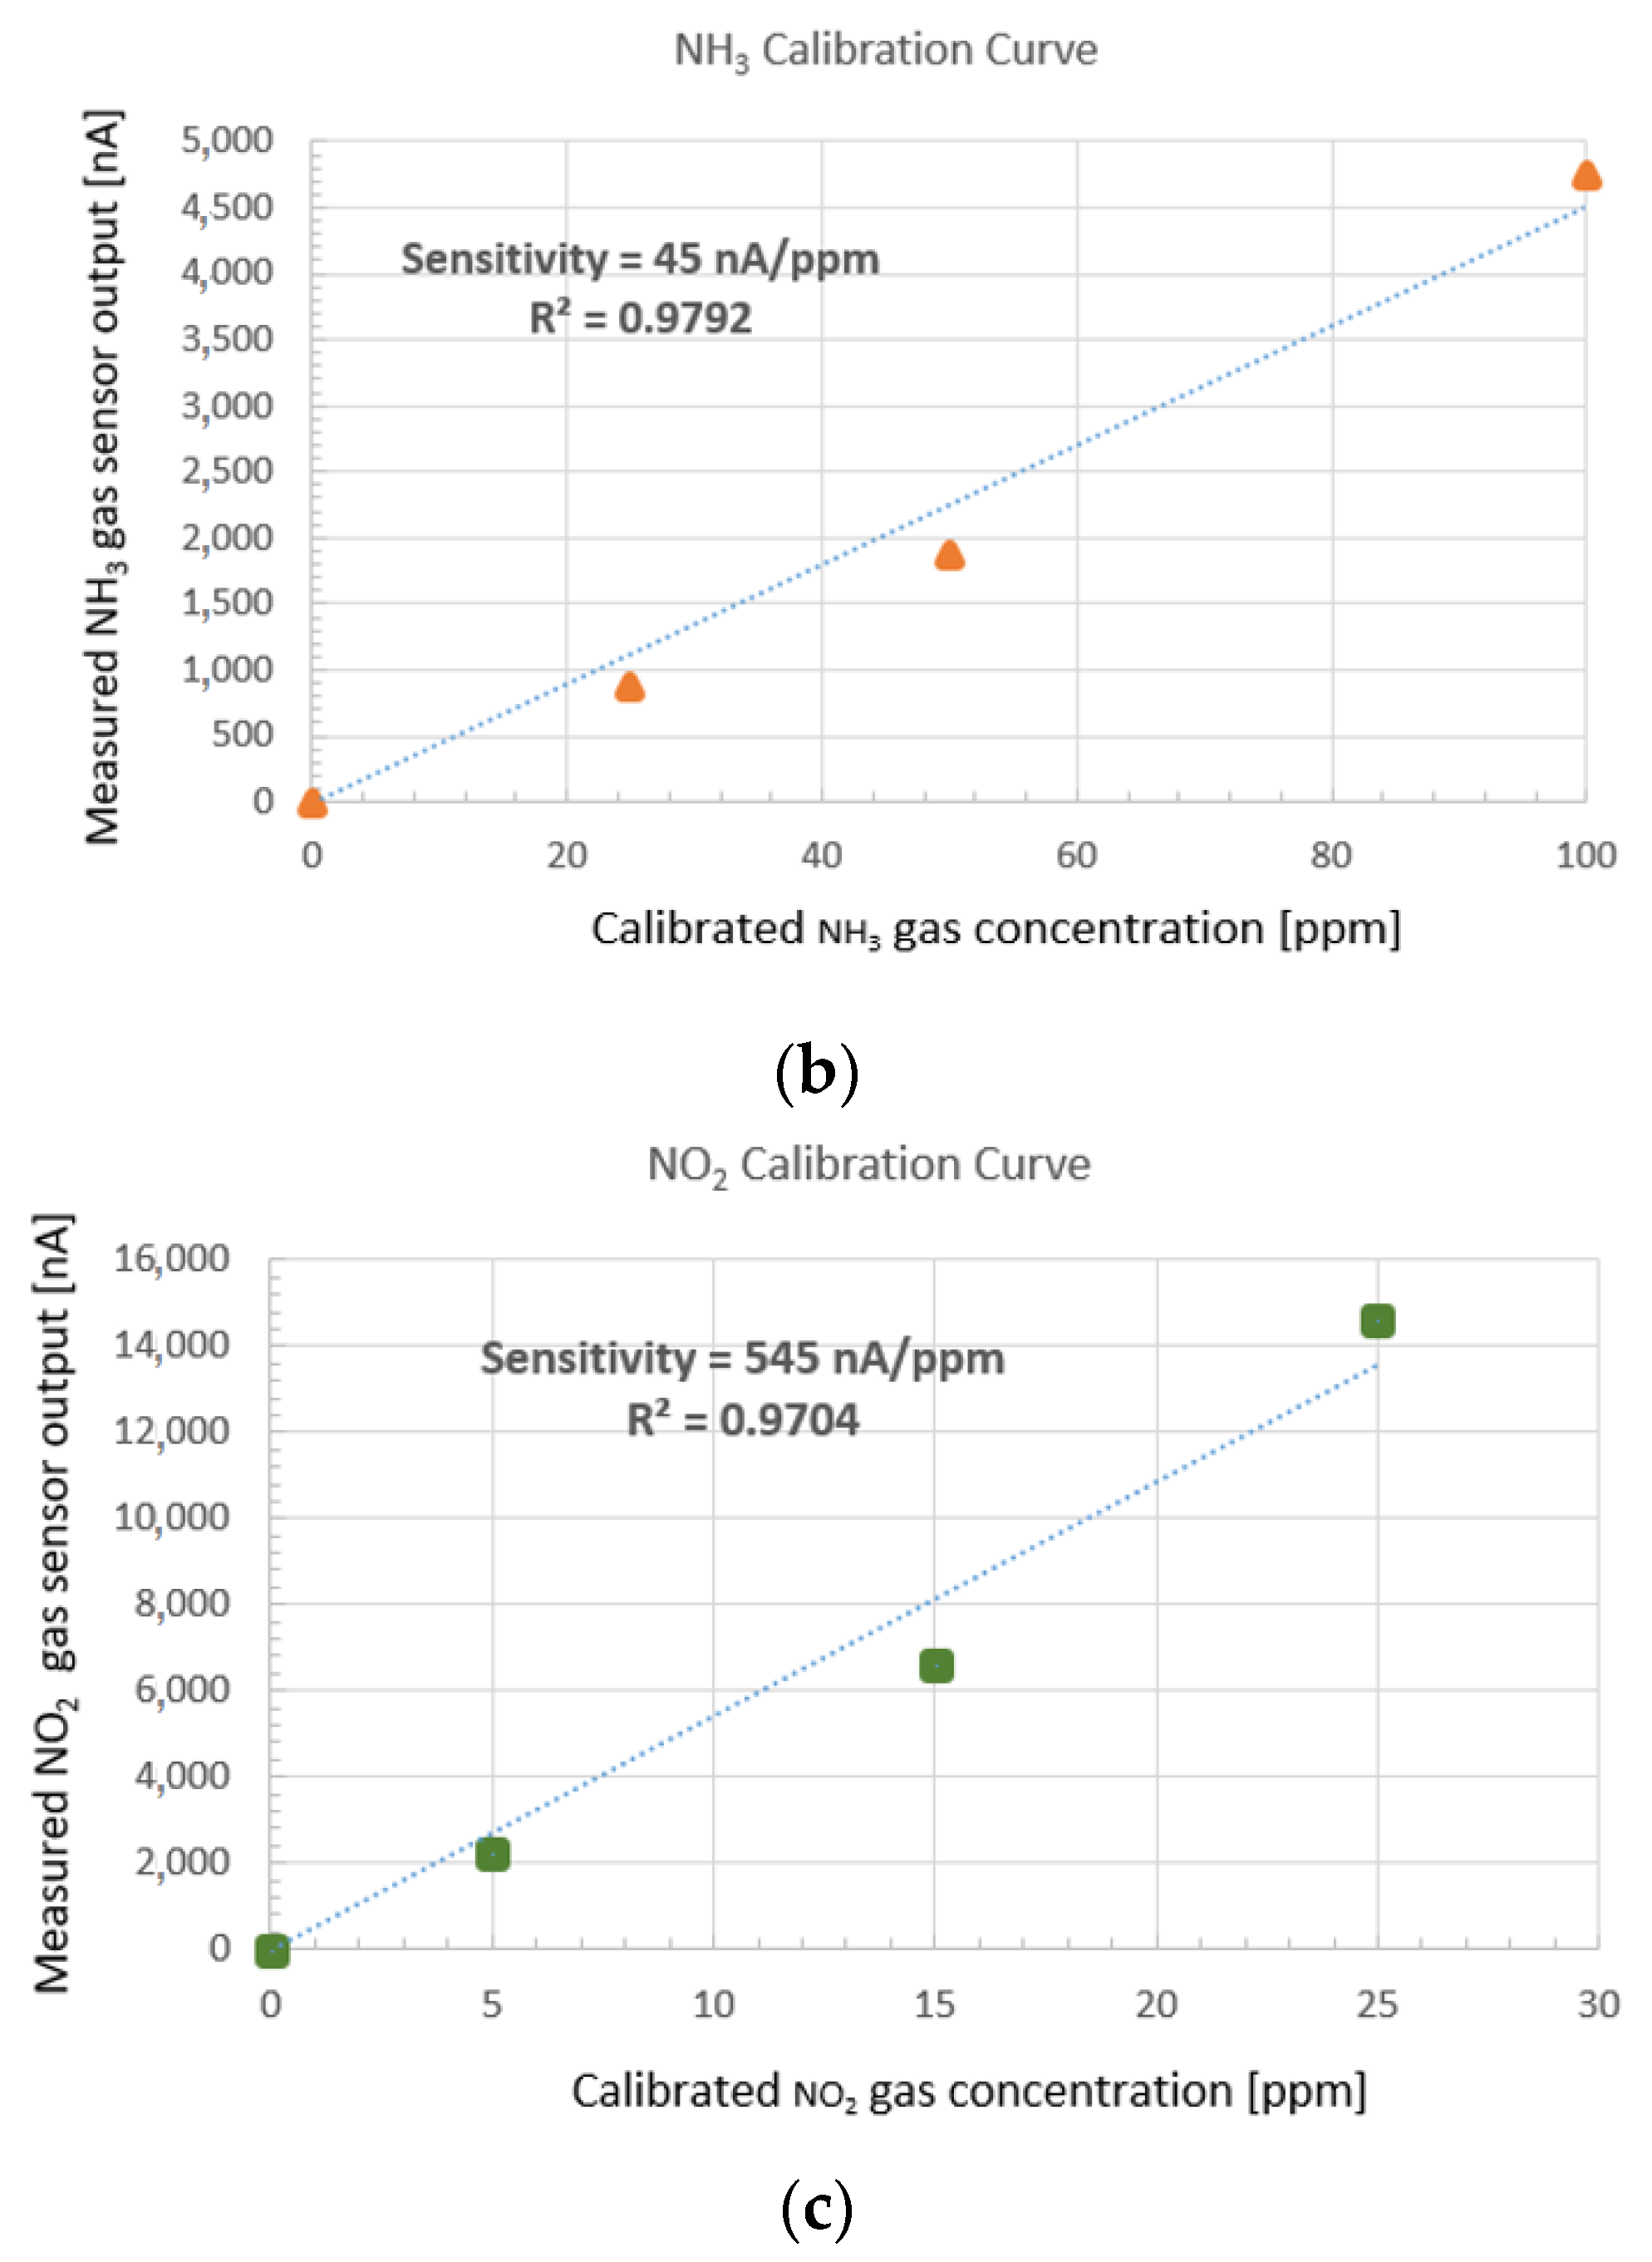
  • Nemoto NE4–NO2 electrochemical sensor with a sensitivity of 545 nA/ppm with response time T90% = 41 s (average of six samples);
  • Nemoto NE4–H2S–100 electrochemical sensor with a sensitivity of 705 nA/ppm with response time T90% = 37 s (average of three samples);
  • Nemoto NE4–NH3 electrochemical sensor with a sensitivity of 45 nA/ppm with response time T90% = 105 s (average of four samples);
  • Nemoto NE4–NO electrochemical sensor with sensitivity of 403 nA/ppm with response time T90% = 54 s (average of seven samples);
  • Nemoto NE4–Cl2 electrochemical sensor with a sensitivity of 586 nA/ppm with response time T90% = 43 s (average of seven samples);
Figure 3a–c show examples of calibration curves obtained measuring concentrations of CO, NH3, and NO2 produced with gas dilution systems. Linearity <5% FSO was obtained with repeatability of about 2% FSO. Cross-sensitivity measurements were performed for four example gases of interest to human health and safety protection, CO @ 200 ppm, H2S @ 50 ppm, NH3 @ 27 ppm, and NO2 @ 10 ppm. Electrochemical gas sensors may exhibit some response to other gases apart from the target gases. These responses arise from the gases being oxidized or reduced on the working electrode. Levels of cross-sensitivity obtained during the measurement campaign are reported in Figure 4. We found:
  • cross-sensitivity of H2S sensor to CO was less than 2.4%;
  • cross-sensitivity of NH3 sensor to H2S was around 164%;
  • cross-sensitivity of NH3 sensor to NO2 was less than 6%;
  • cross-sensitivity of NO sensor to NO2 was around 3%;
  • cross-sensitivity of Cl2 sensor to NO2 was around 93%.
Compared with other gas sensors, CO and NO2 sensors show higher specificity to their target gases on the basis of their lower values of cross-sensitivities. Most of these influences can be subsequently compensated using selective filters (chemical scrubbing) or correcting for gas interference by adopting tailored algorithms (pattern recognition or neural networks).
Temperature drift compensation via hardware (by using NTC resistors) and via software (using a fourth-order polynomial function according to NEMOTO gas sensor’s datasheet) approaches was applied. Results of these compensation procedures are reported in Figure 5, where measured values of NO2 were recorded at different temperatures. NO2 output thermal drift <2 ppm was observed in the range between 5 and 45 °C. The zero-temperature drift for each sensor was tested using a climatic chamber (see Figure 2b) and the values after compensation were found stable at different temperatures. Studies of gas sensors were conducted in a tailored test chamber in the electronic laboratory at Qatar University (Doha, Qatar). A mass flow controller was used to set the gas concentration inside the chamber from the reference gas cylinders with a standard concentration (e.g., 200 ± 0.26% ppm for CO). Temperature and humidity were mapped using the Sensirion SHT21 sensor installed on the board of the SERENO nodes. Fixed values of temperature and relative humidity are forced around 25 °C (±1 °C) and 50 (±5%), respectively. Data collected from SERENOs sensors are sent via 2.4 GHz wireless line to a receiver node that performs data processing and data logging through an Ethernet connection. As the receiver, an embedded Linux system was used, and this allowed the development of a gateway in the Python language to collect historical data through an IoT platform. Each node works in an ultralow power mesh network that makes nodes ’awake’ for a short amount of time and ’asleep’ for rest of the time. Nodes are deployed in mesh-topology formation and multihop communication is used to reach nodes outside coverage. This allowed for considerable deployment and area coverage, and enabled the air quality monitoring of many spots. Each node entered low power sleep mode when the transmission was finished.

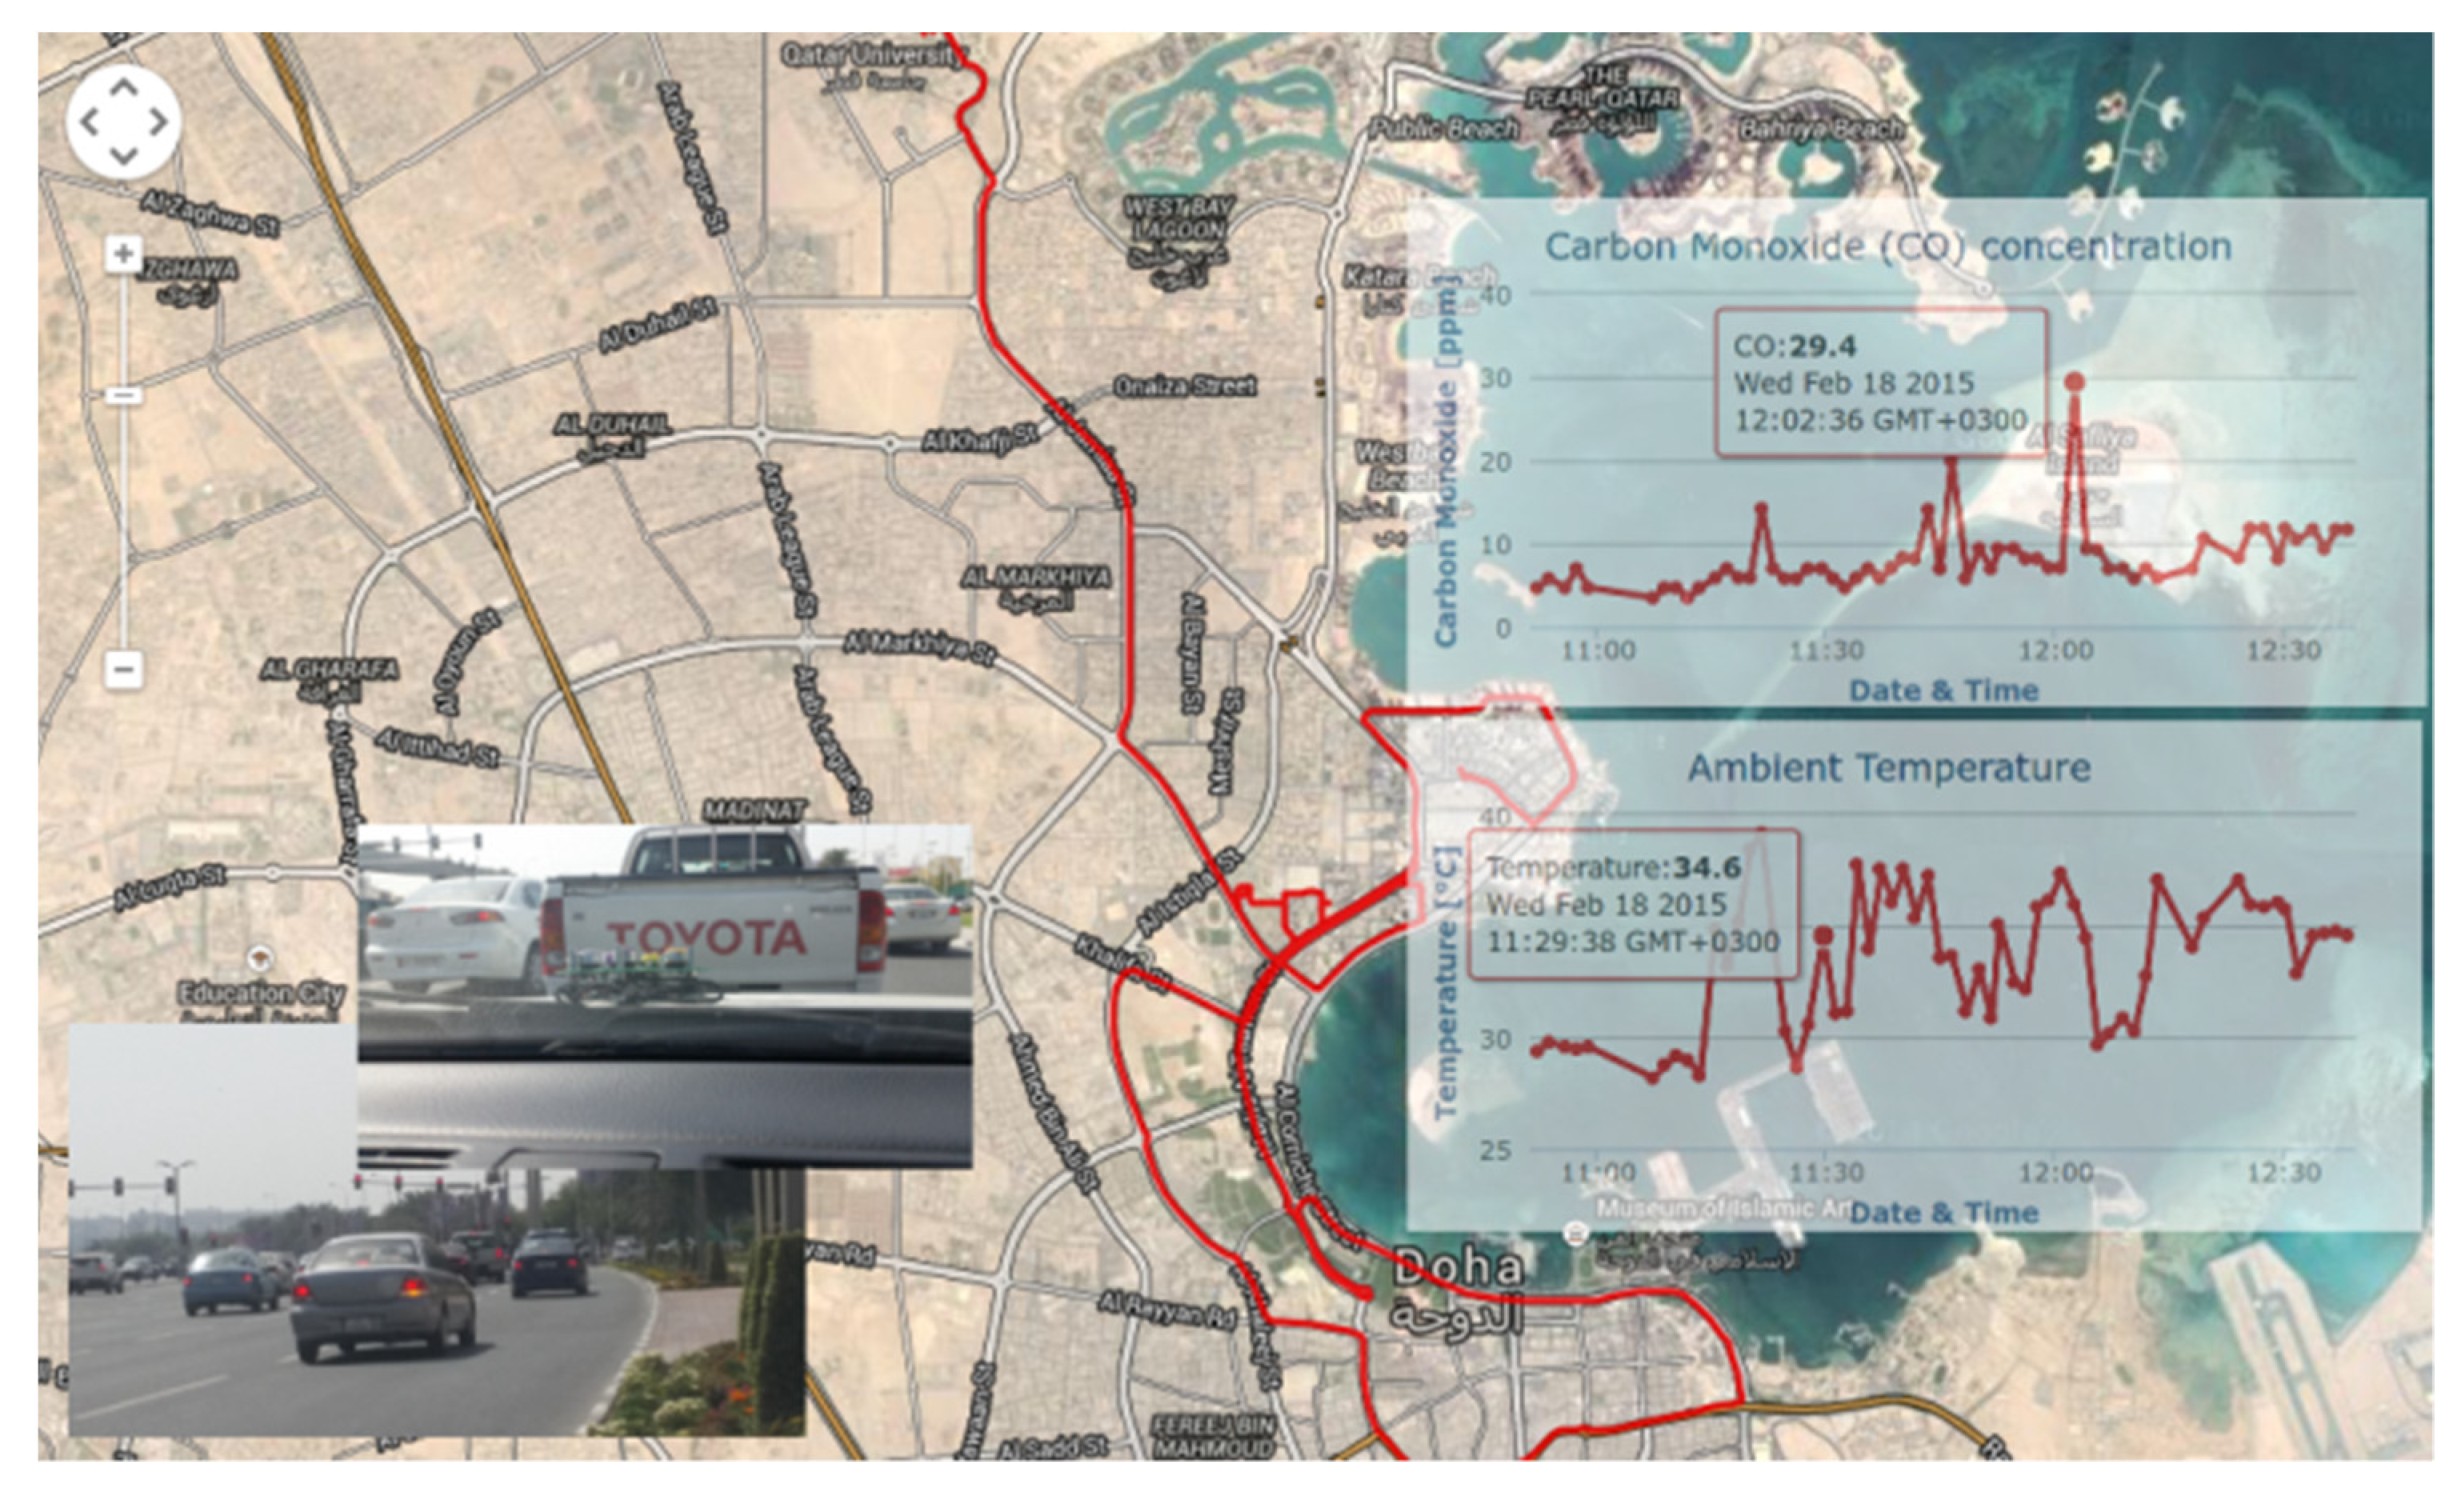
3.1. Measurement Results

Figure 6 shows an example of a measurement campaign taken in Doha (Qatar) with a device mounted on a car dashboard conducted on a day of normal city traffic in the middle of the traffic jam. CO levels can normally reach a peak of 30 ppm. Exposure of this level for several hours can cause harmful health effects on the body over time. However, the average value shown in the graph of Figure 6, which was around 10 ppm, could still cause possible health effects with long-term exposure. Furthermore, the temperature graph below shows that the measured CO values were not temperature dependent. The path in red is taken by an autonomous GPS tracker because the GPS module was not actually mounted on board since it required power consumption. The levels of CO and NO2 in the graph of Figure 7 showed average values of around 1.5 and 0.07 ppm, respectively. These levels lie well below the dangerous levels. Only if we focused on peak values can we have some spots out of the guard levels; sometimes, we could reach 7 or 8 ppm of CO and 1 ppm of NO2.
Those levels should be dangerous only after long-term exposure. However, we must consider that the system was deployed in an area far away from traffic and industrial areas. Then, we can consider this place as safe and not dangerous for human health. As a final study of the system, power consumption vs. perpetual functionality were evaluated. Experiments were conducted in indoor environments, where the system was deployed on a window (Figure 1c). Experiments conducted on SERENO with an operating cycle of measurements and data transmission every 15 min showed that the energy section was more than the energy consumption of the board. The only considered harvested energy sources were RF, internal/external light, and thermoelectric.

3.2. Energy Harvesting Evaluation

We only neglected the contribution from piezoelectric generators in the case of harvesting from vibrations deemed too difficult and unreliable to create a theoretical model that is able to simulate a real scenario (underground vibration, in a car, on a train, etc.) using the electrodynamics shaker. Moreover, most contribution was from the outdoor photovoltaic cell that is able to collect several mA under direct sunlight, providing great support in terms of energy needs. During the test, a constant back light source at 200 Lux was placed in front of the device to simulate a real working office day. The power management system collects the energy in the storage system (solid-state cell) in a chopper mode with a frequency proportional to the light intensity. A custom hot plate was built to simulate the thermal gradient from indoor to outdoor or on a specific interface (windows, boiler, automatic coffee machine, etc.). Figure 8 shows the results of this characterization. The thermal gradient was controlled to obtain 6 °C, which was the minimal value to collect energy from TEG generators. This behavior shows system deployment in real scenarios without human intervention for battery replacement, and in continuous operation mode.

4. Conclusions

In this work, we proposed a multiparametric sensing platform called SERENO (SEnsor REceiver NOde) that is entirely powered from the environment and presents a new approach to air quality monitoring. SERENO is able to intelligently manage energy transfer for perpetual operation without human intervention, allowing for its deployment in indoor and outdoor applications. A system design with a novel power supply approach, avoiding the use of a conventional battery, was presented. The conducted experiments demonstrated that the described platform was able to operate as an air quality monitor in a “set and forget” scenario using a mesh network topology for wide area coverage. The system could send data to a central platform, creating an air quality pollution map that users might consult to let people decide if they should spend time outdoors or indoors. Moreover, no maintenance capability (“set and forget”) makes the system scalable and expandable without any further costs. Anyone could install the device in offices, at home, or in places where people spend most of their time.

Author Contributions

D.C. and F.T. conceived the study, and all authors participated in the study design. A.G. and D.C. collected the data. D.C. and F.T. analyzed the data and A.G. drafted the manuscript. All authors gave comments on the earlier versions of the manuscript. All authors edited the manuscript and approved the final version. All authors have read and agreed to the published version of the manuscript.

Funding

This research was funded by NPRP grant #NPRP-10-0102-170094 from the Qatar National Research Fund (a member of Qatar Foundation). The statements made herein are solely the responsibility of the authors.

Institutional Review Board Statement

Not applicable.

Informed Consent Statement

Not applicable.

Data Availability Statement

Not applicable.

Conflicts of Interest

The authors declare no conflict of interest.

References

  1. Chau, C.K.; Hui, W.K.; Tse, M.S. Evaluation of health benefits for improving indoor air quality in workplace. Environ. Int. 2007, 33, 186–198. [Google Scholar] [CrossRef] [PubMed]
  2. Cain, W.S.; Samet, J.M.; Hodgson, M.J. The quest for negligible health risks from indoor air. ASHRAE J. 1995, 37. [Google Scholar]
  3. Hoek, G.; Brunekreef, B.; Goldbohm, S.; Fischer, P.; Van den Brandt, A. Association between mortality and indicators of traffic-related air pollution in the Netherlands: A cohort study. Lancet 2002, 360, 1184–1185. [Google Scholar] [CrossRef] [Green Version]
  4. Kjellstrom, T.E.; Neller, A.; Simpson, R.W. Air Pollution and Its Health Impacts: The Changing Panorama. Med. J. Aust. 2002, 177, 604–608. [Google Scholar] [CrossRef] [Green Version]
  5. Richards, M.; Ghanem, M.; Osmond, M.; Guo, Y.; Hassard, J. Grid-based Analysis of Air Pollution Data. Ecol. Model. 2006, 194, 274–286. [Google Scholar] [CrossRef]
  6. Devarakonda, S.; Sevusu, P.; Liu, H.; Liu, R.; Iftode, L.; Nath, B. Real-time air quality monitoring through mobile sensing in metropolitan areas. In Proceedings of the 2nd ACM SIGKDD International Workshop on Urban Computing, Chicago, IL, USA, 11–14 August 2013. [Google Scholar]
  7. Chaiwatpongsakorn, C.; Lu, M.; Keener, T.C.; Soon-Jai, K. The Deployment of Carbon Monoxide Wireless Sensor Network (CO-WSN) for Ambient Air Monitoring. Int. J. Environ. Res. Public Health 2014, 11, 6246–6264. [Google Scholar] [CrossRef] [PubMed] [Green Version]
  8. North, R.J.; Cohen, J.; Wilkins, S.; Richards, M.; Hoose, N.; Polak, J.W.; Bell, M.C.; Blythe, P.; Sharif, B.; Neasham, J.; et al. Field deployment of the MESSAGE System for environmental monitoring. Traffic Eng. Control 2009, 50, 484–488. [Google Scholar]
  9. Jiang, Y.; Li, K.; Tian, L.; Piedrahita, R.; Yun, X.; Mansata, O.; Liv, O.; Dick, R.P.; Hannigan, M.; Shang, L. MAQS: A person-alized mobile sensing system for indoor air quality monitoring. In Proceedings of the 13th International Conference on Ubiquitous Computing, Beijing, China, 17–21 September 2011; pp. 271–280. [Google Scholar]
  10. Cheng, Y.; Li, X.; Li, Z.; Jiang, S.; Li, Y.; Jia, J.; Jiang, X. AirCloud: A Cloud-based Air-Quality Monitoring System for Every-one. In Proceedings of the 12th ACM Conference of Embedded Network Sensor Systems, SenSys’ 14, Memphis, TN, USA, 3–6 November 2014; pp. 251–265. [Google Scholar]
  11. Wang, W.; Yuan, Y.; Ling, Z. The Research and Implement of Air Quality Monitoring System Based on ZigBee. In Proceedings of the 7th International Conference on Wireless Communications, Networking and Mobile Computing, Istanbul, Turkey, 4–8 July 2011; pp. 1–4. [Google Scholar]
  12. Lozano, J.; Suárez, J.I.; Arroyo, P.; Ordiales, J.M.; Álvarez, F. Wireless sensor networks for indoor air quality monitoring. Chem. Eng. Trans. 2012, 30, 319–324. [Google Scholar]
  13. Yajie, M.; Richards, M.; Ghanem, M.; Guo, Y.; Hassard, J. Air Pollution Monitoring and Mining Based on Sensor Grid in London. Sensors 2008, 8, 3601–3623. [Google Scholar]
  14. Sharma, A.; Mishra, B.; Sutaria, R.; Zele, R. Design and Development of Low-cost Wireless Sensor Device for Air Quality Networks. In Proceedings of the IEEE Region 10 Annual International Conference, Proceedings/TENCON, Osaka, Japan, 17–20 October 2019; pp. 2345–2350. [Google Scholar]
  15. Heinzelman, W.B.; Chandrakasan, A.P.; Balakrishnan, H. An application-specific protocol architecture for wireless microsensor networks. IEEE Trans. Wirel. Commun. 2002, 1, 660–670. [Google Scholar] [CrossRef] [Green Version]
  16. Jelicic, V.; Magno, M.; Paci, G.; Brunelli, D.; Benini, L. Design, characterization and management of a wireless sensor network for smart gas monitoring. In Proceedings of the 2011 4th IEEE International Workshop on Advances in Sensors and Interfaces (IWASI), Savelletri di Fasano, Italy, 28–29 June 2011; IEEE: Piscataway, NJ, USA, 2011; pp. 115–120. [Google Scholar]
  17. Karim, L.; Salti, T.E.; Nasser, N.; Mahmoud, Q.H. The Significant Impact of a Set of Topologies on Wireless Sensor Net-works. J. Wirel. Commun. Mob. Comput. 2012, 2012, 120. [Google Scholar] [CrossRef]
  18. Kavi, K.K.; Rajeev, P.; Avinash, M. A Wireless Sensor Network Air Pollution Monitoring. Int. J. Wirel. Mob. Netw. (IJWMN) 2010, 2, 31–45. [Google Scholar]
  19. Liu, J.-H.; Chen, Y.-F.; Lin, T.-S.; Lai, D.-W.; Wen, T.-H.; Sun, C.-H.; Juang, J.-Y.; Jiang, J.-A. Developed urban air quality monitoring system based on wireless sensor networks. In Proceedings of the 2011 Fifth International Conference on Sensing Technology, Palmerston North, New Zealand, 28 November–1 December 2011; IEEE: Piscataway, NJ, USA, 2011; pp. 549–554. [Google Scholar]
  20. Alhmiedat, T.; Samara, G. A low cost ZigBee sensor network architecture for indoor air quality monitoring. Int. J. Comp. Sci. Inf. Secur. 2017, 15, 140–144. [Google Scholar]
  21. Wu, Y.C.; Shiledar, A.; Li, Y.C.; Wong, J.; Feng, S.; Chen, X.; Chen, C.; Jin, K.; Janamian, S.; Yang, Z.; et al. Air quality monitoring using mobile microscopy and machine learning. Light Sci. Appl. 2017, 6, e17046. [Google Scholar] [CrossRef]
  22. Zampolli, S.; Elmi, I.; Ahmed, F.; Passini, M.; Cardinali, G.C.; Nicoletti, S.; Dori, L. An electronic nose based on solid state sensor arrays for low-cost indoor air quality monitoring applications. Sens. Actuators B Chem. 2004, 101, 39–46. [Google Scholar] [CrossRef]
  23. Kim, J.Y.; Chu, C.H.; Shin, S.M. ISSAQ: An integrated sensing systems for real-time indoor air quality monitoring. IEEE Sens. J. 2014, 14, 4230–4244. [Google Scholar] [CrossRef]
  24. Benammar, M.; Abdaoui, A.; Ahmad, S.H.M.; Touati, F.; Kadri, A. A modular IoT platform for real-time indoor air quality monitoring. Sensors 2018, 18, 581. [Google Scholar] [CrossRef] [Green Version]
  25. Tiele, A.; Esfahani, S.; Covington, J. Design and development of a low-cost, portable monitoring device for indoor environment quality. J. Sens. 2018, 2018, 5353816. [Google Scholar] [CrossRef]
  26. Wan, H.; Yin, H.; Lin, L.; Zeng, X.; Mason, A.J. Miniaturized Planar Room Temperature Ionic Liquid Electrochemical Gas Sensor for Rapid Multiple Gas Pollutants Monitoring. Sens. Actuators B Chem. 2018, 255 Pt 1, 638–646. [Google Scholar] [CrossRef]
  27. Khan, M.A.H.; Rao, M.V.; Li, Q. Recent Advances in Electrochemical Sensors for Detecting Toxic Gases: NO2, SO2 and H2S. Sensors 2019, 19, 905. [Google Scholar] [CrossRef] [Green Version]
  28. Dhall, S.; Mehta, B.R.; Tyagi, A.K.; Sood, K. A review on environmental gas sensors: Materials and technologies. Sens. Int. 2021, 2, 100116. [Google Scholar] [CrossRef]
  29. Kimmel, D.W.; LeBlanc, G.; Meschievitz, M.E.; Cliffel, D.E. Electrochemical Sensors and Biosensors. Anal. Chem. 2012, 84, 685–707. [Google Scholar] [CrossRef] [PubMed] [Green Version]
  30. Brauns, E.; Morsbach, E.; Kunz, S.; Bäumer, M.; Lang, W. A fast and sensitive catalytic gas sensors for hydrogen detection based on stabilized nanoparticles as catalytic layer. Sens. Actuators B Chem. 2014, 193, 895–903. [Google Scholar] [CrossRef]
  31. Lee, C.; Lee, H.; Chiu, Y. Performance Improvement of Nitrogen Oxide Gas Sensors Using Au Catalytic Metal on SnO2/WO3 Complex Nanoparticle Sensing Layer. IEEE Sens. J. 2016, 16, 7581–7585. [Google Scholar] [CrossRef]
  32. Xue, S.; Xibo, D.; Yuechao, C.; Gen, H.; Long, B. Temperature drift and compensation techniques for the thermal conductivity Gas sensor. In Ifost; IEEE: Piscataway, NJ, USA, 2013; pp. 32–35. [Google Scholar]
  33. Tardy, P.; Coulon, J.-R.; Lucat, C.; Menil, F. Dynamic thermal conductivity sensor for gas detection. Sens. Actuators B Chem. 2004, 98, 63–68. [Google Scholar] [CrossRef]
  34. Bogue, R. Detecting gases with light: A review of optical gas sensor technologies. Sens. Rev. 2015, 35, 133–140. [Google Scholar] [CrossRef]
  35. Hodgkinson, J.; Tatam, R.P. Optical gas sensing: A review. Meas. Sci. Technol. 2013, 24, 012004. [Google Scholar] [CrossRef] [Green Version]
  36. Dinh, T.-V.; Choi, I.-Y.; Son, Y.-S.; Kim, J.-C. A review on non-dispersive infrared gas sensors: Improvement of sensor detection limit and interference correction. Sens. Actuators B Chem. 2016, 231, 529–538. [Google Scholar] [CrossRef]
  37. Dey, A. Semiconductor metal oxide gas sensors: A review. Mater. Sci. Eng. B 2018, 229, 206–217. [Google Scholar] [CrossRef]
  38. Nazemi, H.; Joseph, A.; Park, J.; Emadi, A. Advanced Micro-and Nano-Gas Sensor Technology: A Review. Sensors 2019, 19, 1285. [Google Scholar] [CrossRef] [Green Version]
Figure 1. (a) Power harvesting and sensing blocks; (b) example of SERENO prototype; (c) SERENO sensing node applied onto a window.
Atmosphere 13 00321 g001
Figure 2. (a) Chamber for gas sensor characterization; (b) climatic chamber for thermal and RH% test.
Atmosphere 13 00321 g002
Figure 3. Gas calibration curves. (a) CO gas standard vs. CO sensor; (b) NH3 gas standard vs. NH3 sensor; (c) NO2 gas standard vs. NO2 sensor.
Atmosphere 13 00321 g003aAtmosphere 13 00321 g003b
Figure 4. Cross-sensitivity gas sensor characterization.
Atmosphere 13 00321 g004
Figure 5. Example of gas sensors (here NO2) thermal drift analysis from 0 to 45 °C.
Atmosphere 13 00321 g005
Figure 6. Example of measurement campaign in Doha (Qatar) traffic jam.
Atmosphere 13 00321 g006
Figure 7. Measurement campaign (3 months) in Doha (Qatar) dedicated to CO and NO2 evaluation.
Atmosphere 13 00321 g007
Figure 8. (a) SERENO prototype installed on a metallic plate driven by externally driven Peltier cells to impose thermal gradients; (b) behavior of TEG output with thermal gradients from 4 to 12 °C.
Atmosphere 13 00321 g008
Publisher’s Note: MDPI stays neutral with regard to jurisdictional claims in published maps and institutional affiliations.

