Article

Thermodynamic and Kinematic Structures in the Rainband Region of Typhoon Lekima (2019) at Landfall

1
Research Center for Wind Engineering and Engineering Vibration, Guangzhou University, Guangzhou 510006, China
2
Shanghai Typhoon Institute, Shanghai 200030, China
3
Hong Kong Observatory, Hong Kong 999077, China
*
Author to whom correspondence should be addressed.
Atmosphere 2022, 13(2), 312; https://doi.org/10.3390/atmos13020312
Submission received: 29 December 2021 / Revised: 6 February 2022 / Accepted: 8 February 2022 / Published: 13 February 2022

Abstract

:
Super Typhoon Lekima (2019) was the third strongest tropical cyclone (TC) that has ever made landfall in Jiangsu and Zhejiang Provinces, China. During its passage, the storm resulted in catastrophic disasters to mainland China, which made it one of the costliest typhoons in Chinese history. This article presents an observational study on the thermodynamic and kinematic structures of Typhoon Lekima at landfall, mainly based on measurements from radiosonde balloons that were released at different periods from a coastal site located with a nearest distance of ~200 km to the track of Lekima. Observations from a weather radar are first discussed to demonstrate the horizontal structure of the typhoon, and the concentric eyewall structure of Lekima is highlighted. Then, Lekima’s pressure field is analyzed, and a two-dimensional model is proposed to quantify both the radial and height dependence of the pressure distribution. The subsequent analysis focuses on the warm-core like structure in the rainband region. The maximum perturbation of measured equivalent potential temperature with respect to the one of environment reached 25 K at ~5 km. Some factors contributing to the warm-core like feature are discussed. The authors of this article finally investigate the TC wind field. Low-level jets of vertical wind profile in rainband areas were observed at heights of around 1–3 km. Dramatic wind shears were observed in the range of 15–17 km where the outflow layer existed, while wind became considerably weak at the tropopause.

1. Introduction

As one of the most destructive natural disasters, tropical cyclones (TCs) can cause serious property losses and casualties in TC-prone areas, mostly through destructive winds, storm surges, and severe floods [1]. Understanding the structures of TCs can facilitate many practices in the fields of meteorology and wind engineering, including forecasting of TC strength, the wind-resistant design of civil structures, and policy making for the prevention and control of TC-induced disasters.
Field measurement is the most straightforward and reliable method for studying TC structures. In this regard, continuous efforts have been made during the last few decades based on ever developing instruments and technologies, including ground-based masts [2,3,4], portable meteorological masts [5,6], Doppler radars [7,8], aircrafts [9,10], wind profilers [11], satellite observation [12,13,14], and GPS dropsonde [15,16,17,18,19]. Based on field measurements, great advancements of TC knowledge have been achieved, e.g., detailed features of warm-cores, concentric eyewall structures, and correlations between evolution and TC strength, the low-level-jet characteristics of TC wind profiles, and the characteristics and mechanisms of air–sea interactions.
Among these instruments, the radiosonde balloon is sometimes of special concern because it possesses the following two merits. First, it is able to provide fast-response measurements within the whole depth of a TC, which makes it possible to analyze the global structure of TCs in the vertical plane with a satisfactory resolution in height [20]. Second, compared to many advanced observational instruments such as aircrafts equipped with radars and GPS dropsondes, radiosonde balloons are economic and safe in terms of operation and maintenance. Thus, they have been adopted in many places for a considerably long time, leading to the high availability of such data [21,22]. Specifically, the authors of [23] analyzed rawinsonde data to explore large-scale characteristics of TCs. Chan [24], as well as many other researchers, adopted radiosonde data to identify the steering flows for TC motions, while Prive and Errico [25] investigated the impact of the increased frequency of rawinsonde observations on forecast skill. Based on high-vertical resolution radiosonde data, the authors of [26] documented the existence of low-bulk Richardson number layers in TCs and analyzed their effects on TC intensity.
Rainbands form the majority of TCs (in terms of space) and play an important role in the evolution of TC structure and intensity [27]. Even if a tropical cyclone never makes landfall, high winds and heavy rain from outer rainbands may still affect land. Thus, studies on TC rainbands have drawn continuous attention. A notable experiment, i.e., the Hurricane Rainband and Intensity Change Experiment (RAINEX), was initiated to address internal hurricane dynamics and to explore the correlations between TC intensity and interactions of the eye, eyewalls, and rainbands [28,29,30]. Efforts have also been conducted to analyze the wind dynamics in TC rainbands [31,32].
The southeast coast of China is located at a place where TCs frequently land. Additionally, this region is the most developed economic area of the nation, and it also features a high population density and large-scale civil structures that are considerably sensitive to TC wind. Thus, it is of great social–economic importance to investigate TCs in this region. However, detailed observations of landfalling typhoons throughout their entire depth are still limited, and the understanding of local TCs is insufficient.
Super Typhoon Lekima was the third strongest TC to have ever made landfall in Jiangsu and Zhejiang Provinces, China. During its passage, the storm resulted in severe disasters in China. Reportedly, there were at least 56 deaths and 14 missing persons. Over 14 million people were affected, with direct economic losses exceeding over 74 billion dollars. This makes Lekima one of costliest typhoons in Chinese history.
This article presents an observational study on the thermodynamic and kinematic structures in the rainband of Typhoon Lekima during landfall, mainly based on measurements from a number of radiosonde balloons deployed at varied periods from a coastal site that was located with a nearest distance of ~200 km to the vortex. The results are expected to provide useful insights for better understanding of the structures of TCs that impact southeast China. The remainder of the article is organized as follows: Section 2 introduces the datasets. The structural features of the typhoon are explored in detail in Section 3. Main concluding remarks are summarized in Section 4.

2. Experiment and Database

2.1. Typhoon Lekima (2019)

Super Typhoon Lekima was the ninth named storm in the Pacific typhoon season in 2019. Lekima originated from a tropical depression at the east of Philippines on July 30, and it formed as a tropical depression at ~1180 km east of Manila in the early morning of 4 August. It tracked northwest towards the sea areas east of Taiwan and gradually intensified in the following days. Lekima developed into a typhoon on 7 August and further intensified into a super typhoon (Category 4) the next day, reaching its peak intensity with an estimated sustained wind of 54.2 m·s−1 near the center. The typhoon gradually weakened in the following two days as it moved across the East China Sea. Lekima made landfall over the coast of Zhejiang at 18:00 UTC (local time +08:00) on 9 August, with the central pressure and maximum sustained wind speed equal to 930 hPa and 52.0 m·s−1, respectively. It then turned northwards across the coastal region of eastern China and weakened into a tropical storm. Lekima slowly moved over the Bohai Sea on 12 August and finally evolved into an extratropical cyclone the next afternoon. Figure 1 shows the path of Lekima during the period when the typhoon significantly impacted mainland China.

2.2. Data from Radiosonde Balloons

The main observational devices adopted in this study were radiosonde balloons. A radiosonde balloon is a balloon that carries instruments aloft to send back information regarding detected weather elements (e.g., pressure, dry-bulb temperature, relative humidity, dew point, horizontal wind speed and direction) by means of radiosonde. During the passage of Lekima around the study site (Figure 1; geographical coordinates: 29.90228° N, 122.36694° E), 10 balloons (Sonde type: RS41-SG; system trademark and model: MW41; Software version: MW41 2.4.0) were released at different times from 02:32 UTC on 9 August to 13:36 UTC on 10 August. The radial distances between the balloons and the TC center were in a range of 200–500 km. The nearest distance was achieved at 04:00 UTC on 10 August when the storm moved northwards as a severe tropical storm. According to the information issued by the Regional and Mesoscale Meteorological Branch (RAMMB, https://rammb-data.cira.colostate.edu/tc_realtime/, accessed on 18 September 2021), the radius of maximum wind (RMW) for Lekima consistently increased during the two days of 9–10 August, with the values estimated to be in a range of 20–110 km. Thus, all the balloons were released outside the most inner core regions (i.e., eye and eyewall).
The radiosonde balloons provided instantaneous samplings of atmosphere at 2-sec intervals as they ascended from near ground level (4 m in this study) up to 17–29 km. The measurements included pressure, dry-bulb temperature, relative humidity, dew point, horizontal wind speed and direction, longitude and latitude, and altitude. According to the technical manual of the radiosonde balloon system, the resolutions of raw measurements were 0.1 hPa for pressure, 0.1 °C for dry-bulb temperature, 1% for relative humidity, 0.1 °C for dew point, 0.1 m·s−1 and 1° for wind speed and direction, 0.001° for geographic coordinates, and ~11 m for latitude (on average). Details of the releasing process of the balloons (i.e., the starting and ending time, the maximum height that a balloon reached, the radial distance between a balloon on releasing to the TC center, and the drift distance of the balloons during the whole releasing period) are tabulated in Table 1. The trajectory of each released balloon with respect to the center of Lekima is depicted in Figure 2.
To ensure the quality of collected measurements, each radiosonde profile as manually examined to remove any identifiable errors. If the number of continuous missing/problematic points was more than three, they were replaced by interpolations from their neighbors. Each of the profiles was then smoothed using a wavelet decomposition filter (wavelet name: db4; decomposition level: 2) to remove occasional spikes due to the switching of satellites or other interference effects following the method adopted in [20]. Note that the filtering manipulations tend to reduce the resolution capacity of measurement results for small-scale flow structures to some extent, but a comparison of the results with and without such filtering operations revealed that the filtering effects were limited and insignificant for the findings to be discussed in the following sections.
In addition to the data introduced above, measurements at a nearby site, i.e., the Hongjia station, were utilized to provide comparison information for the background atmosphere in this study. The Hongjia station belongs to the national upper-air detection network (No.: 58665; geographical coordinates: 28.62° N, 121.42° E). It is located 169 km southwest of the study site. This station can provide routine detections of upper air via radiosonde balloons. The adopted measurements from this station refer to the ensemble-mean values of different weather elements at each mandatory level (i.e., 1000, 925, 850, 700, 500, 400, 300, 250, 200, 150, 100, 70, 50, 30, 20, and 10 hPa), which were computed based on radiosonde profiles collected in each August during 1981–2010. Refer to the website of CMA (http://data.cma.cn/site/index.html, accessed on 27 September 2021) for more details. Because the ensemble-mean profiles at Hongjia station are generated on the basis of long-term radiosonde samplings, they are able to smooth out various local features of atmosphere and retain the basic features of large-scale background environments.

3. Results and Discussions

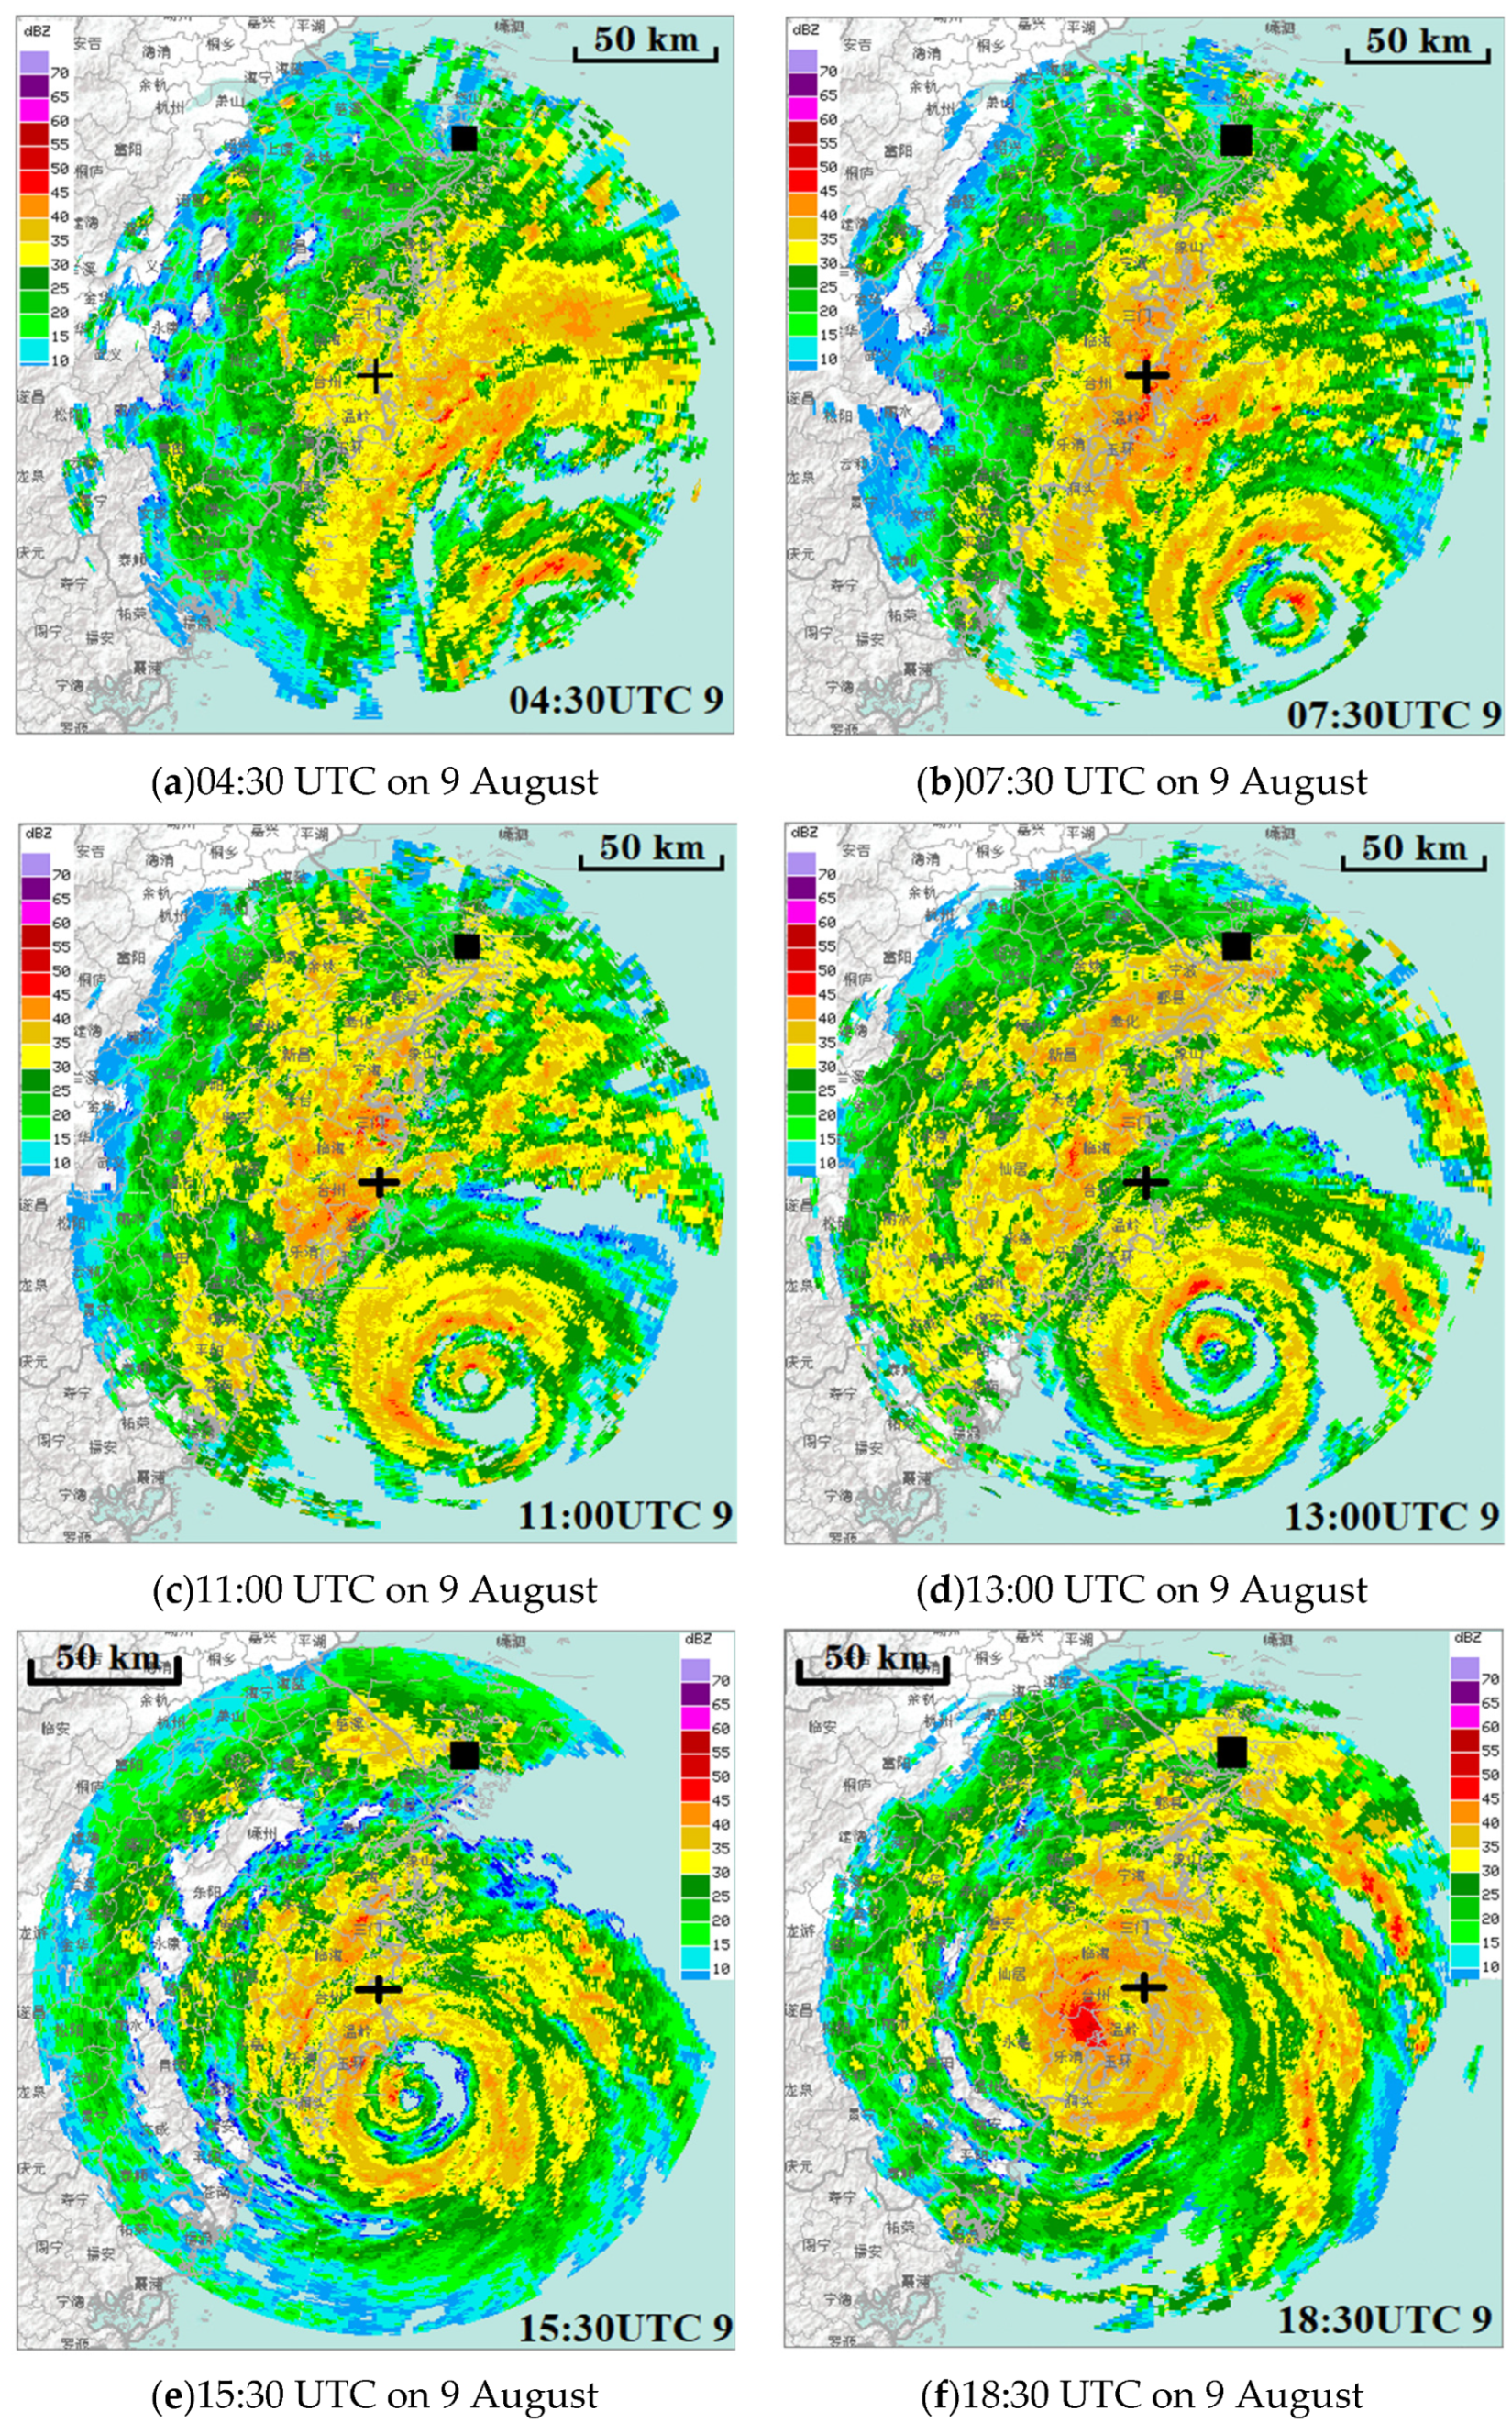
3.1. Results from Weather Radar

To clarify the horizontal structure of the typhoon and to specify the storm-relative positions of released balloons, Figure 3 first presents the detections from a weather radar that was operational at 166 km southwest of the study site. The results describe the evaluations during the period of 04:30–19:30 UTC on 9 August when Lekima moved close to the southeast coast of China and made landfall there. Unfortunately, detections were not available on 10 August when the typhoon was closest to the study site.
From the figure, Lekima exhibited a concentric eyewall structure before it made landfall. Concentric eyewalls usually exists in intense matured TCs [33], and they tend to experience an evolution cycle that is termed the eyewall replacement cycle (ERC). Warm-and-wet air flows over open seas/oceans are efficiently pumped up and feed the vortex by transporting latent energy upwards. For intense TCs, the pumping capacity of the vortex may exceed the supply rate of energy-containing air flows over seawater, resulting in the insufficient transportation of warm-and-wet atmosphere for TCs’ upper portions. Consequently, the development of existing eyewalls tends to be restrained. Such weakening effects are further strengthened by the appearance of an outer eyewall that prevents warm-and-wet flows from flowing inwards. A complete ERC ends typically with a replacement of the inner eyewall by the ever-shrinking outer eyewall [29,33]. During this process, the TC strength tends to first decrease and then gradually recover. However, for Lekima, the concentric eyewall structure did not disappear until the storm made landfall, when the eye filled and the inner and outer eyewalls seemed to merge together to form a huge rainband complex.
It can be seen from Figure 3 that during most episodes of the observational period, the study site was impacted by the primary rainband. Thus, measurements from the released balloons were able to reveal some typical features of Lekima’s rainbands.

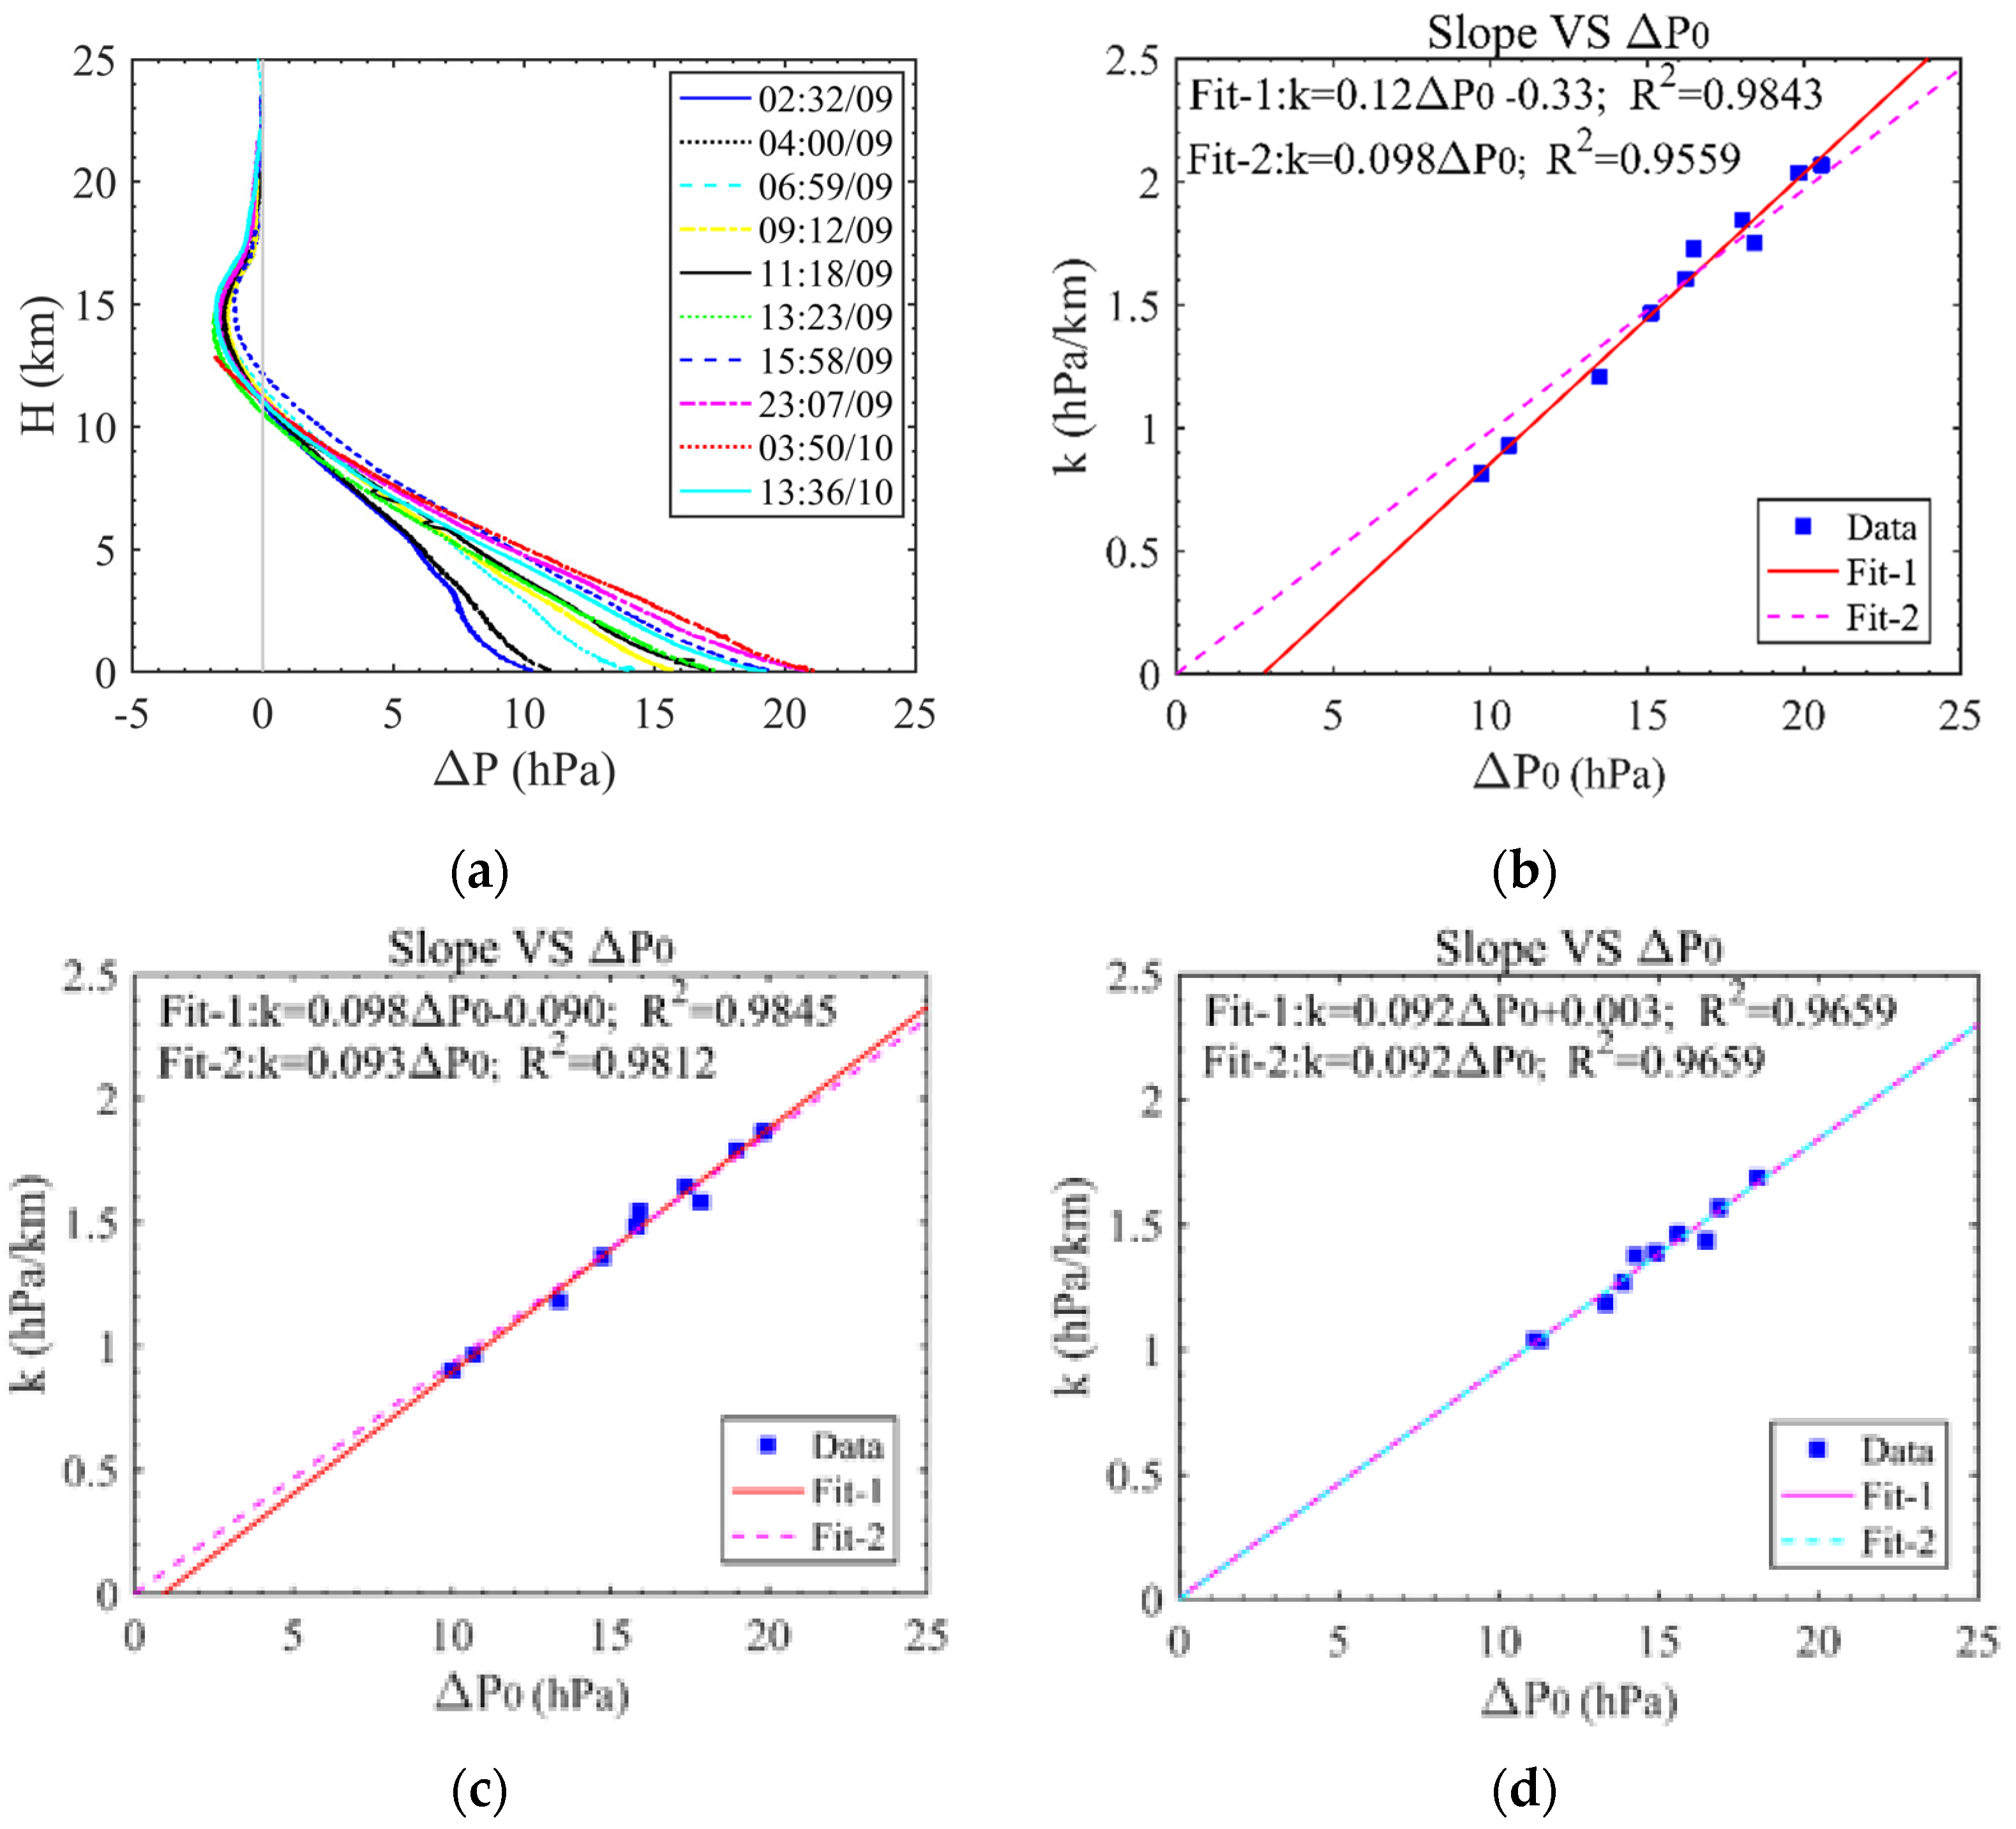
3.2. Pressure Field—Observation and Modeling

Mechanically, a TC is driven by a pressure gradient force. Therefore, knowledge on TCs’ pressure fields is of great interest, especially for TC modelling in engineering practices or, more specifically, for estimating TC wind hazard and storm surge. A widely adopted TC pressure field model is the one proposed in [34], which accounts for the radial distribution of TC pressure fields at a near ground level. Recently, the authors of [22,35] proposed a height-revolving model based on observational results from radiosonde balloons at Hong Kong. Although the validity of that model was examined via some cases studies in Hong Kong, its applicability in other regions has not been verified.
To quantify the pressure field of Typhoon Lekima, the pressure deficit ΔP(z), which is defined as the difference between the environmental pressure Pref(z) and the radiosonde samples from the typhoon P(z), was computed; the results are presented in Figure 4a. It can be observed that the values of ΔP(z) were negative below ~10 km and positive within 12–17 km, which reflects the vertical structure of a TC, i.e., a typical inflow layer exists at much lower portion of the troposphere and the outflow layer exists around (and usually just beneath) the tropopause [20,22]. Since the radiosonde samples only accounted for the outer region of Lekima, it is reasonable to speculate that the vertical structure of this vortex extended beyond the tropopause, especially during the period when it remained a super typhoon.
It was interesting to find that the profiles of ΔP(z) were linearly distributed along altitude. Figure 4b presents a further examination of the correlation between the slopes of P(z), i.e., k, in the portion below 10 km, and the values of ΔP at MSL, i.e., ΔP0. The results suggest that k (unit: hPa km 1 ) was linearly correlated to ΔP0. Based on the above findings, ΔP(z) was modeled as:
Δ P ( z ) = Δ P 0 k z
k ( Δ P 0 ) = a Δ P 0 + b
where a and b are two coefficients that were determined to be 0.12 and −0.33, respectively, through fitting records in a range below 10 km.
As shown in Figure 4b, the existence of a nonzero value of b in Equations (1) and (2) were mainly caused by the three points with the minimum ΔP0 values. Figure 4a shows that as ΔP0 decreased, the vertical profile of pressure deficit ΔP below the TC outflow layer tended to deviate from a straight line. It is though that these balloons were released at much outer regions of the typhoon where local convective effects were evident. Similar findings were also observed in [22]. When using a homogeneous linear model (i.e., setting b as zero) for the fitting operation, the coefficient a turned to be 0.098 based on records in the range below 10 km, 0.093 based on records in the range below 12 km, and 0.092 based on records in the range of 5–12 km. These results agree with the value of 0.092 in [22] that was obtained on the basis of 142 balloons during the passage of 24 TCs around Hong Kong (for records in the range of 0–10 km). Thus, the validity of the proposed profile model for ΔP(z) was verified in this study.
The height-resolving model of TC pressure fields can be derived based on aforementioned vertical profile model in conjunction with any existing radial profile model, e.g., the one proposed in [34]:
Δ P 0 ( r ) = P r e f , 0 P 0 ( r )
P 0 ( r ) = P c 0 + Δ P c 0 exp [ ( r m / r ) B ]
where P0(r) is the mean-sea-level pressure at a storm-relative position marked by the radial distance r; Pc0 and ΔP0= Pref,0Pc0 are, respectively, the mean-seal-level pressure and pressure deficit at the TC center; rm represents the radius of maximum wind (RMW); and B (also called Holland-B) is a scaling parameter that determines the shape of the radial profile.
From Equations (1)–(4), it can be deduced that:
Δ P ( r , z ) = Δ P c 0 Δ P c 0 exp [ ( r m / r ) B ] k z
where ΔP(r,z) is the proposed two-dimensional model of pressure deficit whose value depends upon the storm-relative position r and altitude z, and k is in function of ΔP(r) (therefore, in function of r) and can be determined by Equation (4). By substituting Equation (5) into the well-established barometric formula, the height-resolving model of TC pressure fields can be obtained.

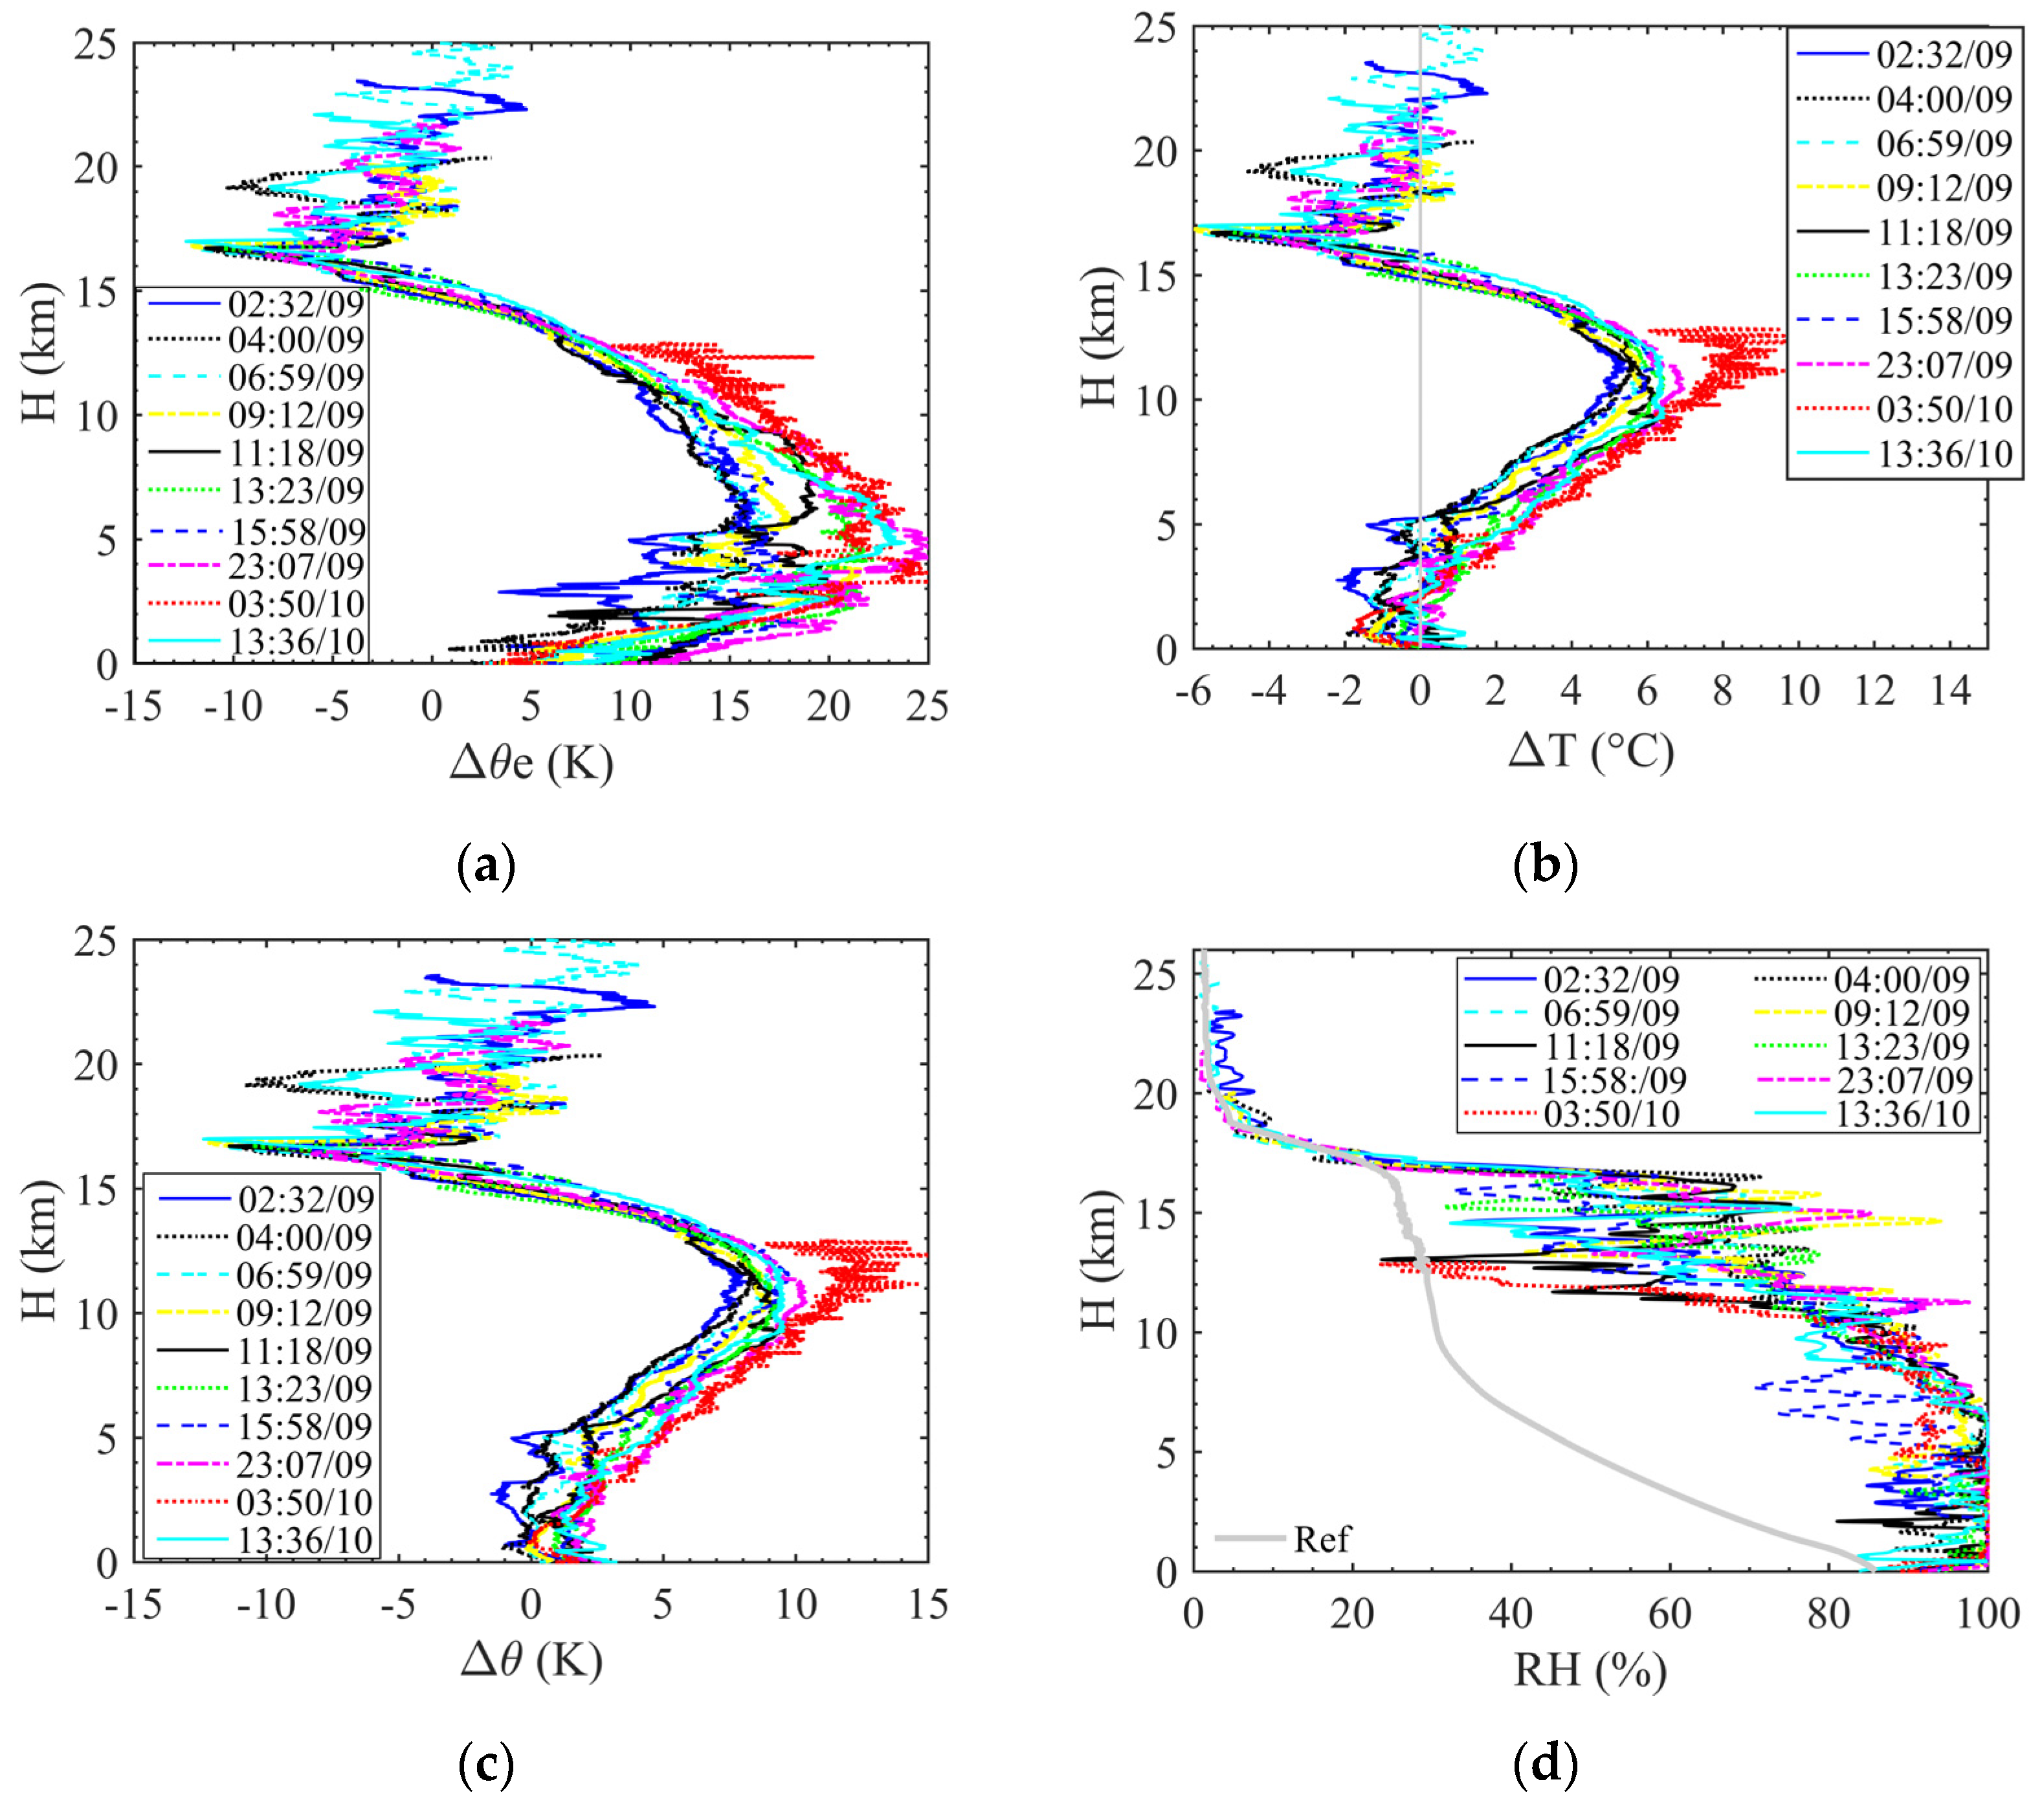
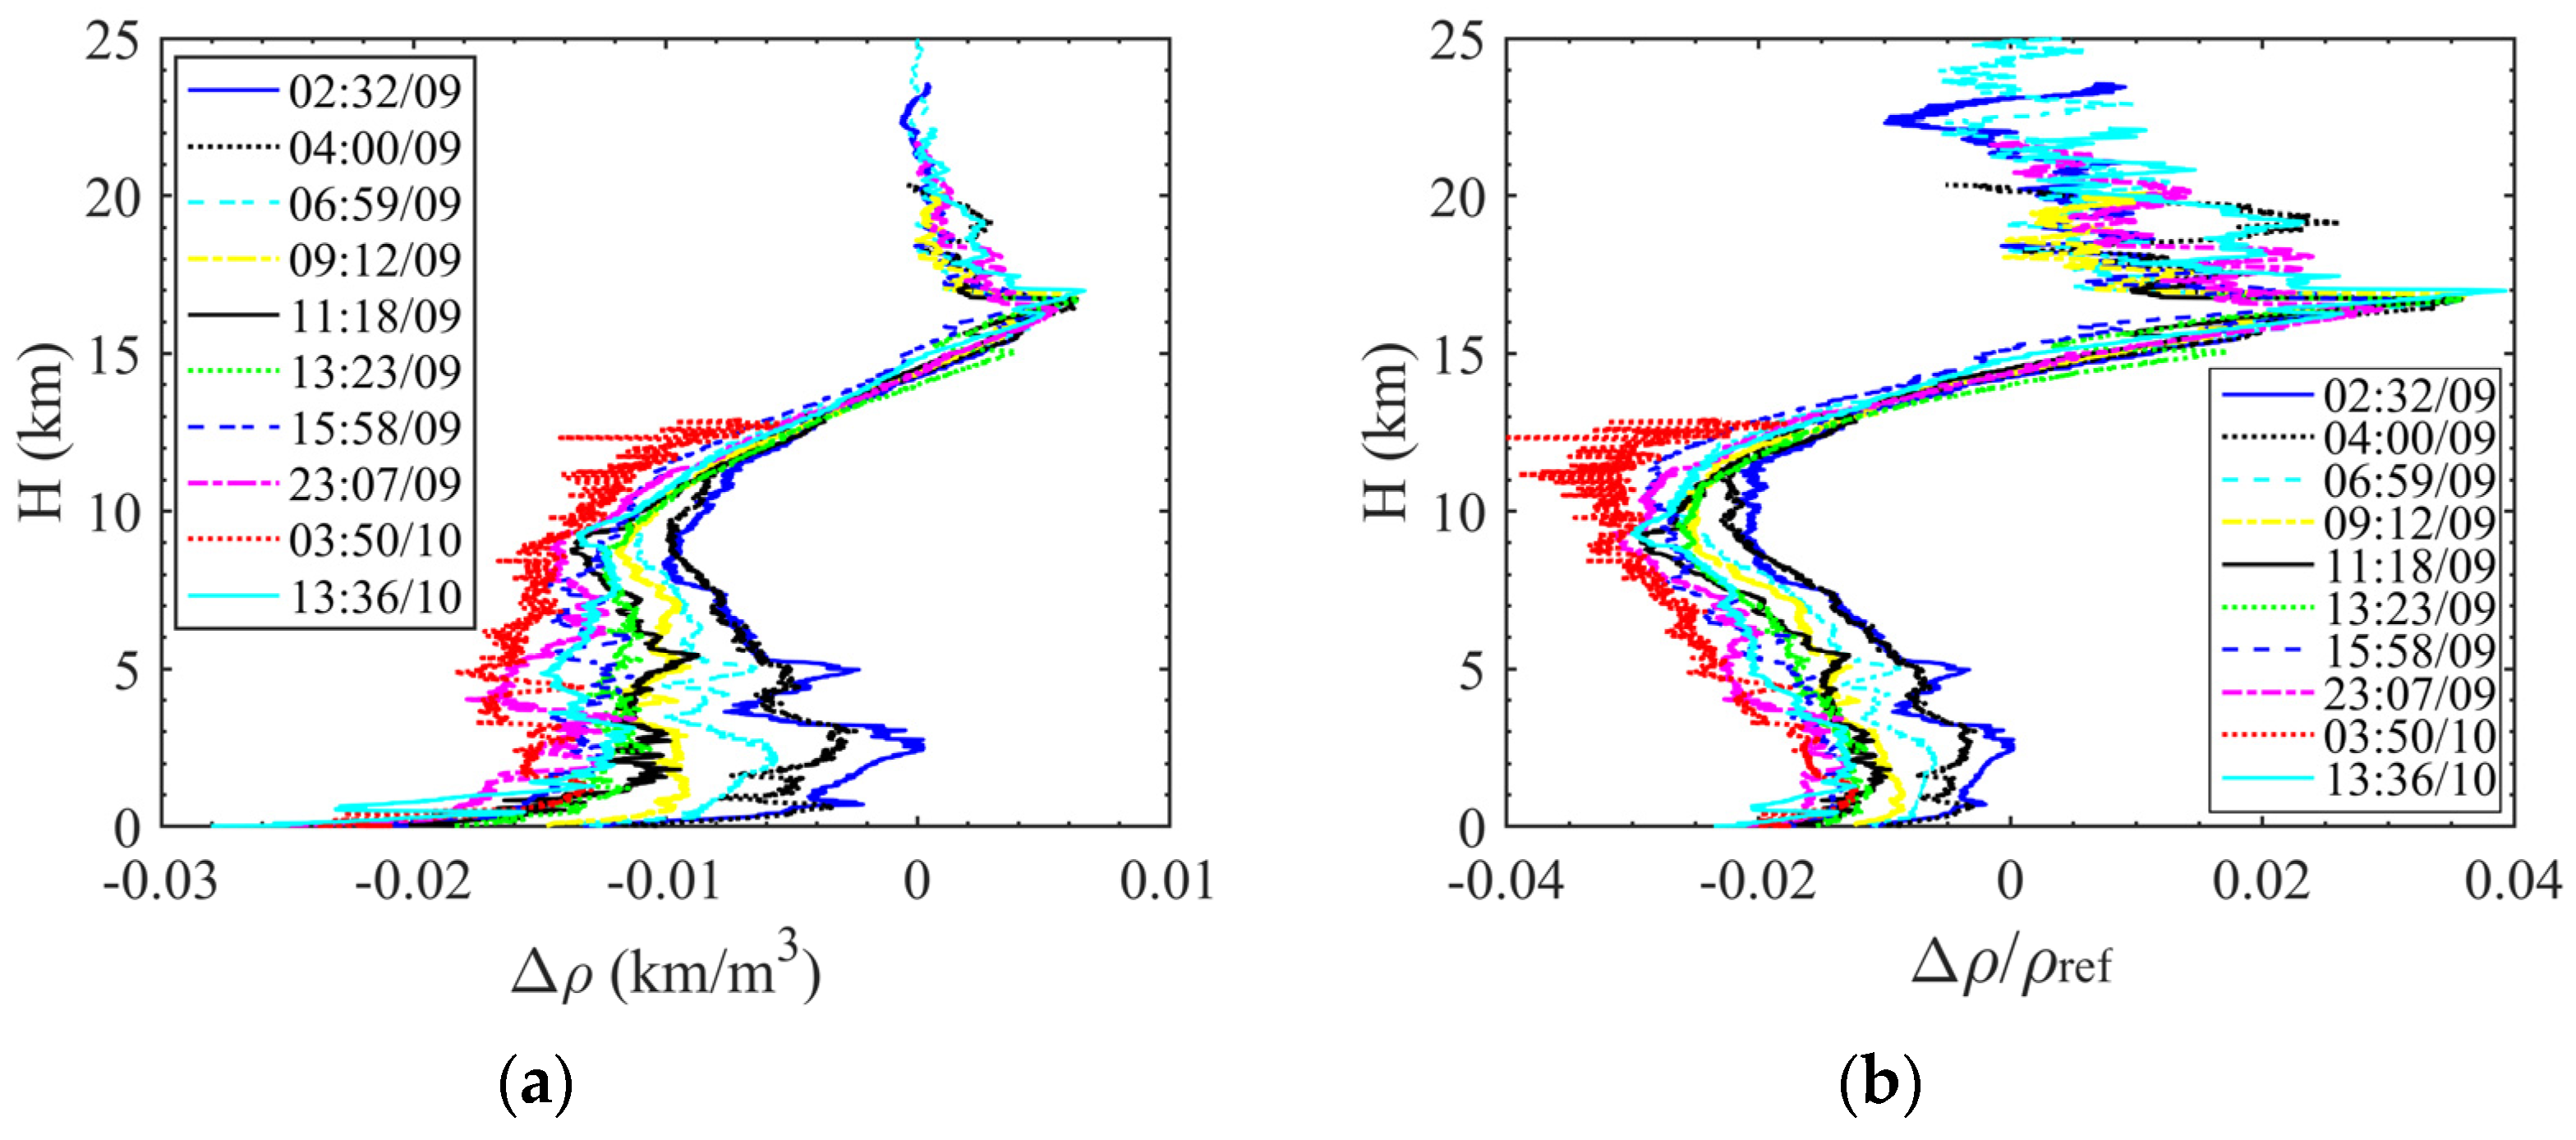
3.3. Warm-Core like Structure of TC Rainband

The warm-core structure is regarded as one of the most important features that distinguishes TCs from extratropical cyclones [36]. It is caused by combined effects of diabatic heating in eyewall updrafts and dry adiabatic descents in the eye. Previous results suggested that typical warm-core features are constrained in a considerably narrow region around the inner core [10,36,37]. The warm core is commonly characterized by its strength (WCS), which is defined as the maximum perturbation of the equivalent potential temperature Δθe and the associated height (WCH) where the maximum Δθe appears. It is widely accepted that WCS positively correlates with the intensity of a TC [36,37]. Despite the numerous studies on WCH in TC inner regions, similar structures in TC rainband regions have rarely been reported.
Figure 5a shows the measured profiles of the perturbation of equivalent potential temperature θe (also called wet-equivalent potential temperature whose natural logarithm is proportional to the entropy of moist air that is conserved in a reversible moist adiabatic process; refer to [38] for details about the computational method), i.e., Δθe, for Lekima with respect to the environment. The maximum value of Δθe was found to be 25 K at a height of ~5 km (or the freezing level), which was unexpectedly large when considering that the corresponding balloon was released at a distance of ~200 km from Lekima’s center. The authors attribute the unexpectedly large value to the fact that as the storm made landfall, the inner structure of Lekima became continuously incompact [39]. Accordingly, the balloons moved closer to the TC inner core. It can also be observed in Figure 5a that there was a cold layer around the tropopause where the minimum Δθe reached −12 K. According to the TC’s potential intensity (PI) theory [40,41], the PI of a TC depends on the boundary conditions at both the air–sea interface (inflow layer) and the tropopause (outflow layer). A colder outflow layer tends to favor a more intense storm. The minimum Δθe observed in this study was comparable with the results reported in [22] for Typhoon Hato (1713).
As θe depends directly upon atmospheric temperature (i.e., dry-bulb temperature), pressure and humidity, to further understand the distribution features of Δθe, it is helpful to analyze the characteristics of these contributing factors. Figure 5b–d, respectively, shows the vertical profiles of perturbation of dry-bulb temperature, potential temperature, and relative humidity for Typhoon Lekima with respect to the environment. As demonstrated, the maximum and minimum values of ΔT were 10 and −6 K, respectively, and appeared at ~12 and 17 km, respectively. At the height around 5 km, which corresponded to the maximum Δθe, the maximum ΔT was only 3 K. The results of potential temperature, which involved the effects of pressure on the temperature of dry air, demonstrated that maximum and minimum values of Δθ were 15 and −12 K, respectively, and appeared at the same heights for the case of ΔT. On the other hand, the maximum Δθ measured at 5 km was 5 K. These results suggest that the drop of Δθe at the colder layer around the tropopause could be fully explained by the behaviors of T and P, but these two factors only partially contributed to the warm-core like structure. Figure 5d shows that the contrast of RH between the typhoon and the environment was most evident in the range of 5–10 km. Therefore, the major factor affecting the warm-core like structure in the rainband region of Lekima was humidity.
Some insights can be drawn for the pressure field through studying the warm-core-like features of the typhoon. It is straightforward that the atmospheric pressure can be attributed to an accumulated effect of air density along altitude above the study site. Because warm-core structures affect the spatial distribution of air density (ρ), they should dominate the characteristics of TC pressure fields. Figure 6 plots the profiles of the contrast of air density between Lekima (ρ), the environment (ρref), i.e., Δρ= ρρref, and the normalized contrast, i.e., Δρ/ρref. As demonstrated, the lightest and heaviest TC flows with respect to the environment were located at 10 and 17 km, respectively. It was also found that TC air masses below ~15 km were lighter than the environment, while above this level, the situation was the opposite. These results specifically explain why uprising flows from relatively lower altitudes inside a TC cannot ascend beyond the outflow layer.

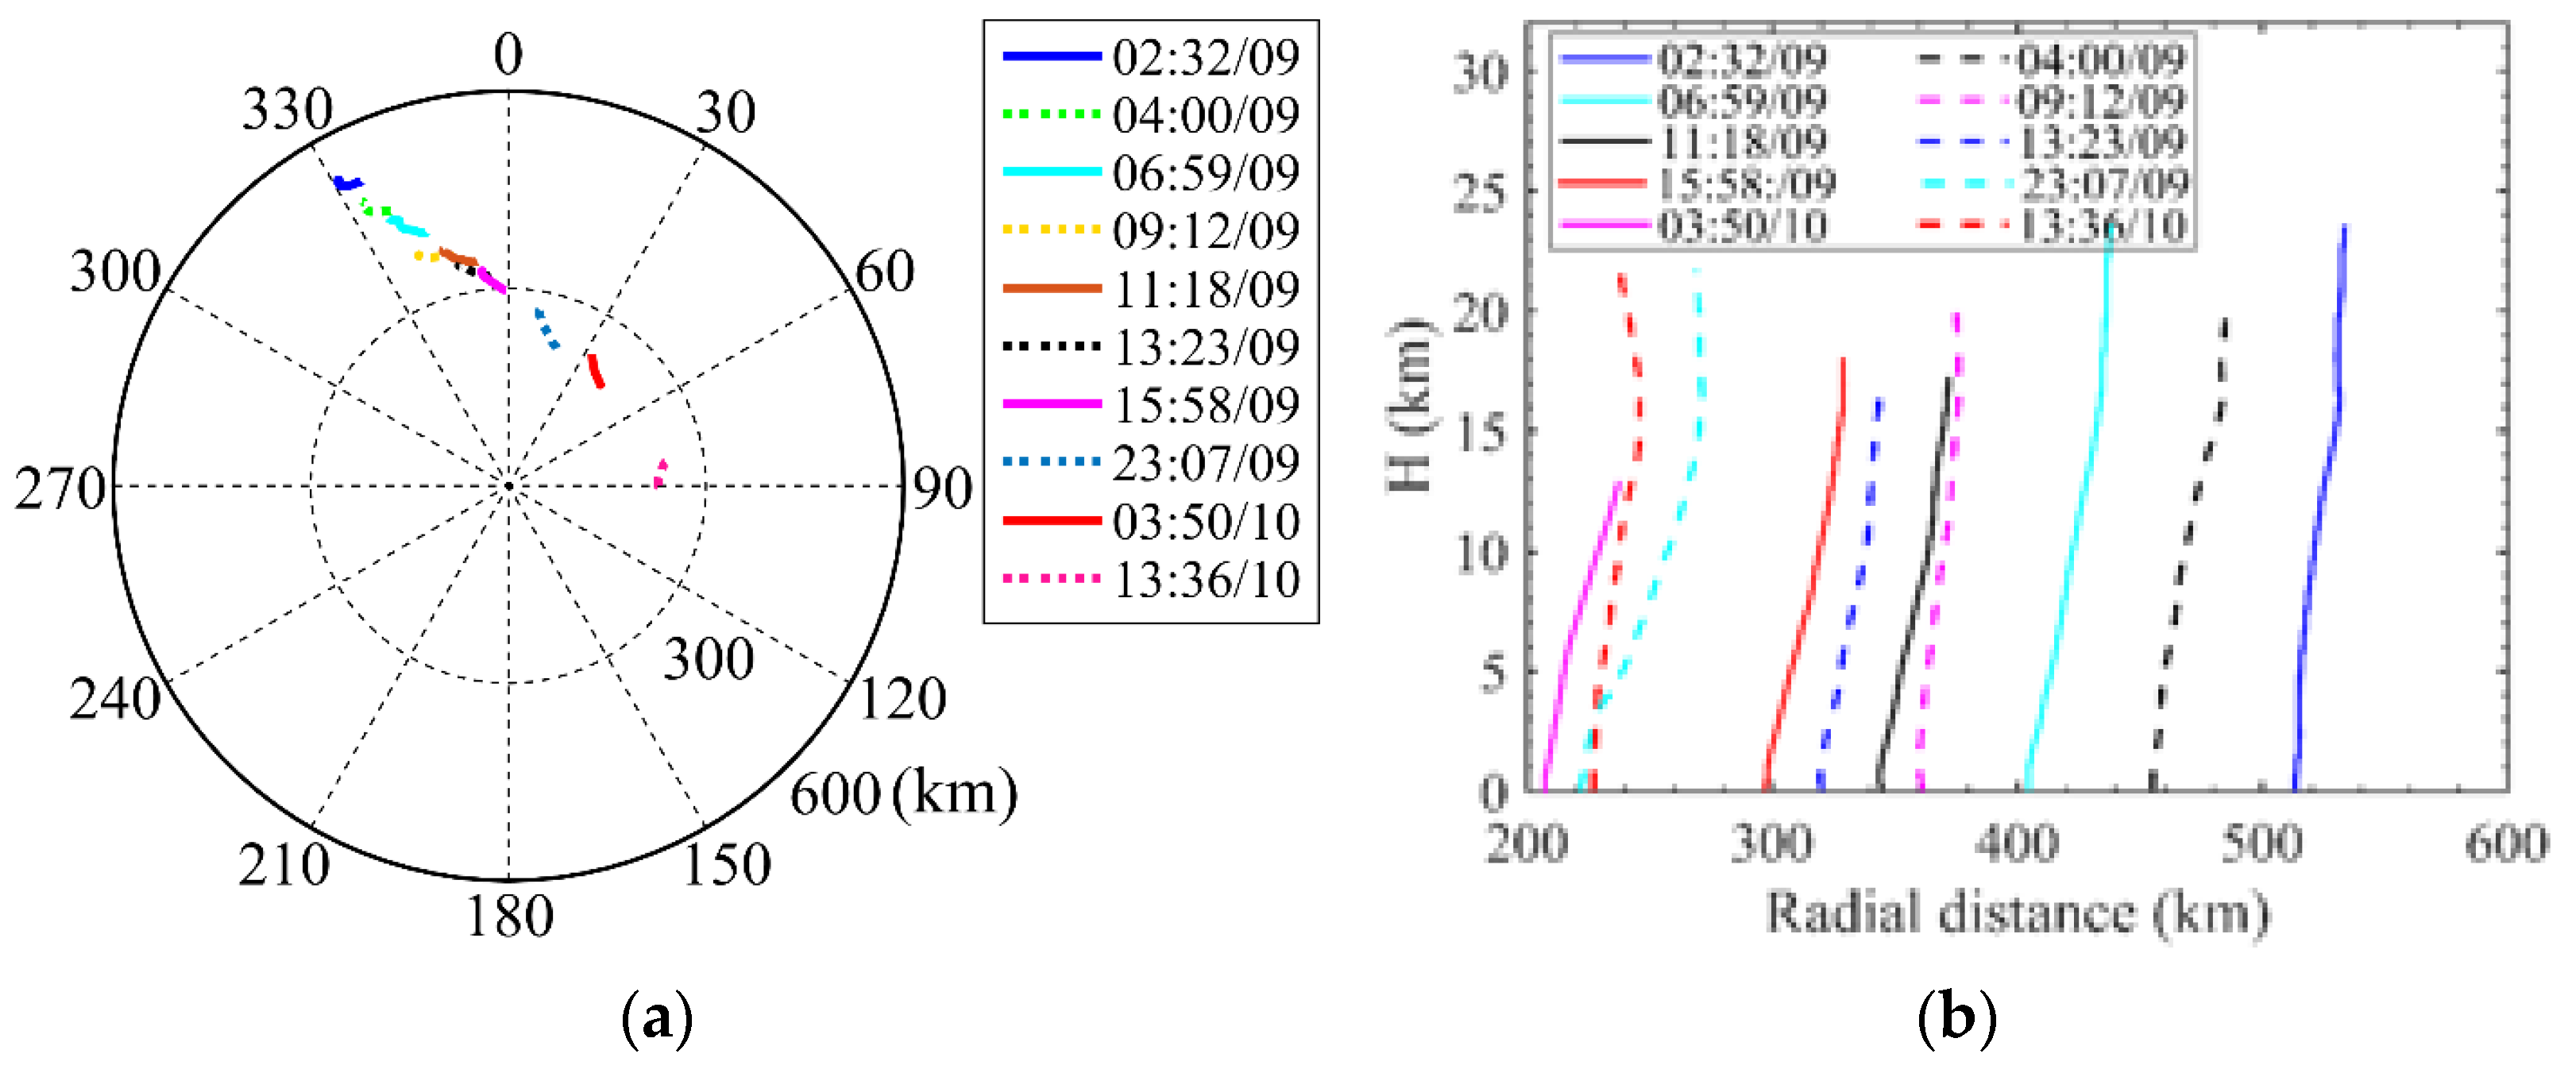
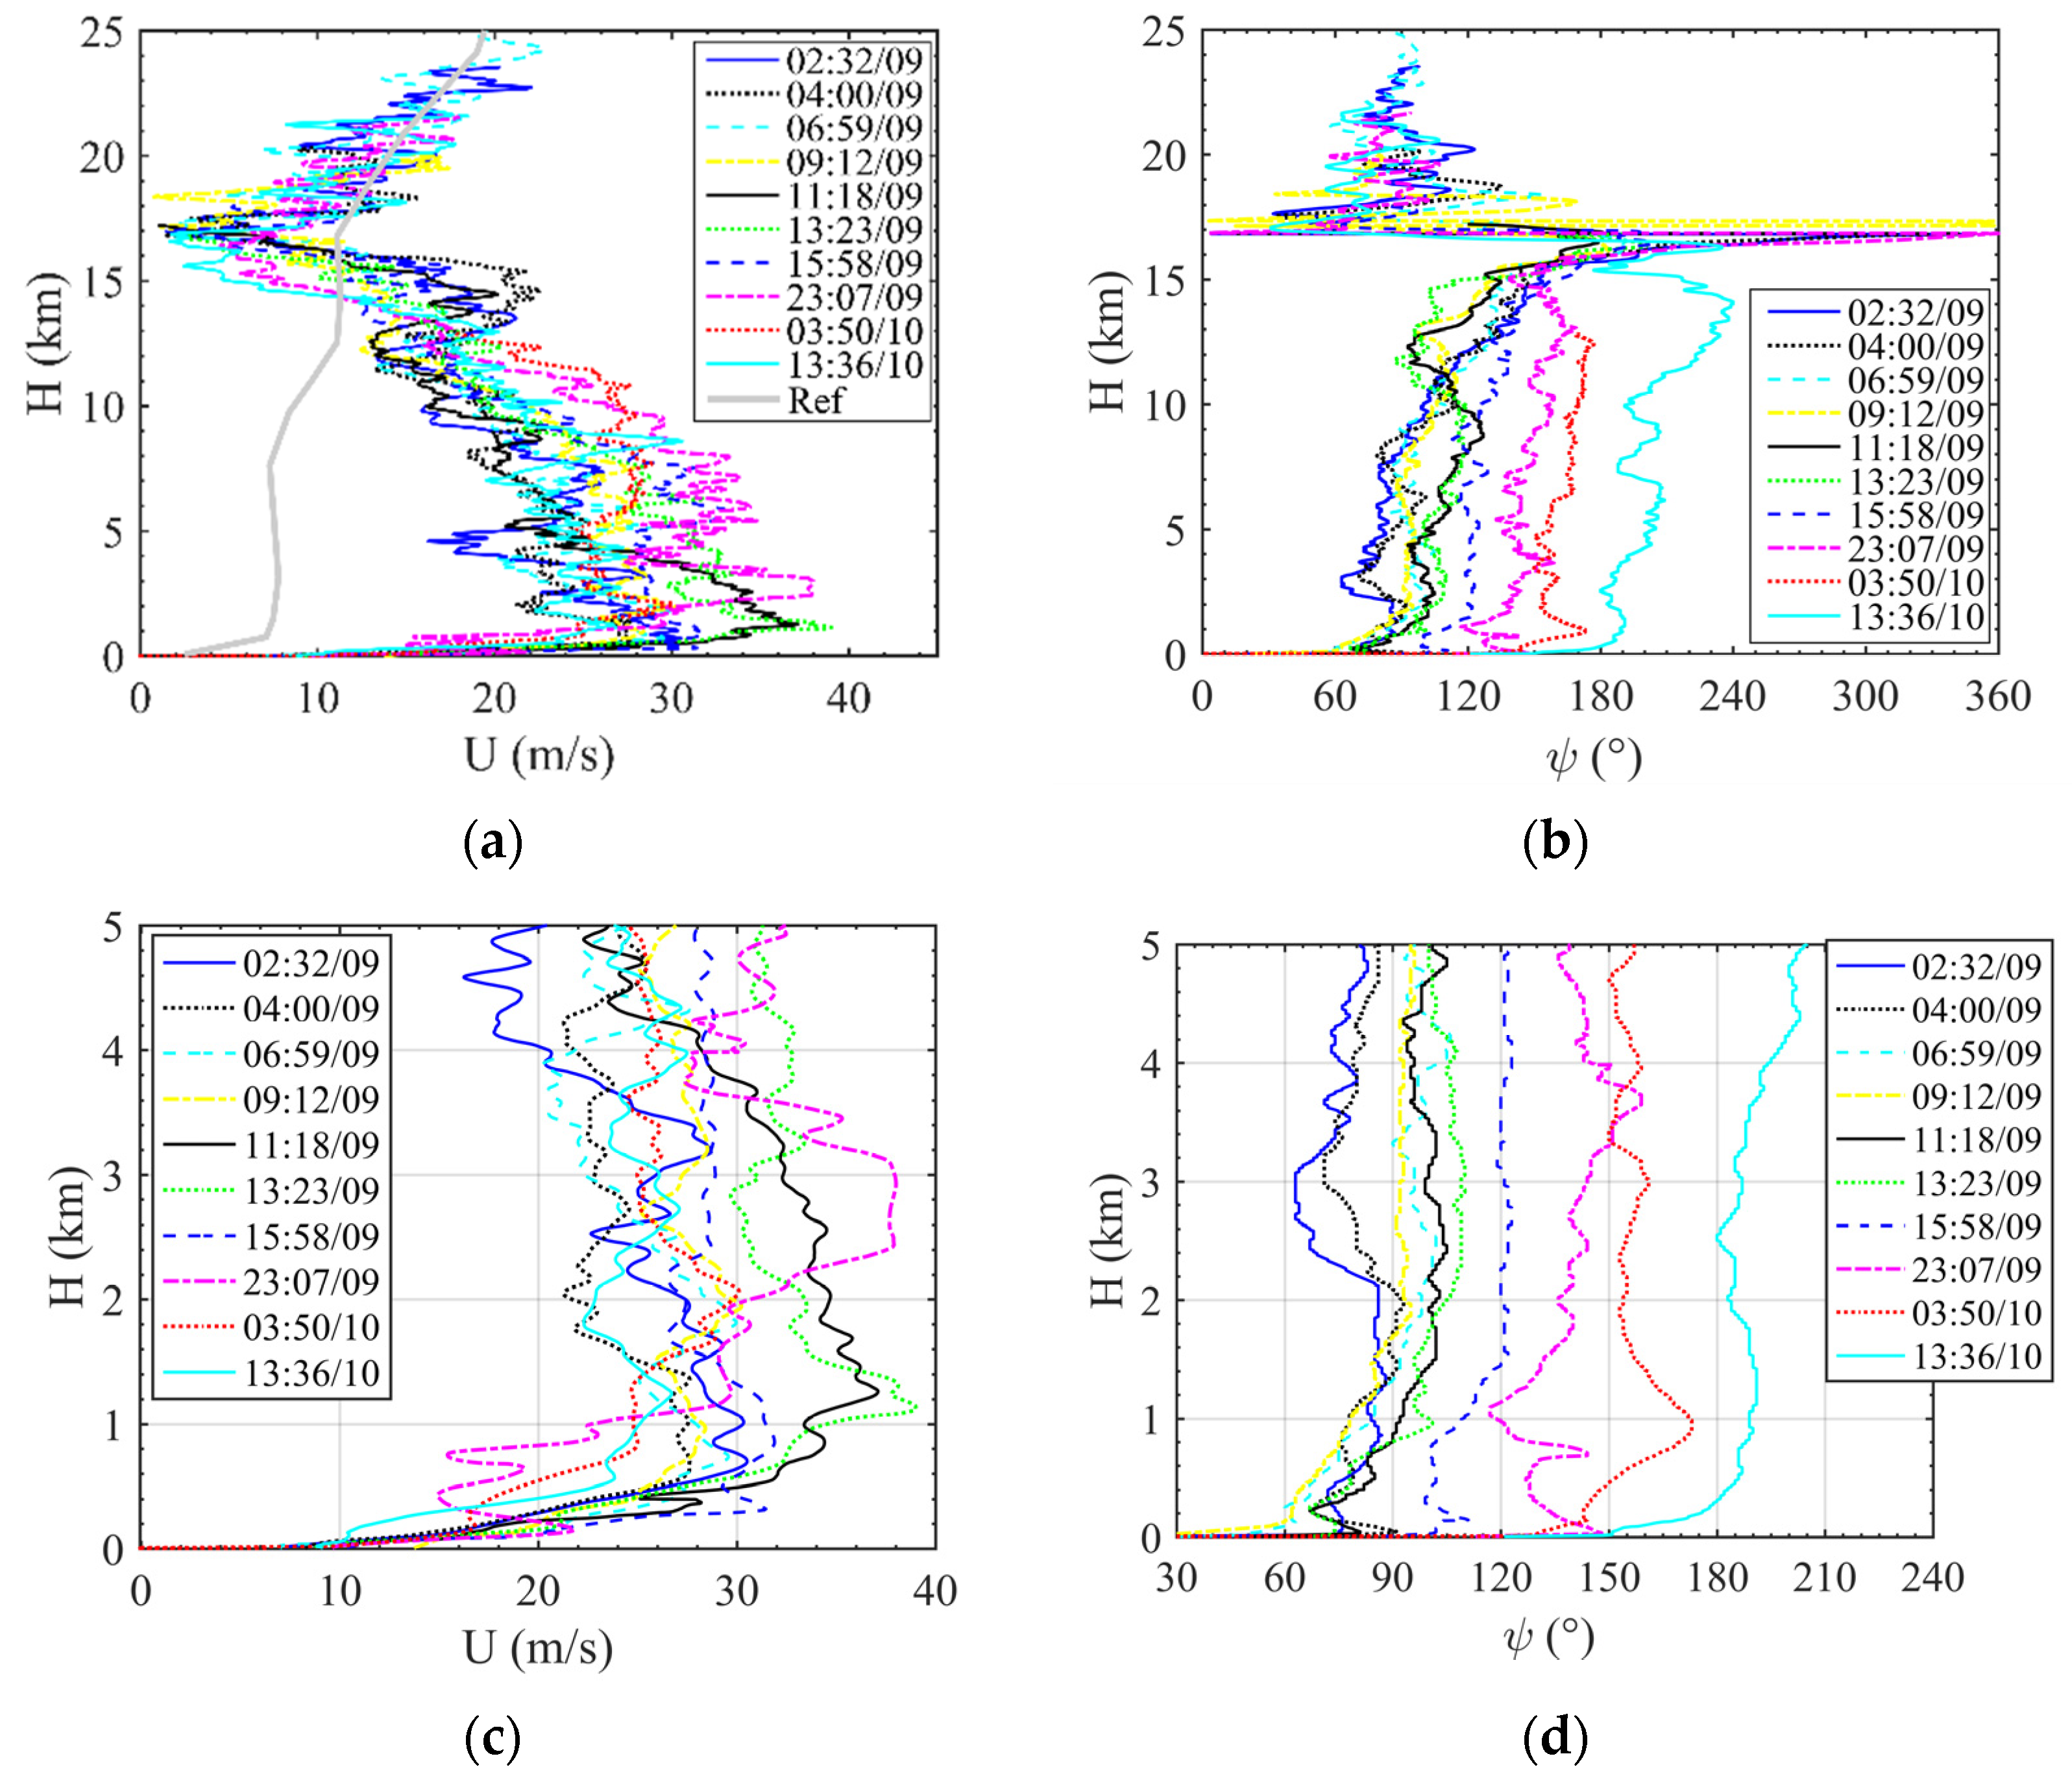
3.4. Wind Characteristics

The results of the instantaneously sampled horizontal wind speed (U) and direction (ψ) evaluations are depicted in Figure 7. It is seen that the TC boundary layer occupied the lowest ~1 km depth of the troposphere where wind shears were evident. Low-level jets (LLJs) of wind speed profiles could be also found around 1 km in some profiles (e.g., at 02:32/9 and 11:18/9). Actually, extensive studies have been conducted on LLJs associated with TC eyewalls. However, rainband LLJs differ from eyewall LLJs in associated generation mechanisms. It is speculated that rainband LLJs are caused by the convective motions of overturning updraft and/or the inner-edge downdraft in a principal rainband [42].
Beyond the TC boundary layer, the measured wind speeds consistently decreased with the increase of altitude below the tropopause (~17 km), where the TC wind became considerably weak. It was also noticed that wind speed profiles in the portion of 13–17 km were featured by strong wind shears in terms of both speed and direction. Apparently, the outflow layer served as a transition zone where TC atmospheric flows were adapted to the bottom of the stratosphere.

4. Summary and Conclusions

An observational study on the thermodynamic and kinematic structures of Super Typhoon Lekima, mainly based on the samplings from 10 radiosonde balloons released at different passage periods of the typhoon, has been presented in this article. Observations from a weather radar were presented first. It was seen that the study site was directly influenced by the upstream primary rainband of the typhoon. Thus, measurements from the released balloons were able to reveal some typical features of Lekima’s rainbands. Meanwhile, the radar results demonstrated that the typhoon contained a concentric eyewall structure that did not disappear until the storm made landfall.
The characteristics of the pressure field, warm-core like structure, and vertical wind profiles outside the inner region of the typhoon were then investigated based on radiosonde data. It was found that the pressure deficit ΔP linearly decreased with increasing altitude below the outflow layer, while the decreasing rate (i.e., the slope of the profile of ΔP) linearly increased with the increase of pressure deficit at mean sea level ΔP0. A height-resolving model was established to quantify both the radial and height dependence of TC pressure fields. For the warm-core like structure of the rainband, the maximum perturbation of equivalent potential temperature Δθe was found to be 25 K, which was located at 5 km. By contrast, the minimum Δθe reached −12 K, which appeared at the tropopause level. Detailed analysis revealed that the significant drop of Δθe around the tropopause could be completely explained by the behaviors of atmospheric temperature and pressure, since the values of Δθe agreed well with those of Δθ around this height. However, the major factor affecting the warm-core like structure was found to be humidity. The analysis results also indicated the density of TC atmosphere was heavier and lighter than that of the environments above and below 15 km, respectively. For the characteristics of TC wind, rainband LLJs centered around 1 km were observed. Meanwhile, wind flows at the outflow layer were found to be considerably turbulent, and those at the tropopause were found to be extremely weak.

Author Contributions

Conceptualization, J.F. and Y.H.; methodology, T.C.; software, J.T.; validation, T.C.; formal analysis, Y.H.; investigation, J.T. and P.C.; resources, J.F.; data curation, P.C.; writing—original draft preparation, Y.H.; writing—review and editing, Y.H. and T.C.; visualization, J.T.; supervision, J.F.; project administration, Y.H.; funding acquisition, J.F. and Y.H.; All authors have read and agreed to the published version of the manuscript.

Funding

The work described by this study was supported by three grants from the National Natural Science Foundation of China (Grant No.: 51925802, 52178465 and 51878194), and the 111 Project of China (Grant No.: D21021).

Institutional Review Board Statement

Not applicable.

Informed Consent Statement

Not applicable.

Data Availability Statement

Data sets generated or analyzed in this study are available upon reasonable request of the corresponding author.

Acknowledgments

The authors would like to express their gratitude to the Shanghai Typhoon Institute for the provision of wind data records and the permission to use the data for this study.

Conflicts of Interest

The authors declare no conflict of interest.

References

  1. Pietras, J. Hurricane Katrina; Infobase Publishing: New York, NY, USA, 2008. [Google Scholar]
  2. Cao, S.; Tamura, Y.; Kikuchi, N.; Saito, M.; Nakayama, I.; Matsuzaki, Y. Wind characteristics of a strong typhoon. J. Wind Eng. Ind. Aerod. 2009, 97, 11–21. [Google Scholar] [CrossRef]
  3. Li, Q.S.; He, Y.C.; He, Y.H.; Zhou, K.; Han, X.L. Monitoring of wind effects of a landfall typhoon on a 600 m high skyscraper. Struct. Infrastruct. Eng. 2019, 15, 54–71. [Google Scholar] [CrossRef]
  4. Song, L.; Chen, W.; Wang, B.; Zhi, S.; Liu, A. Characteristics of wind profiles in the landfalling typhoon boundary layer. J. Wind Eng. Ind. Aerod. 2016, 149, 77–88. [Google Scholar] [CrossRef]
  5. Balderrama, J.A.; Masters, F.J.; Gurley, K.R.; Prevatt, D.O.; Aponte-Bermudez, L.D.; Reinhold, T.A.; Pinelli, P.J.; Subramanian, C.S.; Schiff, S.D.; Chowdhury, A.G. The Florida Coastal Monitoring Program (FCMP): A review. J. Wind Eng. Ind. Aerod. 2011, 99, 979–995. [Google Scholar] [CrossRef]
  6. Wang, X.J.; Li, Q.S.; Yan, B.W.; Li, J.C. Field measurements of wind effects on a low-rise building with roof overhang during typhoons. J. Wind Eng. Ind. Aerod. 2018, 176, 143–157. [Google Scholar] [CrossRef]
  7. Bell, M.M.; Lee, W.C. Objective tropical cyclone center tracking using single-Doppler radar. J. Appl. Meteorol. Climatol. 2012, 51, 878–896. [Google Scholar] [CrossRef] [Green Version]
  8. Li, X.F.; Zhang, J.A.; Yang, X.F.; Pichel, W.G.; Demaria, M.; Long, D.; Li, Z.W. Tropical cyclone morphology from spaceborne synthetic aperture radar. Bull. Am. Meteorol. Soc. 2013, 94, 215–230. [Google Scholar] [CrossRef] [Green Version]
  9. Hawkins, H.F.; Rubsam, D.T. Hurricane Hilda, 1964: II. Structure and budgets of the hurricane on October 1, 1964. Mon. Weather Rev. 1968, 96, 617–639. [Google Scholar] [CrossRef]
  10. Hawkins, H.F.; Imbembo, S.M. The structure of a small, intense hurricane-Inez 1966. Mon. Weather Rev. 1976, 104, 418–442. [Google Scholar] [CrossRef] [Green Version]
  11. He, Y.C.; Chan, P.W.; Li, Q.S. Observations of vertical wind profiles of tropical cyclones at coastal areas. J. Wind Eng. Ind. Aerod. 2016, 152, 1–14. [Google Scholar] [CrossRef]
  12. Hence, D.A.; Houze, R.A. Vertical structure of hurricane eyewalls as seen by the TRMM Precipitation Radar. J. Atmos. Sci. 2011, 68, 1637–1652. [Google Scholar] [CrossRef] [Green Version]
  13. Hence, D.A.; Houze, R.A. Vertical structure of tropical cyclones with concentric eyewalls as seen by the TRMM Precipitation Radar. J. Atmos. Sci. 2012, 69, 1021–1036. [Google Scholar] [CrossRef] [Green Version]
  14. Hence, D.A.; Houze, R.A. Vertical structure of tropical cyclone rainbands as seen by the TRMM Precipitation Radar. J. Atmos. Sci. 2013, 69, 2644–2661. [Google Scholar] [CrossRef] [Green Version]
  15. Franklin, J.L.; Black, M.L.; Valde, K. GPS dropwindsonde wind profiles in hurricanes and their operational implications. Weather Forecast. 2003, 18, 32–44. [Google Scholar] [CrossRef]
  16. Hock, T.F.; Franklin, J.L. The NCAR GPS dropwindsonde. Bull. Am. Meteorol. Soc. 1999, 80, 407–420. [Google Scholar] [CrossRef] [Green Version]
  17. Powell, M.D.; Vickery, P.J.; Reinhold, T.A. Reduced drag coefficient for high wind speeds in tropical cyclones. Nature 2003, 422, 279–283. [Google Scholar] [CrossRef]
  18. Wang, J.H.; Yong, K.; Hock, T.; Lauritsen, D.; Behringer, D. A long-term, high-quality, high-vertical-resolution GPS dropsonde dataset for hurricane and other studies. Bull. Am. Meteorol. Soc. 2015, 96, 961–973. [Google Scholar] [CrossRef] [Green Version]
  19. Zhang, J.A.; Rogers, R.F.; Nolan, D.S. On the characteristic height scales of the hurricane boundary layer. Mon. Weather Rev. 2011, 139, 2523–2535. [Google Scholar] [CrossRef]
  20. He, Y.C.; He, J.Y.; Chen, W.C.; Chan, P.W.; Fu, J.Y.; Li, Q.S. Insights from Super-typhoon Mangkhut (1822) for wind engineering practices. J. Wind Eng. Ind. Aerod. 2020, 203, 104238. [Google Scholar] [CrossRef]
  21. Frank, W.M. The structure and energetics of the tropical cyclone Ι. Storm structure. Mon. Weather Rev. 1997, 105, 1119–1135. [Google Scholar] [CrossRef]
  22. He, Y.C.; Li, Y.Z.; Chan, P.W.; Fu, J.Y.; Wu, J.R.; Li, Q.S. A height resolving model for tropical cyclone pressure field. J. Wind Eng. Ind. Aerod. 2019, 186, 84–93. [Google Scholar] [CrossRef]
  23. Frank, W.M. Large-scale characteristics of tropical cyclones. Mon. Weather Rev. 1982, 110, 572–586. [Google Scholar] [CrossRef]
  24. Chan, J.C.L. Identification of the steering flow for tropical cyclone motion from objective analyzed wind fields. Mon. Weather Rev. 1985, 113, 106–116. [Google Scholar] [CrossRef]
  25. Prive, N.; Errico, R.M. The impact of increased frequency of rawinsonde observations on forecast skill investigated with an observing system simulation experiment. Mon. Weather Rev. 2014, 142, 1823–1834. [Google Scholar] [CrossRef]
  26. Duran, P.; Molinari, J. Upper-tropospheric low Richardson number in tropical cyclones: Sensitivity to cyclone intensity and the diurnal cycle. J. Atmos. Sci. 2016, 73, 545–554. [Google Scholar] [CrossRef]
  27. Wang, Y.Q. How do outer spiral rainbands affect tropical cyclone structure and intensity? J. Atmos. Sci. 2009, 66, 1250–1273. [Google Scholar] [CrossRef]
  28. Didlake, A.C., Jr.; Houze, R.A. Dynamics of the stratiform sector of a tropical cyclone rainband. J. Atmos. Sci. 2013, 70, 1891–1911. [Google Scholar] [CrossRef]
  29. Houze, R.A.; Chen, S.S.; Smull, B.F.; Lee, W.C.; Bell, M.M. Hurricane intensity and eyewall replacement. Science 2007, 316, 1235–1239. [Google Scholar] [CrossRef] [Green Version]
  30. Judt, F.; Chen, S.S. Convectively generated potential vorticity in rainbands and formation of the secondary eyewall in Hurricane Rita of 2005. J. Atmos. Sci. 2010, 678, 3581–3599. [Google Scholar] [CrossRef]
  31. Donaher, S.; Albrecht, B.A.; Fang, M.; Brown, W. Wind profiles in tropical cyclone stratiform rainbands over land. Mon. Weather Rev. 2013, 141, 3933–3949. [Google Scholar] [CrossRef] [Green Version]
  32. Kepert, J.D. The boundary layer dynamics of tropical cyclone rainbands. J. Atmos. Sci. 2018, 75, 3777–3795. [Google Scholar] [CrossRef]
  33. Zhou, X.Q.; Wang, B. Mechanism of concentric eyewall replacement cycles and associated intensity change. J. Atmos. Sci. 2011, 68, 972–988. [Google Scholar] [CrossRef] [Green Version]
  34. Holland, G.J. An analytic model of the wind and pressure profiles in hurricanes. Mon. Weather Rev. 1980, 108, 1212–1218. [Google Scholar] [CrossRef]
  35. He, Y.C.; Li, Q.S.; Chan, P.W.; Wu, J.R.; Fu, J.Y. Toward modeling the spatial pressure field of tropical cyclones: Insights from Typhoon Hato (1713). J. Wind Eng. Ind. Aerod. 2019, 184, 378–390. [Google Scholar] [CrossRef]
  36. Stern, D.P.; Nolan, D.S. On the height of the warm core in tropical cyclones. J. Atmos. Sci. 2012, 69, 1657–1680. [Google Scholar] [CrossRef]
  37. Halverson, B.J.; Simpson, J.; Heymsfield, G.; Pierce, H.; Hock, T.; Ritchie, L. Warm core structure of Hurricane Erin diagnosed from high altitude dropsondes during CAMEX-4. J. Atmos. Sci. 2006, 63, 309–324. [Google Scholar] [CrossRef]
  38. Emanuel, K.A. Atmospheric Convection; Oxford University Press: Oxford, UK, 1994; p. 580. [Google Scholar]
  39. Kepert, J.D. Tropical cyclone structure and dynamics. In Global Perspectives on Tropical Cylones—From Science to Mitigation; Chan, J.C.L., Kepert, J.D., Eds.; World Scientific: Singapore, 2010; pp. 3–53. [Google Scholar]
  40. Bister, M.; Emanuel, K.A. Low frequency variability of tropical cyclone potential intensity: 1. Interannual to interdecadal variability. J. Geophys. Res. 2002, 107, 4801. [Google Scholar] [CrossRef]
  41. Emanuel, K.A. The maximum intensity of hurricanes. J. Atmos. Sci. 1988, 45, 1143–1155. [Google Scholar] [CrossRef]
  42. Didlake, A.C., Jr.; Houze, R.A. Convective-scale downdrafts in the principal rainband of Hurricane Katrina (2005). Mon. Weather Rev. 2009, 13, 3269–3293. [Google Scholar] [CrossRef] [Green Version]
Figure 1. Path of Super Typhoon Lekima.
Atmosphere 13 00312 g001
Figure 2. Trajectories of released balloons with respect to the center of Lekima in both polar (a) and vertical profile (b) forms.
Atmosphere 13 00312 g002
Figure 3. Detections from a weather radar equipped at Taizhou station (denoted by “+”) at different times (af) when Lekima got close to the study site (denoted by the solid square). The detection covers a scope of 230 km from the radar. The results were obtained through https://bmcnoldy.rsmas.miami.edu/tropics/radar/, accessed on 13 August 2021.
Atmosphere 13 00312 g003
Figure 4. Vertical profiles of pressure deficit ΔP (a) and the correlations between the pressure deficit at MSL ΔP0 and the slope of ΔP in different portions below 10 km (b), below 12 km (c), and in the range of 5–12 km (d).
Atmosphere 13 00312 g004
Figure 5. Vertical profiles of contrast of equivalent potential temperature θe, i.e., Δθe (a); dry-bulb temperature T, i.e., ΔT (b); potential temperature θ, i.e., Δθ (c); and relative humidity RH, i.e., ΔRH (d) between Typhoon Lekima and the environment.
Atmosphere 13 00312 g005
Figure 6. Vertical profiles of the contrast of air density between Lekima (ρ) and environment (ρref), i.e., Δρ = ρρref (a), and the relative contrast, i.e., Δρ/ρref (b).
Atmosphere 13 00312 g006
Figure 7. Vertical profiles of horizontal wind speed (U) and direction (ψ) within the whole detection range (a,b), and zoom-in views of results in 0–5 km (c,d).
Atmosphere 13 00312 g007
Table 1. Information of radiosonde balloons released during the passage of Lekima.
No.Release (HH:MM/DD)Maximum
Height (km)
Radial
Distance (km)
Drift Distance (km)
StartEndToward NToward WResultant
102:32/0903:35/0923.55073.76464
204:00/0905:00/0920.34519.66162
306:59/0908:12/0929.0404117980
409:12/0910:14/0920.13626.17272
511:18/0912:11/0917.2346186568
613:23/0914:08/0916.9322186062
715:58/0916:41/0918.0300324757
823:07/0900:07/1021.7221564572
903:50/1004:33/1012.9198561758
1013:36/1014:34/1022.220049−1250
Publisher’s Note: MDPI stays neutral with regard to jurisdictional claims in published maps and institutional affiliations.

