Article

Numerical Investigation of Climate Change Effects on Storm Surges and Extreme Waves on Canada’s Pacific Coast

National Research Council of Canada, Ottawa, ON K1A 0R6, Canada
*
Author to whom correspondence should be addressed.
Atmosphere 2022, 13(2), 311; https://doi.org/10.3390/atmos13020311
Submission received: 20 January 2022 / Revised: 9 February 2022 / Accepted: 10 February 2022 / Published: 12 February 2022

Abstract

:
Storm surges and waves are key climate-driven parameters affecting the design and operation of ports and other infrastructure on the coast. Reliable predictions of future storm surges and waves are not yet available for the west coast of Canada, and this data gap hinders effective climate risk assessment, planning and adaptation. This paper presents numerical simulations of storm surges and waves in British Columbia coastal waters under a future climate (Representative Concentration Pathway) scenario (RCP8.5). The numerical models were first forced by wind and surface pressure fields from the ERA-5 global reanalysis, and calibrated and validated using historical wave and water level records. The models were then driven by atmospheric data from four regional climate models (RCMs) to investigate potential changes in the frequency and magnitude of storm surges and extreme waves over the 21st century. The model outputs were analyzed to determine the potential impacts of climate change on storm surges and wave effects at key ports and transportation assets in western Canada. The study is the first of its kind to utilize unstructured, computational models to simulate storm surges and waves for the entire western Canada coastal region, while maintaining the high spatial resolution in coastal sub-basins needed to capture local dynamic responses.

1. Introduction

The frequency and magnitude of extreme high water levels influences the maintenance and operational resilience of ports and harbors, affecting cargo-handling and berthing downtime, navigation risks and safety, spill risk and response capacity, and the exposure/resilience of ships and port structures to coastal hazards (waves, currents, flooding, erosion, and tsunami). Extreme water levels (to which storm surge is often a major contributor) and wave action are primary considerations for the planning and design of new port facilities, and expansion or adaptation of existing facilities in British Columbia [1,2,3]. Extreme water levels and waves are also significant factors contributing to regional flood and erosion risks to other types of transportation infrastructure on Canada’s west coast, including the low-lying Vancouver International Airport, roads, bridges and rail systems [4,5,6,7].
Climate change poses risks to ports and maritime operations in western Canada, along with vital connecting infrastructure and global supply-chain networks [8]. It is broadly accepted that climate change and local land subsidence will lead to higher relative mean water levels on much of Canada’s coasts, including British Columbia [9,10,11]. Less is known about potential changes in the frequency and intensity of storm surges and wave effects, which are significant factors contributing to flooding, damage to coastal infrastructure, and disruption of maritime activities [6,7,12,13]. In particular, disruption of maritime transportation activities can have damaging consequences for many coastal and island communities in the region, which are reliant on this mode of transport for supply of essential goods [14,15]. The storm surge and wave climates in Canada’s Pacific region are dominated by extra-tropical storms that primarily occur in the months of October through March [16,17]. These cyclones form at mid-latitudes in the North Pacific Ocean and tend to turn northward as they mature and decay as they move eastward [18]. The dominant landfall region is on the British Columbia, Washington and Oregon coasts [19]. Coastal storm damages and flood hazards are generally most severe when high waves coincide with high water levels [12,19], which include contributions from superimposed tides, regional fluctuations in mean sea level, and storm surges. The inverse barometer effect (i.e., the rise in water level accompanying a fall in sea-level pressure) is the dominant driver of storm surges in the Northeast Pacific [19,20], with secondary contributions by wind effects, currents, and their interactions with shorelines and bathymetry [19,21]. Regional mean sea levels and storminess are influenced by Pacific Ocean climate variability patterns that are superimposed on a variety of timescales, ranging from multi-decadal to inter-annual. Inter-annual variability in regional mean sea levels is predominantly driven by El Niño-La Niña Southern Oscillation (ENSO) and Pacific Decadal Oscillation (PDO) patterns [19,22]. In particular, El Niño events are correlated with lower sea-level pressures, elevated regional water levels, increased storm surges, increased wave energy fluxes, shifts in wave directions, and anomalously high rates of coastal erosion in the Northeast Pacific during winter [19,22]. Khandekar and Swail [14] highlighted the risk to maritime activities arising from storm waves in Canada’s Pacific region, as demonstrated by five fatalities and the sinking of several fishing boats during a particularly severe storm in October 1984. More than 100 shipping containers were dislodged from a cargo ship off the coast of Victoria in October 2021 [23], and stormy conditions hindered firefighting and recovery of the containers at the scene. The vulnerability of coastal communities and infrastructure to storm surge and wave-driven hazards is, however, highly variable across the region [14]; depending on factors, such as exposure (contrast the sheltered Strait of Georgia with the exposed west coast of Vancouver Island), coastal geomorphology (e.g., the low-lying Fraser River Delta versus the steep rock shorelines prevalent throughout the region), remoteness, population density, adaptive capacity and resilience. Forseth [13] documented observations of coastal flooding, damage to infrastructure, and erosion hazards in the greater Vancouver district (British Columbia’s most populous region) resulting from storm surge and wave events from the late 1800s through 2011. More recently, severe coastal storms coinciding with spring high tides have caused disruption and damage to coastal infrastructure in this region. For example, media reports document the destruction of White Rock’s historic pier in 2018 [24], widespread ferry cancellations in October 2021 [25], the release and sinking or grounding of 22 vessels in a November 2021 storm [26], and serious damage to the Stanley Park Seawall in January 2022 [27]. Despite an enormous contrast in population density to the Metro Vancouver region, remote northern communities in Haida Gwaii are also vulnerable to coastal storms, which cause frequent power outages, interrupted ferry services, occasional highway closures, and shortages of essential goods [14].
It is more than three decades since the first numerical investigations of storm surges in British Columbia coastal waters were completed [28]. The escalating regional risks posed by relative sea-level rise, as well as advances in numerical models, computing power, global and regional atmospheric datasets have led to recent, renewed interest in numerical simulation of storm surges in this area [12,21,29]. Soontiens et al. [12] used a three-dimensional, baroclinic Nucleus for European Modelling of the Ocean (NEMO) model of the Salish Sea to hindcast storm surge events in the Strait of Georgia. Atmospheric forcing was provided by the Canadian Meteorological Centre’s 33 km-resolution global atmospheric reforecasting model, and Environment & Climate Change Canada’s High Resolution Deterministic Prediction System [30], and applied to a curvilinear computational grid, which had a horizontal resolution of approximately 440 m by 500 m, and fixed z-layer spacing in the range 1–10 m. Soontiens et al. [12] concluded that storm-driven water level anomalies outside the Strait of Juan de Fuca are the dominant drivers of local storm surge response inside the semi-enclosed Salish Sea. Zhai et al. [21] applied the two-dimensional, barotropic Princeton Ocean Model (POM) to simulate storm surges over a much larger region of the Northeast Pacific Ocean on a structured computational grid with a resolution of approximately 7 km. The POM model was forced by hourly Climate Forecast System Reanalysis (CFSR) atmospheric data [31] to generate a 37-year storm surge hindcast. To account for baroclinic effects not captured by the barotropic model (e.g., intraseasonal and interannual fluctuations, such as those caused by the El Niño-La Niña Southern Oscillation), Zhai et al. [21] adjusted the modelled storm surges with output from the ORAS5 global ensemble reanalysis, resulting in improved agreement with water level residuals derived from tide gauge measurements. Yang et al. [29] used the three-dimensional, Finite-Volume Coastal Community Model (FVCOM), running in barotropic mode, to simulate storm surges in the Salish Sea. The model took advantage of FVCOM’s unstructured mesh capabilities to achieve characteristic horizontal resolutions as high as 200 m in areas of Puget Sound, decreasing to approximately 8 km along the open boundaries, and four sigma layers. As Yang et al. [29] pointed out, this relatively high spatial resolution allows for accurate simulation of nonlinear responses and potential amplifications of storm surges in the coastal sub-basins that are characteristic of the region. Despite the relatively high spatial resolution of their model, Yang et al. [29], like Zhai et al. [21], relied on the 0.5°-resolution (~40 km) CFSR dataset for atmospheric forcing. The resolution of the CFSR dataset is quite coarse relative to the dimensions of the Salish Sea, which is less than 40 km across at its widest point between West Vancouver and Gabriola Island. Yang et al. [29] corroborated findings by Soontiens et al. [12] that storm surges in the Salish Sea are dominated by the response to remote surges arising from storms in the Pacific Ocean, with local wind forcing representing a secondary contribution.
Despite damaging impacts of storm waves on coastal infrastructure in British Columbia [7,13], there have been comparatively few region-wide numerical studies of extreme waves. The Global Reanalysis of Ocean Waves North East Pacific (GROWFine:NEPAC) dataset, developed by Oceanweather, Inc. as a follow-on to the MSC50 Atlantic hindcast [30], is a reanalysis product providing wave spectra and parameters at 3-hourly intervals for the period 1980–2015 in waters off Canada’s west coast. The data are provided on a grid with point spacing of 0.635° (~45 km) in the east-west direction and 0.3125° (~35 km) in the north-south direction. The grid does not cover many of the sub-basins and inlets that are characteristic of coastal British Columbia (such as the Strait of Georgia), and the grid resolution is too coarse to capture nearshore wave transformation processes. The majority of published numerical investigations of wave conditions for the British Columbia region that incorporate nearshore wave processes and high resolution in coastal regions have been to assess wave energy resources [32,33,34]. Consequently, these studies have mainly focused on characterizing the mean wave climate, rather than extremes or climate change effects. Developing projections of future extreme waves and water levels at global scales is a relatively recent but active area of research [22,35,36,37]. Global climate models generally lack the high spatial resolution and complex physics needed to accurately downscale waves and storm surges in nearshore coastal waters. A few researchers have investigated climate change effects on waves and storm surges in Canadian regional waters [38,39] but, as yet, reliable projections for coastal British Columbia remain unavailable. There is low confidence in projected changes in waves and storm surges for this region, owing to limited studies and published literature specific to regional winds, a lack of quality observational data, and discrepancies between studies and output from different climate models [9]. This data gap is a barrier to effective climate risk assessment and adaptation of transportation infrastructure on Canada’s west coast.
In this paper, we describe a set of numerical models developed to simulate storm surges and extreme waves in British Columbia coastal waters. The study is the first of its kind to utilize unstructured, computational models to simulate storm surges and waves for the entire western Canada coastal region, while maintaining the high spatial resolution in coastal sub-basins needed to capture local dynamic responses. It is also one of the first attempts to utilize the ERA-5 global atmosphere-ocean reanalysis [40], which provides higher temporal and spatial resolutions and promises improved physics over previous global reanalyses, to hindcast storm surges and waves in the region. Following calibration and validation using historical observations, the models were used to develop dynamically downscaled projections of storm surges and extreme waves under a future climate scenario, also a first for the region. The projections represent a first step in addressing current knowledge gaps pertaining to climate change impacts on storm surges and extreme wave conditions in this coastal region. The data are intended to facilitate improved climate risk assessments for the many ports (e.g., Port of Vancouver, Port of Prince Rupert, Port of Nanaimo), and other transportation infrastructure on the coast (e.g., Vancouver International Airport and multiple small craft harbors), and may also prove useful to coastal hazard risk assessments for coastal communities. Figure 1 shows the location of the ports, coastal cities, wave buoys, water level stations, weather stations and straits that are discussed in the paper.

2. Input Data Processing and Analysis

2.1. Bathymetry, Water Levels and Vertical Datum

Bathymetry data were downloaded from the Canadian Hydraulic Service (CHS) non-navigational 100-m resolution (NONNA-100) online archive [41] and from the GEBCO_2020 gridded database [42] to support the development of the numerical models.
Near-continuous, hourly water level records were downloaded from the Fisheries and Oceans Canada (DFO) online archive [43], for four tide gauge stations within the model domain: Point Atkinson (Vancouver, Canada) (station identifier = 7795), Victoria (7120), Bamfield (8545), and Prince Rupert (9354). The archive contained data for all four stations that spanned at least the period 1979 to 2020. Astronomical tide predictions were generated for each station using the CHS tidal constituent database with the IOS Tidal Package [44], and then subtracted from the water level records to obtain residuals. The computed water level residuals were assumed to be primarily representative of storm surges, although it is recognized that the residuals contain signatures from other sources [1,21,29,45].
All bathymetry data and water levels were referenced vertically to mean sea level (MSL).

2.2. Waves—Observations

Hourly sea state measurements were downloaded from DFO online archives [46] for four wave buoys within the model domain: Central Dixon Entrance (station identifier = C46145), Halibut Bank (C46146), North Hecate Strait (C46183) and La Perouse Bank (C46206). The records included significant wave heights, peak wave periods and concurrent meteorological observations. All four stations were established in the late 1980s or early 1990s and the archives contained near-continuous, hourly records spanning the periods from deployment to 2020.

2.3. Waves—Reanalysis

The GROWFine:NEPAC dataset [47] was obtained by request from Fisheries and Oceans Canada, and included time series data at 3-hourly intervals for 17 wave and wind parameters, derived from a reanalysis of historical surface winds and ocean surface waves in the Northeast Pacific Ocean for the period 1980–2015 (36 years). The dataset covered much of British Columbia coastal waters and provided wind and wave parameters on a 0.625° (east-west) by 0.3125° (north-south) resolution grid.

2.4. Wind and Surface Pressure—Observations

Measured atmospheric pressure and 10-m elevation, mean (1- to 10-min average) wind velocity data for the period 1992 to 2019 were downloaded from Environment and Climate Change Canada’s online archives [48], for nine weather stations on the west coast of Canada, denoted a to i in Figure 1.

2.5. Wind and Surface Pressure—Reanalysis

Hourly, 10-m elevation wind and mean sea level pressure fields for the period 1979–2019 were downloaded from the ERA5 global reanalysis archive [40,49]. The spatial resolution of the gridded ERA5 data was 31 km. Local verification of the ERA5 pressures and wind speeds involved comparing observations from the nine weather stations to the reanalysis time series output at grid points nearest to each station. The results of the comparisons are shown in Taylor diagrams [50] in Figure 2. The Taylor diagrams provide a visual framework for comparing the atmospheric pressure and wind speed from a test dataset (ERA5) to a reference dataset (i.e., weather station observations), by simultaneously displaying multiple statistical parameters (normalized standard deviation, correlation coefficient, normalized root-mean-square error). The normalized standard deviation of the observations is shown as a red line on the Taylor diagrams. Values plotting closer to this line and near the observed point (corresponding to normalized root-mean-square errors and correlation coefficients equal to zero and one, respectively) of the Taylor diagrams indicate locations where the reanalysis shows better agreement with the weather station measurements. The statistical comparisons and inspection of time series data for significant storm events revealed that ERA5 peak wind speeds were generally underestimated, and a bias correction was therefore applied, whereby wind speeds were multiplied by a factor of 1.5. The bias-corrected data were used as input to the numerical simulations of waves and storm surges described later in this paper. The ERA5 atmospheric pressure showed good agreement to measurements at most weather stations, with the exception of some slight underestimation at Langara Island (b) and Cape St. James (d) in northern British Columbia, and was not bias-corrected.

2.6. Wind and Surface Pressure—Future Climate

Daily surface wind and pressure projections for the 21st century were downloaded from the North American Coordinated Regional Downscaling Experiment (NA-CORDEX) web archive [51]. The projections consisted of four realizations from three Regional Climate Models (RCM) for the RCP8.5 global emissions scenario [52]. The RCMs and driving Global Climate Models (GCMs) are listed in Table 1. RCM data were at 0.22° spatial resolution (approximately 25 km) on native rotated-pole grids, and at daily time intervals spanning at least the period January 2006 to December 2099. The choice of RCM realizations and emissions scenario was driven purely by the availability of surface wind and pressure data at daily temporal resolution and 0.22° spatial resolution at the time of accessing the archive.
To provide some initial insight as to potential climate change effects on storm surges and extreme waves in British Columbia coastal waters, the daily wind and surface pressure data from the RCMs were sorted by three 20-year reference periods for comparison:
  • 2006–2025—Early-century period;
  • 2031–2050—Mid-century period; and
  • 2080–2099—End-of-century period.
For each period, the 99th percentile of daily wind speed and the 99th percentile of daily low pressure were calculated, which corresponds, on average, to the top 3 daily values per year. The 99th percentile values for 2031–2050 and 2080–2099 were evaluated, and compared to baseline early-century values (2006–2025) to obtain a representative measure of projected changes in extreme surface wind speeds and pressures. The projected changes in the 99th percentile daily wind speeds (expressed as a percentage relative to early-century values) are shown in Figure 3 for mid-century and Figure 4 for end-of-century. Positive values, shown in red, indicate increases relative to the early-century period, and negative values, shown in blue, indicate decreases.
For most nearshore regions, projected changes are in the range ±5% by mid-century, relative to the baseline early-century period. In parts of northern British Columbia coastal waters (e.g., near Haida Gwaii) and off the north coast of Vancouver Island, all models show projected increases in the 99th percentile wind speeds by end-of-century, by 5–20% depending on the RCM. These changes are consistent with evidence of poleward shifts in storm tracks across Canada and globally. All RCMs show projected decreases in the 99th percentile (by as much as 10%) in some regions of the outer continental shelf at both time horizons. Mid-century projections and end-of-century projections in the Central Coast and Salish Sea (including Strait of Juan de Fuca and Strait of Georgia) regions are highly variable across RCMs in terms of the direction of changes (i.e., positive or negative). In the Salish Sea, where several commercial ports (e.g., Port of Vancouver, Port of Nanaimo) and coastal infrastructure assets are located, projected changes are all within ±5%. However, projections for semi-enclosed seas such as the Strait of Georgia are subject to uncertainty associated with poor resolution of the land-sea interface by the RCM grids and the steep, mountainous topography of coastal British Columbia.

3. Model Development, Calibration and Validation

Two models were developed to simulate storm surges and waves. Both are based on the TELEMAC system [53], a suite of software for numerical simulation of free surface hydrodynamics, waves, and sediment transport in one, two or three dimensions. The TELEMAC-2D and TOMAWAC modules were used to simulate storm surges and waves, respectively. TELEMAC-2D [54] solves the shallow-water (Saint-Venant) hydrodynamic equations using finite-element or finite-volume methods on unstructured computational meshes. TOMAWAC [55] is a third-generation spectral wave model, which describes the generation, propagation, transformation and dissipation of wind-waves in water. It uses finite-element techniques to solve the directional wave action balance equation, with sources and sinks, also on unstructured computational meshes. The fundamental processes and file types for applying both models are very similar: mesh generation, boundary conditions, use of bathymetric and meteorological datasets, and model calibration and validation.

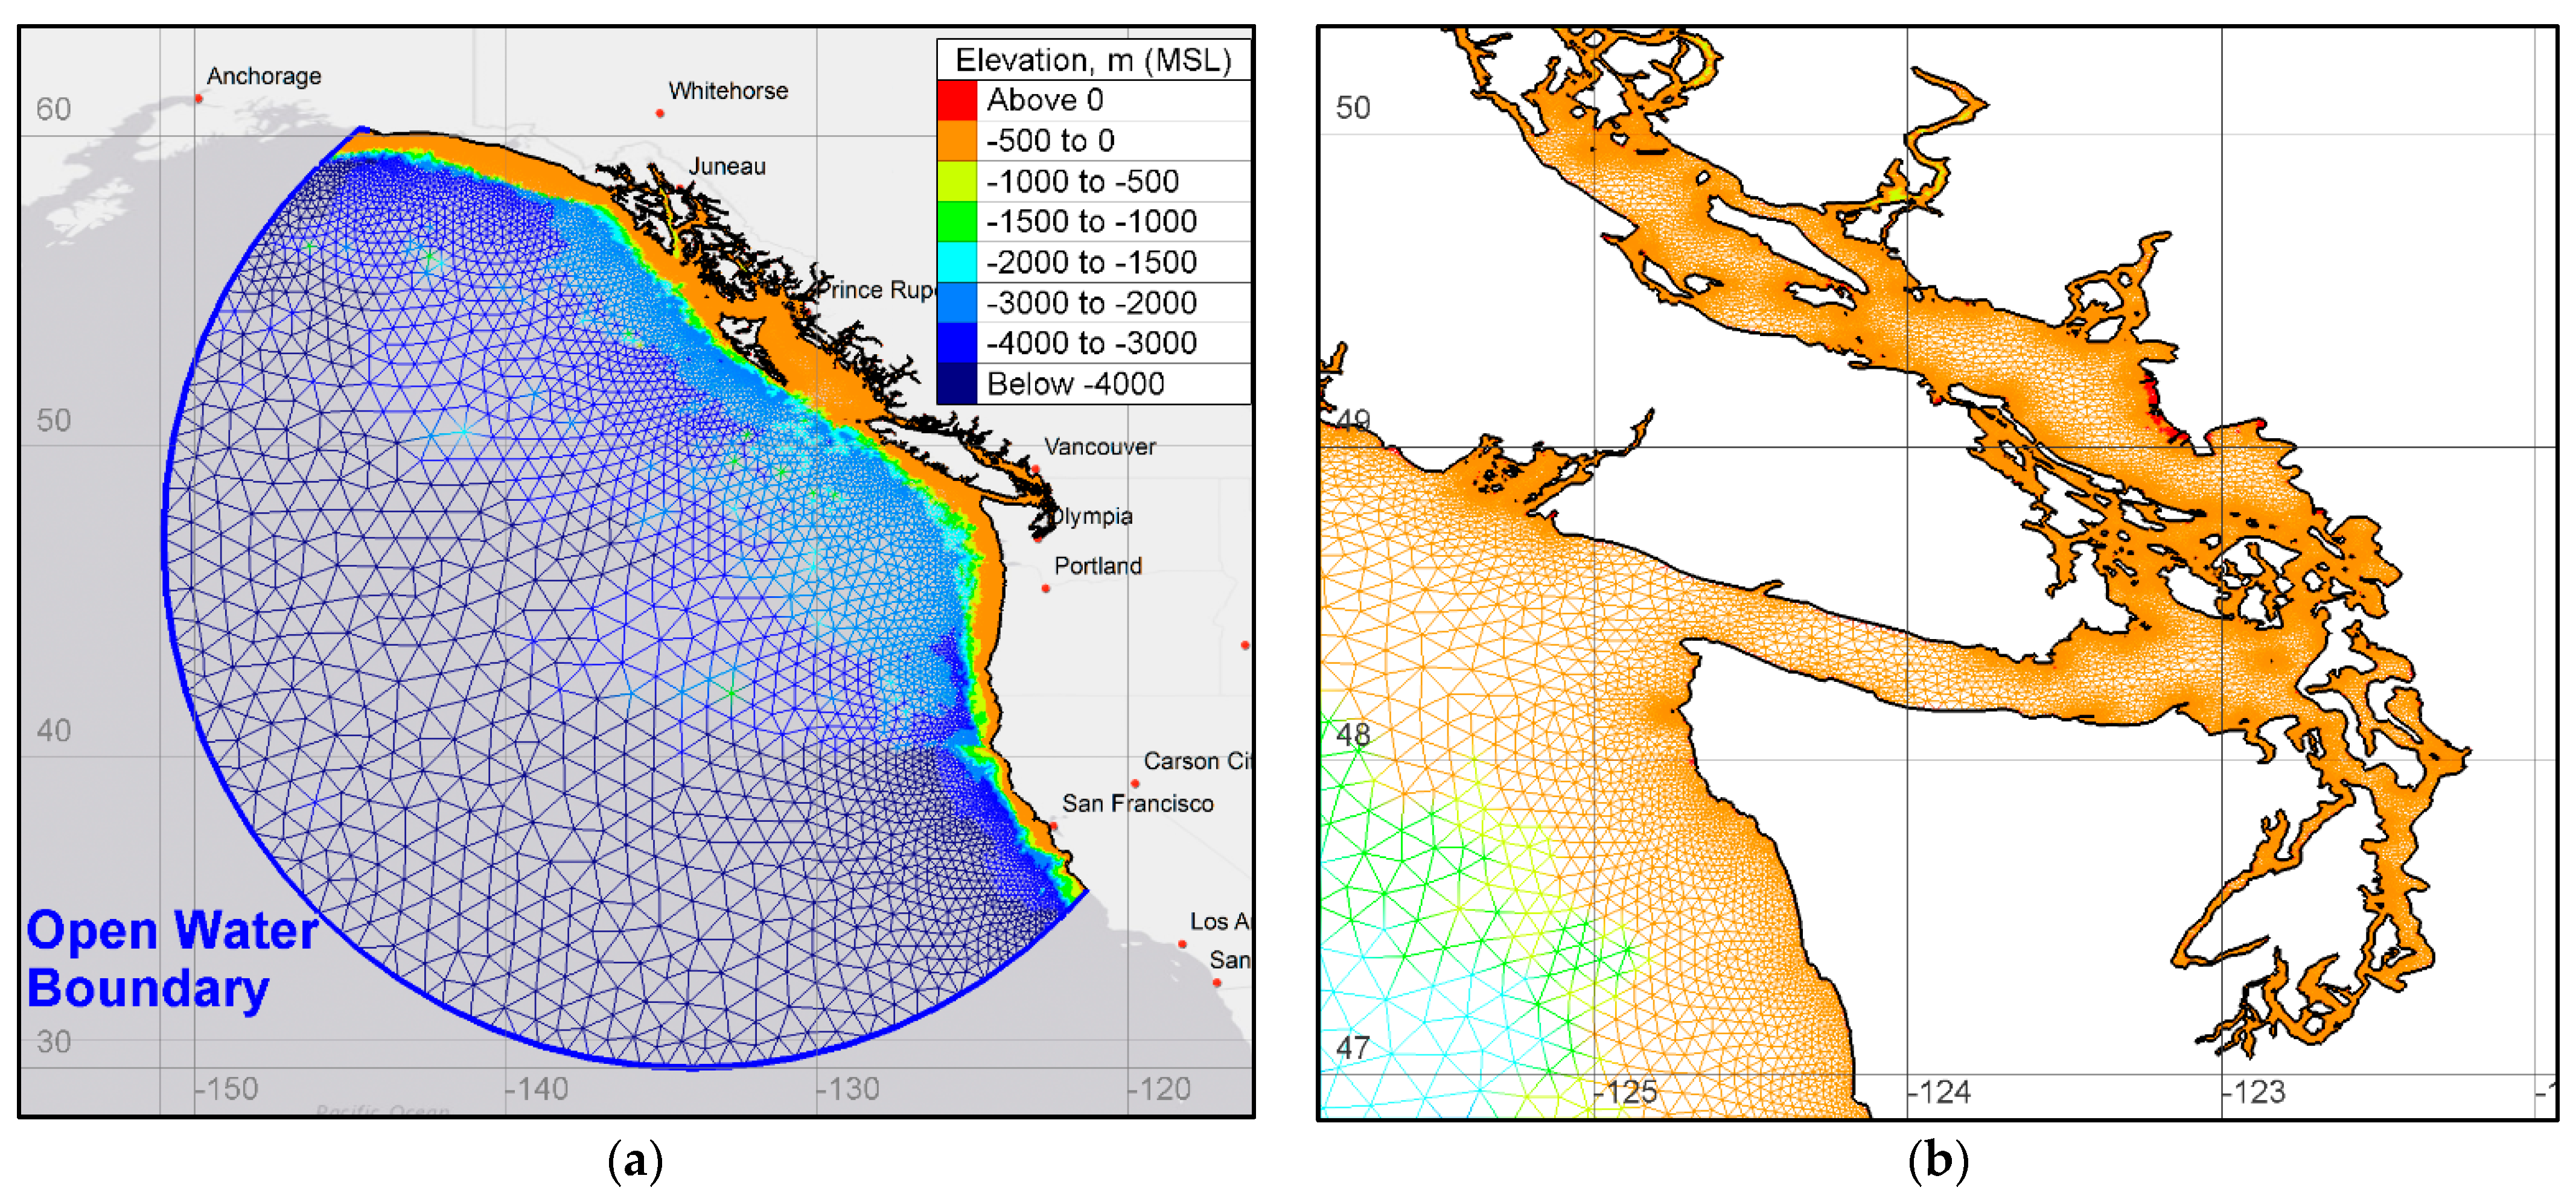
3.1. Computational Mesh and Boundary

The TELEMAC-2D and TOMAWAC model domains were set up to cover a substantial portion of the Northeast Pacific Ocean, extending more than 1700 km from the coast of British Columbia in all directions, and utilizing a spherical co-ordinate system (Figure 5). Although early iterations of the models involved smaller computational domains, the larger domains were required to fully resolve Pacific Ocean storm systems propagating towards the coast, thus implicitly capturing the remote forcing that dominates storm surges in coastal sub-basins of British Columbia [12,29]. Ultimately, the upper limit on the size of the model domain was constrained by the spatial extents of available RCM atmospheric data. The model computational mesh, as shown in Figure 5, consisted of unstructured, triangular elements, created using the open source finite element mesh generator, Gmsh [56]. The input files for Gmsh were created using Python, shoreline datasets obtained from OpenStreetMap [57], and available bathymetric datasets. Characteristic element edge lengths were automatically determined based on three criteria: shortest clear fetch length, local water depth and bathymetry gradient. The shortest clear fetch length criterion (i.e., the shortest distance between adjacent shorelines) allowed for finer mesh resolution in the bays, narrow straits, channels and fjords characteristic of coastal British Columbia, and relaxed spatial resolution in open water (offshore) regions. The bathymetry-based (depth and gradient) criteria facilitated finer mesh resolution in shallow, coastal waters and areas of steeply varying bathymetry. In total, there are 352,464 nodes and 618,205 elements in the mesh. The mesh resolution varies from 250 m near coastal assets and areas of interest to 125 km in the open ocean.
The model bathymetry was based on a digital elevation model comprising the NONNA-100 data in nearshore regions and the GEBCO_2020 data in deep water, offshore regions. Elevations were interpolated to the computational mesh nodes using the inverse distance weighting method.

3.2. Boundary Conditions

Boundary conditions applied to the storm surge and wave models consisted of open water boundary conditions and surface (atmospheric) forcing. A radiation boundary condition, based on Thompson’s method of characteristics [53], was applied to the offshore boundary of the TELEMAC-2D storm surge model. An inverse-barometer criterion was used to impose water levels along the boundary, whereby an increase in pressure by 1 millibar was accompanied by a decrease of 1 cm in water levels. Surface wind fields and atmospheric pressure from the gridded ERA-5 reanalysis (historical) and RCM (future climate) datasets were linearly interpolated to the model mesh nodes. As discussed above, the ERA-5 wind data were bias-corrected by multiplying wind speeds by a factor of 1.5 to better fit the statistics of observations at weather stations within the model domain.
The same bias-correction was applied to the RCM wind datasets. Additionally, the temporal resolution of the bias-corrected ERA-5 dataset was decreased from 1-hourly to 3-hourly to make input file sizes more manageable. This approach was justified by the results of sensitivity tests, which revealed that storm surge simulated by forcing the model with the 3-hourly data (with linear interpolation of surface boundary conditions between time intervals) were within ±1 cm of values obtained by forcing with the hourly data. The daily RCM surface wind and atmospheric pressure fields were also linearly interpolated in time and to the computational mesh nodes.
The influence of atmospheric pressure and wind was activated for all storm surge (TELEMAC-2D) simulations. A spatially and temporally varying wind drag coefficient, which parameterizes air-sea momentum transfer, was applied and calculated as a function of wind speed using the Institute of Oceanographic Sciences (UK) formulation [58]:
a = 0.565 × 10⁻³   for   U < 5 m/s
a = (−0.12 + 0.137U) × 10−3   for   5 < U < 19.22 m/s
a = 2.513 × 10⁻³   for   U > 19.22 m/s
where U is the wind speed and a is the wind surface drag coefficient (or “coefficient of wind influence”, as described in the TELEMAC user manual [54]).
The sensitivity of the storm surge predictions to bed friction was tested by varying bed friction coefficients in the TELEMAC-2D model. Manning’s roughness coefficient variations in the range 0.01 to 0.05 resulted in maximum variations in peak storm surges of ±2 cm. A Manning’s roughness coefficient of 0.025 was used for all production simulations.
Parametric (JONSWAP) wave spectra were prescribed along the open water boundary of the TOMAWAC wave model based on the GROWFine:NEPAC database for historical simulations (method 1). For future climate simulations, modelled wave data were not available. Offshore wave boundary conditions for the future climate simulations were therefore calculated as a function of the daily wind speed supplied by the RCMs, assuming Pierson–Moskowitz spectra and a fully-developed sea state condition (method 2). To assess the uncertainty associated with the (simplified) method 2 for prescribing wave boundary conditions, both methods were used to simulate three historical storm events (in December 1993, December 1996, and February 2007). Simulated significant wave heights for these three storms were compared to measurements at the four wave buoys listed in Table 2, and correlation coefficients and root-mean-square-errors (RMSE) were evaluated. As might be expected, correlation coefficients and RMSE at buoys that were relatively sheltered from ocean waves (i.e., North Hecate Strait and Halibut Bank) were insensitive to the boundary condition method. Method 1 resulted in higher correlation coefficients (by 0.02 to 0.04) and lower RMSE (by 2 to 10 cm) at buoys exposed to the open ocean. Global or Pacific Ocean basin-wide numerical simulations of waves for future climate scenarios would be required to mitigate this source of uncertainty in future studies, and supply wave boundary condition data to regional models.

3.3. TELEMAC-2D (Storm Surge) Model Input Parameters

A number of sensitivity tests were implemented where both tides and storm surges were incorporated in the model, to assess the importance of tide–surge interactions. In these tests, astronomical tidal forcing was supplied by the TPXO global tidal constituent database [59], by activating this option in TELEMAC-2D. Inclusion of the astronomical tides impacted the predicted storm surges by no more than ±3 cm, and tides were therefore excluded from production simulations, reducing the computational cost by a factor of 3. The Coriolis effect was activated for all simulations, as it had an important influence on predicted storm surges. Without considering Coriolis effects, peak storm surges were under-predicted by 10 cm, on average. The constant viscosity turbulence model parameterization was used for all simulations, applying an eddy viscosity of 10−4 m2/s. Sensitivity testing with different eddy viscosities and a Smagorinsky turbulence model parameterization revealed no discernible impacts on predicted storm surges. A constant time-step of 60 s was prescribed, resulting in Courant numbers typically below 0.5.

3.4. TOMAWAC (Wave) Model Input Parameters

The time step for the TOMAWAC model was optimized to 900 s, with larger time steps resulting in model instability. Different spectral direction and frequency resolutions were tested during the calibration process to determine the impact on computational cost and model skill. Ultimately, a spectral discretization corresponding to 16 directional bins (360 degrees) and 36 frequency bins (3 to 25 s) was selected. Physical processes, source terms and other input parameters were applied in the TOMAWAC model as follows:
  • Bottom friction-induced dissipation—Bouws and Komen [60] expression with default coefficient of 0.038;
  • Wave spectrum growth limiter—WAM 4 original limiter [61] with default parameters;
  • Whitecapping-induced dissipation—Komen and Janssen dissipation model [62,63] with default parameters;
  • Depth-induced breaking dissipation—Battjes and Janssen model [64] with default parameters; and
  • Nonlinear quadruplet interactions—Discrete Interaction Approximation (DIA) method of Hasselmann et al. [65].

3.5. Model Calibration and Validation

Water level residuals (deemed representative of storm surge for the purpose of this study) derived from tide gauge observations and measured wave data from buoys were analyzed to identify extreme historical events, which were used as the basis for calibrating and validating the numerical models. The analysis indicated that the most extreme storm surges and wave heights are weakly correlated in space and time over the region of interest. Three separate storm periods were therefore identified based on peak storm surges, and three based on identified peak significant wave heights, to calibrate the storm surge and wave models, respectively. The six events were chosen to reflect storm events that affected all ports or wave buoys on the west coast. Table 2 lists the storm periods selected to calibrate the storm surge and wave models.
Calibration of the storm surge model involved adjusting various model input parameters (e.g., turbulence models and eddy viscosity, Section 3.3) and boundary condition parameterizations (e.g., wind drag and bed friction formulae and coefficients, Section 3.2) to achieve root-mean-square errors (RMSE) in the range 0.07–0.13 m (evaluated by comparing storm surge predictions to observed water level residuals at tide gauges) for the three storm events. Calibration of the wave model primarily involved adjusting the spectral discretization and activating/deactivating various source/dissipation terms to achieve RMSE in simulated significant wave heights in the range 0.17–1.10 m for the three storm wave events. Once the models were calibrated, they were used to simulate 41 years (1979 to 2020) of storm surges and waves, driven by the ERA-5 reanalysis (historical) dataset, for validation purposes.
Figure 6 and Figure 7 show sample time series of observed and modelled storm surges and significant wave heights at stations in coastal British Columbia during winter season in 1987–1988 and 2014–2015, respectively.
Figure 8 shows error and correlation statistics (Taylor diagrams), based on a comparison of observed and modelled daily-maxima over the entire 41-year validation period. n (legend of Figure 8) is the total length of the dataset (in days) on which the error and correlation statistics are based.
For storm surges, coefficients of correlation (r-squared) were in the range 0.84–0.85 for the validation period, with RMSE in the range 0.07–0.08 m. Baroclinic contributions to seasonal, interannual or decadal fluctuations in water levels are not included in the model, which negatively affects model skill statistics when comparing modelled storm surges to residuals derived from tide-gauge records. For example, the El Niño-La Niña Southern Oscillation (ENSO) can contribute +0.12/−0.04 m to average regional water level anomalies [22].
For significant wave heights, r-squared values varied in the range 0.75 to 0.94 for the validation period, with RMSE between 0.30 and 0.85 m. Model skill was higher at open ocean buoy locations and lower in semi-enclosed shelf seas such as the Strait of Georgia and Dixon Entrance, where the coarse resolution of forcing atmospheric datasets (ERA5) may affect the quality of surface wind speed input to the model. Some improvement could potentially be made by downscaling wind fields in these regions. Wave–current interactions were not included in the model, and are a potential source of uncertainty [52].

4. Production Simulations

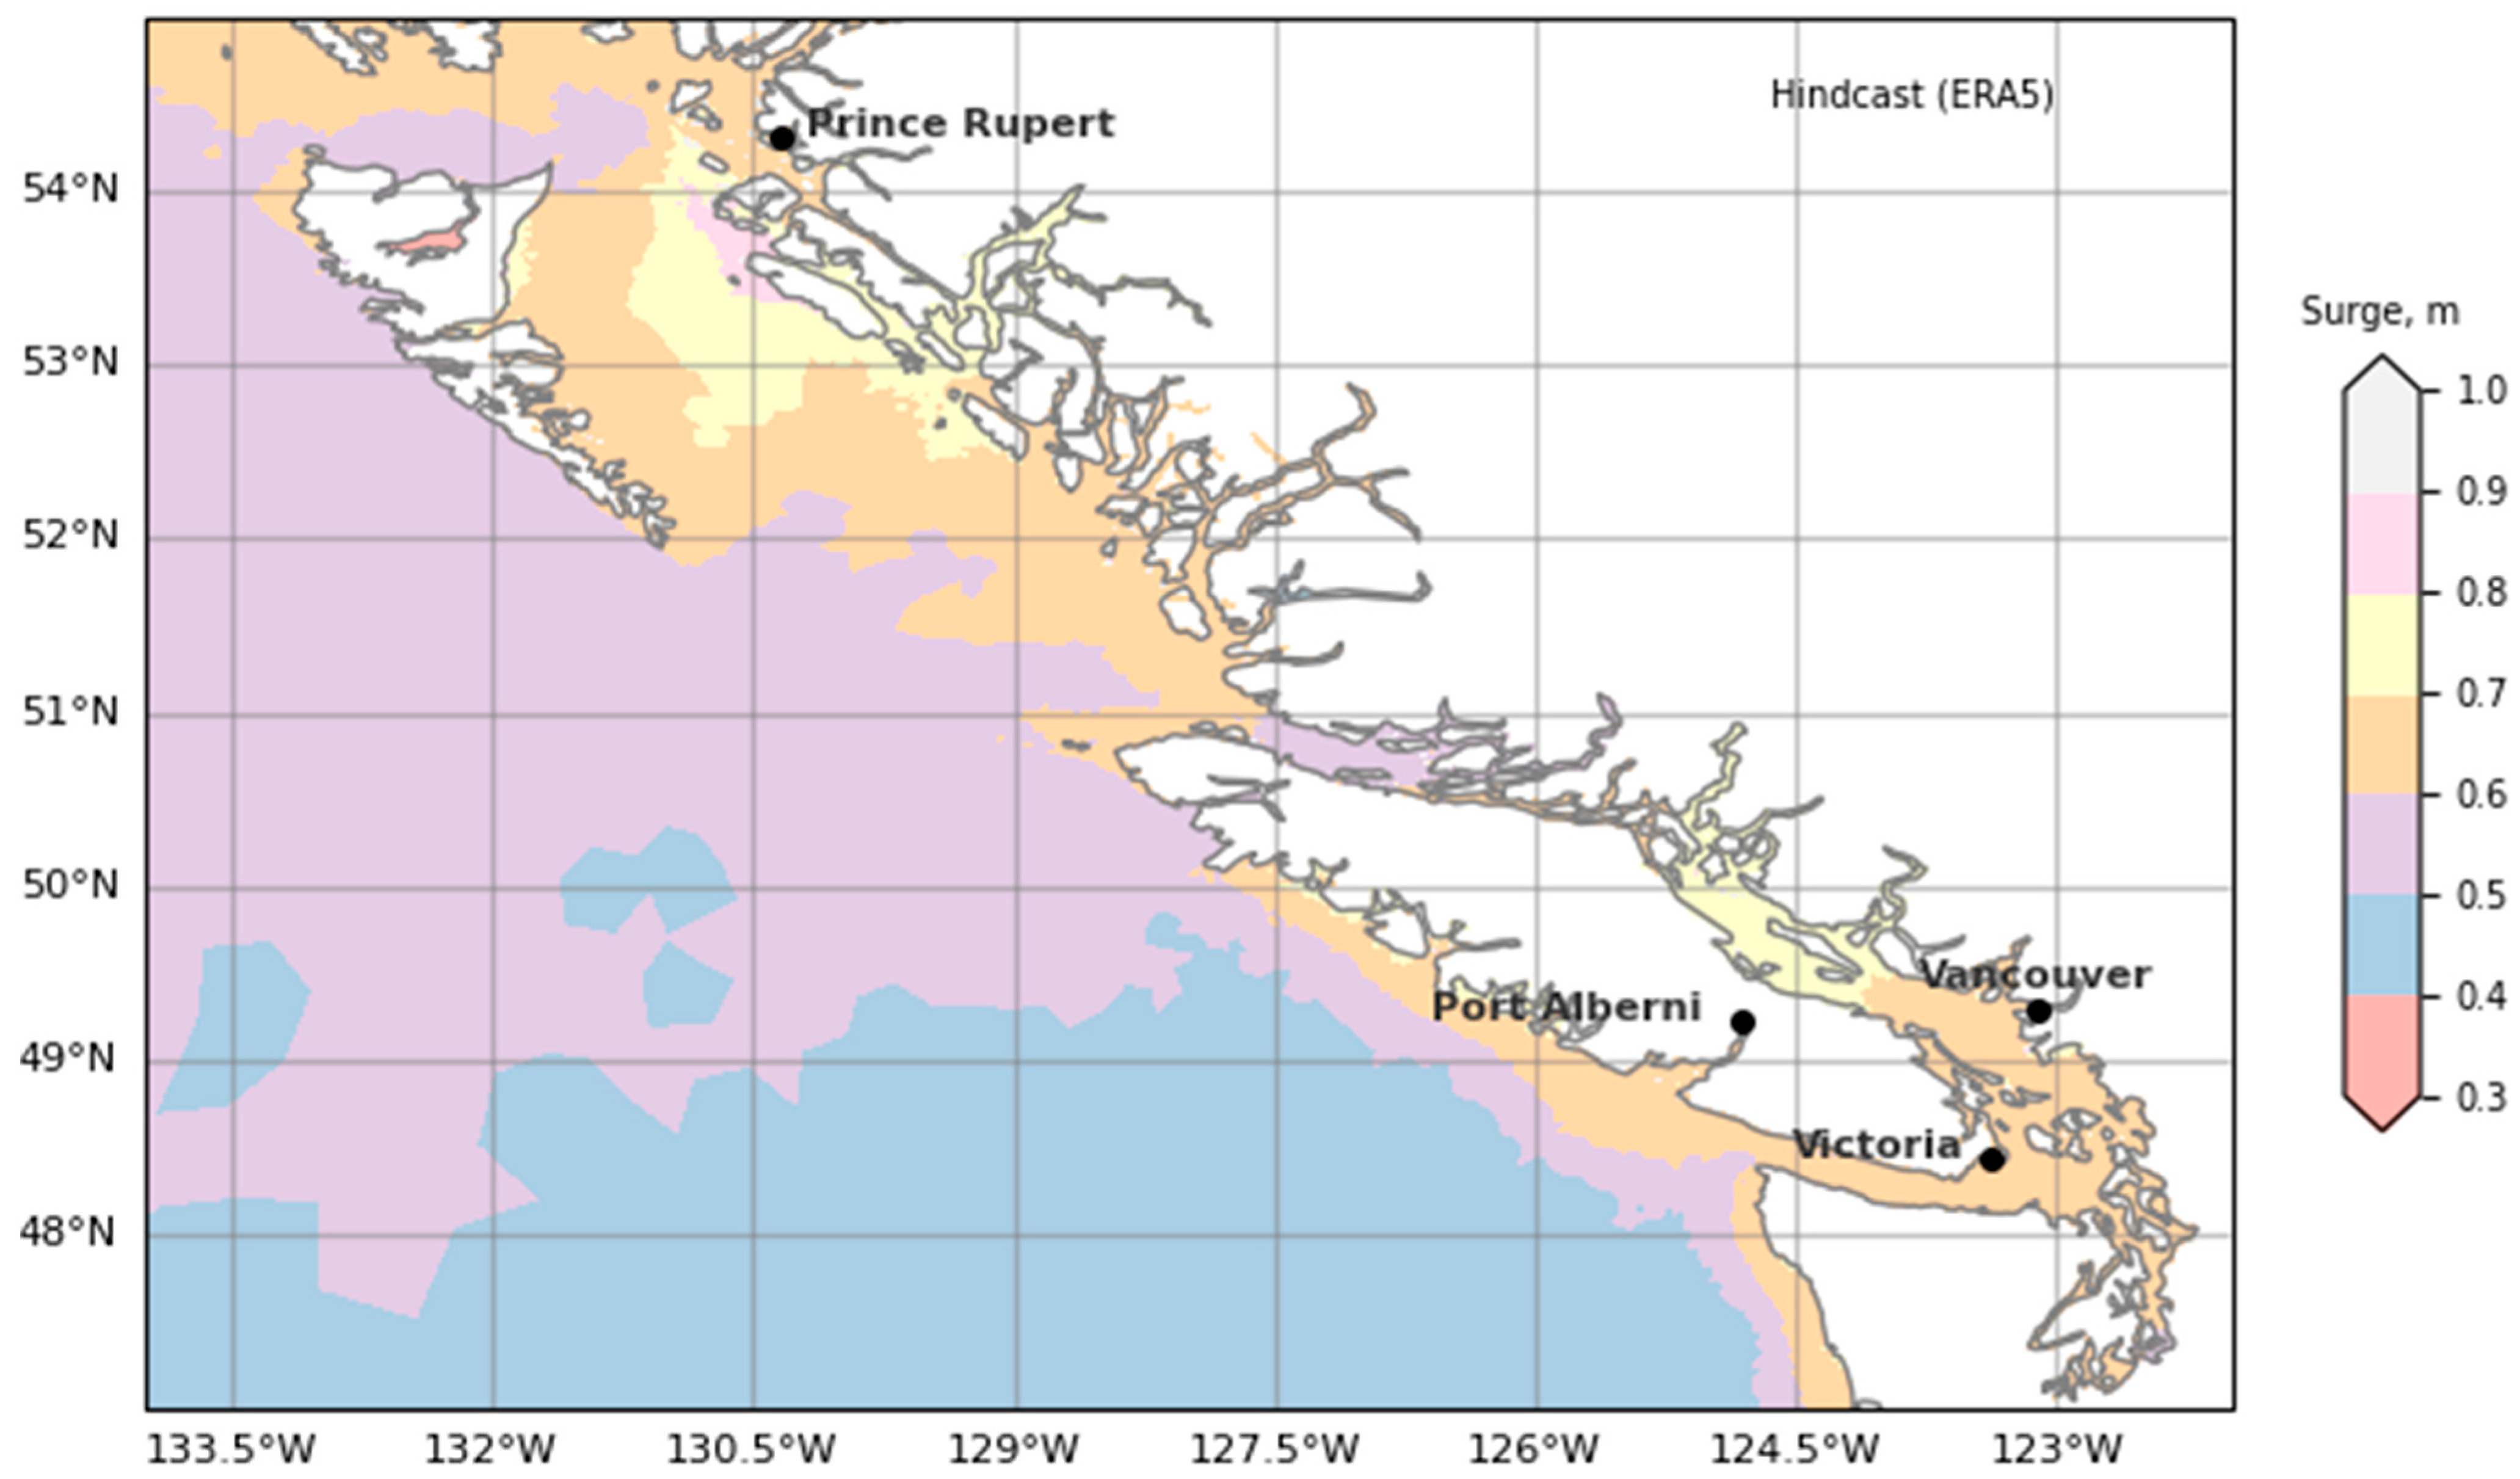
4.1. Hindcast (1979 to 2020)

The 41-year hindcasts of hourly storm surges and waves, driven by the ERA-5 reanalysis and GROWFine:NEPAC wave data, were generated using the TELEMAC-2D and TOMAWAC models. The hindcast also provided the basis for model validation (Section 3.5).

4.2. Future Climate Scenarios

The validated TELEMAC-2D and TOMAWAC models were used to generate a 4-member ensemble of storm surge and wave projections for the period 2006–2100 and the RCP8.5 scenario, driven by the four GCM-RCM future climate realizations (Table 1). Simulations were processed using 1296 cores of Arm-based AWS Graviton2 processors using the Amazon Web Services (AWS) cloud-computing platform. Each simulation took approximately 96 h to complete. Simulation output was saved at every hour between 2006 and 2100 and stored on AWS S3. To minimize cloud storage space, the data were transformed from double precision values to byte values using scaled factors and compressed using NetCDF4 format files. Two input variables (mean sea-level atmospheric pressure, and wind velocity) and six output variables (storm surge, significant wave height, peak wave period, mean wave period, mean wave direction, and mean angular spreading of the directional wave spectra) were saved to the cloud. A total of 12 Terabytes of data was generated from the 4-member future climate ensembles (storm surges and waves).

5. Results—Hindcast of Storm Surges and Extreme Waves

The 99th percentiles of daily maximum storm surges and significant wave heights were calculated for the period 2000–2020 (Figure 9 and Figure 10), and are representative of baseline (early-century) extreme storm surges and waves.

6. Results—Climate Change Impacts on Storm Surges and Extreme Waves

To provide insight to projected climate change effects on storm surges and extreme waves in British Columbia coastal waters, the simulation data were sorted by the three 20-year reference periods for comparison (e.g., early-century period; mid-century period; end-of-century period). The 99th percentiles of daily maximum storm surges and significant wave heights, representative of extreme events, were calculated for each period. Values for the mid- and end-of-century periods were compared to baseline (early-century values) to evaluate projected changes in extreme storm surges and significant wave heights through the 21st century.

6.1. Storm Surges

Projected changes in the 99th percentiles of daily maximum storm surges at mid-century and end-of-century (expressed as a percentage relative to early-century values) are shown in Figure 11 and Figure 12, respectively, for the 4-member model ensemble (members are indicated by their driving GCM-RCM). Multi-model means and multi-model maxima are also shown. Positive values (red) and negative values (blue) indicate increases and decreases relative to the early-century period, respectively.
Three of the simulations predict slight, widespread increases in the 99th percentile of daily maximum storm surges in British Columbia waters by the mid- and end-of-century periods. The exception is the simulation driven by GFDL-ESM2M.WRF, which shows projected decreases throughout the domain of interest.
Predicted changes in the 99th percentile of daily maximum storm surges at mid- and end-of-century in the Strait of Georgia are variable but within ±2% for three of the four ensemble members. However, the correlation between projected changes in local extreme wind speeds and storm surges in this region is relatively weak, corroborating findings by others [12,29] that storm surges in the Strait of Georgia are dominated by the response to remote, far-field events. In other nearshore regions (e.g., Hecate Strait and north of Vancouver Island), the CanESM2- and MPI-ESM-MR-driven simulations project increases by up to +5% by mid-century and +10% by end-of-century (relative to the baseline early-century period). In deep ocean regions, CanESM2-driven members exhibit the greatest projected increases in storm surges by +10–20% at the end-of-century.
The GFDL-ESM2M.WRF-driven simulation results are distinctly different to those of the other three ensemble members, predicting decreases in the 99th percentile of daily maximum storm surges at mid- and end-of-century throughout the domain. Projected decreases are more pronounced at the end-of-century southern regions of Vancouver Island and in the Salish Sea, by as much as −5% by mid-century and −10% by end-of-century. The magnitudes of projected changes are lower in northern British Columbia waters (e.g., Hecate Strait), where predicted decreases by as much as −2% by mid-century and −5% by end-of-century are shown.
Projected changes in the 99th percentile of daily maximum storm surges at selected locations (Vancouver, Victoria, Prince Rupert, and Bamfield) are shown in Figure 13. All but one member of the ensemble (the simulation driven by GFDL-ESM2M.WRF) show projected increases at the four selected locations in the range of 0.0 to +4.8% (around 0 to 4 cm) by mid- and end-of-century. The simulation driven by GFDL-ESM2M.WRF shows projected decreases at the four selected locations by 0.0 to −4.3% (around 0 to −3 cm) by mid-century and by −2.4 to −8.7% (around −2 to −7 cm) by end-of-century.
Figure 14 shows 99th percentiles of daily maximum storm surges by calendar month based on the multi-model mean projections for three 21st century periods (early century, mid-century, and end-of-century) at the same four locations. Here, the multi-model mean was calculated using only the CanESM2- and MPI-ESM-MR-driven members. The GFDL-ESM2M.WRF-driven member, which constitutes an outlier, was excluded to prevent it from skewing the ensemble mean. These plots provide insight, on an ensemble-averaged basis, to projected changes in seasonality of extreme storm surges at each location. Most of the highest storm surge events occur during the fall and winter months (September to March) in the early-century period. There is a slight shift in seasonality of the highest storm surges to later fall and winter (October to April) by mid- and end-of-century.

6.2. Extreme Waves

Projected changes in the 99th percentile of daily maximum significant wave heights (expressed as a percentage relative to early-century values) are shown in Figure 15 and Figure 16. Positive values (red) and negative values (blue) indicate increases and decreases relative to the early-century period, respectively. In fetch-limited seas such as the Strait of Georgia, projected changes in extreme waves are generally consistent with projected changes in extreme wind speeds for all RCMs. However, in regions exposed to swell waves originating in the deep Pacific Ocean (e.g., Hecate Strait and the west coast of Vancouver Island), the correlation between projected changes in extreme wind speeds and waves is weaker.
The CanESM2-driven ensemble members exhibit projected decreases in extreme wave heights over much of the region at both mid-century and end-of-century time horizons, with exceptions in some northern British Columbia coastal waters and north-western parts of the Strait of Georgia. Projected increases in extreme wave heights in the Strait of Georgia correlate to projected increase in extreme wind speeds, and are in the range +5–20% at both mid-century and end-of-century time horizons. In Hecate Strait, CanESM2-driven projections point to increases by up to +5% at both time horizons.
Similar to the CanESM2-driven results, the GFGL-ESM2M.WRF-driven member exhibits projected decreases in extreme wave heights throughout much of the domain, except nearshore areas of the Central and North Coastal Regions of British Columbia (including near Prince Rupert and in Hecate Strait). The projected increases in extreme wave heights in these regions are consistent with projected increases in offshore extreme wind speeds west of Haida Gwaii. Overall, the projected changes in extreme wave heights are within ±5% by mid-century and within ±10% by end-of-century.
The wave simulation driven by MPI-ESM-MR. CRCM5-UQAM exhibited the greatest increases in extreme wave heights. By mid-century, this ensemble-member shows projected increases in extreme wave heights by up to 10% off the west coast of Vancouver Island and in the Strait of Georgia, and by up to +20% off the coasts of Haida Gwaii Island, including in Hecate Strait. By end-of-century, the MPI-ESM-MR-driven simulation shows projected increases in extreme wave heights across almost the entire region, by up to +20%, with the exception of Puget Sound where local decreases are predicted. The projected widespread increases in extreme wave heights for this ensemble member are consistent with the patterns of projected increases in extreme wind speeds over large regions of the Northeast Pacific Ocean and British Columbia nearshore waters by the MPI-ESM-MR.CRCM5-UQAM model.
The projected changes in the 99th percentile of daily maximum significant wave heights at four locations in the study area, including the location of three ports (Vancouver, Victoria, Prince Rupert), are shown in Figure 17. At Vancouver, there is substantial inter-member variability in the projected changes in extreme significant wave heights, in the range −12.9 to +6.9% for mid-century and −10.1 to +16.3% for end-of-century. This is a direct result of the significant inter-member variability in extreme wind speed projections for the Strait of Georgia. At Victoria, all ensemble members suggest extreme waves will decrease, by −5% on average, by end-of-century. At Prince Rupert, the directions (positive or negative) of projected changes in extreme wave heights are highly variable across ensemble members. The magnitudes of projected changes in extreme wave heights are small, except for the GFGL-ESM2M.WRF-driven member which predicts an increase in extreme significant wave heights by +15.6% at end-of-century. At Bamfield, which is exposed to the open ocean, three of the four ensemble members project decreases in extreme significant wave heights by −3 to −8% through the century, except for the MPI-ESM-MR-driven simulation, which predicts a +10.5 % increase.
Figure 18 shows the 99th percentile of daily maximum significant wave heights by calendar month based on the multi-model (ensemble) mean for three 21st century periods (early century, mid-century, and end-of-century) at the same four locations. These plots provide insight, on an ensemble-average basis, to projected changes in seasonality of extreme significant wave heights at each location. Most of the highest wave events occur during the fall and winter months (October to February) and there is no obvious shift in seasonality of extreme wave heights.

7. Data Access and Web Application

A RESTful service Application Programming Interface (API) using AWS was developed to enable public access to the hindcast and future projections of storm surges and waves. This allows users to quickly download data from URLs and easily integrate them in data science software (e.g., Python, Matlab, Javascript, R) to analyze climate change effects on storm surges and waves on Canada’s Pacific Coast. The API allows users to download time series or temporally-averaged data at all model nodes for all simulated variables, as well as additional, potentially useful variables such as characteristic tidal surfaces (mean lower low water, mean low water, mean high water, and mean higher high water), and relative sea-level rise projections. Gridded relative sea-level projections for the region were obtained from James et al. [11] and interpolated to the computational mesh nodes using the inverse distance weighting method. Characteristic tidal surfaces were computed based on a 1-year TELEMAC-2D simulation spanning the entire year of 2000 with TPXO astronomical tidal forcing only.
A web application, Canadian Coastal Climate Risk Information System (https://cccris.ca/, accessed on 10 January 2022) that uses the API, was also developed to enable more user-friendly access to, and analysis of, the simulated storm surge and wave data. The application is intended to support and facilitate climate risk assessments and allows users to perform time-series and statistical analyses at any location within the domain. The web application was developed using various packages, such as React, AntD and DeckGL, and is currently stored and delivered using AWS.

8. Limitations and Future Direction

This paper describes one of the first attempts to numerically investigate the effects of climate change on storm surges and extreme waves on the Pacific coast of Canada, with the objective of supporting improved climate risk assessment for coastal infrastructure. For open coast regions (i.e., offshore of Haida Gwaii and Vancouver Island), the model predictions broadly align with global projections of a poleward shift in storm tracks, and the results provide useful initial insight to potential changes in extreme storm surges and waves over the 21st century. However, there remain a number of limitations and barriers to reliance on the data for climate risk assessment and adaptation planning, beyond basic sensitivity analyses. Some of these limitations are discussed as follows:
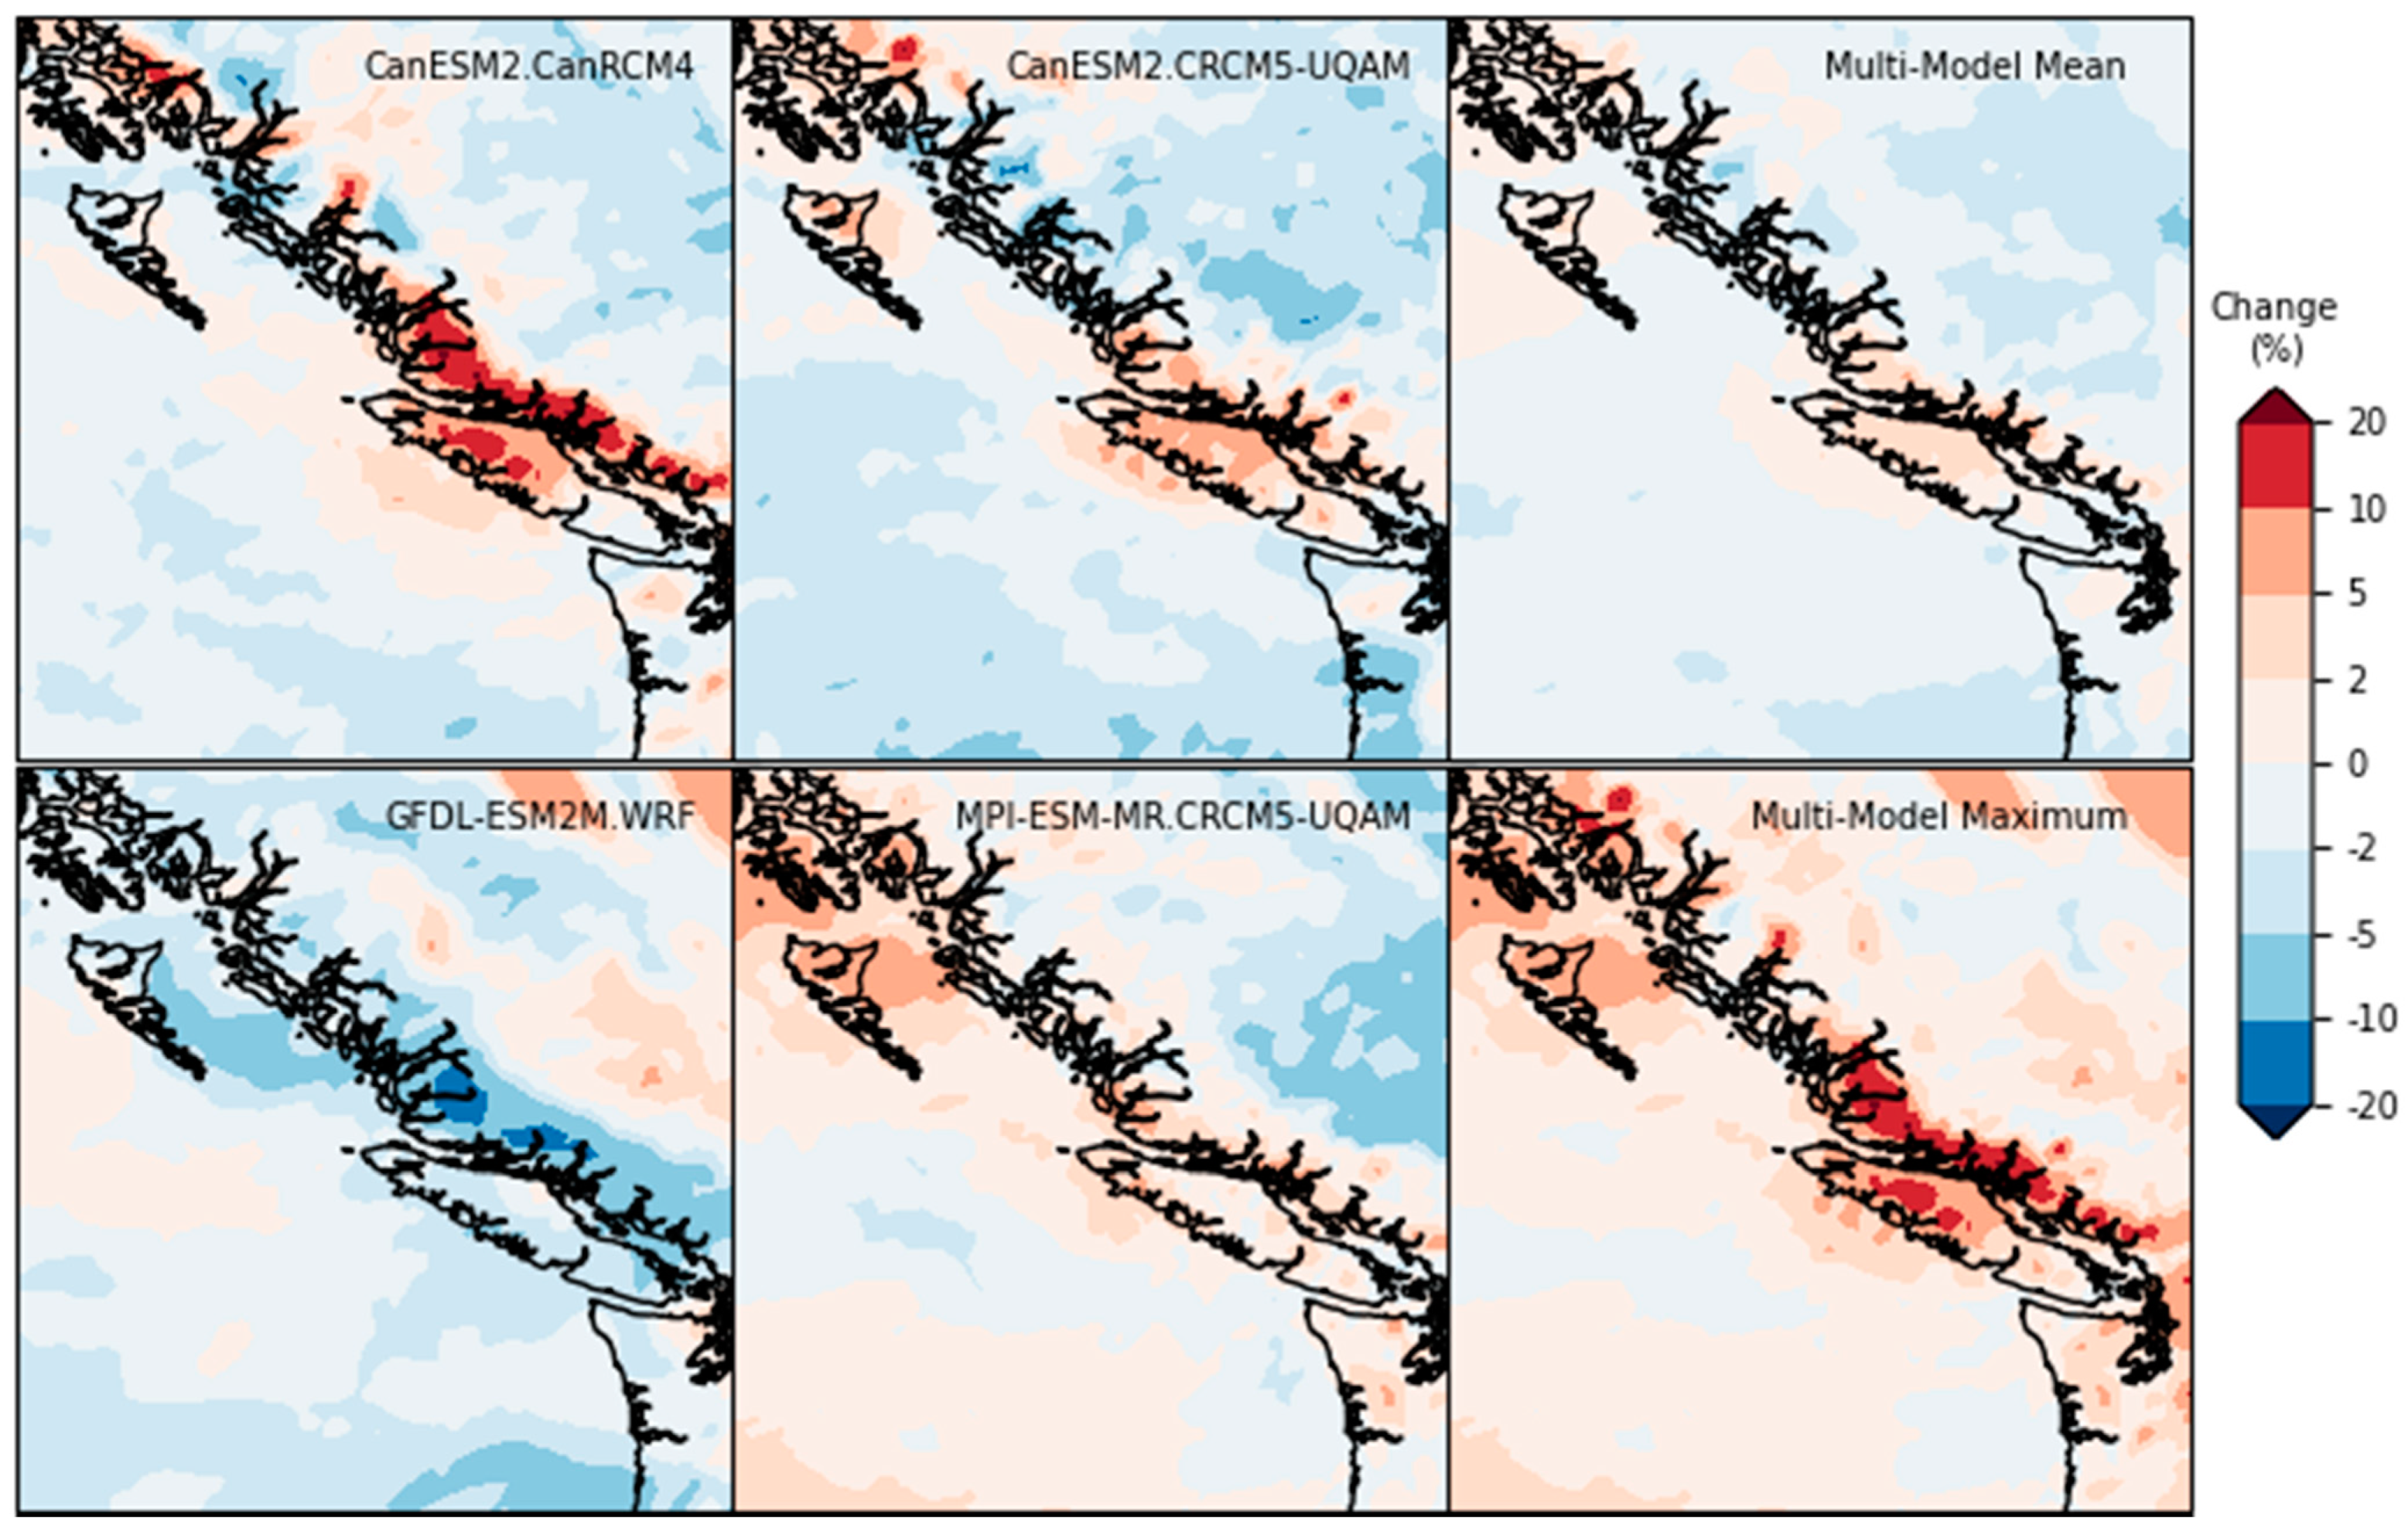
  • There is substantial inter-member variability in the GCM-RCM projections of extreme wind speeds, and therefore, so too in the resulting projections of extreme storm surges and waves; particularly in semi-enclosed coastal shelf seas such as the Salish Sea and Chatham Sound (near Prince Rupert). The uncertainty in the projections is poorly constrained, owing to the limited number (four) of GCM-RCM combinations used to drive the storm surge and wave models, and the generally low confidence in climate models’ representation of atmospheric circulation-related aspects of climate change [66]. A larger ensemble of simulations, incorporating atmospheric forcing from a broader range of GCMs and RCMs, and other emissions scenarios, would be beneficial in characterizing uncertainty associated with the projections and different climate futures. Indeed, other researchers have already identified the need for a larger set of wind projections for terrestrial applications in Canada [67]. Higher RCM spatial resolutions are also needed to better characterize atmospheric fields near land-sea interfaces, and in narrow shelf sea regions, considering the steep topography and complex geomorphology of coastal British Columbia.
  • The daily temporal resolution of driving atmospheric forcing datasets for the future climate simulations is too coarse to properly resolve extreme storm surge and wave impacts on the coast, particularly in regions with large tidal ranges where the timing of storm surge and wave events on short timeframes relative to high tides or precipitation events (e.g., atmospheric rivers) can have an important influence on flooding, erosion or navigation hazards. Although no attempt is made to predict the frequency or magnitude of these types of compound events over century timescales here, higher resolution atmospheric forcing could enable such analyses. The implicit assumptions here are that daily wind and pressure fields are reasonably representative proxies for the shorter-term atmospheric drivers of extreme storm surges and waves, and that the relationships between daily and sub-daily atmospheric variables remain relatively constant throughout the 21st century. These assumptions are somewhat validated by an analysis of storm wind speed events in the ERA-5 dataset over the period 1979–2018, which revealed a fairly consistent relationship between daily average and 3-hourly wind speeds (i.e., peak 3-hourly wind speeds were 25 ± 13% higher than peak daily averages spanning the storm periods), and no significant trends in the relationship over the reference historical period (based on a linear trend line fit to the data).
  • The storm surge and wave projections were limited to a single future climate scenario, which is representative of higher greenhouse gas emissions (RCP8.5). This constraint was imposed by the availability, within the NA-CORDEX web archive, of projections of atmospheric variables at spatial and temporal resolutions approaching those needed to drive the storm surge and wave models. Multi-model surface wind and pressure projections at 0.22° spatial resolution and daily temporal resolution were available only for the RCP8.5 scenario. An expanded database of high resolution atmospheric projections, spanning all five Shared Socioeconomic Pathways in the Sixth Assessment Report of the Intergovernmental Panel on Climate Change [68], would allow for the impacts of other climate futures on storm surges and waves to be assessed.
  • The storm surge model’s skill in predicting historical water level anomalies is negatively affected by the exclusion of baroclinic effects and ocean basin-scale dynamical effects. The model results demonstrating that storm surges in shelf seas are dominated by remote forcing underscore the importance of considering large-scale water level variability and steric effects when evaluating extreme water levels. This is particularly true in the context of developing extreme water level projections for future climate scenarios, given the dominant influence of climate variability events such as El Niño-La Niña Southern Oscillation on regional water level anomalies [22]. Zhai et al. [21] demonstrated that steric and large-scale ocean water level variability can be incorporated in regional storm surge models through boundary forcing derived from global ocean model products. Future improvements on this approach likely involve further convergence of ocean modelling and coastal modelling expertise and technologies, to simulate key processes contributing to water level anomalies over global or basin-wide spatial scales, while taking advantage of unstructured computational meshes to achieve the requisite high spatial resolutions needed in shelf seas (e.g., [69]).
  • Pacific Ocean climate variability patterns significantly influence storm surge and wave climates in Canada’s west coast region [22]. In particular, ENSO is expected to remain a dominant driver of inter-annual variability in the future [68]. However, despite some slight improvements in recent years [68], GCM projections of the future frequency and intensity of El Niño events remain highly uncertain [22]. Continued research and development of global earth system models and their ability to predict climate variability patterns such as ENSO are needed to support improved projections of storm surges and waves in Canada’s west coast region, and to allow for similar methodologies to be applied in other world regions.
Despite the limitations identified above, the new web application described in Section 5 provides a useful platform to support continued expansion, advancement, improvement, and dissemination of future climate projections of storm surges and extreme waves for Canada’s coastal regions. Work is currently underway, in collaboration with maritime infrastructure owners in the region, to test and demonstrate applications of this tool to support climate risk assessment for coastal infrastructure assets. Findings and feedback from these case studies will enable tailoring and improvement of the web application, and verify that the methodology provides a reasonable framework for assessing climate change impacts on regional storm surges and waves, which can be exported to other regions.

9. Conclusions

Numerical hydrodynamic and wave models were developed for Canada’s Pacific coastal region, and used to hindcast storm surges and waves for the period 1979–2020, driven by ERA5 atmospheric reanalysis and GROWFine:NEPAC wave data. The models were then used to develop a four-member ensemble of projected changes in storm surges and significant wave heights for the 21st century and the RCP8.5, driven by atmospheric data from four different GCM-RCM realizations. Most ensemble members show projected increases in extreme (99th percentile) storm surges and significant wave heights of up to 5–10% throughout British Columbia waters by the end of the 21st century, consistent with a poleward shift in storm tracks. The greatest projected increases in significant wave heights are on the exposed, open coast regions west of Haida Gwaii and Vancouver Island, whereas projected increases in storm surges are shown in Hecate Strait and parts of the Salish Sea, reflecting the dominance of remote forcing in storm surge responses. Inter-member variability in projections is highest in semi-enclosed coastal shelf seas, such as the Salish Sea and Chatham Sound, reflecting high levels of uncertainty, partly associated with the low resolution of driving RCM atmospheric datasets and the steep, complex topography of coastal British Columbia. Unfortunately, these regions also contain the highest densities of settlement and infrastructure. Improved and expanded RCM projections are needed to improve upon projections of extreme storm surges and waves for the region. Nevertheless, the models and data presented here, and the web-based platform by which they are made freely available, represent a first attempt to characterize future changes in storm surges and waves for the western Canada coastal region at spatial scales relevant to climate risk assessment and adaptation planning for coastal infrastructure.

Author Contributions

Conceptualization, J.C. and E.M.; methodology, J.C. and E.M.; validation, J.C. and E.M.; formal analysis, J.C. and E.M.; writing—original draft preparation, J.C.; writing—review and editing, J.C. and E.M.; visualization, J.C.; project administration, E.M.; funding acquisition, E.M. All authors have read and agreed to the published version of the manuscript.

Funding

This research was funded by Transport Canada’s Transportation Assets Risk Assessment initiative.

Institutional Review Board Statement

Not applicable.

Informed Consent Statement

Not applicable.

Data Availability Statement

The data presented in this are available on request from the corresponding author. Data can also be downloaded from the web application, Canadian Coastal Climate Risk Information System (https://cccris.ca/, accessed on 10 January 2022).

Acknowledgments

The authors thank: Amanj Rahman for preliminary analysis and model development, and Andrew Cornett for program sponsorship and support.

Conflicts of Interest

The authors declare no conflict of interest with respect to the research, authorship and/or publication of this article.

References

  1. Murphy, E.; Osborne, P.; Clohan, D. Water Level and Tsunami Design Criteria for LNG Marine Terminals in BC. In Proceedings of the 14th Triennial International Conference, New Orleans, LA, USA, 12–15 June 2016. [Google Scholar]
  2. Vancouver Fraser Port Authority. Guidelines—Shoreline Protection (Vancouver Harbour) Inspection, Maintenance, Design and Repair; Engineering and Maintenance Department: Vancouver, BC, Canada, 2018. [Google Scholar]
  3. Global Container Terminals Canada. Deltaport Expansion Berth Four (DP4)—Detailed Project Description; British Columbia Environmental Assessment Office: Victoria, BC, Canada, 2021. [Google Scholar]
  4. Institute for Catastrophic Loss Reduction. Addressing Climate Risk for Coastal Transportation Infrastructure: Opportunities Moving Forward; Institute for Catastrophic Loss Reduction: Toronto, ON, Canada, 2018. [Google Scholar]
  5. Lyle, T.; Long, G.; Beaudrie, C. City of Vancouver Coastal Flood Risk Assessment—Phase 2 Final Report; City of Vancouver: Vancouver, BC, Canada, 2015. [Google Scholar]
  6. Northwest Hydraulic Consultants Ltd. Lower Mainland Flood Management Strategy Project 2: Regional Assessment of Flood Vulnerability; Fraser Basin Council: Vancouver, BC, Canada, 2016. [Google Scholar]
  7. Vadeboncoeur, N. Perspectives on Canada’s West Coast Region. In Canada’s Marine Coasts in a Changing Climate; Government of Canada: Ottawa, ON, Canada, 2016; pp. 207–252. [Google Scholar]
  8. EnviCom Working Group 178. Climate Change Adaptation Planning for Ports and Inland Waterways; PIANC: Bruxelles, Belgium, 2020. [Google Scholar]
  9. Greenan, B.; James, T.; Loder, J.; Pepin, P.; Azetsu-Scott, K.; Ianson, D.; Hamme, R.; Gilbert, D.; Tremblay, J.-E.; Wang, X.; et al. Changes in Oceans Surrounding Canada. In Canada’s Changing Climate Report; Government of Canada: Ottawa, ON, Canada, 2018; p. 444. [Google Scholar]
  10. James, T.; Henton, J.; Leonard, L.; Darlington, A.; Forbes, D.; Craymer, M. Relative Sea-Level Projections in Canada and the Adjacent Mainland United States; Government of Canada: Ottawa, ON, Canada, 2014. [Google Scholar]
  11. James, T.; Robin, C.; Henton, J.; Craymer, M. Relative Sea-Level Projections for Canada Based on the IPCC Fifth Assessment Report and the NAD83v70VG National Crustal Velocity Model; Geological Survey of Canada: Ottawa, ON, Canada, 2021. [Google Scholar]
  12. Soontiens, N.; Allen, S.; Latornell, D.; Souëf, K.L.; Machuca, I.; Paquin, J.-P.; Lu, Y.; Thompson, K.; Korabel, V. Storm Surges in the Strait of Georgia Simulated with a Regional Model. Atmosphere-Ocean 2016, 54, 1–21. [Google Scholar] [CrossRef]
  13. Forseth, P. Adaptation to Sea Level Rise in Metro Vancouver: A Review of Literature for Historical Sea Level Flooding and Projected Sea Level Rise in Metro Vancouver; Simon Fraser University: Burnaby, BC, Canada, 2012. [Google Scholar]
  14. Walker, I.J.; Sydneysmith, R. From Impacts to Adaptation: Canada in a Changing Climate 2007; Lemmen, D.S., Warren, F.J., Lacroix, J., Bush, E., Eds.; Government of Canada: Ottawa, ON, Canada, 2008. [Google Scholar]
  15. Chang, S.E.; Brown, A.J.; Costa, R.; Dobson, B.; Dowlatabadi, H.; Haukaas, T. A Community Resilience Approach to Assessing Transportation Risk in Disasters. In Proceedings of the 16th World Conference on Earthquake Engineering, Santiago, Chile, 9–13 January 2017. [Google Scholar]
  16. Murty, T.S.; Venkatesh, S.; Danard, M.B.; El-Sabh, M. Storm Surges in Canadian Waters. Atmosphere-Ocean 1995, 33, 359–387. [Google Scholar] [CrossRef]
  17. Khandekar, M.L.; Swail, V.R. Storm Waves in Canadian Waters: A Major Marine Hazard. Atmosphere-Ocean 1995, 33, 329–357. [Google Scholar] [CrossRef]
  18. Anderson, J.R.; Gyakum, J.R. A Diagnostic Study of Pacific Basin Circulation Regimes as Determined from Extratropical Cyclone Tracks. Mon. Weather Rev. 1989, 117, 2672–2686. [Google Scholar] [CrossRef] [Green Version]
  19. Bromirski, P.; Flick, R.; Miller, A. Storm Surge along the Pacific Coast of North America. J. Geophys. Res. Oceans 2017, 122, 441–457. [Google Scholar] [CrossRef]
  20. Bromirski, P.D.; Flick, R.E.; Cayan, D.R. Storminess Variability along the California Coast. J. Clim. 2003, 16, 982–993. [Google Scholar] [CrossRef]
  21. Zhai, L.; Greenan, B.; Thomson, R.; Tinis, S. Use of Oceanic Reanalysis to Improve Estimates of Extreme Storm Surge. J. Atmos. Ocean. Technol. 2019, 36, 2205–2219. [Google Scholar] [CrossRef]
  22. Barnard, P.; Short, A.; Harley, M.; Splinter, K.; Vitousek, S.; Turner, I.; Allan, J.; Banno, M.; Bryan, K.; Doria, A.; et al. Coastal Vulnerability across the Pacific Dominated by El Nino/Southern Oscillation. Nat. Geosci. 2015, 8, 801–807. [Google Scholar] [CrossRef]
  23. 105 Missing Containers Tossed from Ship during B.C. Storm Have Likely Sunk: Coast Guard. Available online: https://www.cbc.ca/news/canada/british-columbia/lost-containers-from-freighter-mv-kingston-have-likely-sunk-1.6245797 (accessed on 10 January 2022).
  24. It’s Been One Year since a Windstorm Blew a Hole in White Rock’s Historic Pier. Available online: https://www.cbc.ca/news/canada/british-columbia/white-rock-pier-windstorm-anniversary-1.5404977 (accessed on 10 January 2022).
  25. Storm: Historic “bomb Cyclone” Leads to Dozens of Ferry Cancellations, Power Outages. Available online: https://bc.ctvnews.ca/b-c-storm-historic-bomb-cyclone-leads-to-dozens-of-ferry-cancellations-power-outages-1.5636935 (accessed on 10 January 2022).
  26. Coast Guard Monitoring 22 Vessels Damaged or Destroyed in B.C. Storm. Available online: https://bc.ctvnews.ca/coast-guard-monitoring-22-vessels-damaged-or-destroyed-in-b-c-storm-1.5672673 (accessed on 10 January 2022).
  27. Assessing Storm Damage on Seawall, Piers to Take Weeks: Vancouver Park Board. Available online: https://bc.ctvnews.ca/assessing-storm-damage-on-seawall-piers-to-take-weeks-vancouver-park-board-1.5736443 (accessed on 10 January 2022).
  28. Crean, P.; Murty, T.; Stronach, J. Numerical Simulation of Oceanographic Processes in the Waters between Vancouver Island and the Mainland. Oceanogr. Mar. Biol. 1988, 26, 11–142. [Google Scholar]
  29. Yang, Z.; Wang, T.; Castrucci, L.; Miller, I. Modeling Assessment of Storm Surge in the Salish Sea. Estuar. Coast. Shelf Sci. 2020, 238, 106552. [Google Scholar] [CrossRef]
  30. Milbrandt, J.; Bélair, S.; Faucher, M.; Vallée, M.; Carrera, M.; Glazer, A. The Pan-Canadian High Resolution (2.5 Km) Deterministic Prediction System. Weather Forecast. 2016, 31, 1791–1816. [Google Scholar] [CrossRef]
  31. Saha, S.; Moorthi, S.; Pan, H.; Wu, X.; Wang, J.; Nadiga, S.; Tripp, P.; Kistler, R.; Woollen, J.; Behringer, D.; et al. The NCEP Climate Forecast System Reanalysis. Bull. Am. Meteorol. Soc. 2010, 91, 1015–1057. [Google Scholar] [CrossRef]
  32. Reikard, G.; Robertson, B.; Buckham, B.; Bidlot, J.; Hiles, C. Simulating and Forecasting Ocean Wave Energy in Western Canada. Ocean Eng. 2015, 103, 223–236. [Google Scholar] [CrossRef]
  33. Hiles, C.; Buckham, B.; Wild, P.; Robertson, B. Wave Energy Resources near Hot Springs Cove, Canada. Renew. Energy 2014, 71, 598–608. [Google Scholar] [CrossRef]
  34. Robertson, B.R.D.; Hiles, C.E.; Buckham, B.J. Characterizing the near Shore Wave Energy Resource on the West Coast of Vancouver Island, Canada. Renew. Energy 2014, 71, 665–678. [Google Scholar] [CrossRef]
  35. Vitousek, S.; Barnard, P.; Fletcher, C.; Frazer, N.; Erikson, L.; Storlazzi, C. Doubling of Coastal Flooding Frequency within Decades Due to Sea-Level Rise. Nat. Sci. Rep. 2017, 7, 1399. [Google Scholar] [CrossRef] [PubMed]
  36. Morim, J.; Hemer, M.; Wang, X.; Cartwright, N.; Trenham, C.; Semedo, A.; Young, I.; Bricheno, L.; Camus, P.; Casas-Prat, M.; et al. Robustness and Uncertainties in Global Multivariate Wind-Wave Climate Projections. Nat. Clim. Chang. 2019, 9, 711–718. [Google Scholar] [CrossRef] [Green Version]
  37. Morim, J.; Trenham, C.; Hemer, M.; Wang, X.; Mori, N.; Casas-Prat, M.; Semedo, A.; Shimura, T.; Timmermans, B.; Camus, P.; et al. A Global Ensemble of Ocean Wave Climate Projections from CMIP5-Driven Models. Nat. Sci. Data 2020, 7, 105. [Google Scholar] [CrossRef]
  38. Bernier, N.; Thompson, K.; Ou, J.; Ritchie, H. Mapping the Return Periods of Extreme Sea Levels: Allowing for Short Sea Level Records, Seasonality, and Climate Change. Glob. Planet. Chang. 2006, 57, 139–150. [Google Scholar] [CrossRef]
  39. Casas-Prat, M.; Wang, X. Projections of Extreme Ocean Waves in the Arctic and Potential Implications for Coastal Inundation and Erosion. J. Geophys. Res. Oceans 2020, 125, e2019JC015745. [Google Scholar] [CrossRef]
  40. Hersbach, H.; Bell, B.; Berrisford, P.; Hirahara, S.; Horányi, A.; Muñoz-Sabater, J.; Nicolas, J.; Peubey, C.; Radu, R.; Schepers, D.; et al. The ERA5 Global Reanalysis. Q. J. R. Meteorol. Soc. 2020, 146, 19. [Google Scholar] [CrossRef]
  41. Fisheries and Oceans Canada Canadian Hydrographic Service Non-Navigational (NONNA-100) Bathymetric Data. Available online: https://open.canada.ca/data/en/dataset/d3881c4c-650d-4070-bf9b-1e00aabf0a1d (accessed on 10 January 2022).
  42. GEBCO The GEBCO_2020 Grid. Available online: https://www.gebco.net/data_and_products/gridded_bathymetry_data/ (accessed on 10 January 2022).
  43. Fisheries and Oceans Canada Tides, Currents, and Water Levels. Available online: http://www.tides.gc.ca/eng (accessed on 10 January 2022).
  44. Foreman, M.G.G. Manual for Tidal Heights Analysis and Prediction; Institute of Ocean Sciences, Department of Fisheries and Oceans: Sidney, BC, Canada, 1977. [Google Scholar]
  45. Ponte, R. Nonequilibrium Response of the Global Ocean to the 5-Day RossbyHaurwitz Wave in Atmospheric Surface Pressure. J. Phys. Oceanogr. 1997, 27, 2158–2168. [Google Scholar] [CrossRef]
  46. Ecosystem and Oceans Science, Department of Fisheries and Oceans Canada Marine Environmental Data Section Archive. Available online: https://meds-sdmm.dfo-mpo.gc.ca (accessed on 10 January 2022).
  47. Swail, V.R.; Cardone, V.; Ferguson, M.; Gummer, D.; Harris, E.; Orelup, E.; Cox, A. The MSC50 Wind and Wave Reanalysis. In Proceedings of the 9th International Workshop On Wave Hindcasting and Forecasting, Victoria, BC, Canada, 24–29 September 2006. [Google Scholar]
  48. Environment and Climate Change Canada Historical Climate Data. Available online: https://climate.weather.gc.ca/ (accessed on 10 January 2022).
  49. C.C.C.S. (C3S) ERA5: Fifth Generation of ECMWF Atmospheric Reanalyses of the Global Climate. Available online: https://cds.climate.copernicus.eu/cdsapp#!/home (accessed on 10 January 2022).
  50. Taylor, K. Summarizing Multiple Aspects of Model Performance in a Single Diagram. J. Geophys. Res. 2001, 106, 7183–7192. [Google Scholar] [CrossRef]
  51. Mearns, L.; McGinnis, S.; Korytina, D.; Arritt, R.; Biner, S.; Bukovsky, M.; Chang, H.-I.; Christensen, O.; Herzmann, D.; Jiao, Y.; et al. The NA-CORDEX Dataset, Version 1.0. NCAR Clim. Data Gatew. 2017. [Google Scholar] [CrossRef]
  52. I. P.C.C. Climate Change 2013: The Physical Science Basis. Contribution of Working Group I to the Fifth Assessment Report of the Intergovernmental Panel on Climate Change; Cambridge University Press: Cambridge, UK, 2013. [Google Scholar]
  53. Hervouet, J.-M. Hydrodynamics of Free Surface Flows: Modelling with the Finite Element Method; John Wiley & Sons, Ltd: Hoboken, NJ, USA, 2007. [Google Scholar]
  54. Ata, R. TELEMAC-2D V8p0 User Manual. Available online: http://www.opentelemac.org/ (accessed on 10 January 2022).
  55. Hawk, T. Tomawac V8p0 User Manual. Available online: http://www.opentelemac.org/index.php/manuals (accessed on 10 January 2022).
  56. Remacle, J.-F.; Geuzaine, C. Gmsh: A 3-D Finite Element Mesh Generator with Built-in Pre- and Post-Processing Facilities. Int. J. Numer. Methods Eng. 2009, 79, 1309–1331. [Google Scholar]
  57. OpenStreetMap. Available online: https://osmdata.openstreetmap.de/ (accessed on 10 January 2022).
  58. Flather, R.A. Results from a Storm Surge Prediction Model of the North-West European Continental Shelf for April, November and December; Scripps Institution of Oceanography: San Diego, CA, USA, 1976; 37p. [Google Scholar]
  59. Egbert, G.; Erofeeva, S. Efficient Inverse Modeling of Barotropic Ocean Tides. J. Atmos. Ocean. Technol. 2002, 19, 183–204. [Google Scholar] [CrossRef] [Green Version]
  60. Bouws, E.; Komen, G.J. On the Balance between Growth and Dissipation in an Extreme Depth-Limited Wind-Sea in the Southern North Sea. J. Phys. Oceanogr. 1983, 13, 1653–1658. [Google Scholar] [CrossRef] [Green Version]
  61. The Wamdi Group. The WAM-Model—A Third Generation Ocean Wave Prediction Model. J. Phys. Oceanogr. 1988, 18, 1775–1810. [Google Scholar] [CrossRef] [Green Version]
  62. Komen, G.; Hasselmann, S.; Hasselmann, K. On the Existence of a Fully Developed Wind-Sea Spectrum. J. Phys. Ocean. 1984, 14, 1271–1285. [Google Scholar] [CrossRef]
  63. Janssen, P. Quasi-Linear Theory of Wind-Wave Generation Applied to Wave Forecasting. J. Phys. Ocean. 1991, 21, 1631–1642. [Google Scholar] [CrossRef] [Green Version]
  64. Battjes, J.; Janssen, J. Energy Loss and Set-up Due to Breaking of Random Waves. In Proceedings of the 16th International Conference on Coastal Engineering, Hamburg, Germany, 27 August–3 September 1978; pp. 569–587. [Google Scholar]
  65. Hasselmann, S.; Hasselmann, K.; Allender, J.; Barnett, T. Computations and Parameterizations of the Nonlinear Energy Transfer in Gravity-Wave Spectrum. Part II: Parameterizations of the Nonlinear Energy Transfer for Application in Wave Models. J. Phys. Ocean. 1985, 15, 1378–1391. [Google Scholar] [CrossRef] [Green Version]
  66. Shepherd, T. Atmospheric Circulation as a Source of Uncertainty in Climate Change Projections. Nat. Geosci. 2014, 7, 703–708. [Google Scholar] [CrossRef]
  67. Jeong, D.; Sushama, L. Projected Changes to Mean and Extreme Surface Wind Speeds for North America Based on Regional Climate Model Simulations. Atmosphere 2019, 10, 497. [Google Scholar] [CrossRef] [Green Version]
  68. IPCC. Climate Change 2021: The Physical Science Basis. Contribution of Working Group I to the Sixth Assessment Report of the Intergovernmental Panel on Climate Change; Cambridge University Press: Cambridge, UK, 2021. [Google Scholar]
  69. Kirezci, E.; Young, I.; Ranasinghe, R.; Muis, S.; Nicholls, R.; Lincke, D.; Hinkel, J. Projections of Global-Scale Extreme Sea Levels and Resulting Episodic Coastal Flooding over the 21st Century. Sci. Rep. 2020, 10, 11629. [Google Scholar] [CrossRef]
Figure 1. Cities, ports, wave buoys, water level stations, weather stations and straits that are discussed in the paper.
Atmosphere 13 00311 g001
Figure 2. Taylor diagram showing error and correlation statistics for: (a) atmospheric pressures (b) wind speeds. The correlation is based on comparing the ERA5 data to collocated observations at 9 weather stations (a–i) on the British Columbia coast. Values plotting closer to the red line and the “observed” point (corresponding to normalized root-mean-square errors and correlation coefficients equal to zero and one, respectively) on the Taylor diagrams indicate locations where the reanalysis shows better agreement with the weather station measurements.
Atmosphere 13 00311 g002
Figure 3. Projected changes in the 99th percentile of daily wind speeds by mid-century (2006–2025 to 2031–2050) for the RCP8.5 global emissions scenario.
Atmosphere 13 00311 g003
Figure 4. Projected changes in the 99th percentile of daily wind speeds by end-of-century (2006–2025 to 2080–2099) for the RCP8.5 global emissions scenario.
Atmosphere 13 00311 g004
Figure 5. (a) Computational mesh and open water boundary of the storm surge and wave models, (b) computational mesh in the Strait of Georgia.
Atmosphere 13 00311 g005
Figure 6. Observed and modelled surge during the winter months of 1987–1988.
Atmosphere 13 00311 g006
Figure 7. Observed and modelled significant wave height during the winter months of 2014–2015.
Atmosphere 13 00311 g007
Figure 8. Taylor diagrams showing model skill at predicting: (a) storm surges (b) significant wave heights, based on comparisons of modelled data (storm surges and waves) and observed data (residuals and waves) at the four water level gauges and four wave buoys. n is the total length of the dataset (in days) on which the error and correlation statistics are based.
Atmosphere 13 00311 g008
Figure 9. The 99th percentile of daily maximum storm surges for the period 2000 to 2020.
Atmosphere 13 00311 g009
Figure 10. The 99th percentile of daily maximum significant wave heights for the period 2000 to 2020.
Atmosphere 13 00311 g010
Figure 11. Projected changes in the 99th percentile of daily maximum storm surges by mid-century (2006–2025 to 2031–2050) for RCP8.5.
Atmosphere 13 00311 g011
Figure 12. Projected changes in the 99th percentile of daily maximum storm surges by end-of-century (2006–2025 to 2080–2099) for RCP8.5.
Atmosphere 13 00311 g012
Figure 13. Projected changes in the 99th percentile of daily maximum storm surges by mid-century (2031–2050) and end-of-century (2080–2099) relative to 2006–2025 for RCP8.5 at four locations in coastal British Columbia.
Atmosphere 13 00311 g013
Figure 14. Projected changes in the 99th percentile of daily maximum storm surges by calendar month for each 20-year period based on multi-model mean (ignoring the GFDL-ESM2M.WRF-driven ensemble member).
Atmosphere 13 00311 g014
Figure 15. Projected changes in the 99th percentile of daily maximum significant wave heights by mid-century (2006–2025 to 2031–2050) for RCP8.5.
Atmosphere 13 00311 g015
Figure 16. Projected changes in the 99th percentile of daily maximum significant wave heights by end-of-century (2006–2025 to 2080–2099) for RCP8.5.
Atmosphere 13 00311 g016
Figure 17. Projected changes in mean annual maximum hourly significant wave heights by mid-century (2031–2050) and end-of-century (2080–2099) relative to 2006–2025 for RCP8.5 at four locations in coastal British Columbia.
Atmosphere 13 00311 g017
Figure 18. Projected changes in the 99th percentile of daily maximum significant wave heights by calendar month for each 20-year period (early-, mid-, and late-century) based on multi-model (ensemble) means.
Atmosphere 13 00311 g018
Table 1. Selected global climate and regional climate models.
Global Climate ModelRegional Climate ModelInstitution
CanESM2CanRCM4Canadian Centre for Climate Modelling & Analysis
CanESM2CRCM5-UQAMUniversité du Québec à Montréal
MPI-ESM-MRCRCM5-UQAMUniversité du Québec à Montréal
GFDL-ESM2MWRFUniversity of Arizona/US National Center for Atmospheric Research (NCAR)
Table 2. Error and correlation statistics for calibration events and validation period.
Storm SurgeSignificant Wave Height
PeriodTide Gauger2RMSE (m)PeriodWave Buoyr2RMSE (m)
Feb. 1992Bamfield0.880.08Dec.
1993
La Perouse Bank0.900.91
Prince Rupert0.770.10North Hectate Strait0.910.81
Victoria0.820.07Halibut Bank 0.940.2
Vancouver0.910.07Central Dixon Ent.0.640.91
Dec. 1987Bamfield0.930.06Dec.
1996
La Perouse Bank0.840.97
Prince Rupert0.860.11North Hectate Strait0.920.71
Victoria0.820.07Halibut Bank 0.830.17
Vancouver0.840.08Central Dixon Ent.0.671.1
Dec. 2014Bamfield0.790.09Feb.
2006
La Perouse Bank- 1-
Prince Rupert0.880.08North Hectate Strait0.920.56
Victoria0.870.08Halibut Bank 0.920.19
Vancouver0.870.09Central Dixon Ent.0.840.57
1979 to
2020
Bamfield0.840.081979 to
2020
La Perouse Bank0.890.75
Prince Rupert0.850.08North Hectate Strait0.940.58
Victoria0.850.07Halibut Bank 0.750.30
Vancouver0.840.08Central Dixon Ent.0.780.85
1 Observed data not available.
Publisher’s Note: MDPI stays neutral with regard to jurisdictional claims in published maps and institutional affiliations.

