
Evaluation of the Homogenization Adjustments Applied to European Temperature Records in the Global Historical Climatology Network Dataset

 , , ,
, , ,  ,
,  , and
, and
Abstract
:1. Introduction
- There was a concerning lack of consistency in the breakpoints and adjustments applied by NOAA to the record between each of the five different updates of the GHCN dataset the authors had downloaded (October 2011, January 2012, January 2013, July 2014 and January 2015);
- None of the breakpoints identified by NOAA’s PHA for any of those updates corresponded to any of the four documented events in the station history metadata which the Valentia Observatory observers provided;
- The PHA homogenization failed to identify, in any of those updates, non-climatic biases associated with the major station move in 1892 or the second station move in 2001 for which parallel measurements showed a −0.3 °C cooling bias.
- To describe how the PHA adjustments applied to the stations in the widely-used GHCN datasets vary between updates, using this subset of European stations as a detailed case study for the entire global dataset.
- To evaluate how closely related (or otherwise) the breakpoints identified by the PHA process are to documented station history metadata events.
- To discuss the implications these findings have for the scientific community’s goals of accurately estimating regional climatic temperature trends.
- To make recommendations for steps the temperature homogenization community can take to resolve some of the identified problems, moving forward.
2. Materials and Methods
2.1. Timeline of How Our Archive of GHCN Datasets Was Compiled
- May 2011: P.O’N. began downloading and archiving the dataset (then version 3) from NOAA’s website roughly fortnightly.
- March 2012: The download rate was increased to roughly weekly.
- March 2014: An automated script was set up to download the dataset daily. However, NOAA’s updates appear to have been only approximately every 24 hours. Therefore, on some days, the datasets downloaded were identical to the preceding day. We have removed these identical copies from our analysis. Furthermore, on some days, the download was not carried out due to P.O’N’s computer being offline for maintenance or travel. Hence, the annual totals for each dataset in Table 2 are less than 365 for all years.
- October 2015: NOAA launched the “beta” version 4. Therefore, P.O’N. began downloading and archiving both version 3 and 4 daily.
- October 2018: NOAA launched the official version 4. For the purposes of this analysis, we have treated the “beta” and official version 4 datasets as equivalent, but for reference we have listed the numbers of “beta” datasets downloaded in the right-hand column of Table 2.
- August 2019: NOAA discontinued version 3.
- July to August 2021: P.O’N. processed the data for each of the stations in this analysis in several stages over the period from 7 July–20 August 2021. However, he still continues to download and archive the dataset daily at the time of writing.
2.2. Station History Metadata Available
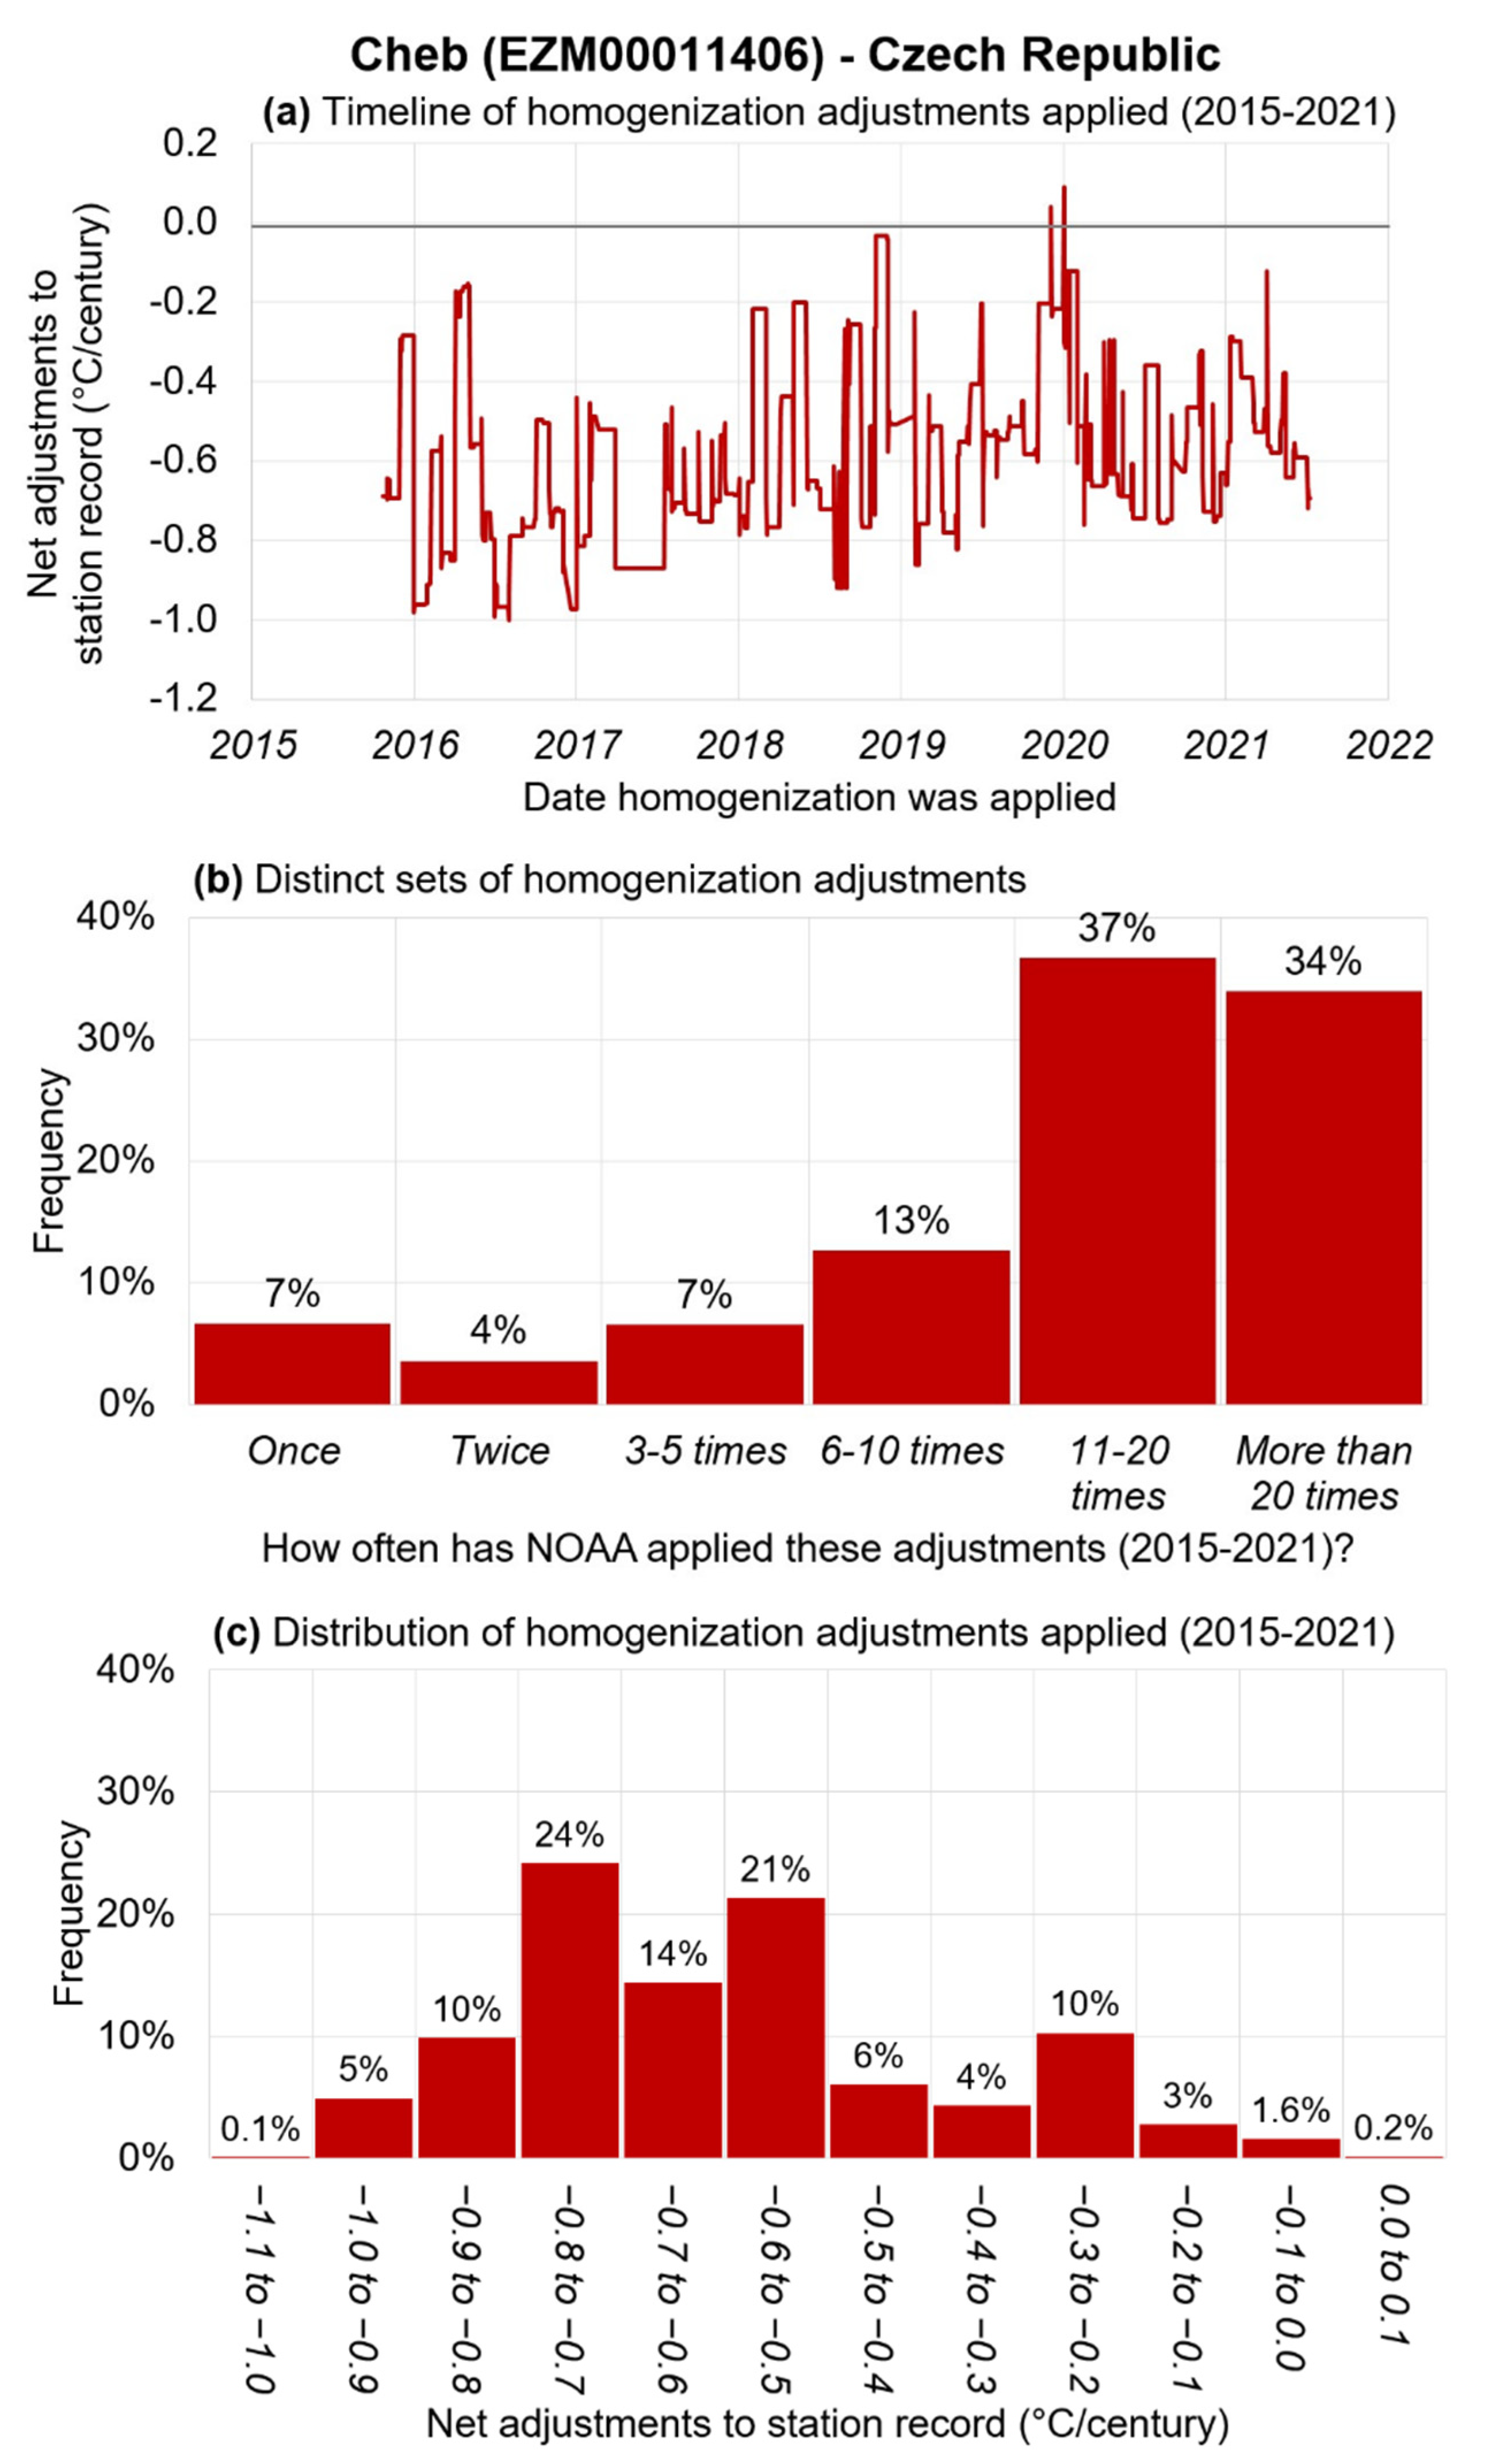
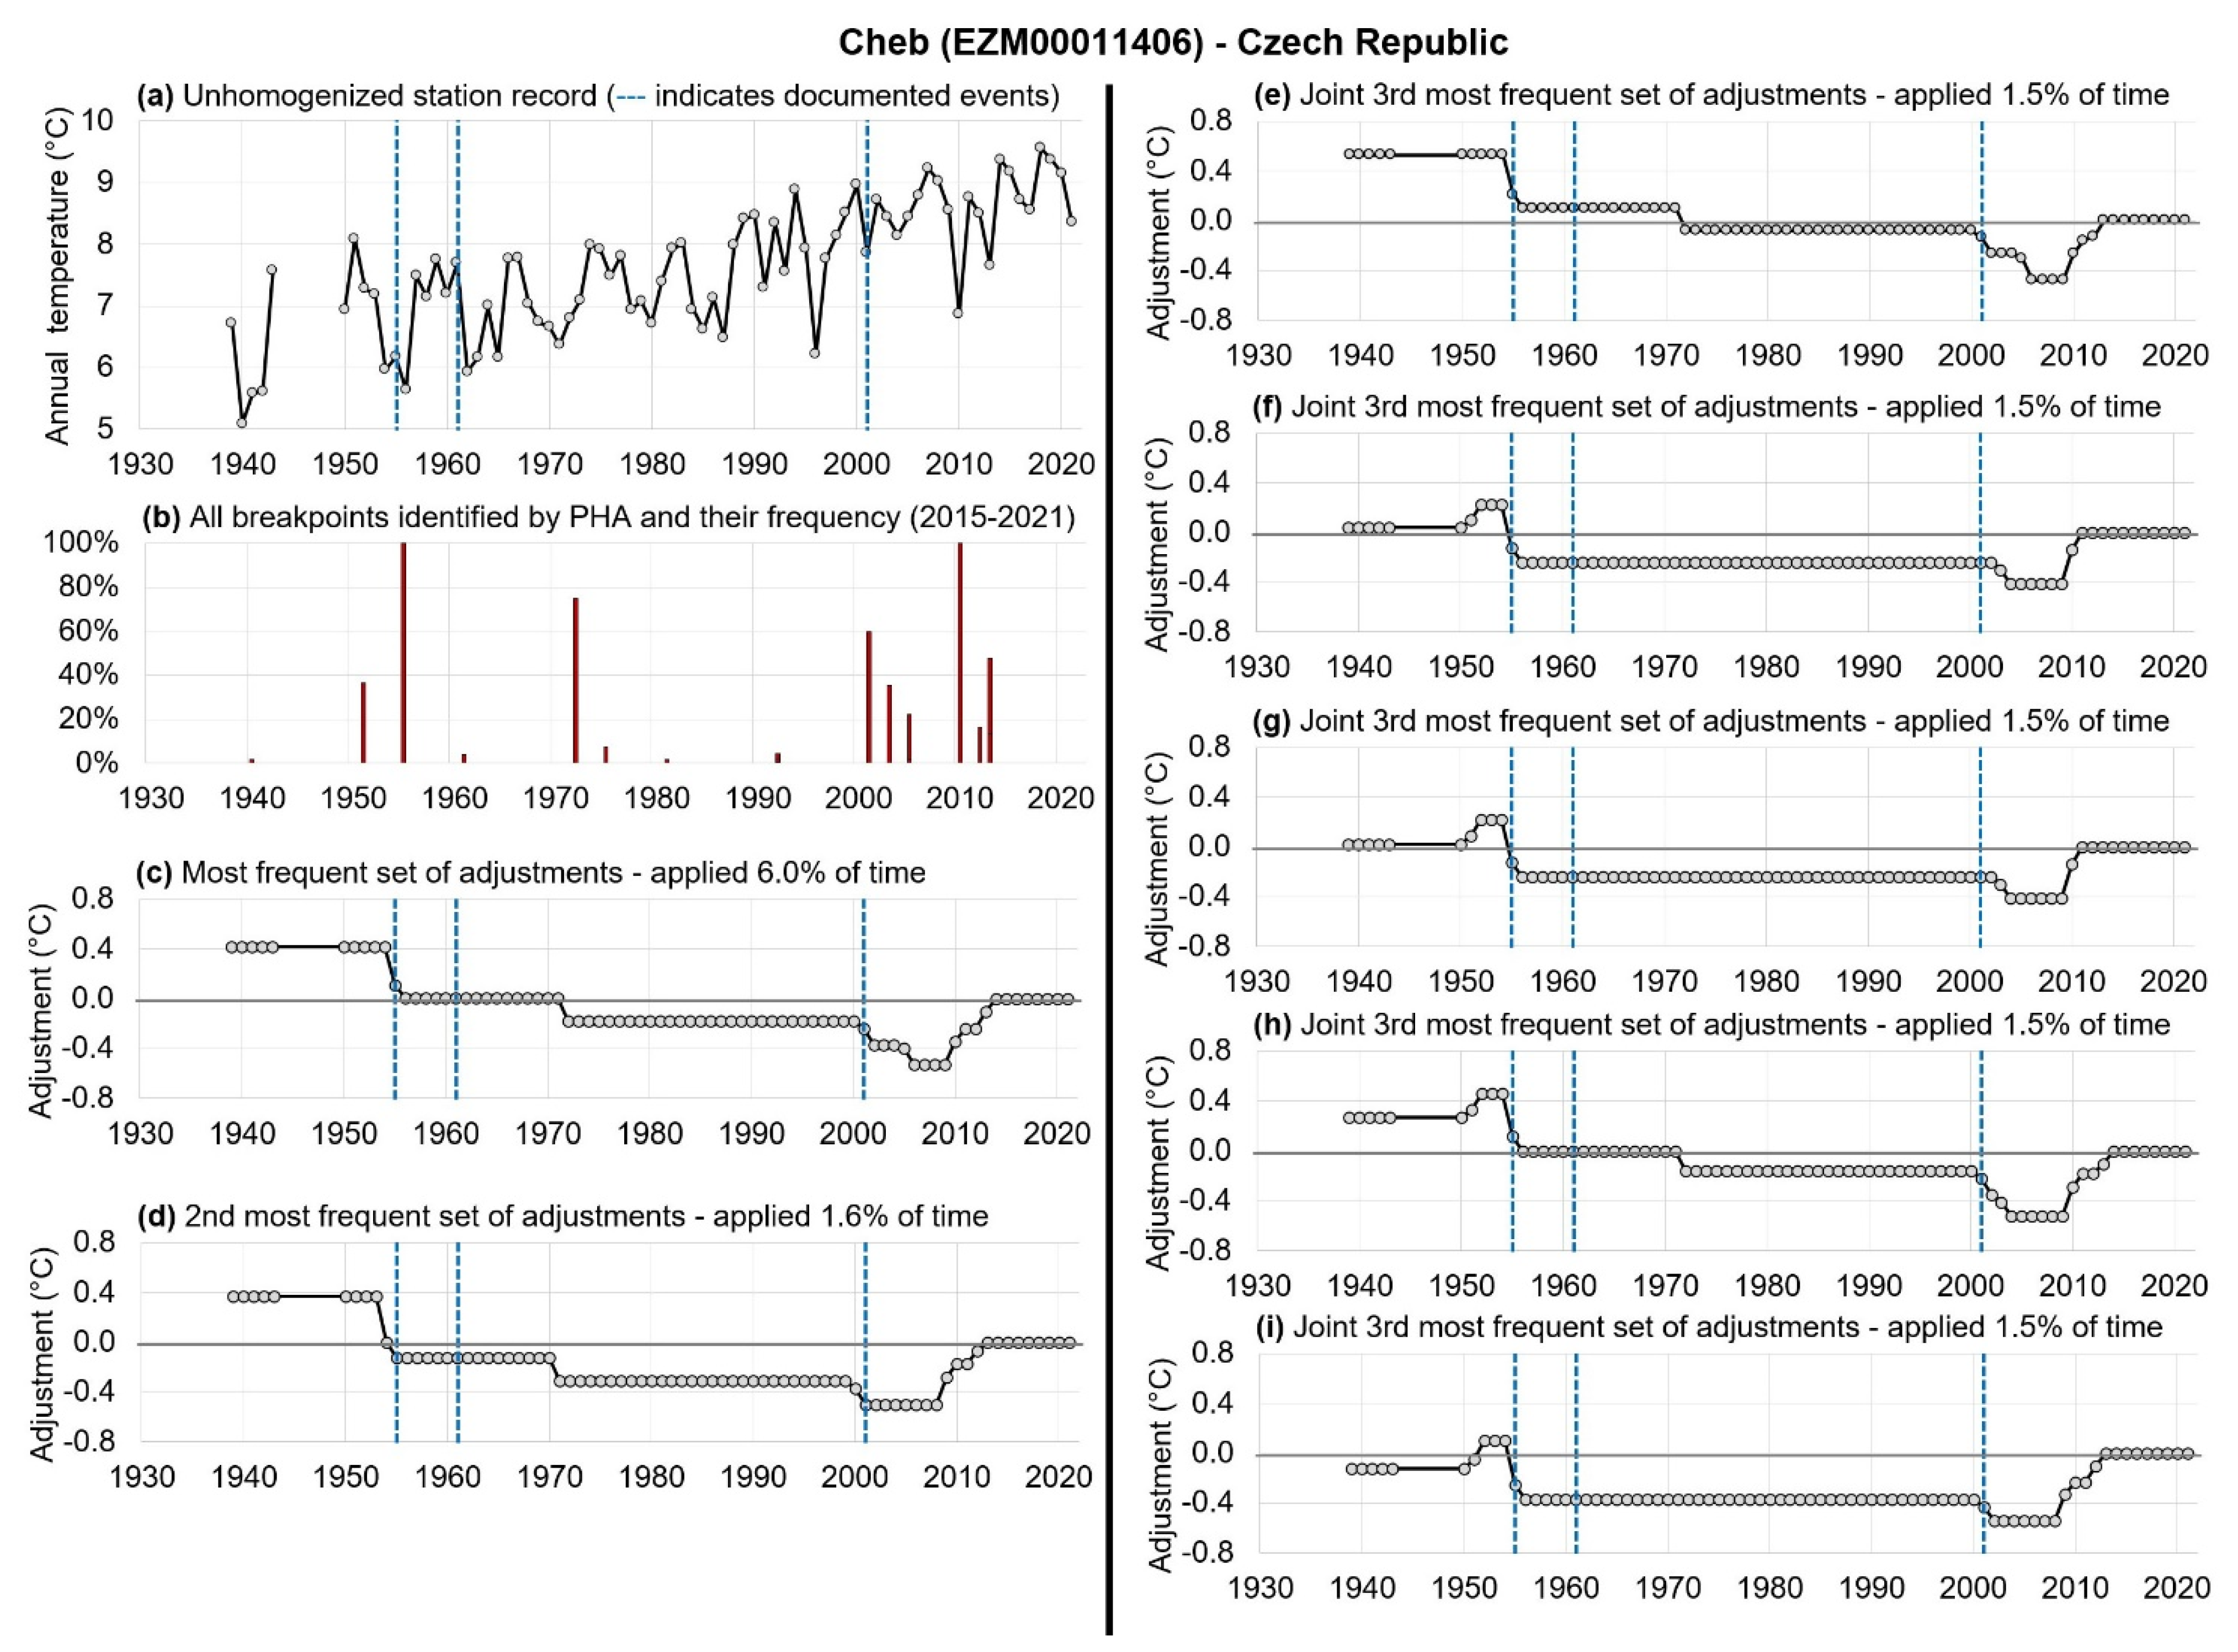
2.3. Case Study of Cheb, Czech Republic as an Example of Our Analysis Framework
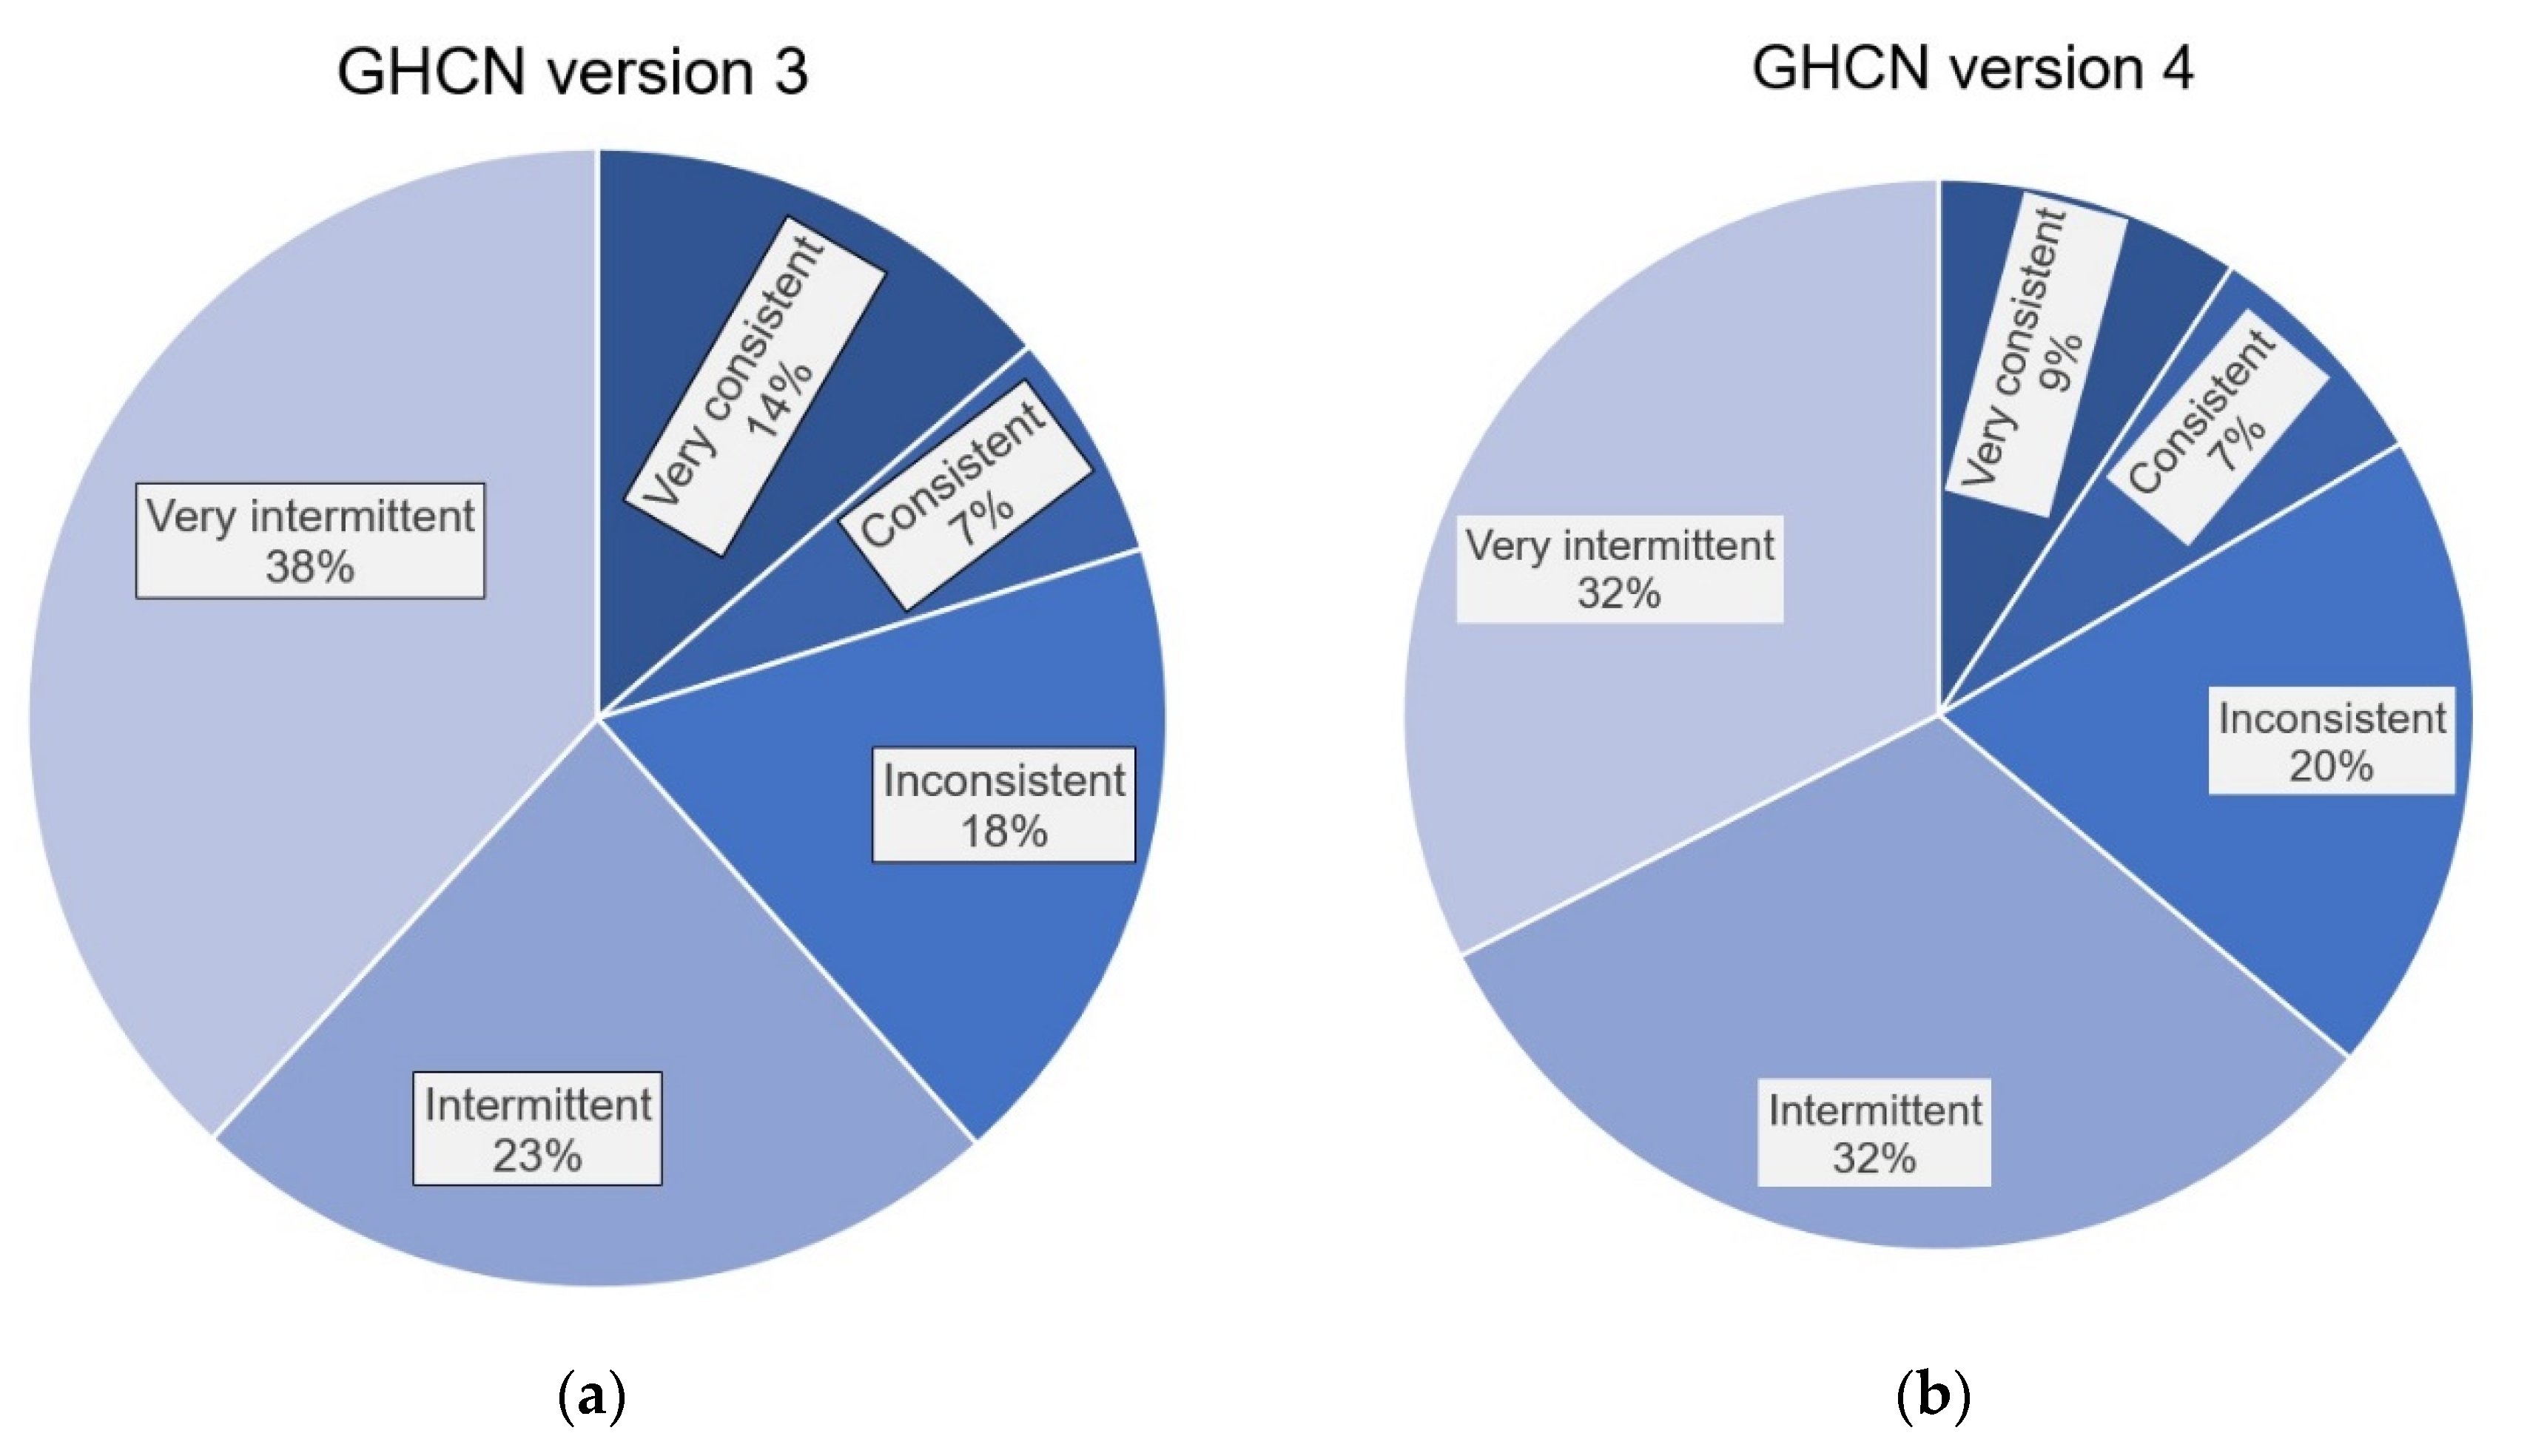
- “Very consistent”: the breakpoint was identified for >95% of the PHA runs;
- “Consistent”: the breakpoint was identified >75%, but ≤95% of the runs;
- “Inconsistent”: the breakpoint was identified for >25%, but ≤75% of the runs;
- “Intermittent”: the breakpoint was identified >5%, but ≤25% of the runs;
- “Very intermittent”: the breakpoint was identified for ≤5% of the runs;
3. Results
A Case Study of the Ukrainian Results
4. Discussion
Supplementary Materials
Author Contributions
Funding
Acknowledgments
Conflicts of Interest
References
- Vose, R.S.; Schmoyer, R.L.; Steurer, P.M.; Peterson, T.C.; Heim, R.; Karl, T.R.; Eischeid, J.K. Global Historical Climatology Network, 1753–1990. ORNL DAAC 2016. [Google Scholar] [CrossRef]
- Peterson, T.C.; Vose, R.S. An Overview of the Global Historical Climatology Network Temperature Database. Bull. Am. Meteorol. Soc. 1997, 78, 2837–2850. [Google Scholar] [CrossRef] [Green Version]
- Lawrimore, J.H.; Menne, M.J.; Gleason, B.E.; Williams, C.N.; Wuertz, D.B.; Vose, R.S.; Rennie, J. An Overview of the Global Historical Climatology Network Monthly Mean Temperature Data Set, Version 3. J. Geophys. Res. Atmos. 2011, 116. [Google Scholar] [CrossRef]
- Menne, M.J.; Williams, C.N.; Gleason, B.E.; Rennie, J.J.; Lawrimore, J.H. The Global Historical Climatology Network Monthly Temperature Dataset, Version 4. J. Clim. 2018, 31, 9835–9854. [Google Scholar] [CrossRef]
- Vose, R.S.; Arndt, D.; Banzon, V.F.; Easterling, D.R.; Gleason, B.; Huang, B.; Kearns, E.; Lawrimore, J.H.; Menne, M.J.; Peterson, T.C.; et al. NOAA’s Merged Land–Ocean Surface Temperature Analysis. Bull. Am. Meteorol. Soc. 2012, 93, 1677–1685. [Google Scholar] [CrossRef]
- Huang, B.; Menne, M.J.; Boyer, T.; Freeman, E.; Gleason, B.E.; Lawrimore, J.H.; Liu, C.; Rennie, J.J.; Schreck, C.J.; Sun, F.; et al. Uncertainty Estimates for Sea Surface Temperature and Land Surface Air Temperature in NOAAGlobalTemp Version 5. J. Clim. 2020, 33, 1351–1379. [Google Scholar] [CrossRef]
- Hansen, J.; Ruedy, R.; Sato, M.; Lo, K. Global Surface Temperature Change. Rev. Geophys. 2010, 48. [Google Scholar] [CrossRef] [Green Version]
- Lenssen, N.J.L.; Schmidt, G.A.; Hansen, J.E.; Menne, M.J.; Persin, A.; Ruedy, R.; Zyss, D. Improvements in the GISTEMP Uncertainty Model. J. Geophys. Res. Atmos. 2019, 124, 6307–6326. [Google Scholar] [CrossRef]
- Japan Meteorological Agency (JMA). Tokyo Climate Center Global Average Surface Temperature Anomalies/TCC. Available online: http://ds.data.jma.go.jp/tcc/tcc/products/gwp/temp/ann_wld.html (accessed on 26 November 2021).
- Jones, P.D.; Lister, D.H.; Osborn, T.J.; Harpham, C.; Salmon, M.; Morice, C.P. Hemispheric and Large-Scale Land-Surface Air Temperature Variations: An Extensive Revision and an Update to 2010. J. Geophys. Res. Atmos. 2012, 117. [Google Scholar] [CrossRef] [Green Version]
- Osborn, T.J.; Jones, P.D.; Lister, D.H.; Morice, C.P.; Simpson, I.R.; Winn, J.P.; Hogan, E.; Harris, I.C. Land Surface Air Temperature Variations Across the Globe Updated to 2019: The CRUTEM5 Data Set. J. Geophys. Res. Atmos. 2021, 126, e2019JD032352. [Google Scholar] [CrossRef]
- Sun, X.; Ren, G.; Xu, W.; Li, Q.; Ren, Y. Global Land-Surface Air Temperature Change Based on the New CMA GLSAT Data Set. Sci. Bull. 2017, 62, 236–238. [Google Scholar] [CrossRef] [Green Version]
- Xu, W.; Li, Q.; Jones, P.; Wang, X.L.; Trewin, B.; Yang, S.; Zhu, C.; Zhai, P.; Wang, J.; Vincent, L.; et al. A New Integrated and Homogenized Global Monthly Land Surface Air Temperature Dataset for the Period since 1900. Clim. Dyn. 2018, 50, 2513–2536. [Google Scholar] [CrossRef]
- Sun, W.; Li, Q.; Huang, B.; Cheng, J.; Song, Z.; Li, H.; Dong, W.; Zhai, P.; Jones, P. The Assessment of Global Surface Temperature Change from 1850s: The C-LSAT2.0 Ensemble and the CMST-Interim Datasets. Adv. Atmos. Sci. 2021, 38, 875–888. [Google Scholar] [CrossRef]
- Rohde, R.; Muller, R.A.; Jacobsen, R.; Muller, E.; Perlmutter, S.; Rosenfeld, A.; Wurtele, J.; Groom, D.; Wickham, C. A New Estimate of the Average Earth Surface Land Temperature Spanning 1753 to 2011. Geoinform. Geostat. Overv. 2013, 2013. [Google Scholar] [CrossRef]
- Rohde, R.; Muller, R.; Jacobsen, R.; Perlmutter, S.; Rosenfeld, A.; Wurtele, J.; Curry, J.; Wickham, C.; Mosher, S. Berkeley Earth Temperature Averaging Process. Geoinfor. Geostat. Overv. 2013, 2013. [Google Scholar] [CrossRef]
- Rohde, R.A.; Hausfather, Z. The Berkeley Earth Land/Ocean Temperature Record. Earth Syst. Sci. Data 2020, 12, 3469–3479. [Google Scholar] [CrossRef]
- Soon, W.; Connolly, R.; Connolly, M. Re-Evaluating the Role of Solar Variability on Northern Hemisphere Temperature Trends since the 19th Century. Earth-Sci. Rev. 2015, 150, 409–452. [Google Scholar] [CrossRef]
- Connolly, R.; Soon, W.; Connolly, M.; Baliunas, S.; Berglund, J.; Butler, C.J.; Cionco, R.G.; Elias, A.G.; Fedorov, V.M.; Harde, H.; et al. How Much Has the Sun Influenced Northern Hemisphere Temperature Trends? An Ongoing Debate. Res. Astron. Astrophys. 2021, 21, 131. [Google Scholar] [CrossRef]
- Easterling, D.R.; Karl, T.R.; Lawrimore, J.H.; Del Greco, S.A. United States Historical Climatology Network Daily Temperature and Precipitation Data (1871–1997); Oak Ridge National Lab. (ORNL): Oak Ridge, TN, USA, 2002.
- Menne, M.J.; Williams, C.N.; Vose, R.S. The U.S. Historical Climatology Network Monthly Temperature Data, Version 2. Bull. Am. Meteorol. Soc. 2009, 90, 993–1008. [Google Scholar] [CrossRef] [Green Version]
- Karl, T.R.; Williams, C.N.; Young, P.J.; Wendland, W.M. A Model to Estimate the Time of Observation Bias Associated with Monthly Mean Maximum, Minimum and Mean Temperatures for the United States. J. Appl. Meteorol. Climatol. 1986, 25, 145–160. [Google Scholar] [CrossRef] [Green Version]
- Quayle, R.G.; Easterline, D.R.; Karl, T.R.; Hughes, P.Y. Effects of Recent Thermometer Changes in the Cooperative Station Network. Bull. Am. Meteorol. Soc. 1991, 72, 1718–1724. [Google Scholar] [CrossRef]
- Karl, T.R.; Williams, C.N. An Approach to Adjusting Climatological Time Series for Discontinuous Inhomogeneities. J. Appl. Meteorol. Climatol. 1987, 26, 1744–1763. [Google Scholar] [CrossRef] [Green Version]
- Karl, T.R.; Diaz, H.F.; Kukla, G. Urbanization: Its Detection and Effect in the United States Climate Record. J. Clim. 1988, 1, 1099–1123. [Google Scholar] [CrossRef] [Green Version]
- Easterling, D.R.; Peterson, T.C. A New Method for Detecting Undocumented Discontinuities in Climatological Time Series. Int. J. Climatol. 1995, 15, 369–377. [Google Scholar] [CrossRef]
- Menne, M.J.; Williams, C.N. Homogenization of Temperature Series via Pairwise Comparisons. J. Clim. 2009, 22, 1700–1717. [Google Scholar] [CrossRef] [Green Version]
- Vose, R.S.; Williams, C.N.; Peterson, T.C.; Karl, T.R.; Easterling, D.R. An Evaluation of the Time of Observation Bias Adjustment in the U.S. Historical Climatology Network. Geophys. Res. Lett. 2003, 30. [Google Scholar] [CrossRef] [Green Version]
- Menne, M.J.; Williams, C.N.; Palecki, M.A. On the Reliability of the U.S. Surface Temperature Record. J. Geophys. Res. Atmospheres 2010, 115. [Google Scholar] [CrossRef] [Green Version]
- Davey, C.A.; Pielke, R.A., Sr. Microclimate Exposures of Surface-Based Weather Stations: Implications For The Assessment of Long-Term Temperature Trends. Bull. Am. Meteorol. Soc. 2005, 86, 497–504. [Google Scholar] [CrossRef] [Green Version]
- Mahmood, R.; Foster, S.A.; Logan, D. The GeoProfile Metadata, Exposure of Instruments, and Measurement Bias in Climatic Record Revisited. Int. J. Climatol. 2006, 26, 1091–1124. [Google Scholar] [CrossRef]
- Pielke, R.A.; Davey, C.A.; Niyogi, D.; Fall, S.; Steinweg-Woods, J.; Hubbard, K.; Lin, X.; Cai, M.; Lim, Y.-K.; Li, H.; et al. Unresolved Issues with the Assessment of Multidecadal Global Land Surface Temperature Trends. J. Geophys. Res. Atmos. 2007, 112. [Google Scholar] [CrossRef]
- Fall, S.; Watts, A.; Nielsen-Gammon, J.; Jones, E.; Niyogi, D.; Christy, J.R.; Pielke, R.A. Analysis of the Impacts of Station Exposure on the U.S. Historical Climatology Network Temperatures and Temperature Trends. J. Geophys. Res. Atmos. 2011, 116. [Google Scholar] [CrossRef] [Green Version]
- Williams, C.N.; Menne, M.J.; Thorne, P.W. Benchmarking the Performance of Pairwise Homogenization of Surface Temperatures in the United States. J. Geophys. Res. Atmos. 2012, 117. [Google Scholar] [CrossRef] [Green Version]
- Venema, V.K.C.; Mestre, O.; Aguilar, E.; Auer, I.; Guijarro, J.A.; Domonkos, P.; Vertacnik, G.; Szentimrey, T.; Stepanek, P.; Zahradnicek, P.; et al. Benchmarking Homogenization Algorithms for Monthly Data. Clim. Past 2012, 8, 89–115. [Google Scholar] [CrossRef] [Green Version]
- Domonkos, P.; Guijarro, J.A.; Venema, V.; Brunet, M.; Sigró, J. Efficiency of Time Series Homogenization: Method Comparison with 12 Monthly Temperature Test Datasets. J. Clim. 2021, 34, 2877–2891. [Google Scholar] [CrossRef]
- Hausfather, Z.; Menne, M.J.; Williams, C.N.; Masters, T.; Broberg, R.; Jones, D. Quantifying the Effect of Urbanization on U.S. Historical Climatology Network Temperature Records. J. Geophys. Res. Atmos. 2013, 118, 481–494. [Google Scholar] [CrossRef] [Green Version]
- Soon, W.W.-H.; Connolly, R.; Connolly, M.; O’Neill, P.; Zheng, J.; Ge, Q.; Hao, Z.; Yan, H. Comparing the Current and Early 20th Century Warm Periods in China. Earth-Sci. Rev. 2018, 185, 80–101. [Google Scholar] [CrossRef]
- Soon, W.W.-H.; Connolly, R.; Connolly, M.; O’Neill, P.; Zheng, J.; Ge, Q.; Hao, Z.; Yan, H. Reply to Li & Yang’s Comments on “Comparing the Current and Early 20th Century Warm Periods in China”. Earth-Sci. Rev. 2019, 198, 102950. [Google Scholar] [CrossRef]
- DeGaetano, A.T. Attributes of Several Methods for Detecting Discontinuities in Mean Temperature Series. J. Clim. 2006, 19, 838–853. [Google Scholar] [CrossRef]
- Li, Q.; Yang, Y. Comments on “Comparing the Current and Early 20th Century Warm Periods in China” by Soon W., R. Connolly, M. Connolly et Al. Earth-Sci. Rev. 2019, 198, 102886. [Google Scholar] [CrossRef]
- Ren, G.; Li, J.; Ren, Y.; Chu, Z.; Zhang, A.; Zhou, Y.; Zhang, L.; Zhang, Y.; Bian, T. An Integrated Procedure to Determine a Reference Station Network for Evaluating and Adjusting Urban Bias in Surface Air Temperature Data. J. Appl. Meteorol. Climatol. 2015, 54, 1248–1266. [Google Scholar] [CrossRef]
- Ren, G.; Ding, Y.; Tang, G. An Overview of Mainland China Temperature Change Research. J. Meteorol. Res. 2017, 31, 3–16. [Google Scholar] [CrossRef]
- Brönnimann, S.; Allan, R.; Ashcroft, L.; Baer, S.; Barriendos, M.; Brázdil, R.; Brugnara, Y.; Brunet, M.; Brunetti, M.; Chimani, B.; et al. Unlocking Pre-1850 Instrumental Meteorological Records: A Global Inventory. Bull. Am. Meteorol. Soc. 2019, 100, ES389–ES413. [Google Scholar] [CrossRef]
- Brázdil, R.; Zahradníček, P.; Pišoft, P.; Štěpánek, P.; Bělínová, M.; Dobrovolný, P. Temperature and Precipitation Fluctuations in the Czech Republic during the Period of Instrumental Measurements. Theor. Appl. Climatol. 2012, 110, 17–34. [Google Scholar] [CrossRef]
- Chimani, B.; Auer, I.; Prohom, M.; Nadbath, M.; Paul, A.; Rasol, D. Data Rescue in Selected Countries in Connection with the EUMETNET DARE Activity. Geosci. Data J. 2021, in press. [Google Scholar] [CrossRef]
- Pfister, L.; Hupfer, F.; Brugnara, Y.; Munz, L.; Villiger, L.; Meyer, L.; Schwander, M.; Isotta, F.A.; Rohr, C.; Brönnimann, S. Early Instrumental Meteorological Measurements in Switzerland. Clim. Past 2019, 15, 1345–1361. [Google Scholar] [CrossRef] [Green Version]
- Brugnara, Y.; Pfister, L.; Villiger, L.; Rohr, C.; Isotta, F.A.; Brönnimann, S. Early Instrumental Meteorological Observations in Switzerland: 1708–1873. Earth Syst. Sci. Data 2020, 12, 1179–1190. [Google Scholar] [CrossRef]
- Skrynyk, O.; Luterbacher, J.; Allan, R.; Boichuk, D.; Sidenko, V.; Skrynyk, O.; Palarz, A.; Oshurok, D.; Xoplaki, E.; Osadchyi, V. Ukrainian Early (Pre-1850) Historical Weather Observations. Geosci. Data J. 2021, 8, 55–73. [Google Scholar] [CrossRef]
- Mateus, C.; Potito, A.; Curley, M. Reconstruction of a Long-Term Historical Daily Maximum and Minimum Air Temperature Network Dataset for Ireland (1831–1968). Geosci. Data J. 2020, 7, 102–115. [Google Scholar] [CrossRef]
- Kaspar, F.; Tinz, B.; Mächel, H.; Gates, L. Data Rescue of National and International Meteorological Observations at Deutscher Wetterdienst. In Proceedings of the Advances in Science and Research; 14th EMS Annual Meeting & 10th European Conference on Applied Climatology (ECAC), Prague, Czech Republic, 17 April 2015; Copernicus GmbH: Göttingen, Germany, 2015; Volume 12, pp. 57–61. [Google Scholar]
- Camuffo, D. History of the Long Series of Daily Air Temperature in Padova (1725–1998). In Improved Understanding of Past Climatic Variability from Early Daily European Instrumental Sources; Camuffo, D., Jones, P., Eds.; Springer: Dordrecht, The Netherlands, 2002; pp. 7–75. ISBN 978-94-010-0371-1. [Google Scholar]
- Camuffo, D.; Bertolin, C. Recovery of the Early Period of Long Instrumental Time Series of Air Temperature in Padua, Italy (1716–2007). Phys. Chem. Earth Parts ABC 2012, 40–41, 23–31. [Google Scholar] [CrossRef]
- Kuglitsch, F.G.; Auchmann, R.; Bleisch, R.; Brönnimann, S.; Martius, O.; Stewart, M. Break Detection of Annual Swiss Temperature Series. J. Geophys. Res. Atmos. 2012, 117. [Google Scholar] [CrossRef] [Green Version]
- Mamara, A.; Argiriou, A.A.; Anadranistakis, M. Detection and Correction of Inhomogeneities in Greek Climate Temperature Series. Int. J. Climatol. 2014, 34, 3024–3043. [Google Scholar] [CrossRef]
- Osadchyi, V.; Skrynyk, O.; Radchenko, R.; Skrynyk, O. Homogenization of Ukrainian Air Temperature Data. Int. J. Climatol. 2018, 38, 497–505. [Google Scholar] [CrossRef]
- Skrynyk, O.; Aguilar, E.; Skrynyk, O.; Sidenko, V.; Boichuk, D.; Osadchyi, V. Quality Control and Homogenization of Monthly Extreme Air Temperature of Ukraine. Int. J. Climatol. 2019, 39, 2071–2079. [Google Scholar] [CrossRef]
- Pospieszyńska, A.; Przybylak, R. Air Temperature Changes in Toruń (Central Poland) from 1871 to 2010. Theor. Appl. Climatol. 2019, 135, 707–724. [Google Scholar] [CrossRef] [Green Version]
- Przybylak, R. The Climate of Poland in Recent Centuries: A Synthesis of Current Knowledge: Instrumental Observations. In The Polish Climate in the European Context: An Historical Overview; Przybylak, R., Majorowicz, J., Brázdil, R., Kejna, M., Eds.; Springer: Berlin/Heidelberg, Germany, 2010; pp. 129–166. ISBN 978-90-481-3167-9. [Google Scholar]
- Butler, C.J.; García Suárez, A.M.; Coughlin, A.D.S.; Morrell, C. Air Temperatures at Armagh Observatory, Northern Ireland, from 1796 to 2002. Int. J. Climatol. 2005, 25, 1055–1079. [Google Scholar] [CrossRef] [Green Version]
- Keevallik, S.; Vint, K. Influence of Changes in the Station Location and Measurement Routine on the Homogeneity of the Temperature, Wind Speed and Precipitation Time Series. Est. J. Eng. 2012, 18, 302–313. [Google Scholar] [CrossRef] [Green Version]
- Moberg, A.; Bergström, H. Homogenization of Swedish Temperature Data. Part III: The Long Temperature Records from Uppsala and Stockholm. Int. J. Climatol. 1997, 17, 667–699. [Google Scholar] [CrossRef]
- Moberg, A.; Alexandersson, H.; Bergström, H.; Jones, P.D. Were Southern Swedish Summer Temperatures before 1860 as Warm as Measured? Int. J. Climatol. 2003, 23, 1495–1521. [Google Scholar] [CrossRef]
- Bryś, K.; Bryś, T. Reconstruction of the 217-Year (1791–2007) Wrocław Air Temperature and Precipitation Series. Bull. Geogr. Phys. Geogr. Ser. 2010, 3, 121–171. [Google Scholar] [CrossRef] [Green Version]
- Burt, S.; Burt, T. Oxford Weather and Climate Since 1767; Oxford University Press: Oxford, UK, 2019; ISBN 978-0-19-883463-2. [Google Scholar]
- Cappelen, J.; Kern-Hansen, C.; Laursen, E.V.; Jørgensen, P.V.; Jørgensen, B.V. Denmark—DMI Historical Climate Data Collection 1768–2019; Danish Meteorological Institute: Copenhagen, Denmark, 2020; p. 112. Available online: https://www.dmi.dk/fileadmin/user_upload/Rapporter/TR/2020/DMIRep20-02.pdf (accessed on 12 January 2022).
- Lundstad, E.; Tveito, O.E. Homogenization of Daily Mean Temperature in Norway; DNMI, Norwegian Meteorological Institute: Oslo, Norway, 2016; p. 78. Available online: https://www.met.no/publikasjoner/met-report/met-report-2016/ (accessed on 12 January 2022).
- Khasandi Kuya, E.; Gjelten, H.M.; Tveito, O.E. Homogenization of Norway’s Mean Monthly Temperature Series; MET Report No. 3/2020; Norwegian Meteorological Institute: Oslo, Norway, 2020; p. 95. Available online: https://www.met.no/sokeresultat/ (accessed on 12 January 2022).
- Nojarov, P. Changes in Air Temperatures and Atmosphere Circulation in High Mountainous Parts of Bulgaria for the Period 1941–2008. J. Mt. Sci. 2012, 9, 185–200. [Google Scholar] [CrossRef]
- Nojarov, P. Atmospheric Circulation as a Factor for Air Temperatures in Bulgaria. Meteorol. Atmos. Phys. 2014, 125, 145–158. [Google Scholar] [CrossRef]
- Nojarov, P. Factors Affecting Air Temperature in Bulgaria. Theor. Appl. Climatol. 2019, 137, 571–586. [Google Scholar] [CrossRef]
- Mamara, A.; Argiriou, A.A.; Anadranistakis, M. Homogenization of Mean Monthly Temperature Time Series of Greece. Int. J. Climatol. 2013, 33, 2649–2666. [Google Scholar] [CrossRef]
- KHMO (Kiev Hydrometeorological Observatory). History and Physico-Geographical Description of Meteorological Stations; Climatological Handbook USSR, Issue 10, Ukrainian SSR; KHMO: Kiev, Ukraine, 1968. (In Russian) [Google Scholar]
- CGO (Central Geophysical Observatory, formerly KHMO). History and Physiographic Description of Ukrainian Meteorological Stations; Climatological Handbook; CGO: Kyiv, Ukraine, 2011. (In Ukrainian) [Google Scholar]
- Mestre, O.; Domonkos, P.; Picard, F.; Auer, I.; Robin, S.; Lebarbier, E.; Boehm, R.; Aguilar, E.; Guijarro, J.; Vertachnik, G.; et al. HOMER: A Homogenization Software—Methods and Applications. Idojaras 2013, 117, 47–67. [Google Scholar]
- Dijkstra, F.; de Vos, R.; Ruis, J.; Crok, M. Reassessment of the Homogenization of Daily Maximum Temperatures in the Netherlands since 1901. Theor. Appl. Climatol. 2021. [Google Scholar] [CrossRef]
- Spinoni, J.; Szalai, S.; Szentimrey, T.; Lakatos, M.; Bihari, Z.; Nagy, A.; Németh, Á.; Kovács, T.; Mihic, D.; Dacic, M.; et al. Climate of the Carpathian Region in the Period 1961–2010: Climatologies and Trends of 10 Variables. Int. J. Climatol. 2015, 35, 1322–1341. [Google Scholar] [CrossRef] [Green Version]
- Brugnara, Y.; Auchmann, R.; Brönnimann, S.; Allan, R.J.; Auer, I.; Barriendos, M.; Bergström, H.; Bhend, J.; Brázdil, R.; Compo, G.P.; et al. A Collection of Sub-Daily Pressure and Temperature Observations for the Early Instrumental Period with a Focus on the “Year without a Summer” 1816. Clim. Past 2015, 11, 1027–1047. [Google Scholar] [CrossRef] [Green Version]
- Wypych, A.; Ustrnul, Z.; Schmatz, D.R. Long-Term Variability of Air Temperature and Precipitation Conditions in the Polish Carpathians. J. Mt. Sci. 2018, 15, 237–253. [Google Scholar] [CrossRef]
- Dunn, R.J.H.; Willett, K.M.; Morice, C.P.; Parker, D.E. Pairwise Homogeneity Assessment of HadISD. Clim. Past 2014, 10, 1501–1522. [Google Scholar] [CrossRef] [Green Version]
- Dunn, R.J.H.; Willett, K.M.; Parker, D.E.; Mitchell, L. Expanding HadISD: Quality-Controlled, Sub-Daily Station Data from 1931. Geosci. Instrum. Methods Data Syst. 2016, 5, 473–491. [Google Scholar] [CrossRef] [Green Version]
- Willett, K.M.; Dunn, R.J.H.; Thorne, P.W.; Bell, S.; de Podesta, M.; Parker, D.E.; Jones, P.D.; Williams, C.N., Jr. HadISDH Land Surface Multi-Variable Humidity and Temperature Record for Climate Monitoring. Clim. Past 2014, 10, 1983–2006. [Google Scholar] [CrossRef] [Green Version]
- Thorne, P.W.; Menne, M.J.; Williams, C.N.; Rennie, J.J.; Lawrimore, J.H.; Vose, R.S.; Peterson, T.C.; Durre, I.; Davy, R.; Esau, I.; et al. Reassessing Changes in Diurnal Temperature Range: A New Data Set and Characterization of Data Biases. J. Geophys. Res. Atmos. 2016, 121, 5115–5137. [Google Scholar] [CrossRef]
- Trewin, B. A Daily Homogenized Temperature Data Set for Australia. Int. J. Climatol. 2013, 33, 1510–1529. [Google Scholar] [CrossRef]
- Trewin, B.; Braganza, K.; Fawcett, R.; Grainger, S.; Jovanovic, B.; Jones, D.; Martin, D.; Smalley, R.; Webb, V. An Updated Long-Term Homogenized Daily Temperature Data Set for Australia. Geosci. Data J. 2020, 7, 149–169. [Google Scholar] [CrossRef]
- Venema, V.; Trewin, B.; Wang, X.; Szentimrey, T.; Lakatos, M.; Aguilar, E.; Auer, I.; Guijarro, J.A.; Menne, M.; Oria, C. Guidance on the Homogenization of Climate Station Data. 2018. Available online: https://eartharxiv.org/repository/view/1158/ (accessed on 12 January 2022).
- Mitchell, J.M., Jr. On the Causes of Instrumentally Observed Secular Temperature Trends. J. Atmos. Sci. 1953, 10, 244–261. [Google Scholar] [CrossRef] [Green Version]
- Vertačnik, G.; Dolinar, M.; Bertalanič, R.; Klančar, M.; Dvoršek, D.; Nadbath, M. Ensemble Homogenization of Slovenian Monthly Air Temperature Series. Int. J. Climatol. 2015, 35, 4015–4026. [Google Scholar] [CrossRef]
- Yosef, Y.; Aguilar, E.; Alpert, P. Detecting and Adjusting Artificial Biases of Long-Term Temperature Records in Israel. Int. J. Climatol. 2018, 38, 3273–3289. [Google Scholar] [CrossRef]
- Schumacher, E.F. Small Is Beautiful: Economics as If People Mattered; Reprint ed.; (Original 1973); Harper Perennial: New York, NY, USA, 2010; ISBN 978-0-06-199776-1. [Google Scholar]
- Domonkos, P. Combination of Using Pairwise Comparisons and Composite Reference Series: A New Approach in the Homogenization of Climatic Time Series with ACMANT. Atmosphere 2021, 12, 1134. [Google Scholar] [CrossRef]
- Wang, X.; Feng, Y. RHtestsV4 User Manual. Environment Canada Science and Technology Branch Atmospheric Science and Technology Directorate Climate Research. Div. Res. Rep. 2013. Available online: http://etccdi.pacificclimate.org/RHtest/RHtestsV4_UserManual_10Dec2014.pdf (accessed on 12 January 2022).
- Squintu, A.A.; van der Schrier, G.; Štěpánek, P.; Zahradníček, P.; Tank, A.K. Comparison of Homogenization Methods for Daily Temperature Series against an Observation-Based Benchmark Dataset. Theor. Appl. Climatol. 2020, 140, 285–301. [Google Scholar] [CrossRef] [Green Version]


| Time Series | GHCN (Raw) | GHCN (Homogenized) | Extra Homogenization |
|---|---|---|---|
| NOAA National Centers for Environmental Information (NCEI), “NOAAGlobalTemp” [3,4,5,6] | × | 1° data source | No |
| NASA Goddard Institute for Space Studies (GISS), “GISTEMP” [7,8] | × | 1° data source | Yes |
| Japan Meteorological Agency (JMA) [9] | × | 1° data source | No |
| Climate Research Unit (CRU), “CRUTEM” [10,11] | × | 1° source for U.S.; 2° source for rest of world | No |
| Chinese Meteorological Administration (CMA), “C-LSAT” [12,13,14] | 2° source for global data | 1° source for U.S. | Yes, except for U.S. component |
| Berkeley Earth, “BEST” [15,16,17] | 2° data source | × | Yes |
| Connolly et al. (2021), “Rural-only Northern Hemisphere” [18,19] | 1° data source | × | Yes |
| Year | GHCN Version 3 | GHCN Version 4 | Version 4 (“Beta”) |
|---|---|---|---|
| 2011 | 6 | - | - |
| 2012 | 39 | - | - |
| 2013 | 34 | - | - |
| 2014 | 283 | - | - |
| 2015 | 316 | 71 | (71) |
| 2016 | 342 | 303 | (303) |
| 2017 | 346 | 322 | (322) |
| 2018 | 315 | 314 | (256) |
| 2019 | 196 | 287 | - |
| 2020 | - | 310 | - |
| 2021 | - | 205 | - |
| Total distinct datasets | 1877 | 1812 | (952) |
| GHCN v3 | GHCN v4 | |||||
|---|---|---|---|---|---|---|
| Country | With Metadata | No Metadata | Analyzed | With Metadata | No Metadata | Analyzed |
| Austria | 11 | 2 | 85% | 53 | 11 | 83% |
| Belgium | 1 | 0 | 100% | 1 | 19 | 5% |
| Bulgaria | 11 | 0 | 100% | 32 | 2 | 94% |
| Croatia | 13 | 0 | 100% | 19 | 2 | 90% |
| Czech Republic | 4 | 11 | 27% | 23 | 18 | 56% |
| Denmark | 4 | 6 | 40% | 16 | 13 | 55% |
| Estonia | 2 | 3 | 40% | 3 | 20 | 13% |
| Finland | 2 | 16 | 11% | 3 | 329 | 1% |
| France | 23 | 20 | 53% | 106 | 18 | 85% |
| Germany | 23 | 57 | 29% | 77 | 697 | 10% |
| Greece | 15 | 0 | 100% | 40 | 0 | 100% |
| Hungary | 7 | 1 | 88% | 26 | 1 | 96% |
| Ireland | 15 | 0 | 100% | 30 | 1 | 97% |
| Italy | 5 | 95 | 5% | 5 | 200 | 2% |
| The Netherlands | 2 | 0 | 100% | 37 | 15 | 71% |
| Norway | 19 | 14 | 58% | 127 | 275 | 32% |
| Poland | 52 | 9 | 85% | 60 | 10 | 86% |
| Russia (“European”) | 1 | 65 | 2% | 2 | 272 | 1% |
| Slovakia | 8 | 0 | 100% | 20 | 0 | 100% |
| Spain | 1 | 34 | 3% | 2 | 135 | 1% |
| Sweden | 3 | 16 | 16% | 5 | 645 | 1% |
| Switzerland | 10 | 1 | 91% | 37 | 7 | 84% |
| Ukraine | 25 | 2 | 93% | 119 | 3 | 98% |
| United Kingdom | 2 | 56 | 3% | 4 | 182 | 2% |
| 24 countries | 259 | 408 | 39% | 847 | 2875 | 23% |
| GHCN Version | Number of Ukrainian Station Series | Detected Break Points | |||
|---|---|---|---|---|---|
| “Intermittent”, i.e., <25% of Homogenization Runs | “Inconsistent”, i.e., 25–75% of Homogenization Runs | “Consistent”, i.e., >75% of Homogenization Runs | Total | ||
| v3 | 25 | 36 (76.6% of total) | 5 (10.6% of total) | 6 (12.8% of total) | 47 (100%) |
| v4 | 119 | 399 (67.4% of total) | 114 (19.3% of total) | 79 (13.3% of total) | 592 (100%) |
| GHCN Version | Break Points Confirmed by Metadata | |||
|---|---|---|---|---|
| “Intermittent”, i.e., <25% of Homogenization Runs | “Inconsistent”, i.e., 25–75% of Homogenization Runs | “Consistent”, i.e., >75% of Homogenization Runs | Total | |
| v3 | 2 (5.6% of detected) | 0 (0% of detected) | 1 (16.7% of detected) | 3 (6.4% of detected) |
| v4 | 17 (4.3% of detected) | 6 (5.3% of detected) | 7 (8.9% of detected) | 30 (5.1% of detected) |
Publisher’s Note: MDPI stays neutral with regard to jurisdictional claims in published maps and institutional affiliations. |
© 2022 by the authors. Licensee MDPI, Basel, Switzerland. This article is an open access article distributed under the terms and conditions of the Creative Commons Attribution (CC BY) license (https://creativecommons.org/licenses/by/4.0/).
Share and Cite
O’Neill, P.; Connolly, R.; Connolly, M.; Soon, W.; Chimani, B.; Crok, M.; de Vos, R.; Harde, H.; Kajaba, P.; Nojarov, P.; et al. Evaluation of the Homogenization Adjustments Applied to European Temperature Records in the Global Historical Climatology Network Dataset. Atmosphere 2022, 13, 285. https://doi.org/10.3390/atmos13020285
O’Neill P, Connolly R, Connolly M, Soon W, Chimani B, Crok M, de Vos R, Harde H, Kajaba P, Nojarov P, et al. Evaluation of the Homogenization Adjustments Applied to European Temperature Records in the Global Historical Climatology Network Dataset. Atmosphere. 2022; 13(2):285. https://doi.org/10.3390/atmos13020285
Chicago/Turabian StyleO’Neill, Peter, Ronan Connolly, Michael Connolly, Willie Soon, Barbara Chimani, Marcel Crok, Rob de Vos, Hermann Harde, Peter Kajaba, Peter Nojarov, and et al. 2022. "Evaluation of the Homogenization Adjustments Applied to European Temperature Records in the Global Historical Climatology Network Dataset" Atmosphere 13, no. 2: 285. https://doi.org/10.3390/atmos13020285
APA StyleO’Neill, P., Connolly, R., Connolly, M., Soon, W., Chimani, B., Crok, M., de Vos, R., Harde, H., Kajaba, P., Nojarov, P., Przybylak, R., Rasol, D., Skrynyk, O., Skrynyk, O., Štěpánek, P., Wypych, A., & Zahradníček, P. (2022). Evaluation of the Homogenization Adjustments Applied to European Temperature Records in the Global Historical Climatology Network Dataset. Atmosphere, 13(2), 285. https://doi.org/10.3390/atmos13020285