Article

Spatiotemporal Characteristics of Droughts and Their Propagation during the Past 67 Years in Northern Thailand

1
State Key Laboratory of Hydroscience and Engineering, Department of Hydraulic Engineering, Tsinghua University, Beijing 100084, China
2
Division of Energy Engineering, Faculty of Engineering, Ramkhamhaeng University, Bangkok 10240, Thailand
*
Author to whom correspondence should be addressed.
Atmosphere 2022, 13(2), 277; https://doi.org/10.3390/atmos13020277
Submission received: 8 December 2021 / Revised: 23 January 2022 / Accepted: 4 February 2022 / Published: 7 February 2022
(This article belongs to the Special Issue Hydrological Responses under Climate Changes)

Abstract

:
Droughts grow concurrently in space and time; however, their spatiotemporal propagation is still not fully studied. In this study, drought propagation and spatiotemporal characteristics were studied in northern, northeastern, and central Thailand (NNCT). The NNCT is an important agricultural exporter worldwide, and droughts here can lead to considerable pressure on the food supply. This study investigated meteorological drought and soil drought in northern Thailand and identified 70 meteorological drought events and 44 soil drought events over 1948–2014. Severe droughts (droughts with long trivariate return periods) mainly occurred after 1975 and were centered in northern and northeastern Thailand. Meteorological drought and soil drought that occurred during 1979–1980 had the longest trivariate return periods of 157 years and 179 years, respectively. The drought centers were mainly located in the Chao Phraya River basin and the Mun River basin. The mean propagation ratios of all drought parameters (duration, area, severity) were lower than 1, indicating that the underlying surface can serve as a buffer to alleviate water deficits. Most of the probability distribution coefficients and all drought propagation ratios of the three drought parameters were found to change significantly based on a moving-window method, indicating that the drought parameters and propagation from meteorological drought to soil drought were non-stationary. Significant increasing trends were detected in mean values of most drought parameters, ranging from 2.4%/decade to 16.6%/decade. Significant decreasing trends were detected in coefficients of skewness (Cs) of all drought parameters and coefficients of variation (Cv) of most drought parameters, ranging from −3.3 to −12.4%/decade, and from −5.5 to −19.4%/decade, respectively. The propagation ratios of all drought parameters showed significant increasing trends, indicating that the function of the underlying surface as a buffer has become weaker. The drought propagation ratios were found to be positively related to two climate indices, the phase index (PI) and the climate seasonality index (CSI). These findings will help to develop a better understanding and management of water resources in Thailand.

1. Introduction

Drought is a catastrophic natural disaster that occurs in both wet regions and dry regions worldwide [1]. Droughts have a complex nature, as they involve interactions between climatological and hydrological processes. Droughts are classified into meteorological droughts, soil droughts, and hydrological droughts [2]. Understanding the spatiotemporal characteristics of droughts and their propagation is important for drought management and drought disaster mitigation.
Various studies have attempted to explore the temporal characteristics of droughts. Sheffield et al. [3] claimed that in the future, meteorological droughts are expected to increase both in severity and frequency due to less regional precipitation and more evaporation. Wood and Sheffield [4] found that the global soil moisture showed a wetting trend in general in the second half of the 20th century, while in some regions, including the Indochina Peninsula, the soil moisture showed an opposite drying trend. Nevertheless, drought evolves simultaneously in both space and time, and drought event analysis with fixed drought areas ignores the spatial evolution of drought. In such cases, spatiotemporal information is partly discarded, so the real characteristics of droughts cannot be captured [5,6,7]. After the development of the severity-area-duration (SAD) drought identification algorithm [8], an increasing number of studies focused on the spatiotemporal characteristics of droughts [5,6,7,9,10]. Xu et al. [5] analyzed the meteorological drought events of monsoon China over the past 50 years and found that severe droughts are densely centered from the Northern China Plain to the downstream of the Yangtze River, with a significant drying trend occurring in the southwestern part of the monsoon region. Liu et al. [6] identified soil droughts in China and the northern Indochina Peninsula during the past four decades, finding a significant wetting trend in the wet season and a significant drying trend in the dry season. The soil drought centers have shown significant seasonal patterns, which were probably controlled by the monsoon systems. Compared to the meteorological droughts identified by Xu et al. [5], the soil droughts in the same area showed different frequencies and different centers, which is partly due to the drought propagation from meteorological droughts to soil droughts, which we herein refer to as ‘drought propagation’.
Various studies have been carried out on drought propagation at the basin scale, and its characteristics can be determined by considering both watershed properties and regional climate [11]. The controlling watershed properties of drought propagation vary in different regions and can be constant properties such as elevation [12], geological properties [13], and variable properties such as land use [14]. The controlling climate factors can be aridity and seasonality [15]. The relevant studies all consider certain fixed basins; that is, the extent of the drought area is regarded as constant. Such analyses at the basin scale connect meteorological droughts to related soil moisture droughts or hydrological droughts [15,16]. However, at a regional scale, drought events still cannot be defined within certain basins. For droughts at a regional scale, the severity-area-duration (SAD) identification method can be applied to capture droughts. Previous studies have successfully described a certain type of drought in a region at one time, while the relations between different types of droughts have not been fully considered. Liu et al. [10] attempted to link meteorological drought events and hydrological events in the Yellow River basin using the SAD identification method and successfully quantified the change in drought parameters (duration, area, severity) during drought propagation from meteorological droughts to hydrological droughts. However, in tropical monsoon regions where droughts and floods are equally frequent, the drought propagation process is still poorly understood.
Previous studies on drought characteristics have mostly treated them as stationary [9,15,16]. However, in recent decades, the changes in climate conditions and anthropogenic activities have called for hydrological analyses under non-stationary conditions [17,18]. Some studies have attempted to capture the response of drought characteristics to climate change. Apurv and Cai [19] estimated the stationarity of historical droughts in the United States since 1901 and found increasing meteorological drought risks since 1901 in the southeastern US and California. Apurv and Cai [20] supposed an unchanged trend in the near future and estimated the corresponding trends of soil droughts, streamflow droughts, and water supply droughts, suggesting that the southwestern US will suffer severe water deficits in all of the drought types. However, the drought propagation is herein supposed to be unchanged. However, as mentioned above, drought propagation can be affected by both the climate conditions and the underlying surface conditions. Since both climate and some watershed properties, such as land use, can change, drought propagation can also change. The change in drought propagation under climate change has also not yet been fully studied.
Thailand has the largest economy of the Indochina Peninsula and has long been one of the world’s leading exporters of rice, with half of its labor force employed in agriculture [21]. Thailand is prone to hydrological extremes, within which droughts are equally susceptible to droughts as to floods [22]. Zhang et al. [23] declared a significant increasing soil drought risk and a significant meteorological increasing drought risk since the 1950s, with one of the increasing centers located in Thailand. Although studies have shown the spatiotemporal distribution of historical droughts in nearby southwestern China [6], studies on the spatiotemporal distribution of historical droughts and drought propagation in Thailand are scant. To the author’s knowledge, the historical drought characteristics in Thailand are also not sufficient, let alone the change in drought propagation characteristics. To this end, Thailand is chosen as the study area.
The major objectives of the study are to determine the drought propagation characteristics and historical spatiotemporal changes in drought events in the monsoon regions of Thailand. The work is therefore organized as follows: the first part describes the background and the objectives of the research; the second part introduces the study region and the data used in the research; the third part describes the methods used in the research; the fourth part describes the spatiotemporal distribution and the propagation characteristics of the droughts and shows the changes in the droughts and their propagation; the fifth part discusses the changes and drivers of drought parameter distributions and drought propagation and their implications and the uncertainties; the sixth part draws the final conclusions.

2. Data and Study Area
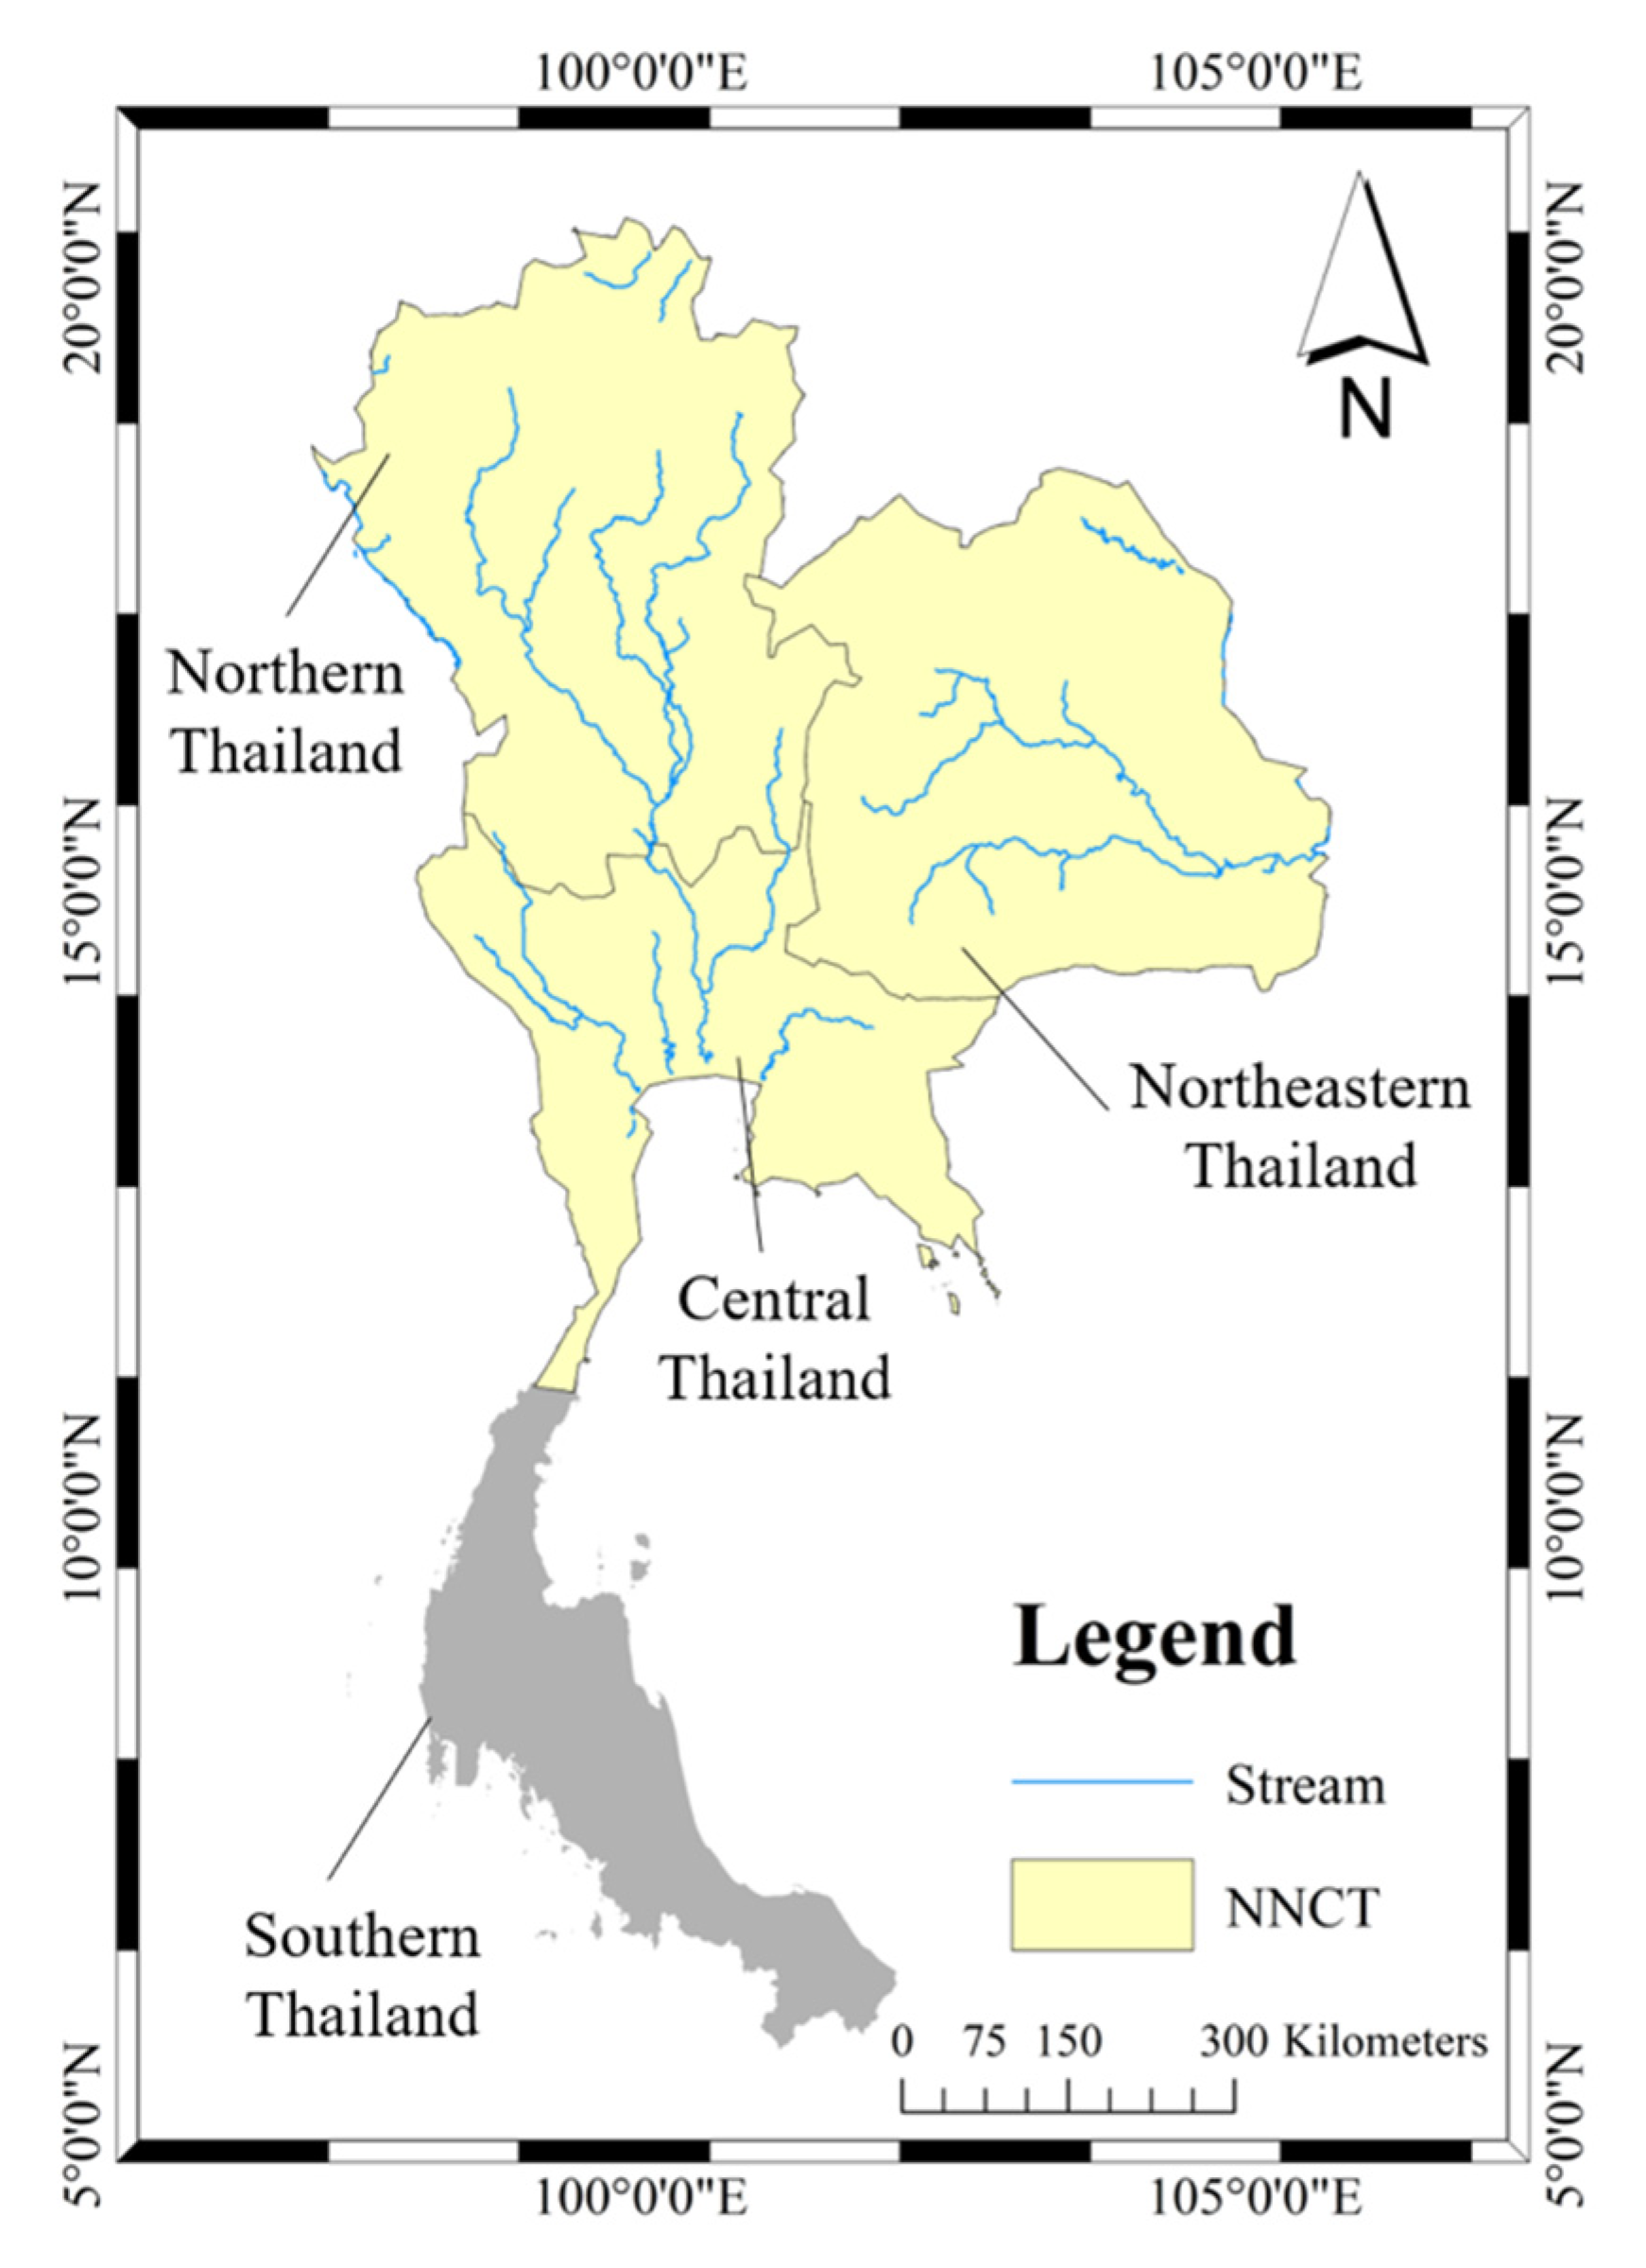
2.1. Study Area

The study region (Figure 1) is located north of the Gulf of Thailand and contains northern Thailand, northeastern Thailand, and central Thailand based on the four-region system. The region covers most of the agricultural districts of Thailand, with an area of approximately 440,000 km2. Here, the study region is referred to as the NNCT (northern, northeastern, and central Thailand). Northern Thailand and central Thailand mainly correspond to the Chao Phraya River, and northeastern Thailand mainly corresponds to the Mekong River. The study region has a tropical monsoon climate and receives annual precipitation from approximately 1100 mm to 1800 mm, with more precipitation in the south. The annual potential evaporation rate ranges from approximately 1600 mm to 2400 mm. The region is located in a typical tropical monsoon zone. Ninety percent of the annual precipitation falls during the wet season from May to October. Two peaks in precipitation occur, in May and September, and are dominated by the Indian summer monsoon and tropical cyclones, respectively [24]. The annual mean temperature is approximately 27 °C. The temperature is highest from April to May and is the lowest from December to the following January.

2.2. Data Used in the Study

The extent of NNCT is derived from the administrative divisions provided by the Royal Irrigation Department of Thailand. The potential evaporation and soil moisture data are from the GLDAS Noah 2.0 reanalysis dataset (available via the flowing link: https://disc.gsfc.nasa.gov/datasets?keywords=GLDAS&page=1 (accessed on 1 January 2022), and later referred to as GLDAS), and the precipitation data are from the Global Precipitation Climatology Center (available via the link: http://opendata.dwd.de/climate_environment/GPCC/html/download_gate.html, and later referred to as GPCC (accessed on 1 January 2022)). The soil moisture in the 0–10 cm layer in GLDAS serves as the soil moisture conditions when soil moisture drought is estimated. The two products have been used for drought description and have been proven to be capable of describing drought both regionally [25] and globally [26]. GLDAS is capable of capturing droughts in densely vegetated regions as a reanalysis product [25,26]. Both datasets can provide the monthly hydrological variables of a 0.25° resolution from 1948 to 2014, and the hydrological variables in the study region are then extracted for the calculation of drought indices.

3. Methodology

3.1. Drought Indices Used in the Study

The drought index for meteorological drought used in the study is the standard precipitation evapotranspiration index (SPEI) [27]. The difference in annual precipitation and annual potential evaporation is used to capture the water surpluses or deficits, and they are aggregated to obtain an aggregated surplus or deficit based on the time scale. A three-parameter log-logistic distribution is then employed to fit the time series of each month. A detailed introduction of the algorithm can be found in Xu et al. [5].
The drought index for soil moisture drought is the standard soil moisture index (SSI) [28]. The SSI is calculated using the surface soil moisture of the GLDAS products. Similar to the SPEI, the monthly precipitation series are accumulated first and are then fitted by the gamma distribution of each month.

3.2. Three-Dimensional Identification of Drought

Three-dimensional drought identification was first proposed by Andreadis [8] and has been improved in subsequent studies [5,7]. The three-dimensional drought identification method measures drought events from three perspectives, time, space, and severity, corresponding to drought duration, drought area, and drought severity, respectively. The drought events are extracted using a space-time continuum identification method based on the drought indices, and the algorithm can be divided into two components, including spatial identification and temporal connection, as follows: (1) For each monthly step, the drought indices (DIs) in this month are treated as individual cross-sectional data. Grids with drought indices lower than −1 are treated as ‘under drought’. Then, the spatial connection of the grids under drought is checked, and several drought patches are identified in each cross section. (2) The link between drought patches in two adjacent months is determined. Any pair of drought patches between two months belong to the same drought event if they have an overlap area larger than a predetermined threshold (defined as the threshold area). A detailed introduction of the algorithm can be found in Xu et al. [5]. In the present study, SPEI3 and SSI3 (with 3 months as the time scale) are selected to capture seasonal droughts, and a threshold value of −1 is selected to identify drought conditions [5]. Wang et al. [29] suggested that the threshold area should be set to 1.5% of the study region. Therefore, the threshold area is set to 22 grids (approximately 16,000 km2).

3.3. Probability Distributions of Drought and Return Period

Three parameters are calculated to characterize the identified drought events. They are defined below [5]. Drought duration (D) is the persistence time of a drought event and represents the time length of the drought event. Drought severity (S) is a cumulative value and represents the water shortage. It denotes the moisture deficit accumulated over the whole drought duration and areal extent. Drought area (A) reflects the affected area during the entire period of drought. Theoretically, drought duration should be a continuous variable, while the drought duration estimated here is discrete. Moreover, the drought area has its minimum value and maximum value and is not convenient for frequency analysis. Therefore, transformations used by Xu et al. [9] are applied here:
d = D + U
a = log ( A m A A m A t )
where U is a random variable uniformly distributed between −0.5 and 0.5, d is the continuous estimate of drought duration D, A m is the total area of the study region, A t is the minimum value of the affected area (the threshold area shown in Section 3.2), and a is the corresponding ratio of drought area whose variation is expanded to all positive values. For consistency, drought severity is denoted by s instead of S hereinafter.
The univariate cumulative distributions of the three drought parameters are then fitted using six distribution functions, including an exponential distribution (later referred to as exp), a gamma distribution (later referred to as gam), a generalized extreme value distribution (later referred to as gev), a generalized Pareto distribution (later referred to as gpd), a logistic distribution (later referred to as lgt), and a Pearson-III distribution (later referred to as P3). The goodness of fit is tested by the Kolmogorov–Smirnov (K-S) test [30]. The null hypothesis is that the fitted curve and the observations are from the same distribution, so a lower K-S statistic and a higher p-value indicate a better fit. Therefore, the root mean square error (RMSE), K-S statistic, and p-value of fit are employed to evaluate the goodness of fit.
Multivariate cumulative distributions of the drought parameters are fitted via marginal distributions (the univariate cumulative distributions) and copulas. Copulas are a set of functions mapping from an n-dimensional interval to a 1-dimensional interval as C: [0,1]n→[0,1]. Sklar [31] showed that the CDF H of an n-dimensional random vector (x1, x2,…, xn) (later referred to as x) can be expressed via copulas as C:
H ( x ) = C ( F 1 ( x 1 ) , F 2 ( x 2 ) , , F n ( x n ) ) ,   x = ( x 1 , x 2 , , x n )
The application of copulas requires a strong correlation between the random variables (X1, X2,…, Xn). Therefore, it is vital to check the correlation between the drought parameters before estimating the multivariate joint cumulative distributions.
In the case of bivariate joint distributions, the six joint distributions are fitted separately as duration-area joint distributions, area-severity joint distributions, and severity-duration joint distributions for meteorological droughts and soil droughts. In the case of trivariate joint distributions, the two joint distributions are duration-area-severity joint distributions for meteorological droughts and soil droughts. Six 2D copula functions, the Gaussian copula, t-Student copula, Clayton copula, Gumbel copula, Frank copula, and Joe copula, serve as candidates for the bivariate copula. The copulas are further selected based on RMSE. All of the 2D copula functions have three-dimensional forms, and the six corresponding copulas serve as candidates for the trivariate copula. The copulas with the lowest RMSE are then used to estimate the multivariate cumulative distributions of the drought parameters.
The return period is defined as ‘the average time elapsing between two successive realizations of a prescribed event’ [32] and is under a stationary hypothesis. It is worth noting that the return periods here are estimated based on historical drought events; here, they are based on the climatic conditions during 1948–2014.
The return period is herein calculated in a multivariate framework proposed by Xu et al. [9]. In the univariate setting, the return period is defined as Equation (4) [33]:
T = N y e a r N d r o u g h t 1 1 F X ( x p )
where N y e a r and N d r o u g h t are the number of years and drought events, respectively. F X is the marginal distribution of the drought parameter X, and x p is the corresponding value of parameter X at probability p.
Multivariate return period estimation is based on the ‘and’ return period [32]. In the bivariate case, the return period is defined as Equation (5) [34]:
T = N y e a r N d r o u g h t 1 1 F 1 ( x 1 ) F 2 ( x 2 ) + C 12 ( F 1 ( x 1 ) , F 2 ( x 2 ) )
where C 12 denotes the bivariate copula function of drought parameter X 1 and X 2 , F 1 , F 2 are the marginal distribution functions, and x 1 , x 2 are the values of the drought parameters X 1 and X 2 at the corresponding probability.
In the trivariate case, the return period is defined as [32]:
T = N y e a r N d r o u g h t × 1 1 F 1 ( x 1 ) F 2 ( x 2 ) F 3 ( x 3 ) + C 12 ( F 1 ( x 1 ) , F 2 ( x 2 ) ) + C 23 ( F 3 ( x 3 ) , F 2 ( x 2 ) ) + C 31 ( F 1 ( x 1 ) , F 3 ( x 3 ) ) C 123 ( F 1 ( x 1 ) , F 2 ( x 2 ) , F 3 ( x 3 ) )
where C 23 , C 31 denote the bivariate copula functions, and C 123 denotes the trivariate copula function. F 3 is the marginal distribution function of X 3 , and x 3 is the value of the drought parameter X 3 at the corresponding probability.

3.4. Drought Propagation

Previous studies have attempted to capture the change in drought parameters during the drought propagation process by comparing the cumulative distribution functions of different types of droughts [15,16,19,20]. Apurv et al. [15] suggested that the drought propagation process can be quantified by a ratio such as the drought propagation ratio, as shown in Equations (7) and (8):
R S M , M D = ( j = 0.1 1.0 q S M , j D q M , j D ) 1 / 10
R S M , M S = ( j = 0.1 1.0 q S M , j S q M , j S ) 1 / 10
where q S M , j D and q S M , j S are the j-quantile values in the cumulative density curve of soil moisture drought duration and severity, respectively. q M , j D and q M , j S are the j-quantile values in the cumulative density curve of meteorological drought duration and severity, respectively. Previous studies considered drought propagation at the basin scale, and the drought area was considered constant. Herein, a variable drought area requires the introduction of the drought propagation ratio of the area as Equation (9):
R S M , M A = ( j = 0.1 1.0 q S M , j A q M , j A ) 1 / 10
where q S M , j A and q M , j A are the j-quantile values in the cumulative density curve of soil moisture drought duration and meteorological drought duration, respectively.
However, the drought propagation ratios above can only capture the difference in the distribution of drought parameters, while the difference in the frequency of drought events is not considered. To take the frequency of drought events into account, we suggest that drought parameters with the same return period be compared instead of drought parameters with the same quantile at the distribution curve. The calculation of drought propagation ratios is revised using the following equations:
R S M , M D = ( j = 1 10 q S M , p s , j D q M , p m , j D ) 1 / 10
R S M , M A = ( j = 1 10 q S M , p s , j A q M , p m , j A ) 1 / 10
R S M , M S = ( j = 1 10 q S M , p s , j S q M , p m , j S ) 1 / 10
where p s , j   and   p m , j are the revised probabilities of soil moisture droughts and meteorological droughts, respectively. The two parameters are calculated as follows:
1 1 p s , j t n s = T j = 1 1 p 0 , j
1 1 p m , j t n m = T j = 1 1 p 0 , j
where p 0 , j is 0.1 × j and the original probability in the previous studies. T j is the corresponding return period, t is the total time length of the study period (67 years), n s and n m are the numbers of soil moisture droughts and meteorological droughts, respectively.
Drought propagation ratios are regarded as constant features of basins in previous studies and are determined by climate features and underlying properties [20]. Since the regional climate and underlying surface might change during the study period, the propagation ratios are also calculated by a moving-window method (see Section 3.5 for details). Herein, the drought propagation ratios mentioned above capture the drought propagation process of the whole study period (1948–2014) and are later referred to as the ‘mean drought propagation ratio’ to distinguish them from the drought propagation ratios calculated from moving windows.

3.5. Temporal Analysis of Historical Droughts

Climate change and anthropogenic activities have been proven to affect the probability distributions of hydrological variables such as rainfall [35] and streamflow [18], and they can also affect drought propagation (as discussed in Section 1). Therefore, the changes in drought characteristics are described by the change in drought probability distributions and drought propagation.
Apurv and Cai [20] applied a set of 30-year moving windows to capture the potential drought risks in the United States, with the precipitation in each moving window generated from the rainfall series in the moving window. Here, we also use 30-year moving windows to represent the change in drought characteristics. The probability distribution of drought parameters in each window is represented by the coefficients of drought parameters in the window (mean value, Cv, and Cs). The drought propagation ratios are also calculated individually from each moving window and are later referred to as the ‘moving drought propagation ratio’. The changes in the coefficients of drought parameter distributions and drought propagation can reflect the change in drought characteristics.
The study period is from 1948 to 2014. Therefore, 38 30-year moving windows are used to capture droughts under changing conditions. The Mann-Kendall test [36,37] was employed to identify the change in drought characteristics in the study period, and the significance level was set to 0.05.

4. Result

4.1. A Description of Historical Soil and Meteorological Droughts

4.1.1. Drought Events and the Return Period from 1948 to 2014

Based on the SPEI3 and SSI3 series, historical droughts with durations no less than the time scale of drought indices (3 months, see Section 3.1 and Section 3.2 for details) are identified. From 1948 to 2014, 70 meteorological drought events and 44 soil drought events were identified. Kendall’s rank correlation coefficients between D-A, D-S, and A-S are 0.61, 0.74, and 0.90, respectively, and are all significant at the 0.01 level. Therefore, it is appropriate to use copulas to estimate the return periods of drought events.
The drought parameters of the drought events in the whole study period are then fitted by the seven considered distributions. The best fit is shown to be a generalized Pareto distribution for all of the parameters of both soil drought and meteorological droughts (see Figure 2 and Table 1 for the goodness of fit results). The goodness of fit results with the copulas are shown in Figure 3 and Table 2. For the bivariate cases, the best copulas of the soil droughts are all Joe copulas, and the best copulas of the meteorological droughts are Frank copulas and Gumbel copulas. For the trivariate cases, the best copula of the soil droughts is the Student’s t-copula, and the best copula of the meteorological droughts is the Gumbel copula. Therefore, the univariate return periods, bivariate return periods, and trivariate return periods of the drought events can be estimated with copulas.
The meteorological drought event with the longest trivariate return period (the 31st meteorological drought, later referred to as MNo. 31 in Table 3) started in June 1979 and ended in March 1980, lasted for 10 months, and covered 99.8% of the study area. For soil droughts, the soil drought event with the longest trivariate return period (the 18th soil drought, later referred to as SNo. 18 in Table 4) occurred from November 1979 to June 1980, lasted for 8 months, and affected 98.3% of the study area.
The 10 strongest soil droughts and meteorological droughts are shown in Table 3 and Table 4. Clearly, the trivariate return periods are longer than the bivariate return periods, and the bivariate return periods are longer than the corresponding univariate return periods. The reason is that the ‘and’ return period requires that all of the variables in the exceeding probability region of a set of observations be larger than the corresponding values of observations. Therefore, the exceeding probability region of a trivariate copula should be smaller than the corresponding bivariate copulas, leading to a longer trivariate return period compared to the corresponding bivariate return periods. A similar relationship also exists between bivariate return periods and the corresponding univariate return periods.
The trivariate return periods of the 2 meteorological drought events exceeded 100 years, which were 157 years (MNo. 31) and 112 years (MNo. 2). Three other meteorological drought events had trivariate return periods exceeding 50 years: 75 years (MNo. 3), 67 years (MNo. 48), and 66 years (MNo. 55). The trivariate return periods of the 2 soil drought events exceeded 100 years, which were 179 years (SNo. 18) and 144 years (SNo. 38). The trivariate return period of one other soil drought event (MNo. 37) reached 50 years.

4.1.2. Spatiotemporal Patterns of Historical Droughts

The spatiotemporal distribution of historical droughts is shown in Figure 4. The green base map shows the distribution of irrigated fields [38], and the stream network is generated from the Shuttle Elevation Derivatives at Multiple Scales (HydroSHEDS) database [39] from the United States Geological Survey (USGS). The circles show the centers of historical droughts, with different colors referring to the different time periods of historical droughts and the radius of the circles referring to the corresponding trivariate return periods.
Historical meteorological droughts were mostly centered in the Chao Phraya River basin and the Mun River basin, while historical soil droughts in the two basins were mostly centered along the irrigated regions. The temporal distributions of historical droughts are shown in Figure 5. Both meteorological droughts and soil droughts are more widespread, more long-lasting, and more severe near 1950, 1980, and 2010. The meteorological droughts near 1950 did not lead to such strong soil droughts having a similar magnitude in drought parameters or trivariate return period as the meteorological droughts, while the meteorological droughts near 1980 and 2010 did lead to strong soil droughts having a similar magnitude in drought parameters and trivariate return period.

4.1.3. Drought Propagation

Mean drought propagation ratios are employed to compare the historical meteorological droughts and the historical soil moisture droughts of NNCT. The mean drought propagation ratios of the drought parameters are all below 1, indicating that the drought parameters are all attenuated after the drought propagation process. Among the three drought parameters, the attenuation of drought duration is the mildest, as the mean drought propagation ratio of the area is 0.94 during the study period. The attenuation effects of duration and severity are relatively strong, as the mean drought propagation ratios of area and severity have lower values of 0.83 and 0.82, respectively. The attenuation effects show the function of the underlying surface as a buffer to alleviate the moisture deficit.
The original drought propagation ratios proposed by Apurv et al. [15] compare the drought parameters corresponding to the same probability in distribution and are appropriate in cases when the numbers of soil moisture droughts and meteorological droughts are close. Liu et al. [10] suggested that meteorological droughts and hydrological droughts can have more complex relationships than single pair mapping relationships. Therefore, the number of meteorological droughts is not exactly equal to that of the soil droughts. We herein identified 70 meteorological droughts and 44 soil droughts in the past 67 years. If the original evaluation methods of the mean drought propagation ratio are used, the soil moisture droughts with longer return periods are compared with the meteorological droughts with shorter return periods, leading to the overestimation of mean drought propagation ratios. If calculated by the original method, the mean drought propagation ratios are all very close to 1, with those of area and severity both slightly larger than 1 in the whole study period (see Table S1 in the Supplementary Material for the difference), indicating that drought area and severity are amplified after drought propagation, which is a different result.

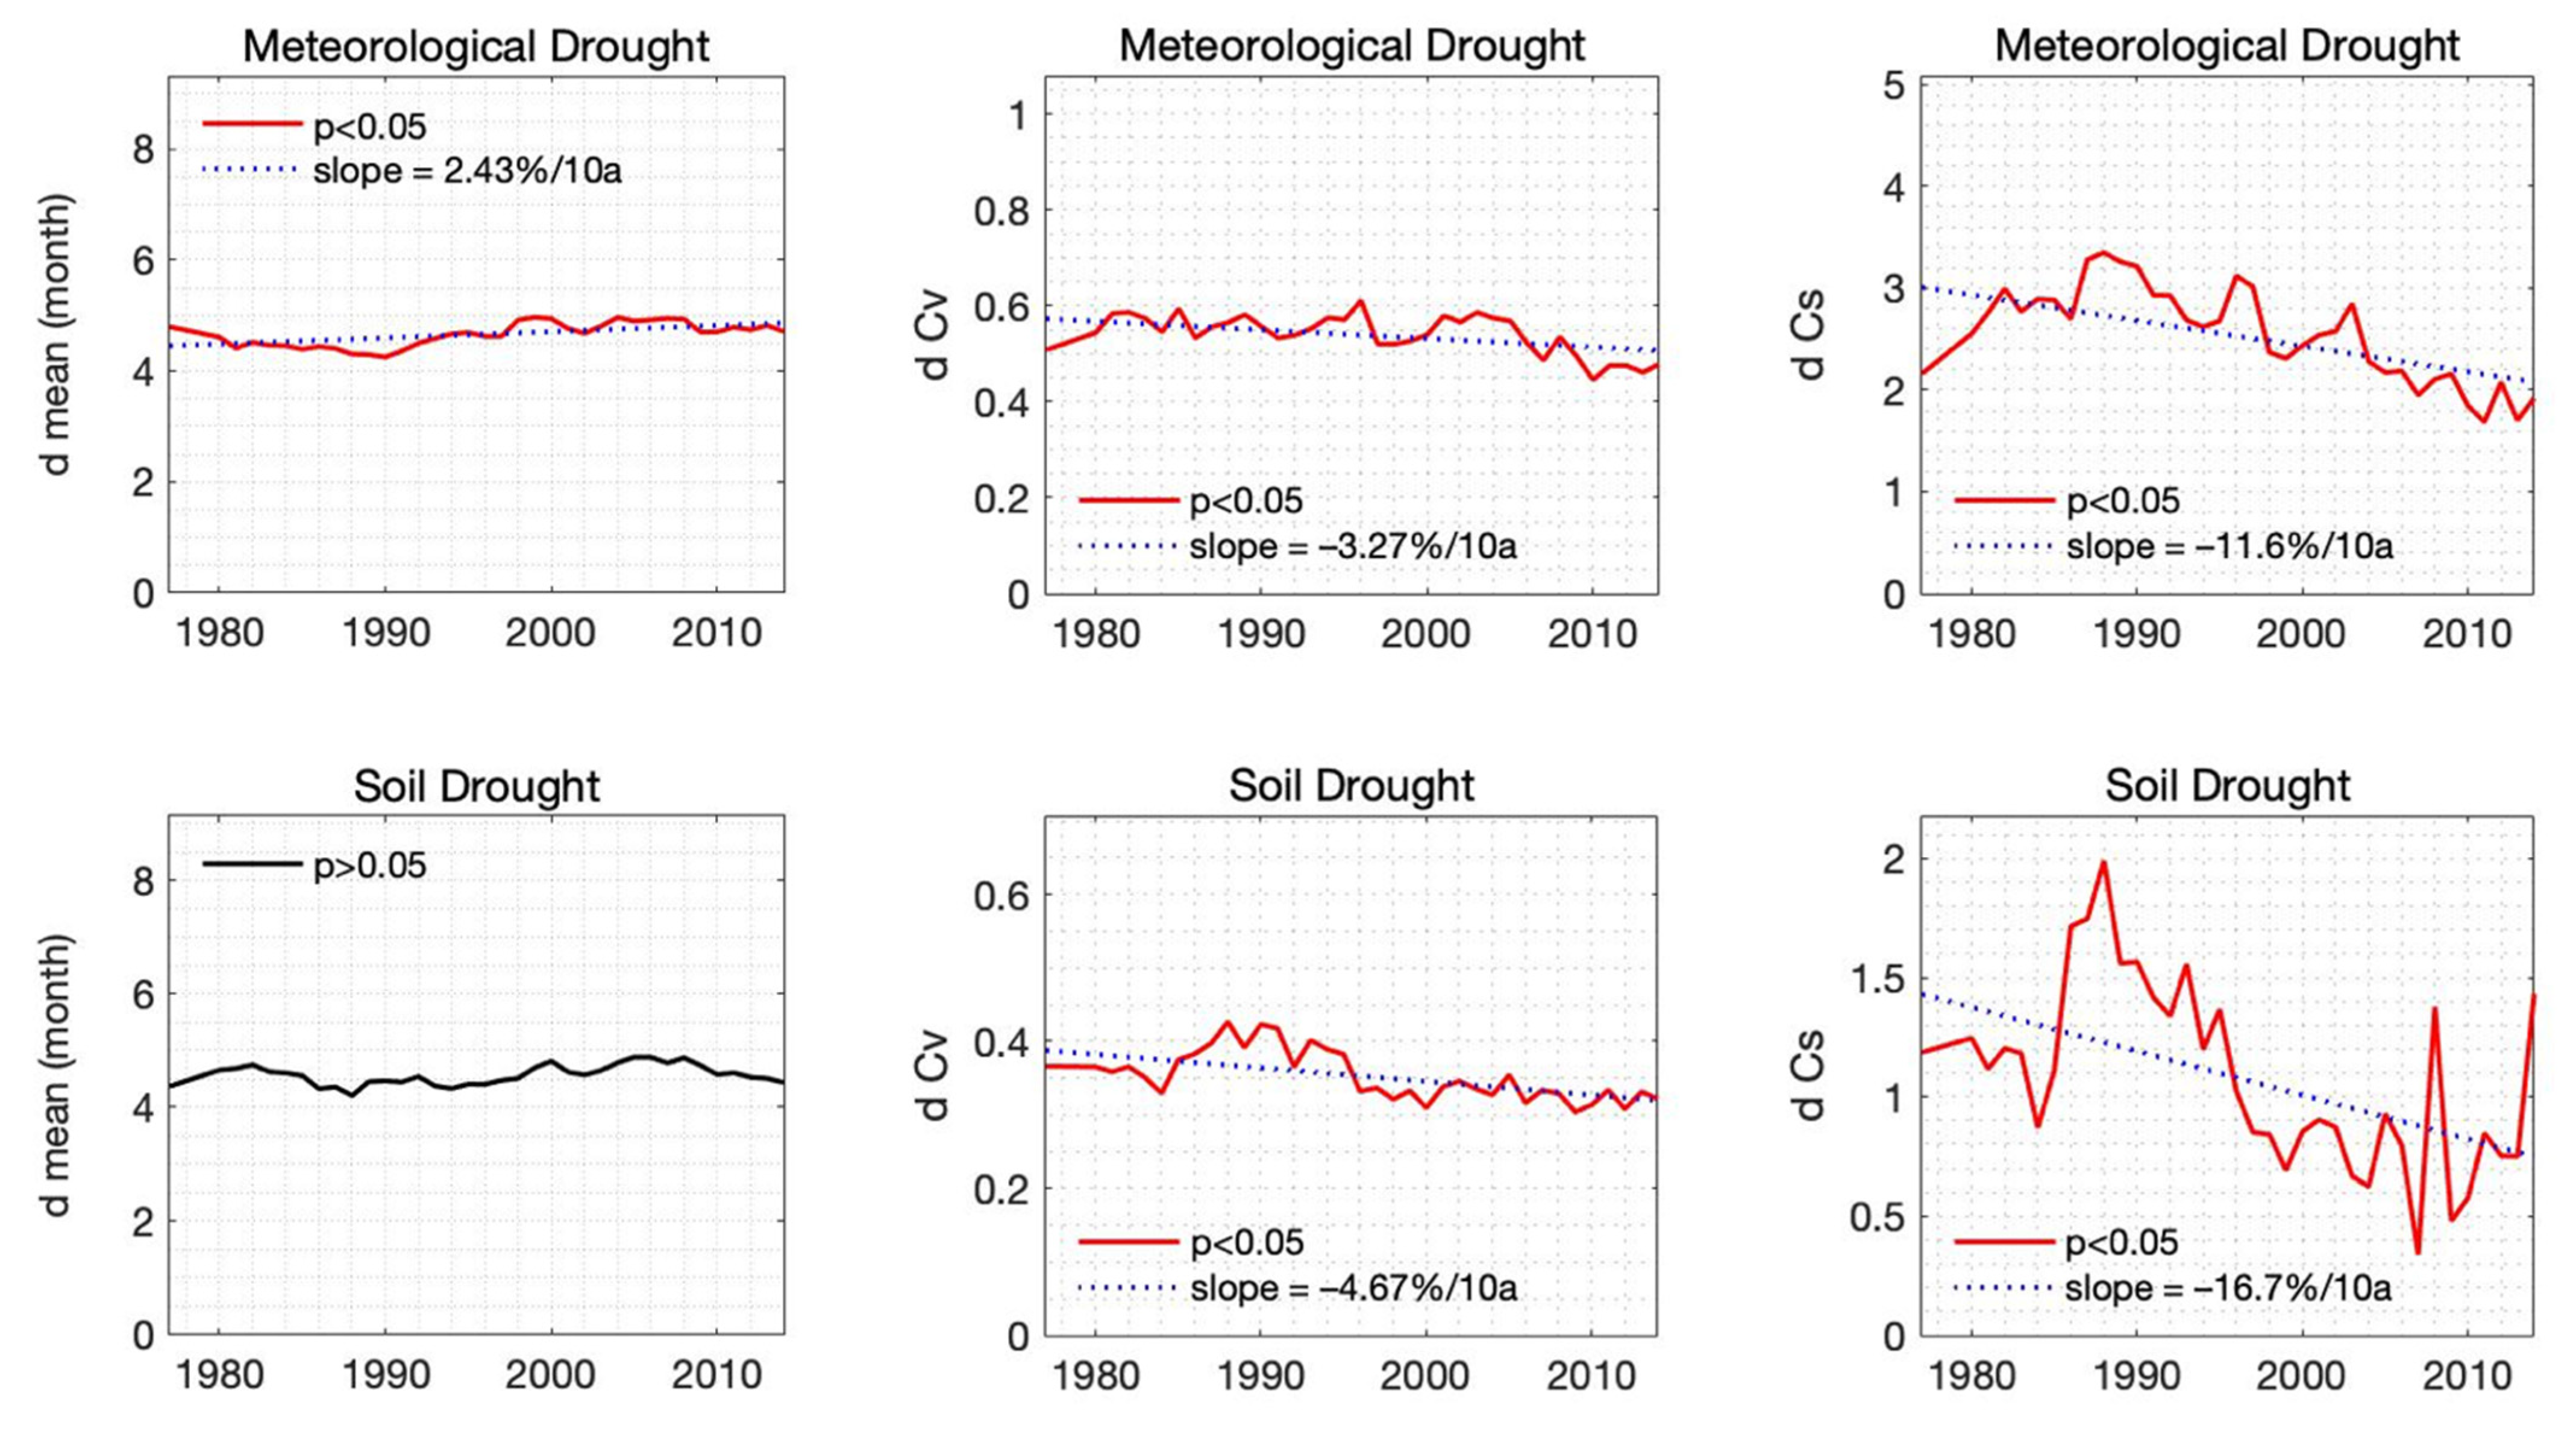
4.2. The Change in Drought Characteristics during 1948–2014

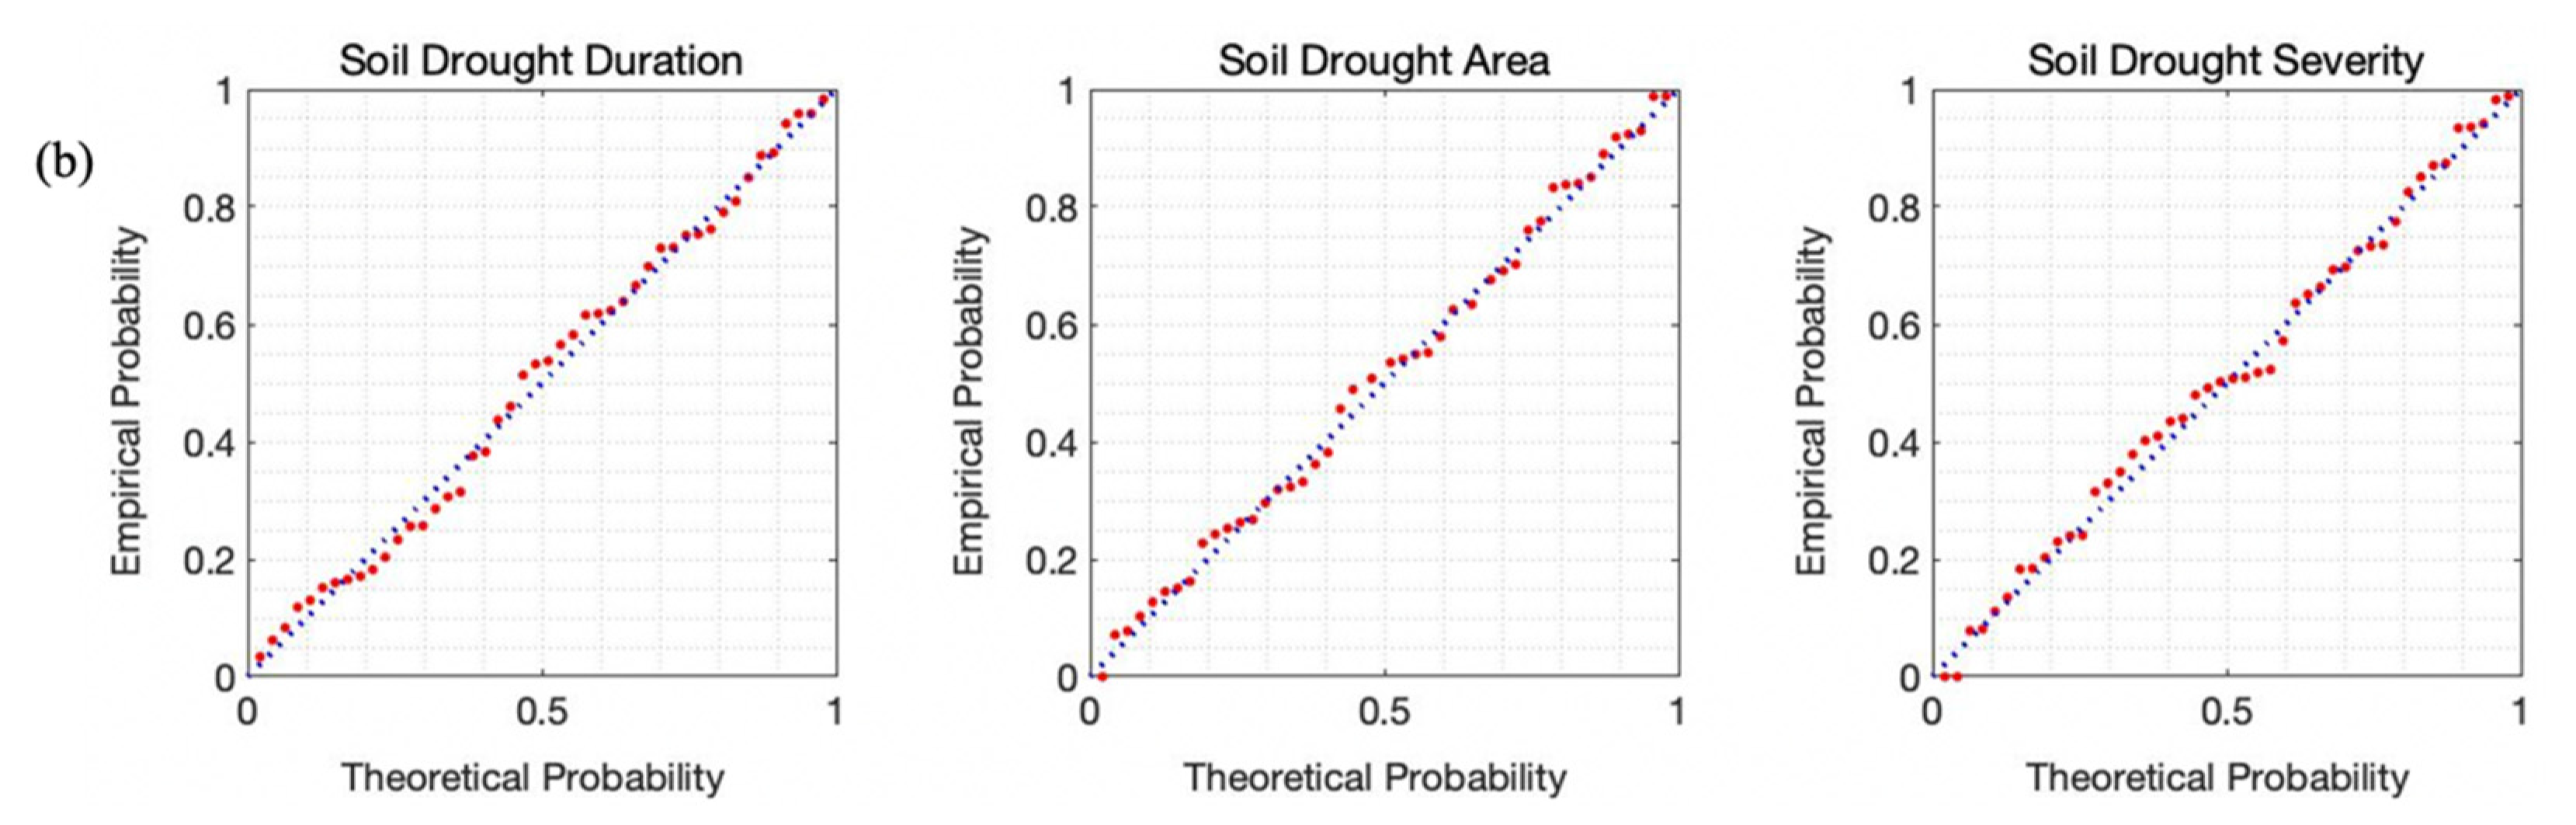
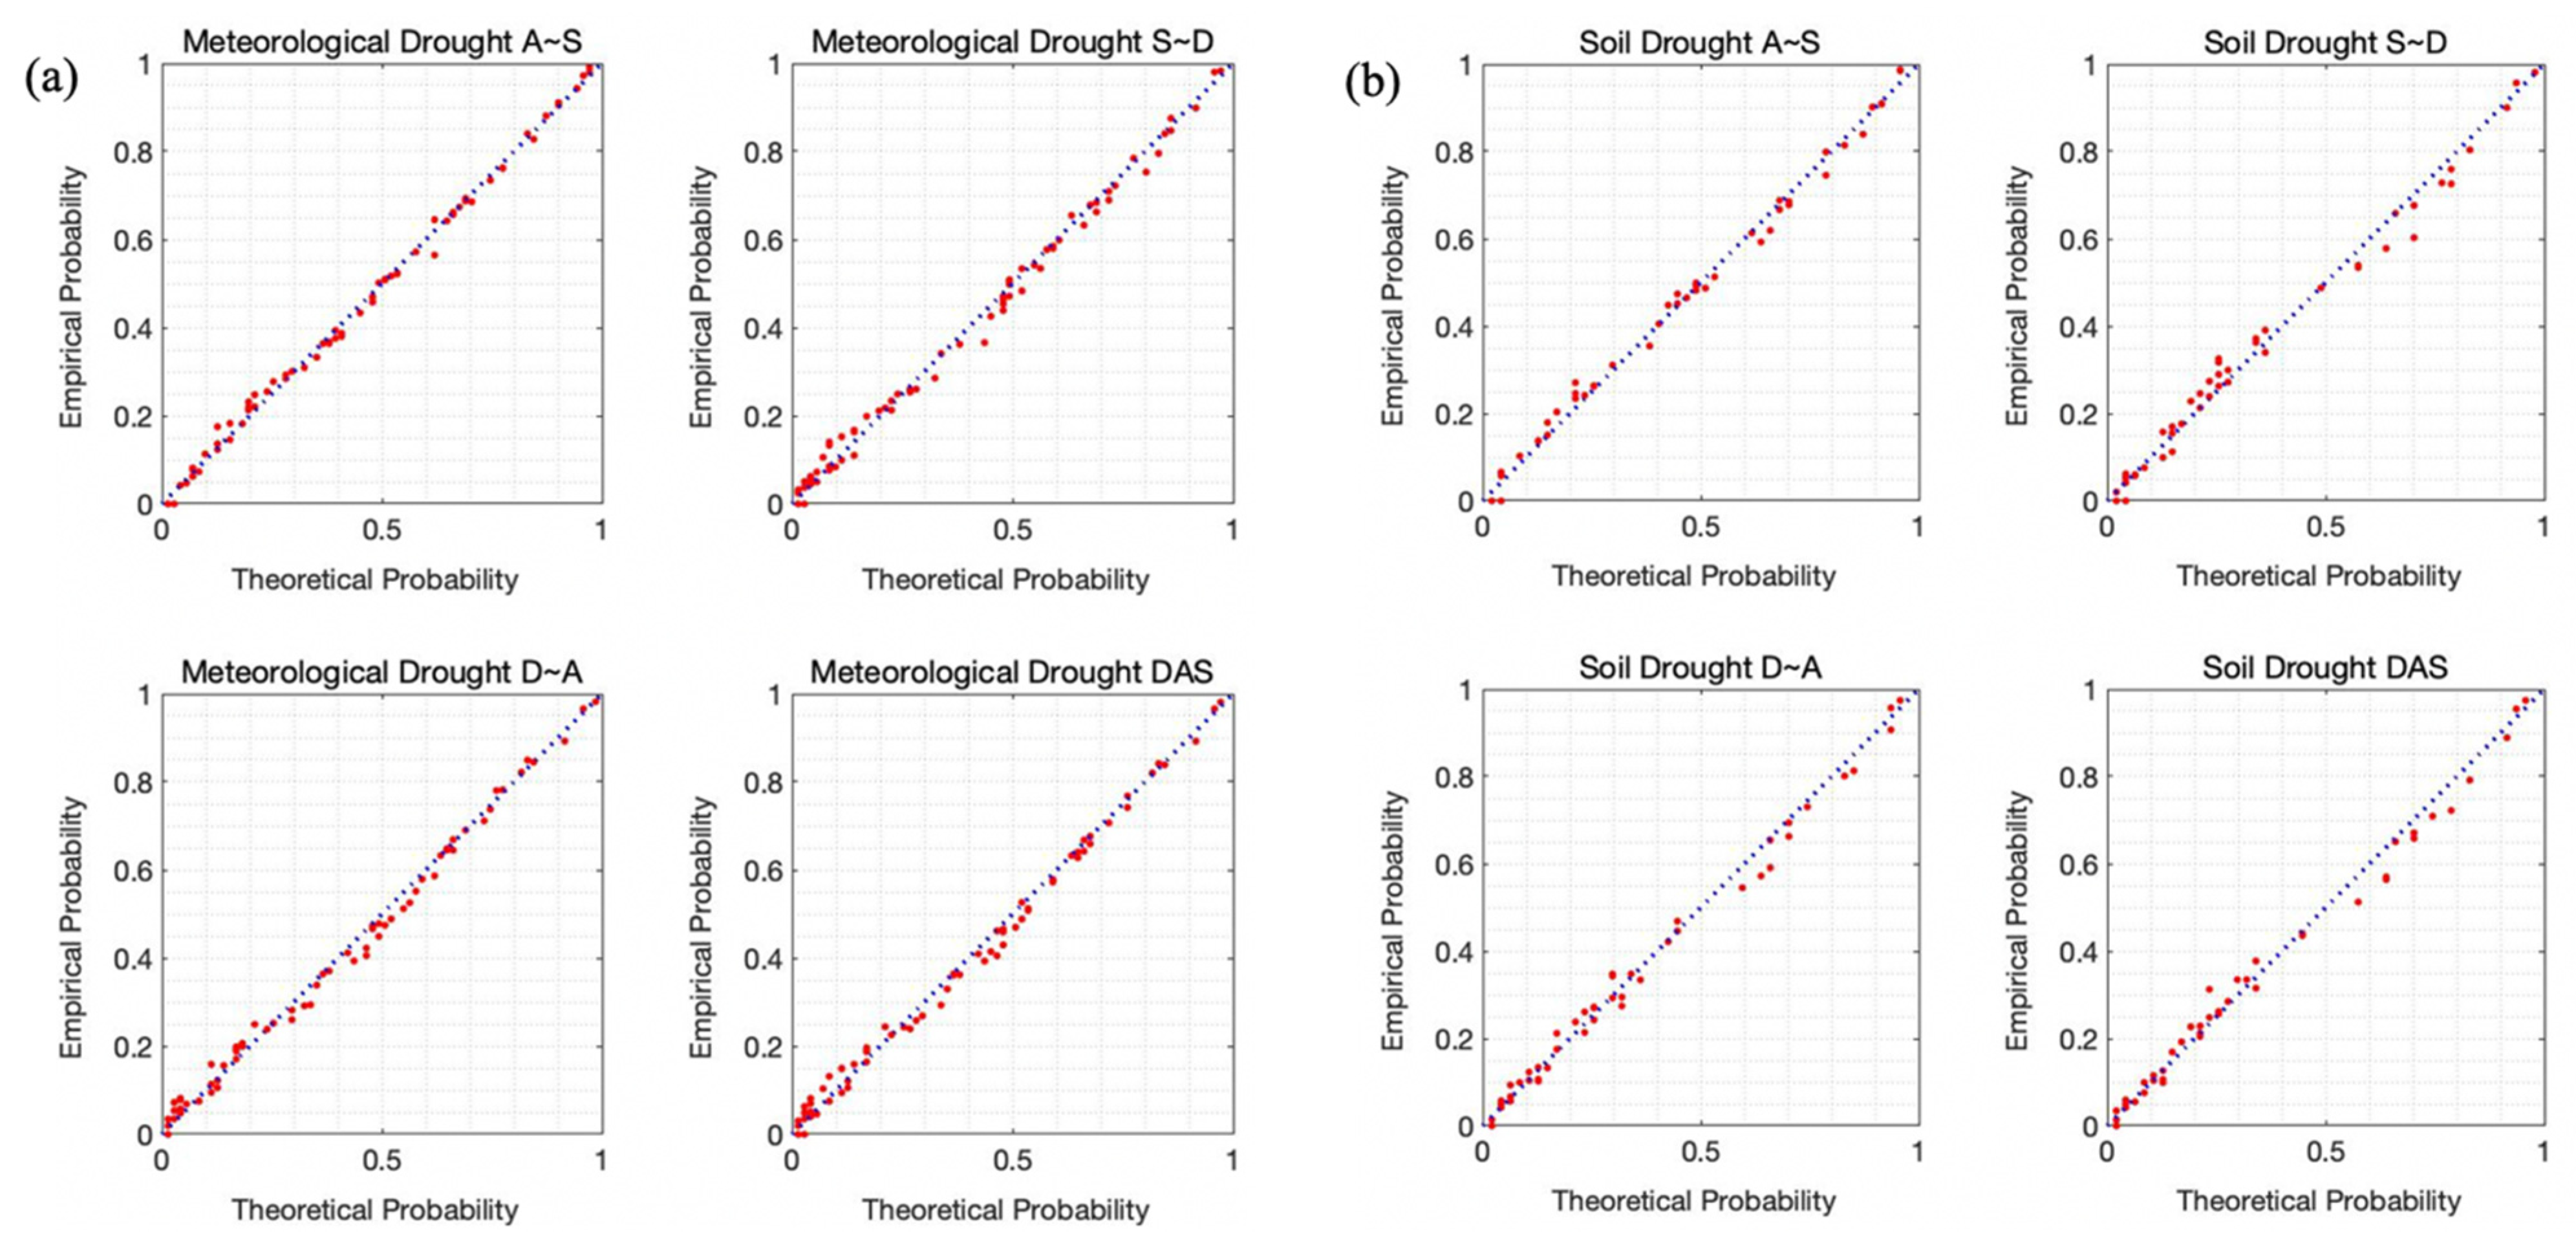
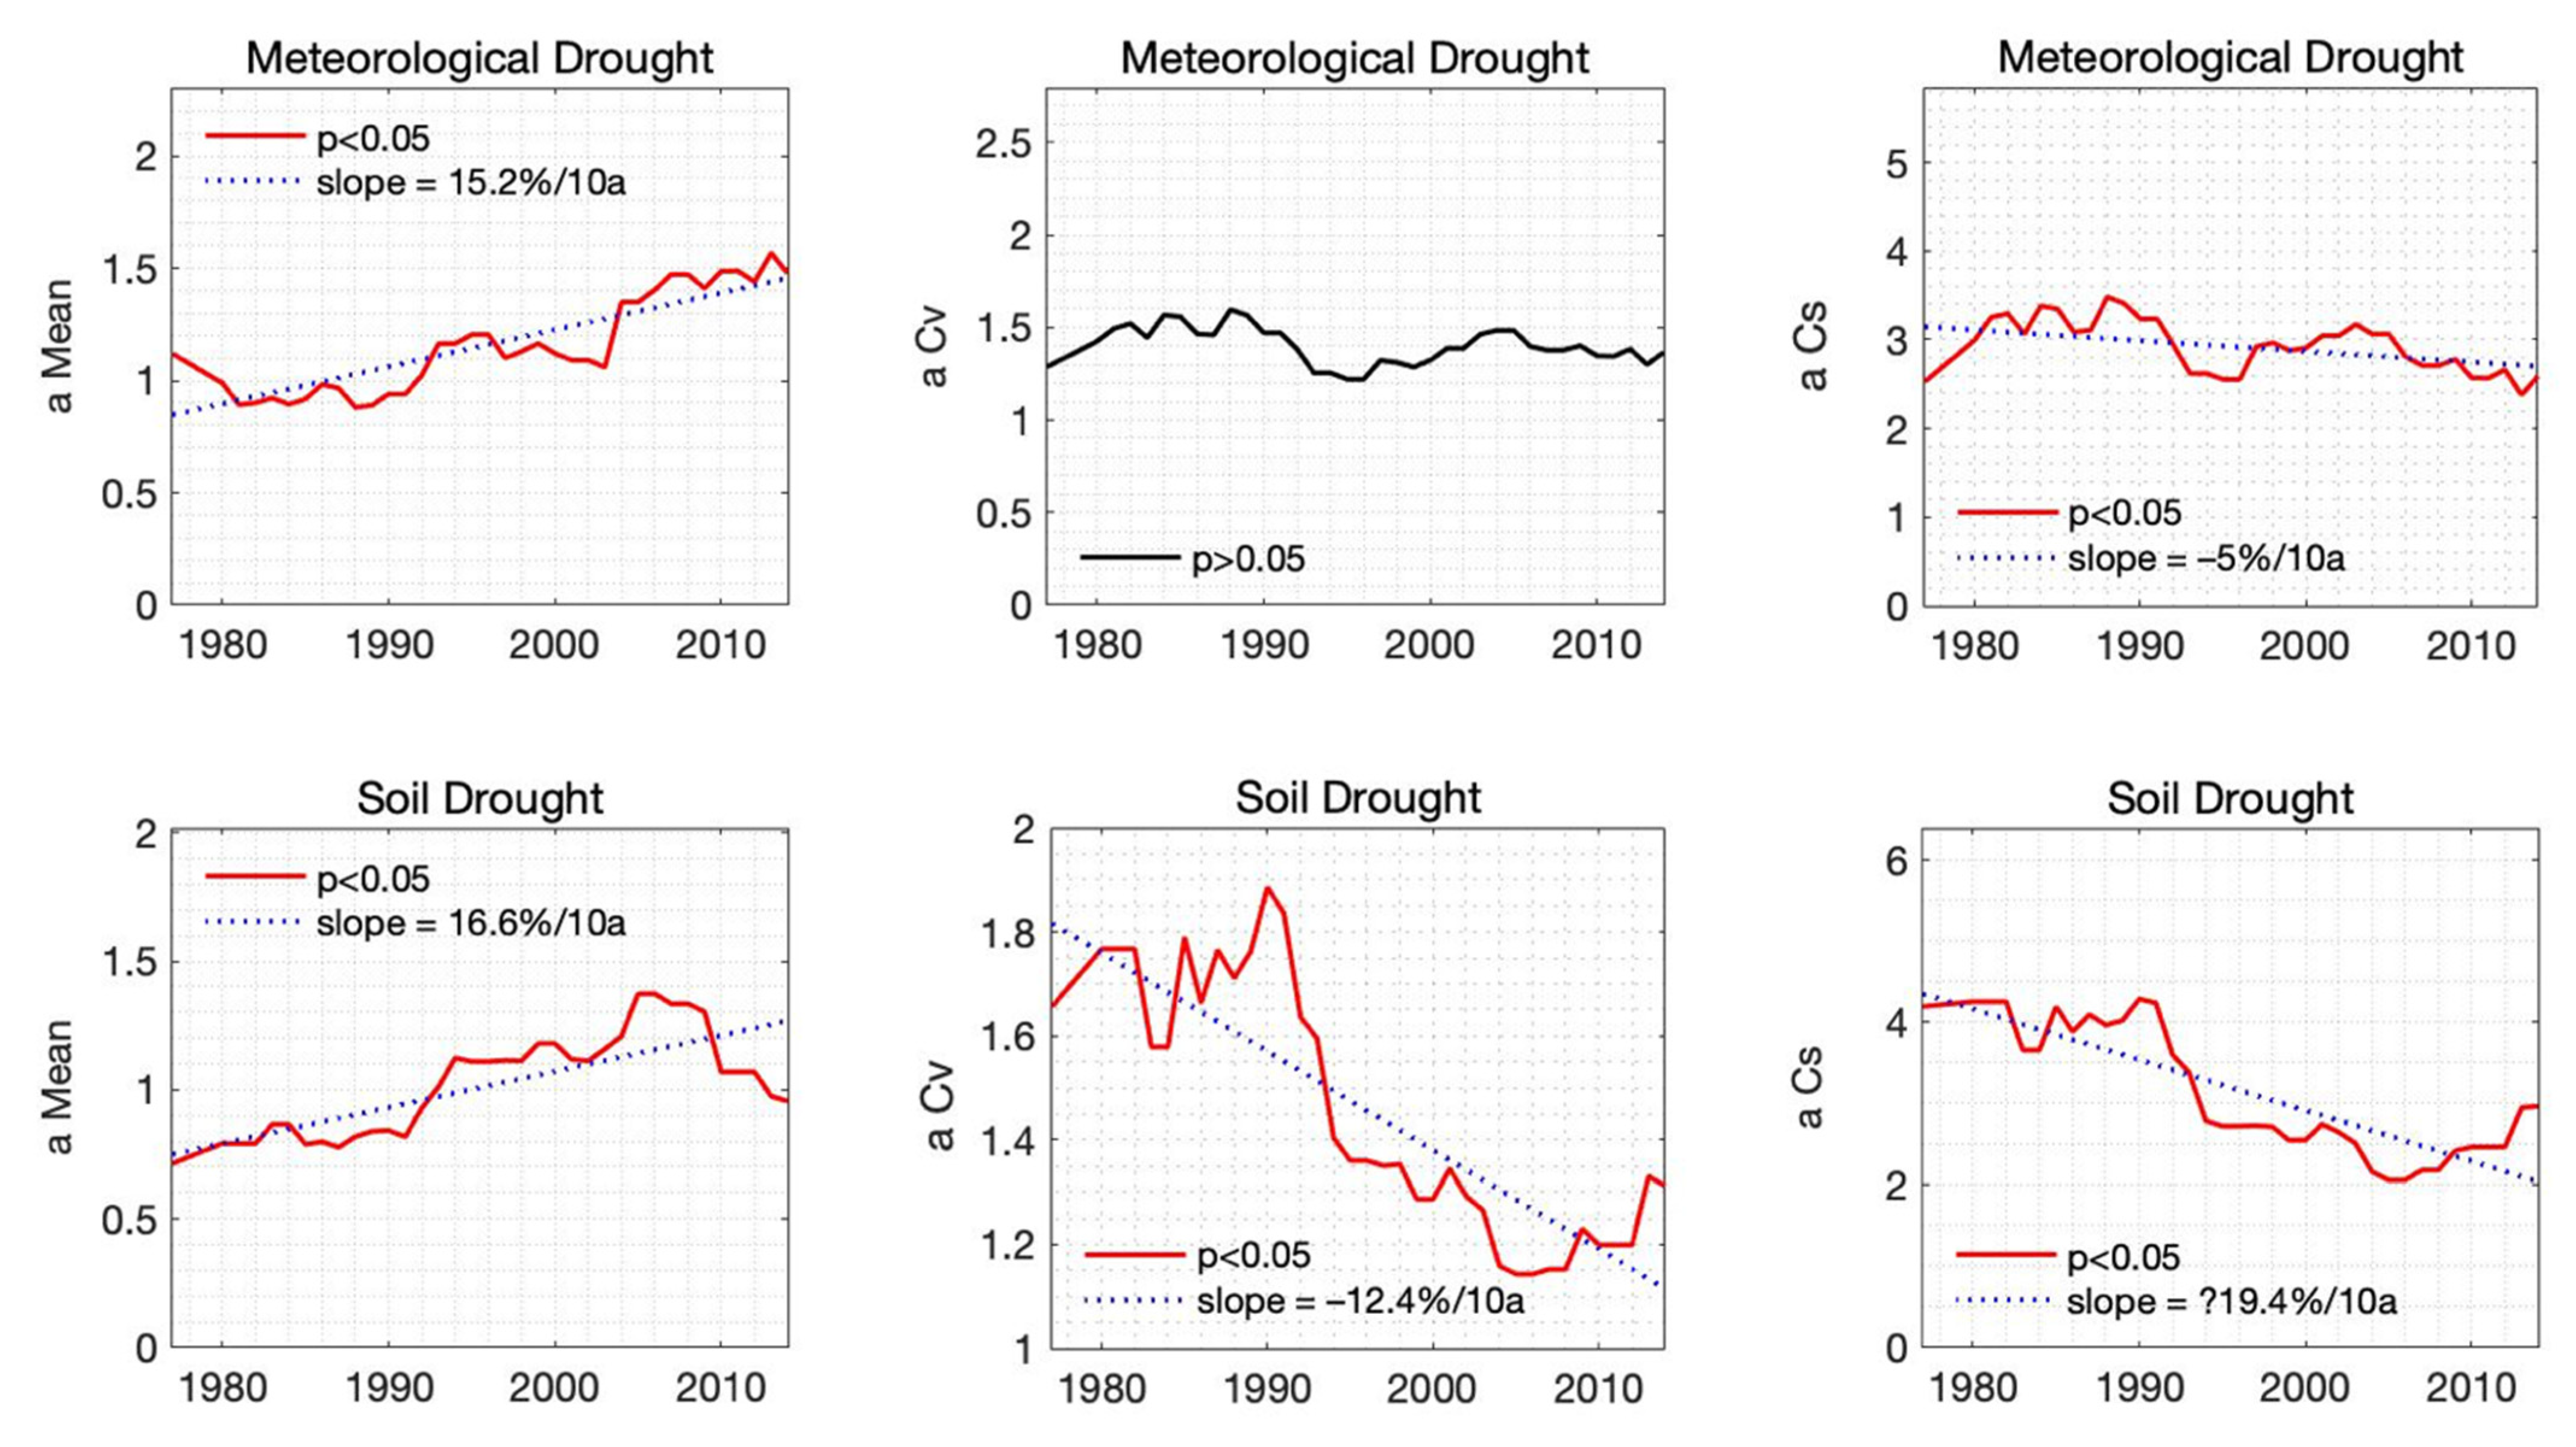
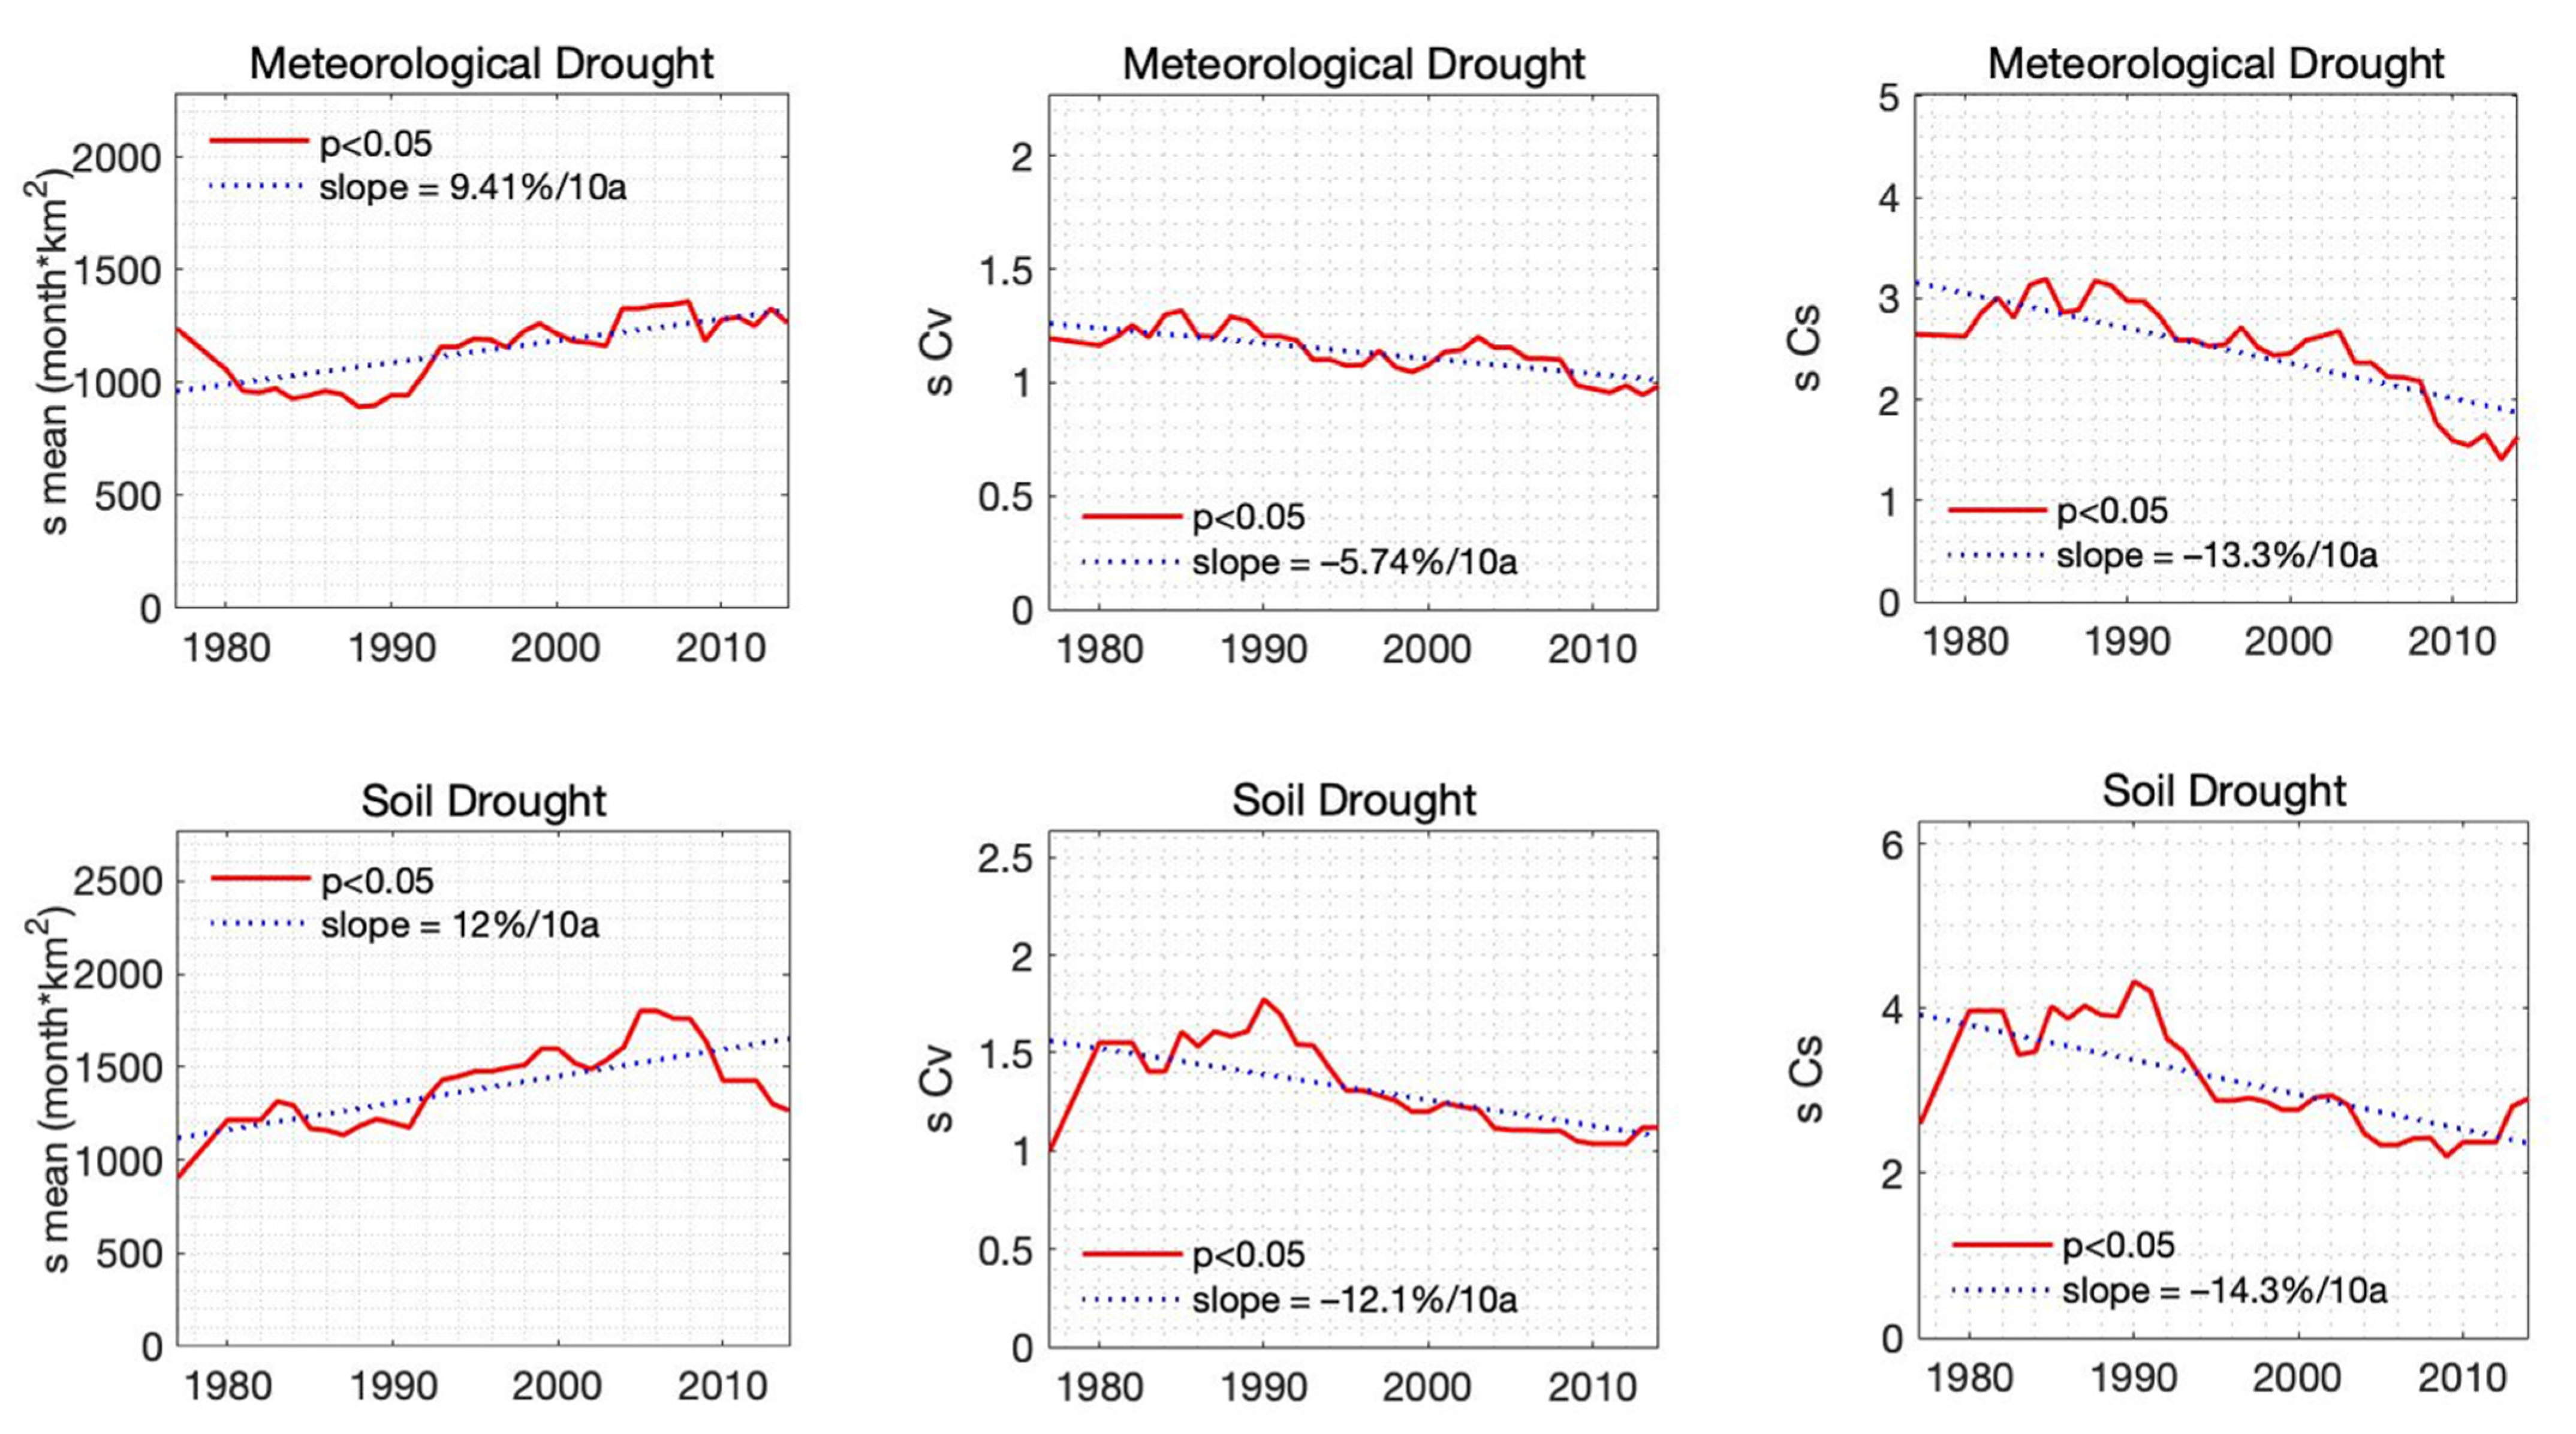
4.2.1. Change of the Drought Probability Distribution

The changes in drought distributions are captured by the changes in their probability distribution coefficients, including the mean value, coefficient of variation (Cv), and coefficient of skewness (Cs). Significant trends are detected in most of the probability distribution coefficients (here, considering the series from the first moving window to the last moving window). The changes in drought parameter distributions are shown in Figure 6, Figure 7 and Figure 8, and the slope herein is estimated by Thiel-Sen’s slope [40]. The relative slopes are employed here to compare the trends between different parameters.
Significant increasing trends were detected in the mean value series of all meteorological droughts and all soil droughts except the soil drought duration. The slope of the meteorological drought duration mean is +2.4% per decade, and the trends of the drought area mean and drought severity mean are much larger, ranging from +9.4% to +16.6% per decade. Significant decreasing trends are detected in the Cv series of meteorological drought duration and meteorological drought severity together with those of all soil drought parameters, with the trend ranging from −3.3% to −12.4% per decade. Significant decreasing trends were also detected in the Cs series of all meteorological drought parameters and all soil drought parameters, with the trend ranging from −5.0% to −19.4% per decade.
The overall increasing trend in the mean value series of drought parameter distributions is consistent with a previous study showing that droughts in Thailand have become more frequent and widespread [23]. The increasing trends of the mean value series suggest that the magnitudes of drought parameters increased. The decreasing trends of the Cv series and Cs series together suggest that the magnitudes of drought parameters between drought events became closer. Overall, the trends suggest that drought events in the NNCT became longer, wider, and more severe.

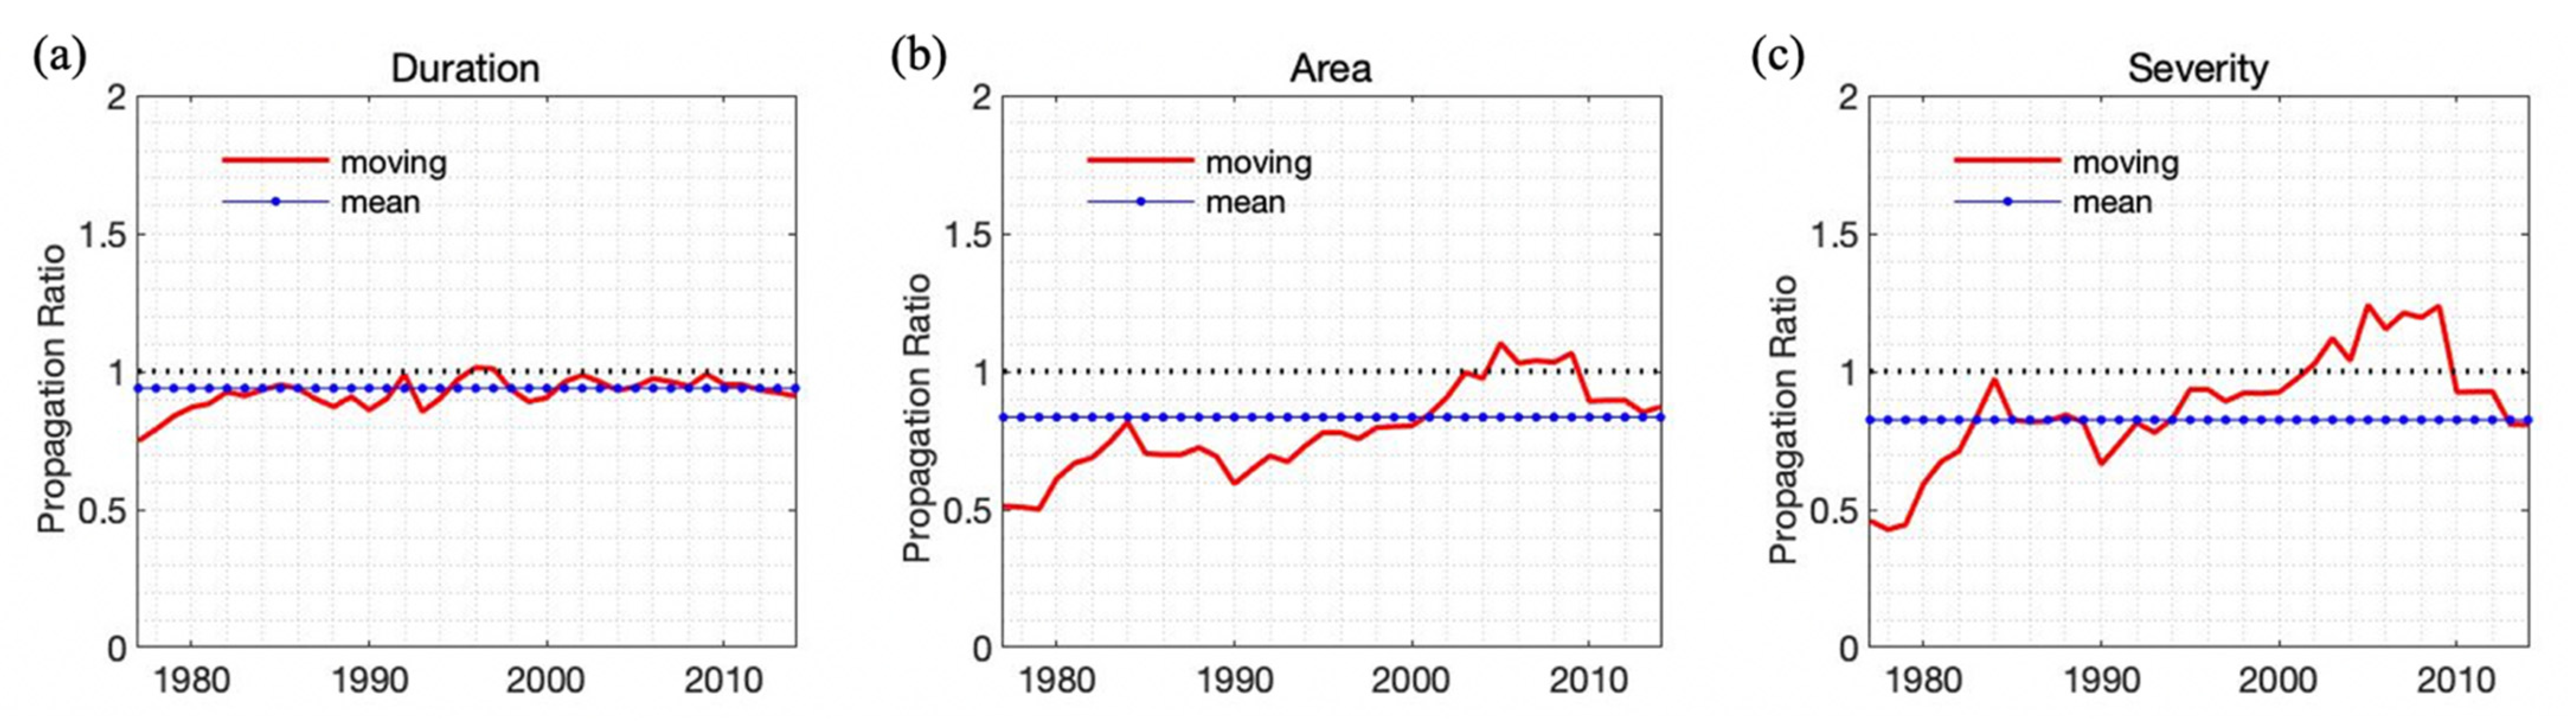
4.2.2. Change in Drought Propagation

Significant increasing trends are found in the drought propagation ratios of all drought parameters. The changes in the propagation ratios are shown in Figure 9. The moving drought propagation ratios are seldom higher than 1, indicating that the drought parameters of soil droughts are generally alleviated compared to meteorological droughts. In the windows near their peaks, the drought propagation ratios are higher than 1, indicating that soil droughts are amplified during drought propagation. Overall, the increasing trends suggest that the alleviation effect is becoming weaker; that is, the soil drought parameters that correspond to a fixed meteorological drought parameter magnitude are generally increasing. Therefore, the magnitude of soil drought under the same meteorological deficit conditions has increased.

5. Discussion

5.1. The Impacts of Climate Change on Drought Propagation

Climate change can be partly due to anthropogenic activities [41], such as global warming, and deforestation has been shown to decrease local rainfall in the Indochina Peninsula [42]. However, such changes in local climate are not distinguished from climate change. Therefore, meteorological droughts were affected by climate change, as meteorological drought events are identified from the SPEI series and determined by local climatic conditions. The soil droughts here are identified from the GLDAS 2.0 product, which is a reanalysis product without considering anthropogenic activities such as land-use change and irrigation. Therefore, historical soil moisture droughts were merely affected by climate change.
Previous studies have found that drought propagation from meteorological droughts to hydrological droughts can be affected by both climatic conditions and catchment properties due to groundwater recharge and groundwater storage, respectively [12]. Apurv et al. [15] applied three climate factors, the aridity index, phase index, and seasonality index, to capture the climatic conditions that affect the hydrological drought propagation process. In the case of low seasonality and an out-of-phase climate with a sufficient water supply, the deficits in groundwater can be alleviated in time, so the corresponding hydrological droughts are not long-lasting. When these three indices change to reduce groundwater recharge until the replenishment of groundwater is suppressed, hydrological droughts become more long-lasting. Although the hydrological processes at the soil surface are not as complex as those of groundwater, there is also soil water retention, which serves as long-term water persistence [43]. Herein, we employ two climate indices to capture the drought propagation ratio during propagation from meteorological droughts to soil droughts as the phase index (PI) [44] and the climate seasonality index (CSI) [45].
Stepwise regression is applied to explore the impacts of the three climate indices on the drought parameters (see the Supplementary Material for the details of these impacts). All of the drought parameters are found to be positively correlated with PI and CSI. Thailand is a highly seasonal region and has an in-phase climate (corresponding to high CSI and high PI), and the natural replenishment of soil retention relies highly on precipitation during the wet season. Therefore, in the cases with higher PI and CSI, the soil retention is more likely to be suppressed, leading to a stronger soil drought and a larger propagation ratio.

5.2. The Implications of Change in Historical Drought Characteristics

Previous studies have shown the intensification of the hydrological cycle under climate change [46,47], possibly including more frequent and intense hydrological extremes [47]. The droughts in Thailand show consistent trends. The significant trends in the distribution of drought parameters suggest that drought events are non-stationary under the definition of ‘weak stationarity’ [18]. The consistent significant increasing trends in the drought parameters of meteorological droughts and soil droughts show that the nonstationarity of soil droughts comes from mainly the climatic conditions.
The droughts are mainly centered in dense agricultural areas, such as the Chao Phraya River basin and the Mun River basin. As shown in Figure 4, irrigation facilities have been developed in these areas, so the stress brought by potential soil moisture droughts may have been undertaken by local water resources rather than local agriculture. Water shortages have led to increasing groundwater demand in many parts of the world [15,48]. Groundwater abstraction has also become an important complementary water source in Thailand, and the water table has been found to decrease in several regions of the Younger Aquifer in the Upper Central Plain of the Chao Phraya River of Thailand [49].
In most of the windows during the study period, the drought propagation ratios were below 1, indicating that the drought parameters were alleviated after drought propagation. Under meteorological droughts, soil water is still consumed by evapotranspiration but may not be replenished in time. Therefore, the propagation from meteorological droughts to soil droughts meets a trade-off between soil water persistence as soil retention and consumption by evapotranspiration. At the end of the study period, the drought propagation ratios of drought area and drought severity exceeded 1. Since the effects of anthropogenic activities are not considered, the difference should be mainly due to consumption by evapotranspiration.
Additionally, the propagation ratio compares the distributions of meteorological drought parameters and soil drought parameters, and the drought parameters of a soil drought may not be definitively lower than those of the corresponding soil droughts. Propagation ratios less than 1 can only indicate that the soil drought parameters are generally lower than the corresponding meteorological drought parameters, while for severe droughts and mild droughts (droughts with short trivariate return periods), the relationship may differ. Furthermore, the propagation ratio compares the distributions by comparing drought parameters of drought events with the same trivariate return period. As a meteorological drought and the corresponding soil drought may not have the same trivariate return period, the drought parameters of soil droughts may not be definitively lower than those of meteorological droughts when the propagation ratio is lower than 1.

5.3. Uncertainties and Limitations

Uncertainties can arise from the length of the hydrological variable series. An estimation of drought parameters based on 67-year hydrological series may not meet the requirements of second-order statistic stationarity [18], while for the change in mean value, the samples are sufficient.
Uncertainties can also arise from meteorological and hydrological data. The meteorological and hydrological data used in this research are from GPCC and GLDAS. GPCC data are generated from the global observation system and fit the local rainfall observations of Thailand quite well. Therefore, the data uncertainty comes mainly from GLDAS. Liu et al. [26] suggested that reanalysis products such as GLDAS give better descriptions of soil droughts than remote sensing data such as the ESA CCA product in densely vegetated regions. However, the current work cannot provide a precise description of anthropogenic activities such as irrigation.

6. Conclusions

In this study, the NNCT is employed as a typical tropical monsoon region to analyze the spatiotemporal characteristics of droughts and their propagation. According to the results, the following conclusions are made:
(1) In the NNCT, 70 meteorological droughts and 44 soil moisture droughts were identified from 1948 to 2014 based on three-dimensional drought identification. Both the meteorological drought and the soil drought that occurred from 1979 to 1980 had the longest trivariate return period. The drought centers are mainly located in the Chao Phraya River basin and the Mun River basin, and the severe droughts occurred mainly near 1950, 1980, and 2010. The mean propagation ratios of all drought parameters are less than 1, showing the function of the underlying surface as a buffer to alleviate the moisture deficits.
(2) Most of the probability distribution coefficients and all drought propagation ratios of the three drought parameters were found to change significantly based on a moving-window method, indicating that the drought parameters and their propagation from meteorological droughts to soil droughts are non-stationary. The mean value of drought parameters mostly showed significant increasing trends, and the Cs series and Cv series of drought parameters mostly showed significant decreasing trends. The trends indicated that the drought events in the NNCT became longer in duration, larger in area, and more severe in dryness. The propagation ratios of all drought parameters showed significant increasing trends, indicating that the function of the underlying surface as a buffer has become weaker.
(3) The change in drought propagation ratios can be attributed to climate change. The drought propagation ratios are found to be positively related to two climate indices, PI and CSI. The stronger droughts may not only bring stress to local soil moisture but also to the local groundwater indirectly by irrigation.
These findings will help develop a better understanding of water resource management in Thailand, and the methods used in this study can be applied to other basins to obtain a better understanding of the spatiotemporal characteristics of droughts and their propagation.

Supplementary Materials

The following supporting information can be downloaded at: https://www.mdpi.com/article/10.3390/atmos13020277/s1, Table S1: Drought propagation ratios in the study period; Table S2: The historical meteorological droughts in the study period; Table S3: The historical soil droughts in the study period; Figure S1: Regression result.

Author Contributions

B.Z.: Writing-original draft, Writing—review and editing, Conceptualization, Methodology, Data curation; D.Y.: Writing—review and editing, Conceptualization, Supervision, Methodology, Funding acquisition; S.Y.: Data curation; J.S.: Investigation. All authors have read and agreed to the published version of the manuscript.

Funding

This work was financially supported by the National Natural Science Foundation of China (project No. 41661144031).

Institutional Review Board Statement

Not applicable.

Informed Consent Statement

Not applicable.

Data Availability Statement

GLDAS Noah 2.0 reanalysis dataset is available via the flowing link: https://disc.gsfc.nasa.gov/datasets?keywords=GLDAS&page=1 (accessed on 1 January 2022), and the precipitation data are from the Global Precipitation Climatology Center and is available via the link: http://opendata.dwd.de/climate_environment/GPCC/html/download_gate.html (accessed on 1 January 2022).

Conflicts of Interest

The authors declare no conflict of interest.

References

  1. Dai, A. Drought under global warming: A review. WIREs Clim. Chang. 2010, 2, 45–65. [Google Scholar] [CrossRef] [Green Version]
  2. Mishra, A.K.; Singh, V.P. A review of drought concepts. J. Hydrol. 2010, 391, 202–216. [Google Scholar] [CrossRef]
  3. Sheffield, J.; Wood, E.F.; Roderick, M.L. Little change in global drought over the past 60 years. Nature 2012, 491, 435–438. [Google Scholar] [CrossRef] [PubMed]
  4. Wood, E.F.; Sheffield, J. Global Trends and Variability in Soil Moisture and Drought Characteristics, 1950–2000, from Observation-Driven Simulations of the Terrestrial Hydrologic Cycle. J. Clim. 2008, 21, 432–458. [Google Scholar]
  5. Xu, K.; Yang, D.; Yang, H.; Li, Z.; Qin, Y.; Shen, Y. Spatio-temporal variation of drought in China during 1961–2012: A climatic perspective. J. Hydrol. 2015, 526, 253–264. [Google Scholar] [CrossRef]
  6. Liu, Y.; Liu, Y.; Wang, W.; Zhou, H. Propagation of soil moisture droughts in a hotspot region: Spatial pattern and temporal trajectory. J. Hydrol. 2021, 593, 125906. [Google Scholar] [CrossRef]
  7. Lloyd-Hughes, B. A spatio-temporal structure-based approach to drought characterisation. Int. J. Climatol. 2012, 32, 406–418. [Google Scholar] [CrossRef] [Green Version]
  8. Andreadis, K.M.; Clark, E.A.; Wood, A.W.; Hamlet, A.F.; Lettenmaier, D.P. Twentieth-Century Drought in the Conterminous United States. J. Hydrometeorol. 2005, 6, 985–1001. [Google Scholar] [CrossRef]
  9. Xu, K.; Yang, D.; Xu, X.; Lei, H. Copula based drought frequency analysis considering the spatio-temporal variability in Southwest China. J. Hydrol. 2015, 527, 630–640. [Google Scholar] [CrossRef]
  10. Liu, Y.; Zhu, Y.; Ren, L.; Singh, V.P.; Yong, B.; Jiang, S.; Yuan, F.; Yang, X. Understanding the Spatiotemporal Links Between Meteorological and Hydrological Droughts from a Three-Dimensional Perspective. J. Geophys. Res. Atmos. 2019, 124, 3090–3109. [Google Scholar] [CrossRef]
  11. Van Loon, A.F.; Van Lanen, H.A.J. A process-based typology of hydrological drought. Hydrol. Earth Syst. Sci. 2012, 16, 1915–1946. [Google Scholar] [CrossRef] [Green Version]
  12. Konapala, G.; Mishra, A. Quantifying Climate and Catchment Control on Hydrological Drought in the Continental United States. Water Resour. Res. 2020, 56, e2018WR024620. [Google Scholar] [CrossRef]
  13. Haslinger, K.; Koffler, D.; Schöner, W.; Laaha, G. Exploring the link between meteorological drought and streamflow: Effects of climate-catchment interaction. Water Resour. Res. 2014, 50, 2468–2487. [Google Scholar] [CrossRef]
  14. Wu, J.; Miao, C.; Zheng, H.; Duan, Q.; Lei, X.; Li, H. Meteorological and Hydrological Drought on the Loess Plateau, China: Evolutionary Characteristics, Impact, and Propagation. J. Geophys. Res. Atmos. 2018, 123, 11569–11584. [Google Scholar] [CrossRef]
  15. Apurv, T.; Sivapalan, M.; Cai, X. Understanding the Role of Climate Characteristics in Drought Propagation. Water Resour. Res. 2017, 53, 9304–9329. [Google Scholar] [CrossRef] [Green Version]
  16. Apurv, T.; Cai, X. Drought Propagation in Contiguous U.S. Watersheds: A Process-Based Understanding of the Role of Climate and Watershed Properties. Water Resour. Res. 2020, 56, e2020WR027755. [Google Scholar] [CrossRef]
  17. Milly, P.C.D.; Betancourt, J.; Falkenmark, M.; Hirsch, R.M.; Kundzewicz, Z.W.; Lettenmaier, D.P.; Stouffer, R.J. Climate change—Stationarity is dead: Whither water management? Science 2008, 319, 573–574. [Google Scholar] [CrossRef]
  18. Yang, Y.; Roderick, M.L.; Yang, D.; Wang, Z.; Ruan, F.; McVicar, T.R.; Zhang, S.; Beck, H.E. Streamflow stationarity in a changing world. Environ. Res. Lett. 2021, 16, 064096. [Google Scholar] [CrossRef]
  19. Apurv, T.; Cai, X. Evaluation of the stationarity assumption for meteorological drought risk estimation at the multi-decadal scale in contiguous US. Water Resour. Res. 2019, 55, 5074–5101. [Google Scholar] [CrossRef]
  20. Apurv, T.; Cai, X. Regional Drought Risk in the Contiguous United States. Geophys. Res. Lett. 2021, 48, e2020GL092200. [Google Scholar] [CrossRef]
  21. Thailand. Available online: https://en.wikipedia.org/wiki/Thailand (accessed on 1 January 2022).
  22. Mateo, C.M.; Hanasaki, N.; Komori, D.; Tanaka, K.; Kiguchi, M.; Champathong, A.; Sukhapunnaphan, T.; Yamazaki, D.; Oki, T. Assessing the impacts of reservoir operation to floodplain inundation by combining hydrological, reservoir management, and hydrodynamic models. Water Resour. Res. 2014, 50, 7245–7266. [Google Scholar] [CrossRef]
  23. Zhang, L.; Chen, Z.; Zhou, T. Human Influence on the Increasing Drought Risk Over Southeast Asian Monsoon Region. Geophys. Res. Lett. 2021, 48, e2021GL093777. [Google Scholar] [CrossRef]
  24. Takahashi, H.G.; Yasunari, T. A climatological monsoon break in rainfall over Indochina—A singularity in the seasonal march of the Asian summer monsoon. J. Clim. 2006, 19, 1545–1556. [Google Scholar] [CrossRef] [Green Version]
  25. Spennemann, P.C.; Rivera, J.A.; Saulo, A.C.; Penalba, O.C. A Comparison of GLDAS Soil Moisture Anomalies against Standardized Precipitation Index and Multisatellite Estimations over South America. J. Hydrometeorol. 2015, 16, 158–171. [Google Scholar] [CrossRef]
  26. Liu, Y.; Liu, Y.; Wang, W. Inter-comparison of satellite-retrieved and Global Land Data Assimilation System-simulated soil moisture datasets for global drought analysis. Remote Sens. Environ. 2019, 220, 1–18. [Google Scholar] [CrossRef]
  27. Sanchez-Lorenzo, A.; Morán-Tejeda, E.; Revuelto, J.; Azorin-Molina, C.; López-Moreno, J.I.; Camarero, J.J.; Lorenzo-Lacruz, J.; Beguería, S.; Vicente-Serrano, S.M. Performance of Drought Indices for Ecological, Agricultural, and Hydrological Applications. Earth Interact. 2012, 16, 1–27. [Google Scholar]
  28. Hao, Z.; AghaKouchak, A. Multivariate Standardized Drought Index: A parametric multi-index model. Adv. Water Resour. 2013, 57, 12–18. [Google Scholar] [CrossRef] [Green Version]
  29. Wang, A.; Lettenmaier, D.P.; Sheffield, J. Soil Moisture Drought in China, 1950–2006. J. Clim. 2011, 24, 3257–3271. [Google Scholar] [CrossRef]
  30. Marsaglia, G.; Tsang, W.W.; Wang, J. Evaluating Kolmogorov’s distribution. J. Stat. Softw. 2003, 8, 1–4. [Google Scholar] [CrossRef]
  31. Sklar, M. Fonctions de répartition à n dimensions et leurs marges. Publ. Inst. Statist. Univ. Paris 1959, 8, 229–231. [Google Scholar]
  32. Salvadori, G.; De Michele, C.; Durante, F. On the return period and design in a multivariate framework. Hydrol. Earth Syst. Sci. 2011, 15, 3293–3305. [Google Scholar] [CrossRef] [Green Version]
  33. Bonaccorso, B.; Cancelliere, A.; Rossi, G. An analytical formulation of return period of drought severity. Stoch. Environ. Res. Risk Assess. 2003, 17, 157–174. [Google Scholar] [CrossRef]
  34. Shiau, J.T. Return period of bivariate distributed extreme hydrological events. Stoch. Environ. Res. Risk Assess. 2003, 17, 42–57. [Google Scholar] [CrossRef]
  35. Vinnarasi, R.; Dhanya, C.T. Bringing realism into a dynamic copula-based non-stationary intensity-duration model. Adv. Water Resour. 2019, 130, 325–338. [Google Scholar] [CrossRef]
  36. Mann, H.B. Nonparametric Tests against Trend. Econometrica 1945, 13, 245–259. [Google Scholar] [CrossRef]
  37. Kendall, M.G. Rank Correlation Methods; C. Griffin: London, UK, 1948; 160p. [Google Scholar]
  38. Nagaraj, D.; Proust, E.; Todeschini, A.; Rulli, M.C.; D’Odorico, P. A new dataset of global irrigation areas from 2001 to 2015. Adv. Water Resour. 2021, 152, 103910. [Google Scholar] [CrossRef]
  39. Lehner, B.; Verdin, K.; Jarvis, A. New global hydrography derived from spaceborne elevation data. EOS Trans. 2008, 89, 93–94. [Google Scholar] [CrossRef]
  40. Fernandes, R.; Leblanc, S.G. Parametric (modified least squares) and non-parametric (Theil–Sen) linear regressions for predicting biophysical parameters in the presence of measurement errors. Remote Sens. Environ. 2005, 95, 303–316. [Google Scholar] [CrossRef]
  41. Houghton, J. Global warming. Rep. Prog. Phys. 2005, 68, 1343–1403. [Google Scholar] [CrossRef]
  42. Kanae, S.; Oki, T.; Musiake, K. Impact of Deforestation on Regional Precipitation over the Indochina Peninsula. J. Hydrometeorol. 2001, 2, 51–70. [Google Scholar] [CrossRef] [Green Version]
  43. Chow, V.T.; Maidment, D.R.; Mays, L.W. Applied hydrology Journal of Engineering Education. J. Eng. Educ. 1962, 308, 1959. [Google Scholar]
  44. Woods, R.A. Analytical model of seasonal climate impacts on snow hydrology: Continuous snowpacks. Adv. Water Resour. 2009, 32, 1465–1481. [Google Scholar] [CrossRef]
  45. Woods, R.A. The relative roles of climate, soil, vegetation and topography in determining seasonal and long-term catchment dynamics. Adv. Water Resour. 2003, 26, 295–309. [Google Scholar] [CrossRef]
  46. Ziegler, A.D.; Sheffield, J.; Maurer, E.P.; Nijssen, B.; Wood, E.F.; Lettenmaier, D.P. Detection of Intensification in Global- and Continental-Scale Hydrological Cycles: Temporal Scale of Evaluation. J. Clim. 2003, 16, 535–547. [Google Scholar] [CrossRef] [Green Version]
  47. Huntington, T.G. Evidence for intensification of the global water cycle: Review and synthesis. J. Hydrol. 2006, 319, 83–95. [Google Scholar] [CrossRef]
  48. Cao, G.; Han, D.; Song, X. Evaluating actual evapotranspiration and impacts of groundwater storage change in the North China Plain. Hydrol. Process. 2014, 28, 1797–1808. [Google Scholar] [CrossRef]
  49. Vasconcelos, V.V.; Koontanakulvong, S.; Suthidhummajit, C.; Junior, P.P.M.; Hadad, R.M. Analysis of spatial–temporal patterns of water table change as a tool for conjunctive water management in the Upper Central Plain of the Chao Phraya River Basin, Thailand. Appl. Water Sci. 2014, 7, 245–262. [Google Scholar] [CrossRef] [Green Version]
Figure 1. Northern, northeastern, and central Thailand (NNCT).
Atmosphere 13 00277 g001
Figure 2. The fitting results of the drought parameters. (a) refers to the fit result of meteorological droughts, and (b) refers to the fit result of soil droughts. The x-axis is the cumulative probability estimated by the distribution functions, and the y-axis is the cumulative probability estimated by empirical functions.
Atmosphere 13 00277 g002aAtmosphere 13 00277 g002b
Figure 3. The fitting results of the copulas. (a) refers to the fit result of meteorological droughts, and (b) refers to the fit result of soil droughts. The x-axis is the cumulative probability estimated by the distribution functions, and the y-axis is the cumulative probability estimated by empirical functions.
Atmosphere 13 00277 g003
Figure 4. The spatial distribution of historical droughts over the past 67 years. The spatiotemporal distribution of historical droughts. Droughts are drawn at their center, and droughts with larger circles have longer trivariate return periods. The year 1950 refers to the period 1948–1954, 1960 refers to the period 1955–1964, and 1970 refers to the period 1965–1974, et cetera. (a,b) show the spatiotemporal distributions of the centers of meteorological droughts and soil droughts, respectively. The region inside the green line is the Chao Phraya River basin, while the region inside the orange line is the Mun River basin.
Atmosphere 13 00277 g004
Figure 5. The temporal distribution of historical droughts in the past 67 years. (a) shows the drought duration of historical droughts; (b) shows the drought area of historical droughts; (c) shows the drought severity of historical droughts; (d) shows the trivariate return period of historical droughts.
Atmosphere 13 00277 g005
Figure 6. The change in the drought duration distribution. d refers to the continuous estimate of drought duration as Equation (1).
Atmosphere 13 00277 g006
Figure 7. The change in the drought area distribution. a refers to the area ratio as Equation (2).
Atmosphere 13 00277 g007
Figure 8. The change in the drought severity distribution.
Atmosphere 13 00277 g008
Figure 9. The moving propagation ratios of the drought parameters. the x-axis refers to the end of the corresponding moving window, as 1977 refers to the propagation ratio calculated from 1948 to 1977. The dashed blue lines are the constant propagation ratios calculated in Section 4.1, and the red lines are the moving propagation ratios in the corresponding moving windows as introduced in Section 4.2. The dashed black lines show the position of 1. (a) shows the propagation ratio of drought duration; (b) shows the propagation ratio of drought area; (c) shows the propagation ratio of drought severity.
Atmosphere 13 00277 g009
Table 1. The goodness of fits in the distributions of drought parameters.
(1)
p-value
ExpGamGevGpdLgtP3
Soil Drought Duration0.9620.4160.8540.9790.7140.974
Meteorological Drought Duration0.5740.1190.7040.9240.6250.510
Soil Drought Area0.0290.0350.9690.9990.9480.124
Meteorological Drought Area0.0020.0130.8180.9740.7410.033
Soil Drought Severity0.0000.0000.8610.9820.8750.001
Meteorological Drought Severity0.0010.0020.5570.9550.5200.040
(2)
RMSE
ExpGamGevGpdLgtP3
Soil Drought Duration0.0230.0560.0360.0220.0420.022
Meteorological Drought Duration0.0310.0720.0300.0190.0350.029
Soil Drought Area0.0920.0830.0290.0210.0300.074
Meteorological Drought Area0.0980.0790.0320.0220.0350.074
Soil Drought Severity0.1580.1530.0250.0270.0260.147
Meteorological Drought Severity0.0930.0820.0370.0220.0380.059
Note: Exp refers to exponential distribution; Gam refers to gamma distribution; Gev refers to generalized extreme value distribution; Gpd refers to generalized Pareto distribution; Lgt refers to logistic distribution; P3 refers to Pearson III distribution. The bold values refer to the best fits and are employed in the study.
Table 2. The goodness of fits in the copulas.
(1)
RMSE of Meteorological droughts
NormaltClaytonFrankGumbelJoe
Duration-Area0.0300.0300.0370.0270.0280.028
Area-Severity0.0170.0170.0210.0170.0160.017
Severity-Duration0.0280.0290.0380.0260.0260.027
Duration-Area-Severity0.0300.0300.0360.0220.0210.023
(2)
RMSE of Soil droughts
NormaltClaytonFrankGumbelJoe
Duration-Area0.0290.0290.0340.0300.0270.027
Area-Severity0.0230.0230.0300.0230.0210.020
Severity-Duration0.0330.0320.0390.0340.0290.027
Duration-Area-Severity0.0320.0310.0550.0450.0390.041
Note: the bold values refer to the best fits and are employed in the study.
Table 3. The return period of the ten strongest historical meteorological droughts (unit: year).
MNoTDurationTAreaTSeverityTA-STS-DTD-ATD-A-S
31761335813376133157
2514772517272112
310384338434375
4858235959367
557322237243366
568151521191842
43171417141728
422161416141626
271561215151219
2521341341316
Note: MNo refers to the code of meteorological droughts. The first meteorological drought is coded as MNo. 1, while the last meteorological drought is coded as MNo. 70.
Table 4. The return period of the ten strongest historical soil droughts (unit: year).
SNoTDurationTAreaTSeverityTA-STS-DTD-ATD-A-S
1897129135129135136179
38441368713687136144
3744222444442450
255202620262630
310192319232329
12110721211027
3017591717923
176141214121417
194101210121215
3629595912
Note: SNo refers to the code of soil droughts. The first soil drought is coded as SNo. 1, while the last soil drought is coded as SNo. 44.
Publisher’s Note: MDPI stays neutral with regard to jurisdictional claims in published maps and institutional affiliations.

