Article

Effects of COVID-19-Epidemic-Related Changes in Human Behaviors on Air Quality and Human Health in Metropolitan Parks

Department of Landscape Architecture, College of Humanities and Creativity, National Chin-Yi University of Technology, Taichung 411170, Taiwan
*
Author to whom correspondence should be addressed.
Atmosphere 2022, 13(2), 276; https://doi.org/10.3390/atmos13020276
Submission received: 5 December 2021 / Revised: 2 February 2022 / Accepted: 4 February 2022 / Published: 7 February 2022

Abstract

:
The outbreak of the new coronavirus pneumonia (Coronavirus disease 2019, COVID-19) created a serious impact on the lives of people around the world. Humans, affected by the COVID-19 virus, must reduce related activities to suppress the spread of this disease. However, the pandemic had a positive impact on the environment due to reduced outdoor activities. The correlation between reduced human outdoor activities and health effects was investigated in this study through two Metropolitan parks in Taichung, Taiwan. The developed low-cost air quality sensors were installed in these two parks to detect the variances in PM2.5 concentrations during the epidemic outbreak. Experimental results indicated that PM2.5 concentrations in these two parks were reduced from about 23.25 and 22.96 μg/m3 to 8.19 and 8.48 μg/m3, respectively, the median absolute deviations (MAD) decreased from 4.21 and 4.57 to 1.71 and 1.35, respectively after the epidemic outbreak, and the calculated standard deviation of all normal-to-normal interval (SDNN) and the ratio of low-frequency power to high-frequency (LF/HF) indicated that the drops of PM2.5 concentrations caused the increased health-related benefits by 73.53% with the variances being low. These results showed that the PM2.5 concentrations displayed high correlations with human activities, which also played important roles in human health effects.

1. Introduction

In early years, humans burned dry branches and fallen leaves for heat and cooked food, which created air pollution. However, in those early years, the earth had enough green cover rate such that, through the earth’s self-purification function, these activities would not cause environmental pollution problems. More recently, humans have consumed fossil fuels unconscionably to produce a large amount of carbon dioxide following the industrial revolution, resulting in a greenhouse effect. Therefore, the global warming effect has become more serious, leading to an increase in the size of the hole in the ozone layer and the phenomenon of acid rain. Similarly, large-scale tracts of land have been urbanized rapidly, leading to negative problems such as air pollution and environmental noise. Therefore, in recent years, climate anomalies, earth desertification, urban high temperature, and ozone layer destruction have become the norm, which not only threatens the survival of mankind, but also devastates the biodiversity of the environment in a unprecedented manner. In addition, with the expansion of cities, the anthropogenic destruction of biological habitats has led to serious ecological imbalances. In particular, the permafrost on Earth is gradually unfrozen to release frozen virus and bacteria in the permafrost, causing many emerging infectious diseases. Humanity has undergone five pandemics, which have changed human history and civilization. Notably, several difficult diseases have emerged in the last 20 years, such as Severe Acute Respiratory Syndrome (SARS), Middle East Respiratory Syndrome (MERS), and the new coronavirus pneumonia (Coronavirus disease 2019, COVID-19). Since December 2019, Wuhan City, China has seen unexplained symptoms of pneumonia, and initially thought that the cases were related to the history of seafood market activities in south China [1]. Severe acute respiratory syndrome coronavirus 2 (SARS-CoV-2) was detected from the environment during a public health survey, and the world health organization (WHO) has not yet determined the source on this infection. The COVID-19 outbreak has spread rapidly around the world because of the frequent global exchanges for the global village. As of 24 October 2021, there were more than 263 million confirmed patients worldwide, of which more than 5 million died, with an average mortality rate of 2.34%, affecting 194 countries and regions around the world [2].
The COVID-19 outbreak spread rapidly throughout the world, and the large number of infected people has caused the health care system to be overburdened and even collapse. To cope with the development on the epidemic, most countries have been offering to lock up countries and seal cities in order to break the transmission chain, which has also caused an economic impact. The first large-scale COVID-19 outbreak was in May 2021 in Taiwan. An epidemic prevention alert was raised quickly from the first level, requiring masks at all times when entering and leaving public places, to the third level, which required social distancing of no more than five people indoors and ten people outdoors [3]. According to the development of the epidemic, it should be upgraded to the fourth level epidemic prevention standards, which is the lockdown of the city. Considering the daily life of the people, Taiwan maintained a three-level alert until the epidemic gradually calmed down. Therefore, this study investigated the correlation between people’s life and air quality in metropolitan areas. Low-cost PM2.5 detectors were developed and installed in two metropolitan parks, Dunha Park and 823 Memorial Park in Taichung City, Taiwan to detect changes of PM2.5 concentration before the COVID-19 outbreak and until the epidemic outbreak was gradually stabilized. These detected data were investigated to determine the relationship between the decrease in people’s activities, air quality, and the impact on human health by statistical analysis methods.
Some studies have discussed the changes in epidemic conditions and changes in air quality [4,5,6,7]. These results showed that air pollution was improved by reducing human activity, including the reduction of automobile and locomotive transportation as well as reducing oil fumes in the catering trade. Further, high quantities of air pollution can lead to serious lung disease. Otherwise, long-term air pollution can cause additional complications with COVID-19 infection. These studies also showed the influence of PM2.5 concentrations on health [8,9,10], illustrating that exposure to high concentrations of airborne particulates PM10 and PM2.5 could increase mortality and reduce life expectancy. Exposure could also cause damage to the cardiovascular, respiratory, and reproductive systems, which was also associated with diabetes, and can even cause cancer and affect the central nervous system. The deviations of the standard deviation of all normal-to-normal intervals (SDNN) and the ratio of low-frequency power to high-frequency (LF/HF) could be used to determine the extent of the impacts. The heart rate variability (HRV) often uses SDNN as the basis for analysis. The standard deviation of the normal heartbeat spacing of 24 h is usually calculated, that is, the method of measuring the degree of change in the continuous heartbeat rate. The R waves in the electrocardiogram are commonly used to calculate the SDNN by measuring the time interval between R waves, which becomes a set of sequences, and then further calculation and analysis. LF/HF acts as an indicator of the Sympathetic and Parasympathetic balance. It mainly represents the regulation on the heart by the sympathetic nerve. It is related to cardiac autonomic neuromodulation function, peripheral vasoconstriction resistance, renin-angiotensin-aldosterone system (RAAS) activity, thermoregulation, and hormones. The research achievements of World Health Organization (WHO) [11] showed that air pollution was strongly associated with acute respiratory infections and chronic obstructive pulmonary disease (COPD), as well as cardiovascular disease and cancer. So far, the best way to improve air quality, especially PM2.5 concentration, is to control emissions from local sources [12,13,14,15,16]. Therefore, this study explored the changes in the COVID-19 outbreak and the epidemic control measures for people to reduce outdoor activities with PM2.5 concentration. The effects on decreasing the SDNN and increasing LF/HF [17] were quoted to discuss the health effect of a reduction of PM2.5 concentration and investigate the health correlation between changes in the epidemic outbreak and human outdoor activities through the variance of PM2.5 concentration.

2. Methodology

Two metropolitan parks in the Taichung Metropolitan Area were selected as research sites in this study. The reasons were that large numbers of people lived around these parks and many vehicles come in and out frequently. There are also many famous restaurants in this area that emit cooking fumes. Furthermore, the Taichung Power Plant is the fourth largest coal-fired power station in the world, located in the west of Taichung city [18]. These factors affect the air quality around this area and must be observed for a long time. Therefore, a low-cost air detection device was developed using Arduino technology, which was then used to detect the PM2.5 concentration variation in the experimental fields. To verify the measurement accuracy on this developed air detector and the detected data before and after the outbreak epidemic, a statistical method was applied to analyze the detection benefits and the PM2.5 concentration variance, respectively, in this study. The relevant statistical formulas are discussed below.

2.1. The Accuracy Analysis for the Developed Air Detector

The determination coefficient R-square is used to investigate the accuracy of the developed air detector to compare the detected PM2.5 concentration variation between those of the developed air detector and the high-accuracy air detector. Therefore, the determination coefficient R-square is expressed as follows:
R 2 = ( y ^ y ¯ ) 2 ( y y ¯ ) 2 = 1 ( y y ^ ) 2 ( y y ¯ ) 2
where,
( y y ^ ) 2 = y 2 ( b 0 y + b 1 x 1 y + b 2 x 2 y + + b k x k y ) , define the sum of squares for error.
Next, Equation (2) can be defined as the sum of squares for total, as follows:
( y y ¯ ) 2 = y 2 1 n ( y ) 2
Finally, Equation (3) is defined as the sum of squares for regression as follows:
( y ^ y ¯ ) 2

2.1.1. Adjusted the R Squared Value

This study explored the differences between the detection data of these two instruments, focusing on exploring the detection accuracy of the developed low-cost air detector. Since R squared is overestimated due to the addition of independent variables, the R squared value was adjusted in this study, and the formula for adjusting R squared is expressed as follows:
R 2 = 1 ( 1 R 2 ) n 1 ( n k 1 )
where,
n represents the number of arguments;
k is the number of groups.

2.1.2. Standard Estimation Error

In this study, y is the standard error between the experimental value of the developed device and the detected value of the high-accuracy device to explore the detected accuracy of the developed device. Therefore, the estimated standard error can be calculated as follows:
S y = ( y y ^ ) 2 n k 1
where,
v k = S y y is the Coefficient of Variation;
k is the number of experimental groups in the multiple regression equation;
n is the number of times experimental data were captured per experiment.

2.1.3. F-Test

The F-test is used to investigate the accuracy of this developed device in order to find the linear relationship between the regression equation of the detected values of the developed device and the high-accuracy device. The formula of the F-test is expressed as follows:
F = ( y ^ y ¯ ) 2 k ( y y ^ ) 2 n k 1 = R 2 / k ( 1 R 2 ) / ( n k 1 )

2.2. Statistical Method

The detected data were recorded every thirty minutes, and the daily correlation data were calculated to obtain the mean, standard deviation (SD), Coefficient of Variation (CV), Mean Deviation (MD), Interquartile Range (IQR), Quartile Deviation (QD), and median absolute deviation (MAD) by the statistical method, as listed below:
Mean
x ¯ = i = 1 n   x i n
Standard Deviation (SD)
S D = 1 n i = 1 n ( x i x ¯ ) 2
Coefficient of variation
C V = S D x ¯
Mean Deviation (MD)
M D = i = 1 n | x i x ¯ | n  
Interquartile (IQR)
I Q R = Q 3 Q 1
where,
Q 3 is the third quartile;
Q 1 is the first quartile.
Quartile Deviation (QD)
Q D = 1 2 I Q R = 1 2 ( Q 3 Q 1 )
Median absolute Deviation (MAD)
M A D = 1 n 2 1 | x i m ( Χ ) |  
where,
m ( Χ ) is the median value.

2.3. Reduction Effect

The PM2.5 concentrations were measured as indicator pollutants. Next, when PM2.5 exposures were 12.6 ± 8.9 µg/m3, the standard deviations of all normal-to-normal (SDNN) intervals reduced by 3.68%, and the ratios of low-frequency power to high-frequency (LF/HF) power increased by 3.86% under a 95% confidence level [17]. The statistical characteristics of PM2.5 concentration is the smaller-the-best statistical characteristics. The inverted normal loss function (INLF) and modified loss function (MINLF) for the Taguchi one side Quadratic loss function and step loss function, proposed by Pan et al. (2007) [19], were quoted and modified in this study. The relationship between the derived step loss function and the SDNN and LF/HF indicators is established to reflect any improvements regarding potential human risk and health losses with the epidemic-related changes in PM2.5 based on the smaller-the-best statistical characteristics [20].
When the product quality characteristic value deviates from the target value, there will be a loss, and the further away from the target value, the greater the loss. When the quality characteristic is small, the target value is zero, and the mathematical model of the Quadratic loss function can therefore be written as:
L ( y ) = k y 2 , y 0
where,
y represents the quality characteristics of product;
k is the constant value of quality loss function.
The INLF was proposed to describe product quality loss with a properly transformed normal probability density function by Spiring (1993) [21]. In reality, the quality characteristics of the PM2.5 concentration is the-small-the-best. Therefore, Equation (14) can be rewritten as follows:
L ( y ) = k { 1 e x p { y 2 2 σ L 2 } } , y 0
where,
y represents the air quality characteristics of the PM2.5 concentration;
k is the constant value of the quality loss function;
σL is the shape parameter of the adjustment loss function.
σL = ∆/4 was suggested by Spiring (1993) [20] and used in this study, where ∆ represents the maximum values of SDNN and LF/HF at various stages. The Revised Inverted Normal Loss Function (RINLF), proposed by Pan and Wang (2000) [22], is quoted and modified to define this RINLF with the smaller-the-best based on the detected PM2.5 concentration, as follows:
L ( y ) = { 0   ,     i f       0 y < U k { 1 e x p { ( y U ) 2 2   ·   σ L 2 } } , i f   y > U
where,
U is the upper bound with air quality characteristics of PM2.5 concentration that deviated from the target value of zero.
The different PM2.5 concentrations have different influence degrees on SDNN and LF/HF [17]. Therefore, the effect of PM2.5 concentration on health belongs to the step loss function. The step loss function is quoted to modify and define that the effects of PM2.5 pollution on physical health characteristics obey the normal distribution on PM2.5 concentration. PM2.5 concentration obeys the normal distribution. Thus, the loss function of the step loss function can reflect the actual effect of PM2.5 concentration on SDNN and LF/HF. The mathematical model with the smaller-the best quality characteristics of PM2.5 concentration is expressed as follows:
L s t e p ( y ) = { L 1                                                       0 y < m 1 U S L L 2                                 m 1 U S L y < m 2 U S L L 3                                 m 2 U S L y < m 3 U S L · · · L k 1                 m k 2 U S L y < m k 1 U S L L k                                                             y > m k 1 U S L

3. Materials and Experimental Fields

3.1. The Developed Test Devices

The PM2.5 detector developed in this study was a low-cost and high-precision air dust sensor with Ardino single-chip technology, which is used to measure air quality changes for a long time and investigate the impact of epidemic-outbreak-related changes on air quality in cities and parks. The Panto PMS3003 air dust sensor [23] was used in this developed device to detect the PM2.5 concentration. The PMS3003 was a digital universal particle concentration sensor, which can obtain suspended particles in the air, i.e., the concentration of particles, and output these data as a digital interface. The laser scattering principle is used to measure the data of PM1.0, PM2.5, and PM10 with the light wavelength being 650 nm [24]. The power supply for the PMS3003 should be stable to meet the need for long, outdoor data collection. Therefore, the NP7-14 battery is used as the power supply for the PMS3003, not the Arduino UNO supply, and a Negative Booster is applied to buck it to 5 V and 7 V to ensure that data recordings are stable. The data recorder was recorded through the XD-204 SD card module, and the data was then transmitted to the computer. These detector devices include Arduino Uno (Development), PMS3003 (Air Dust Sensor), and XD-204 Data Logging (Data Recorder, SD Card Reading and Writing Module and RTC Clock Module). The hardware circuit of this developed aerosol sensing system is shown in Figure 1.

3.2. Experimental Fields

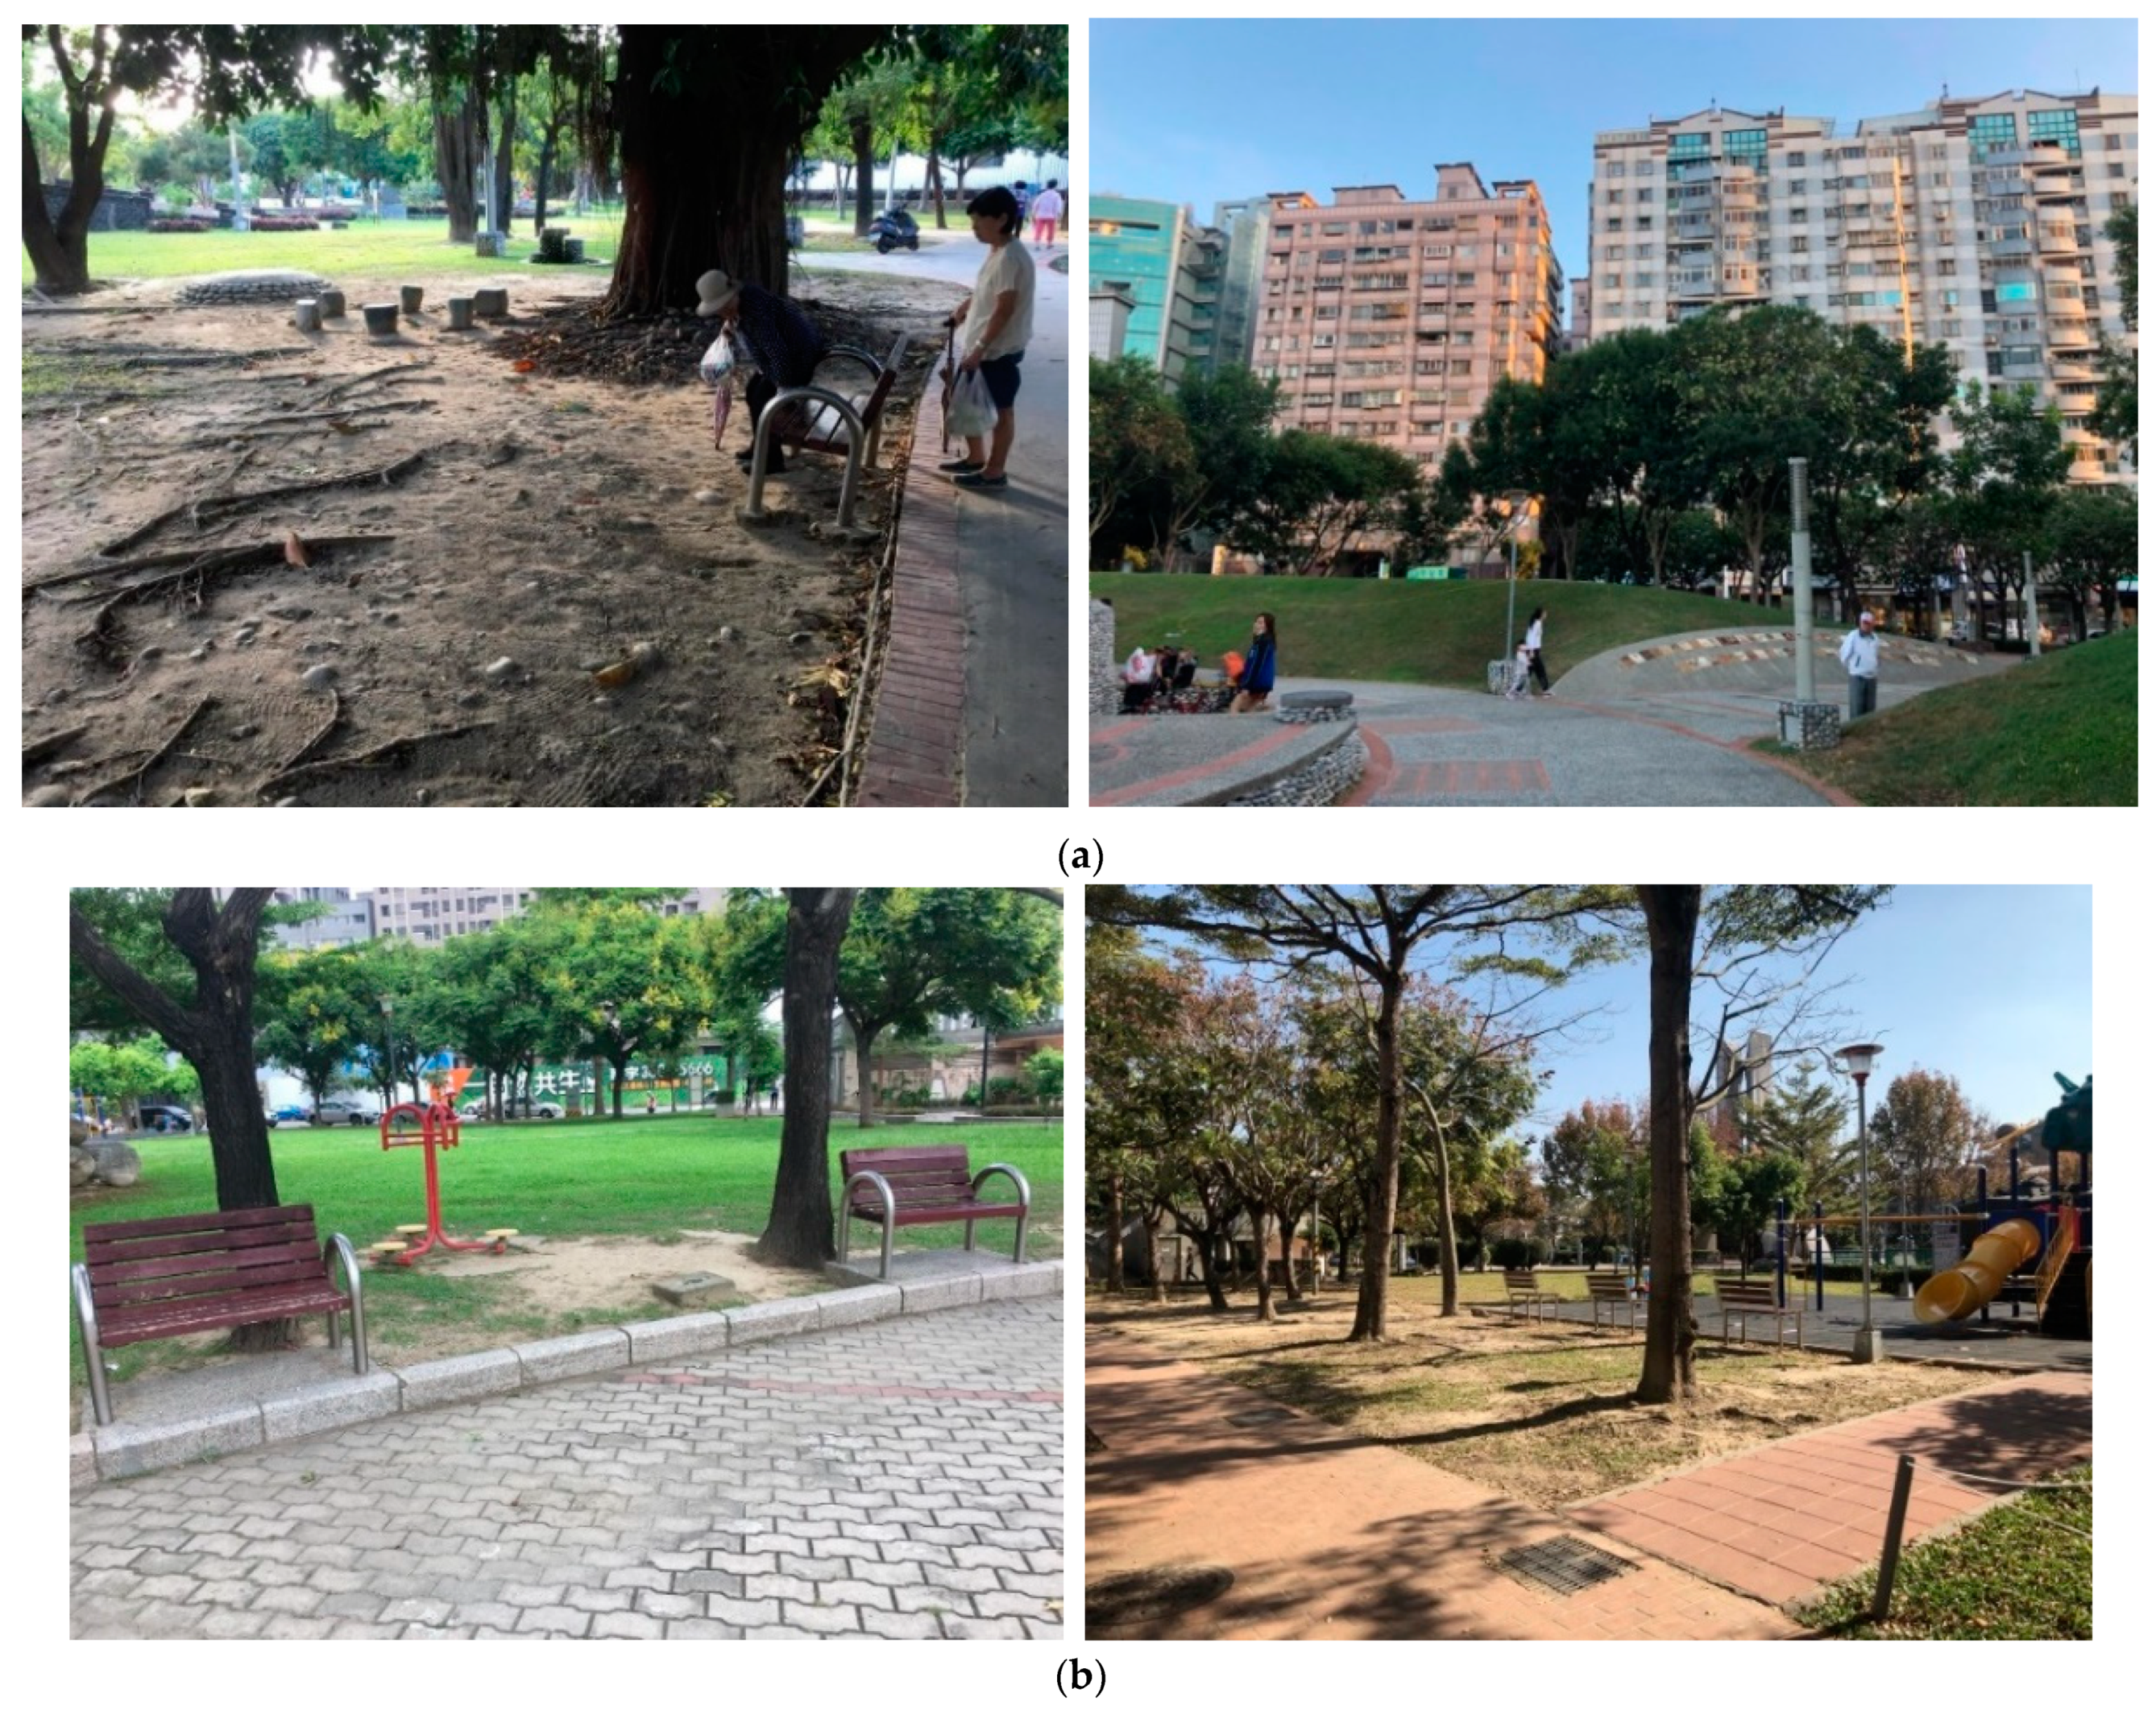
Recently, a large number of people with densely populated motor vehicle emissions are moving into Taichung city. Most of the population is concentrated in the metropolitan area, where the population north of Beitun in Taichung has grown rapidly due to economic activity and the gradual implementation of many major municipal construction projects. Air Quality in Taichung Region is mainly influenced by Region (Sea and Land Location, Latitude and Longitude, etc.), Regional Climate, Microclimate (Microclimate, including thermal convection, turbulence, flow, temperature, humidity, wind direction, wind speed, etc.), traffic conditions, emission characteristics of industrial pollution sources, and diffusion conditions [25]. In particular, the industrial-intensive region, including the precision tool machine industry, central science park, and energy-intensive manufacturing industry, are around this research area. In addition, Taichung City is in the basin terrain, as long as the east wind is blowing in the central city. It is not easy for air to diffuse, causing a serious haze phenomenon. Therefore, this study selected two urban parks in the newly developed area of Beitun District of Taichung City as the targets: (1) Dunhua Park; (2) 823 Memorial Park as the experimental field. The Xitun Survey Station of the Central Meteorological Administration, Taichung, Taiwan is the closest station to these two experimental parks. The climatological data and air quality data on the monitoring Station were used as the basic data for this region to carry out the numerical comparison of PM2.5 suspended particulates detected from these two parks. Dunhua Park, with water features, a large area of green lawn, and an ecological, green, and leisure-oriented focus, is a public construction through cross-neighborhood cooperation and citizenship participation, shown in Figure 2. 823 Memorial Park is one of the parks in Taichung. Non-governmental organizations adopted their public open spaces and public facilities, shown in Figure 3. The research results showed that the concentration and distribution of PM2.5 in this study area were mainly affected by wind speed and direction. In summer, the wind direction is east-west, and as the wind speed rises, the concentration of PM2.5 in the air decreases almost synchronously. In addition, the study results have shown that the PM2.5 concentration and other air pollutants has a synchronous upward trend beginning at 6:00 a.m., and it has decreased until the early morning, which shows that PM2.5 concentration is closely related to people’s work and rest. Sources of pollution from both gasoline and diesel vehicles as well as industries may need to be effectively managed [26,27]. The two parks are located in the newly developed metropolitan area with well-functioning living facilities and many residents, which are close to the Taichung Science Park. Therefore, this study selected two of the most representative parks in this area as research areas.

4. Test Results and Discussion

4.1. The Accuracy of the Developed Device

The developed device is a low-cost, experimental sensor with a PMS3003 aerosol sensor. To ensure the precision of this developed device, the data collection results of the PMS3003 aerosol sensor developed in this study were verified numerically with the high-accuracy AEROCET 531S portable dust meter. The recorded PM2.5 data of the PMS3003 were compared with the detected results of AEROCET 531S. The compared results, shown in Figure 4 and Table 1, display that the R-square reached to 0.84 and R reached to 0.92, which indicates a good detection effect. The standard estimation error and variance of R-squared was 4.57 and 0.84, respectively. Furthermore, the variance of significance F is very small. Therefore, the data obtained by this developed device, are highly reliable for the follow-up analysis.
The developed PM2.5 detectors with Arduino technology were installed in the two metropolitan parks to detect the variance of PM2.5 concentration during the experimental period.

4.2. Analysis Results for the Detected Data

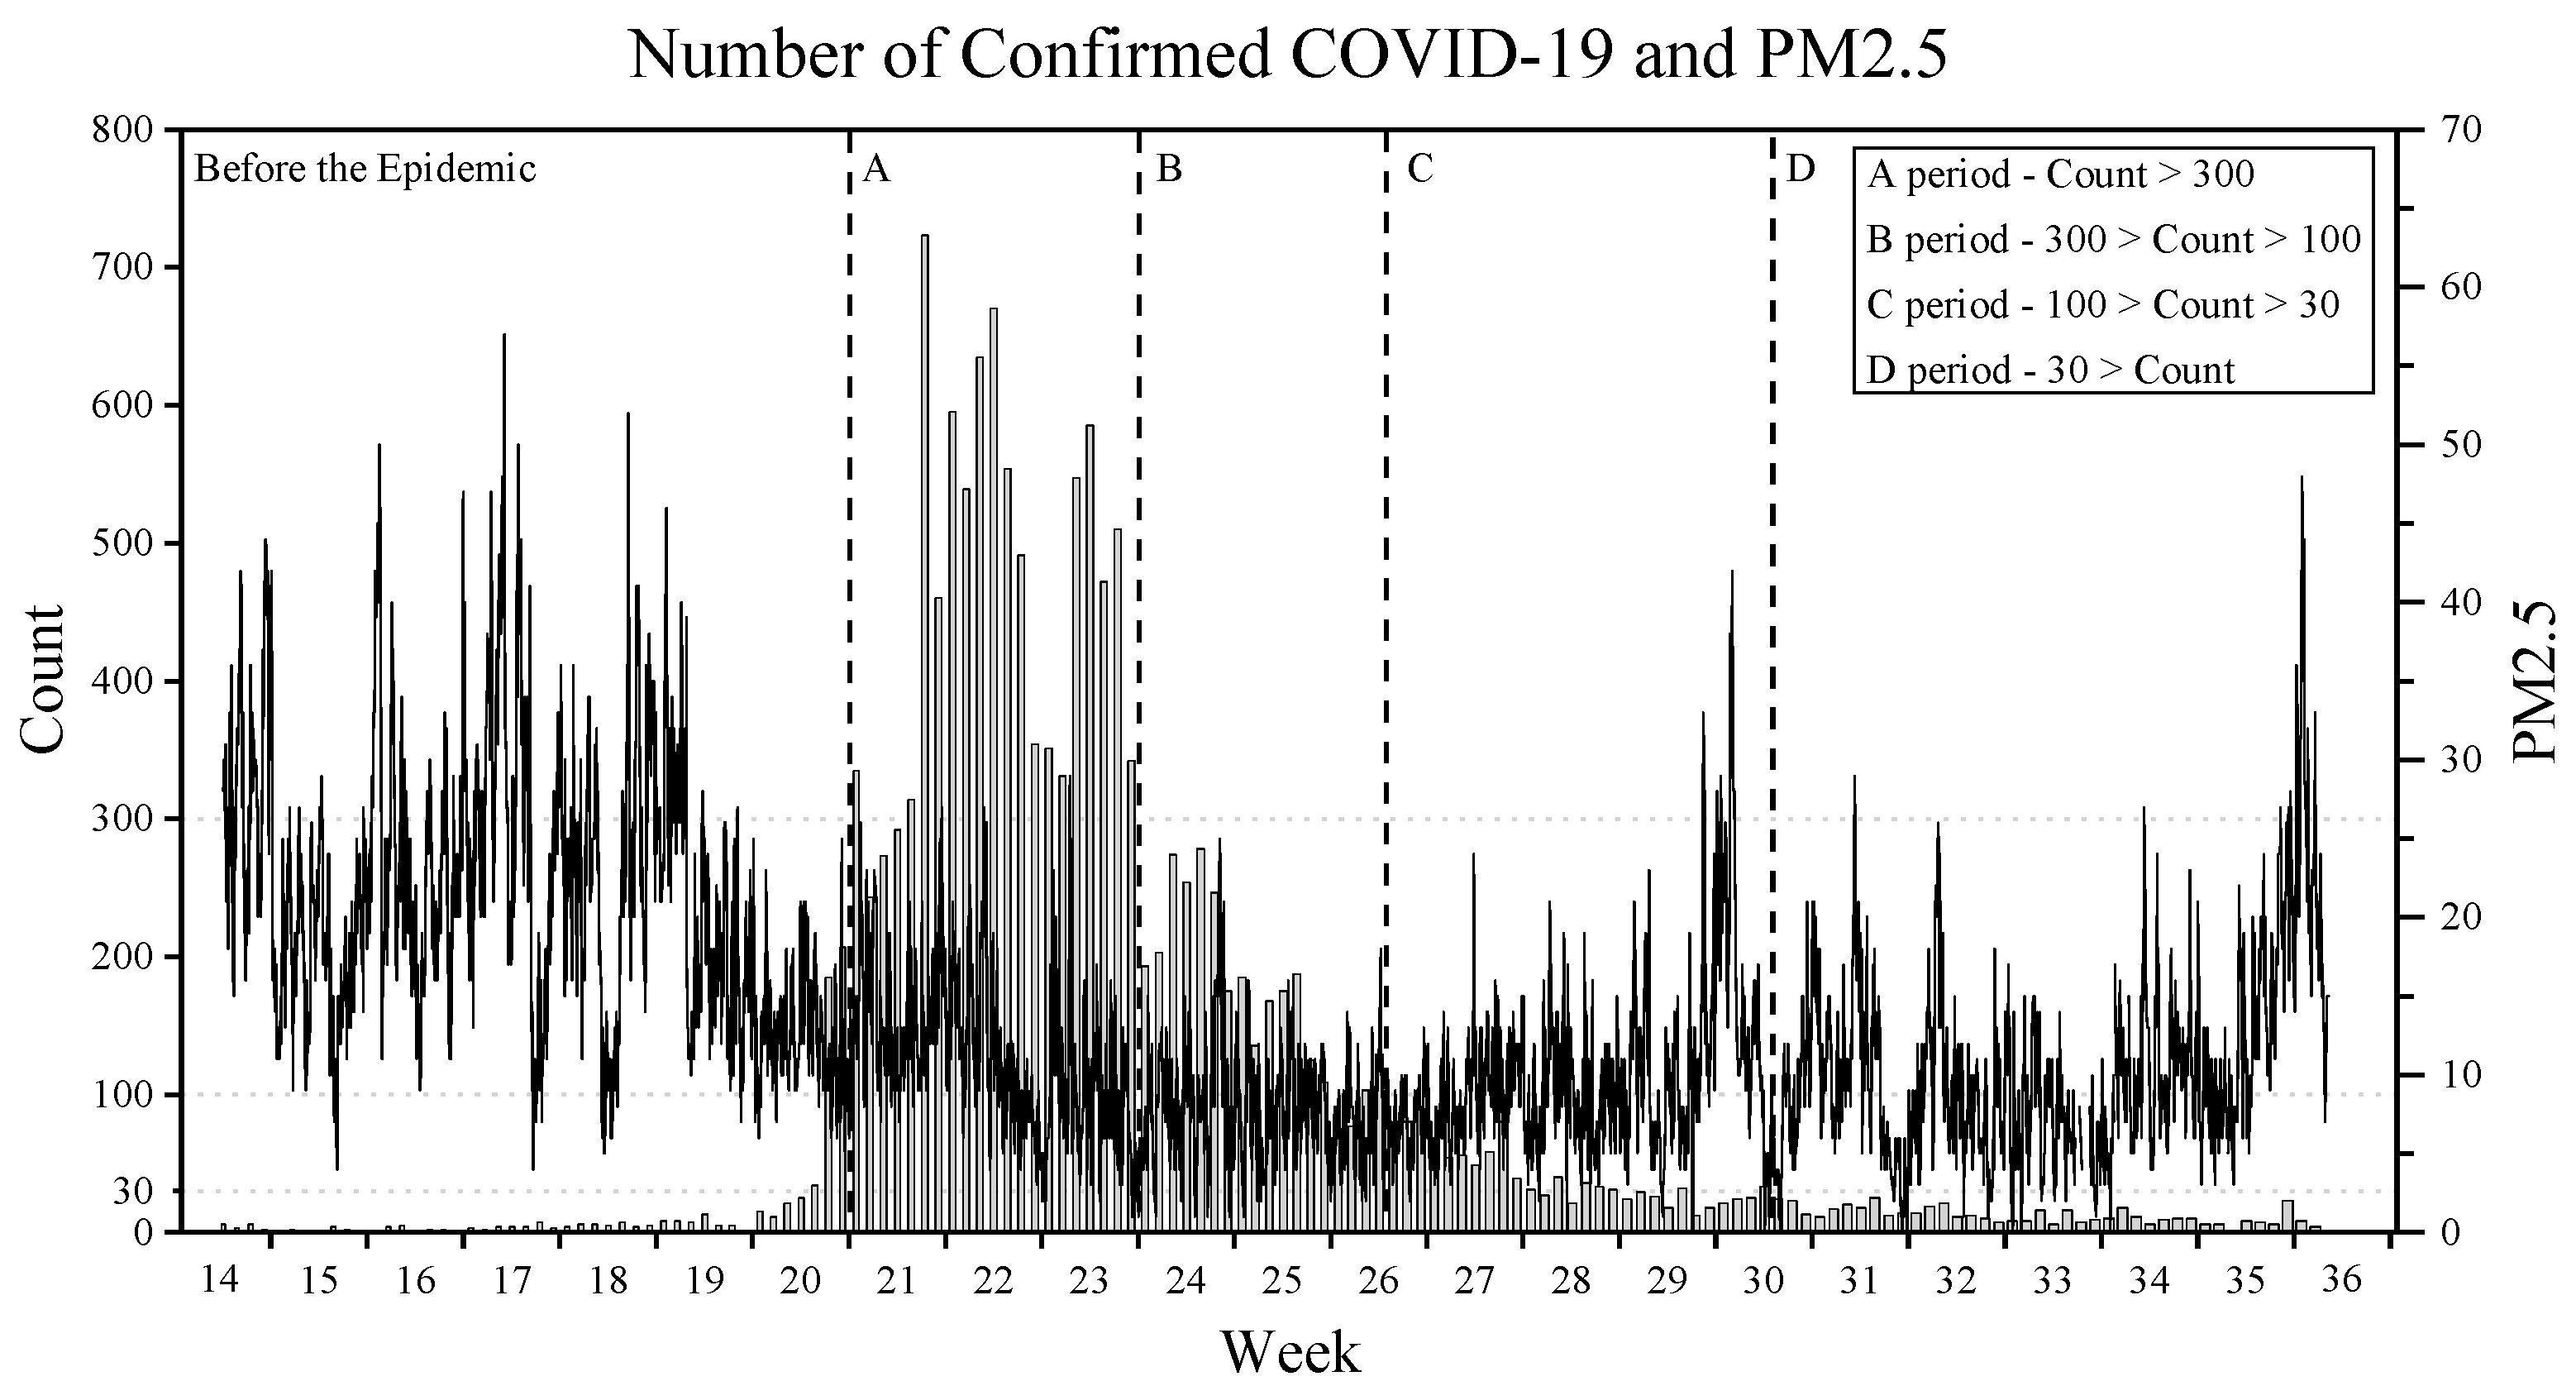
The test period was from April to August 2021, encompassing the time before the epidemic outbreak to the date of the epidemic gradually stabilized. This test period was divided into pre-epidemic outbreaks according to the changes in the epidemic, with the number of people diagnosed each day being more than 300 people defined as the plateau period (number A), more than 100 people to 300 people defined as the plain period (number B), more than 30 people to 100 people defined as the decline period (number C), and less than 30 people defined as the stabilization period (number D). The daily confirmed cases data came from the Taiwan Central Epidemic Command Center [28].

4.2.1. Meteorological Data

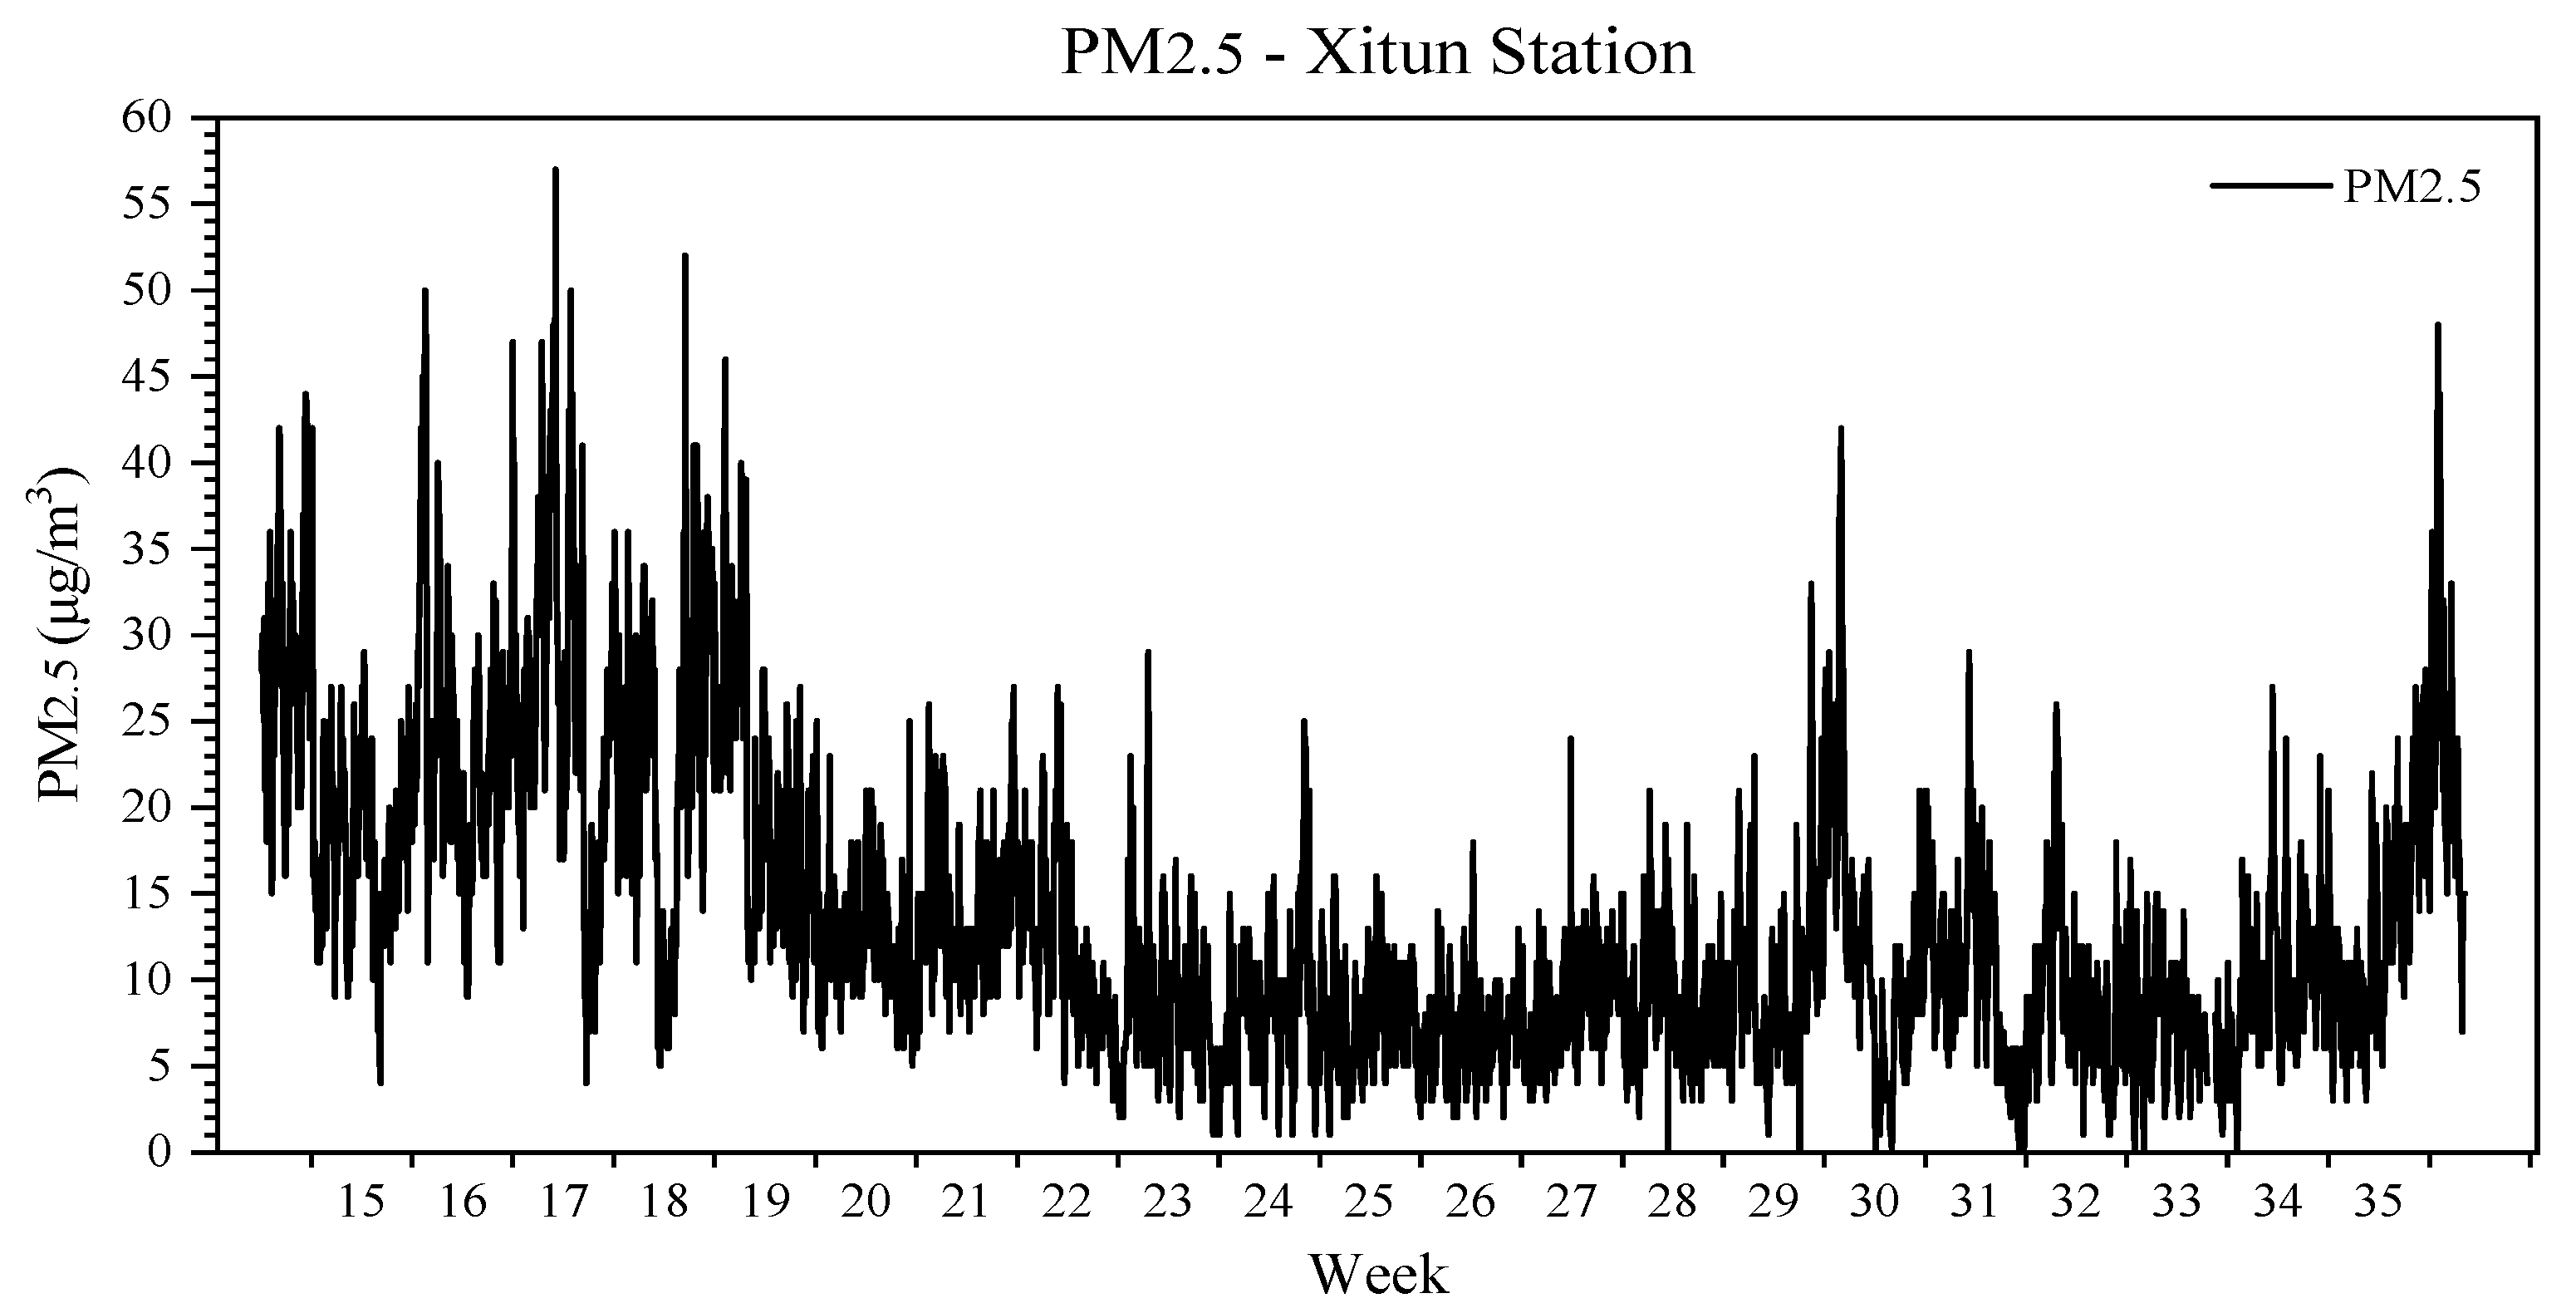
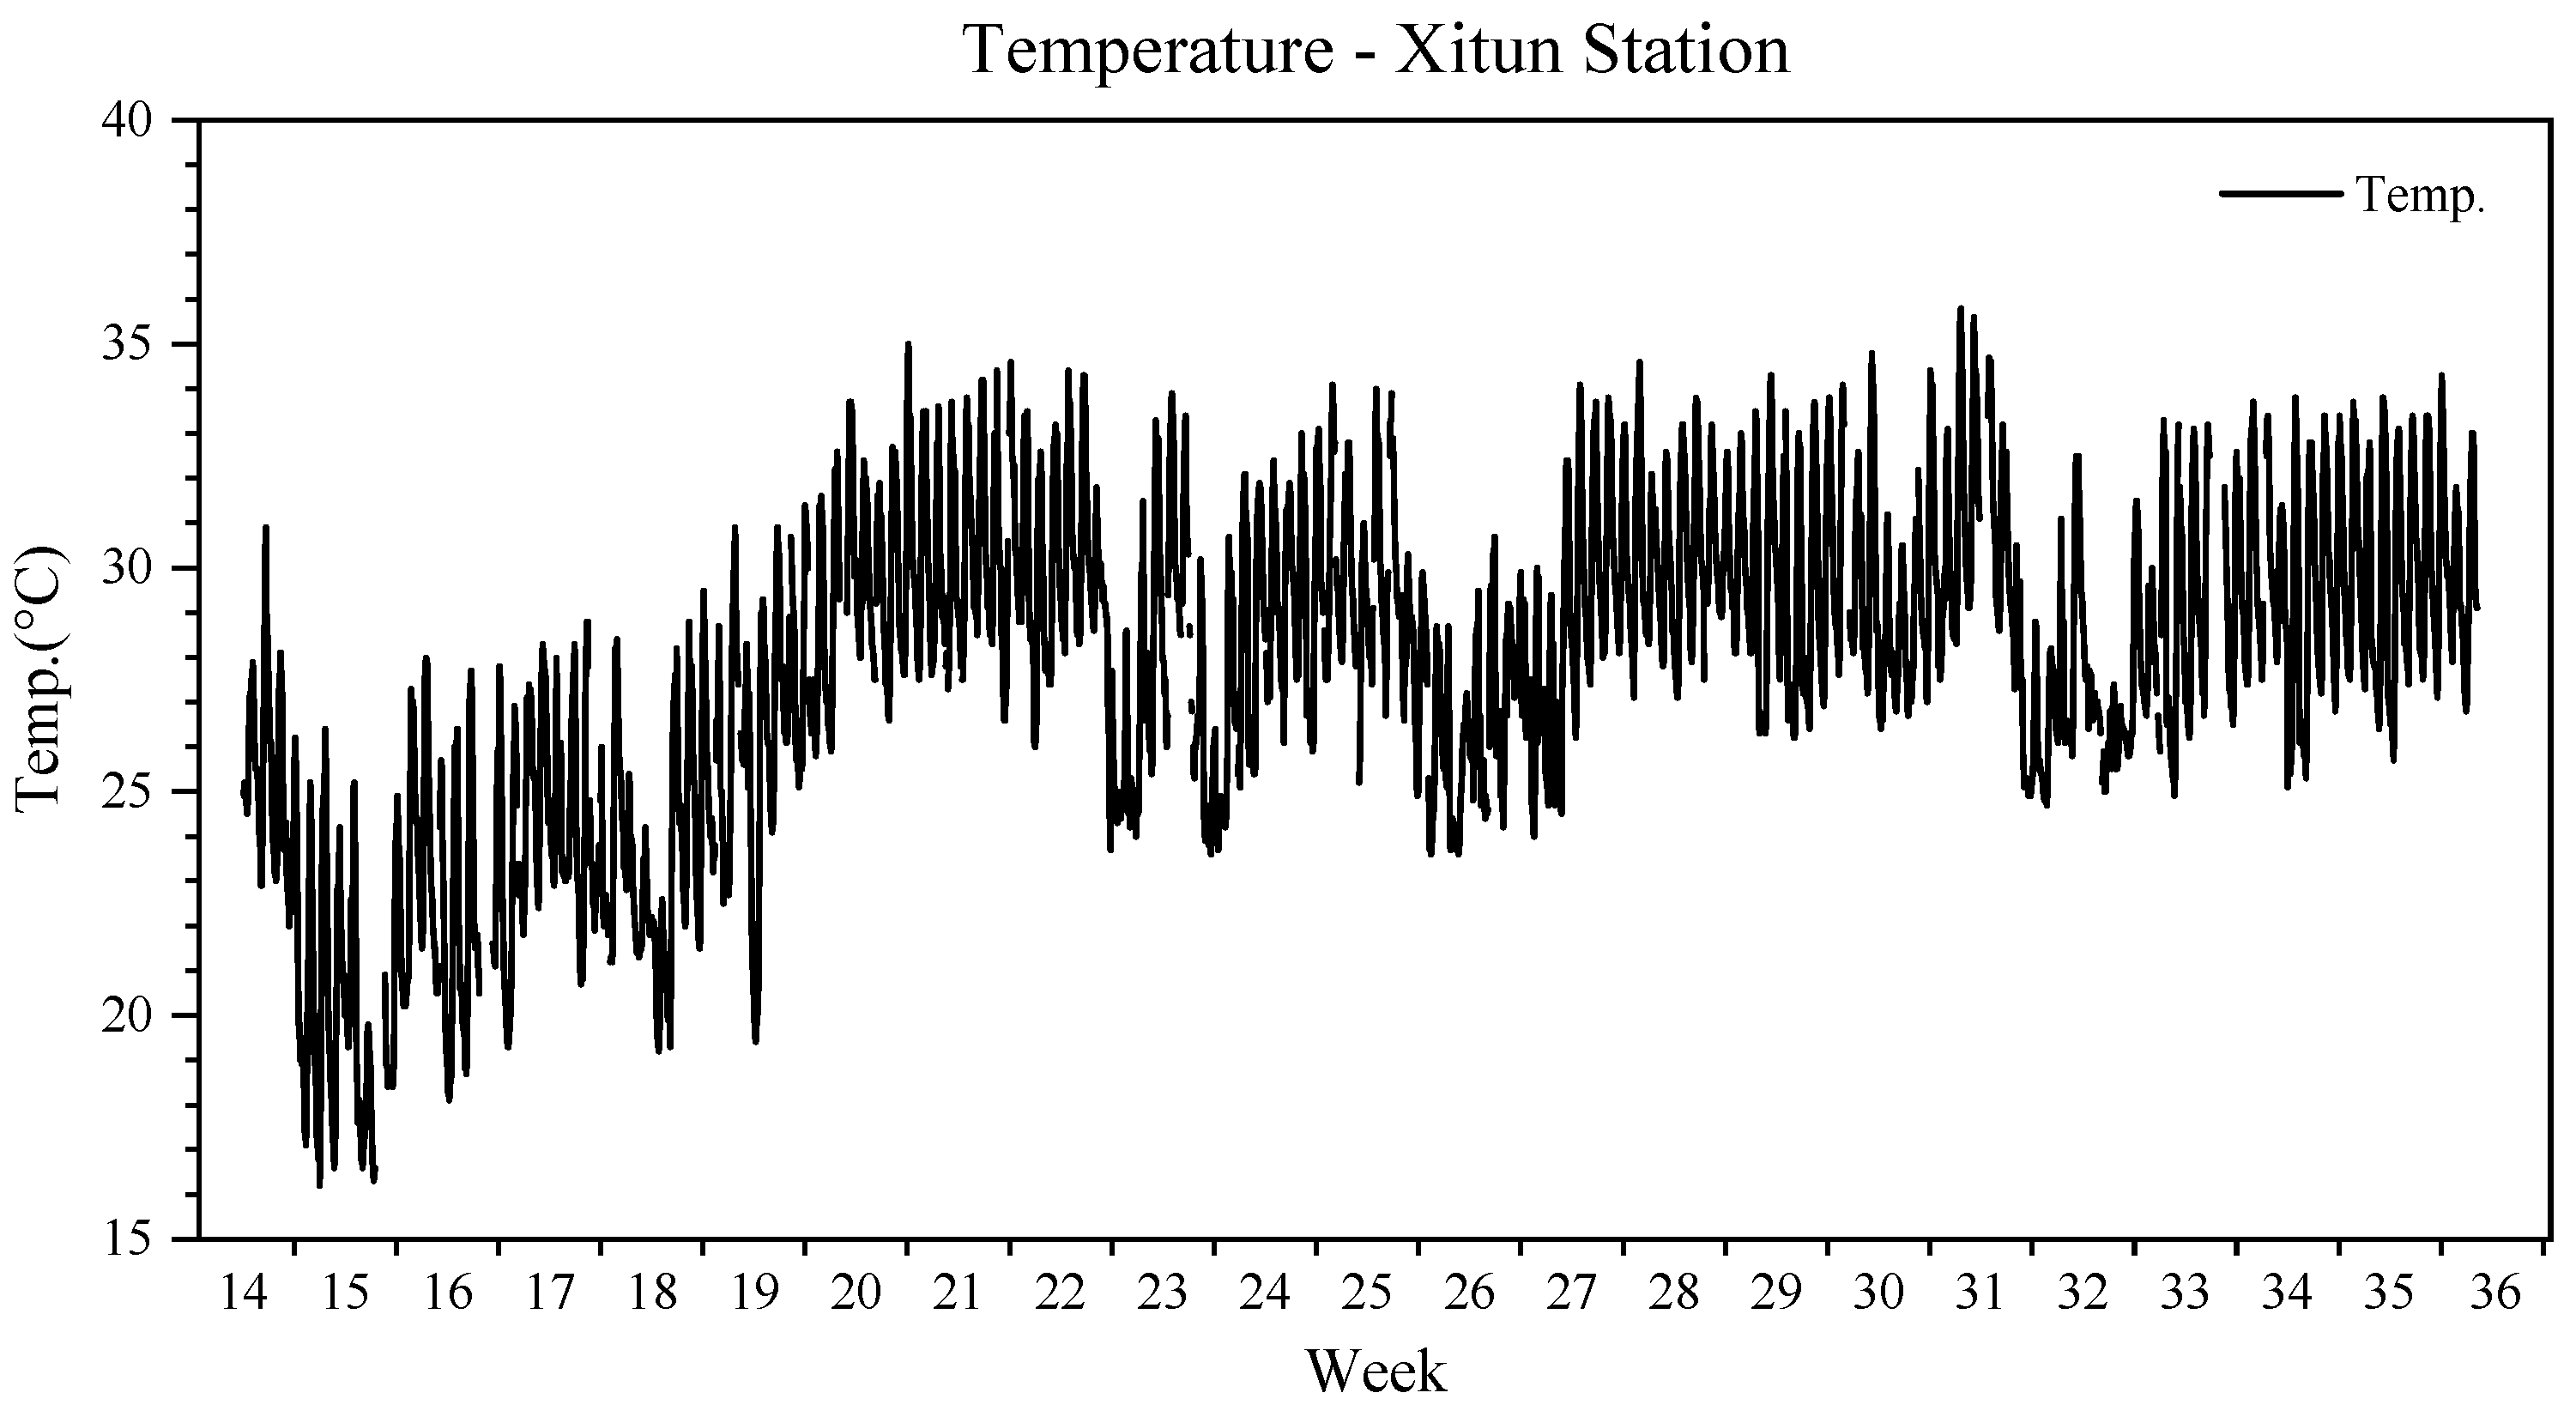
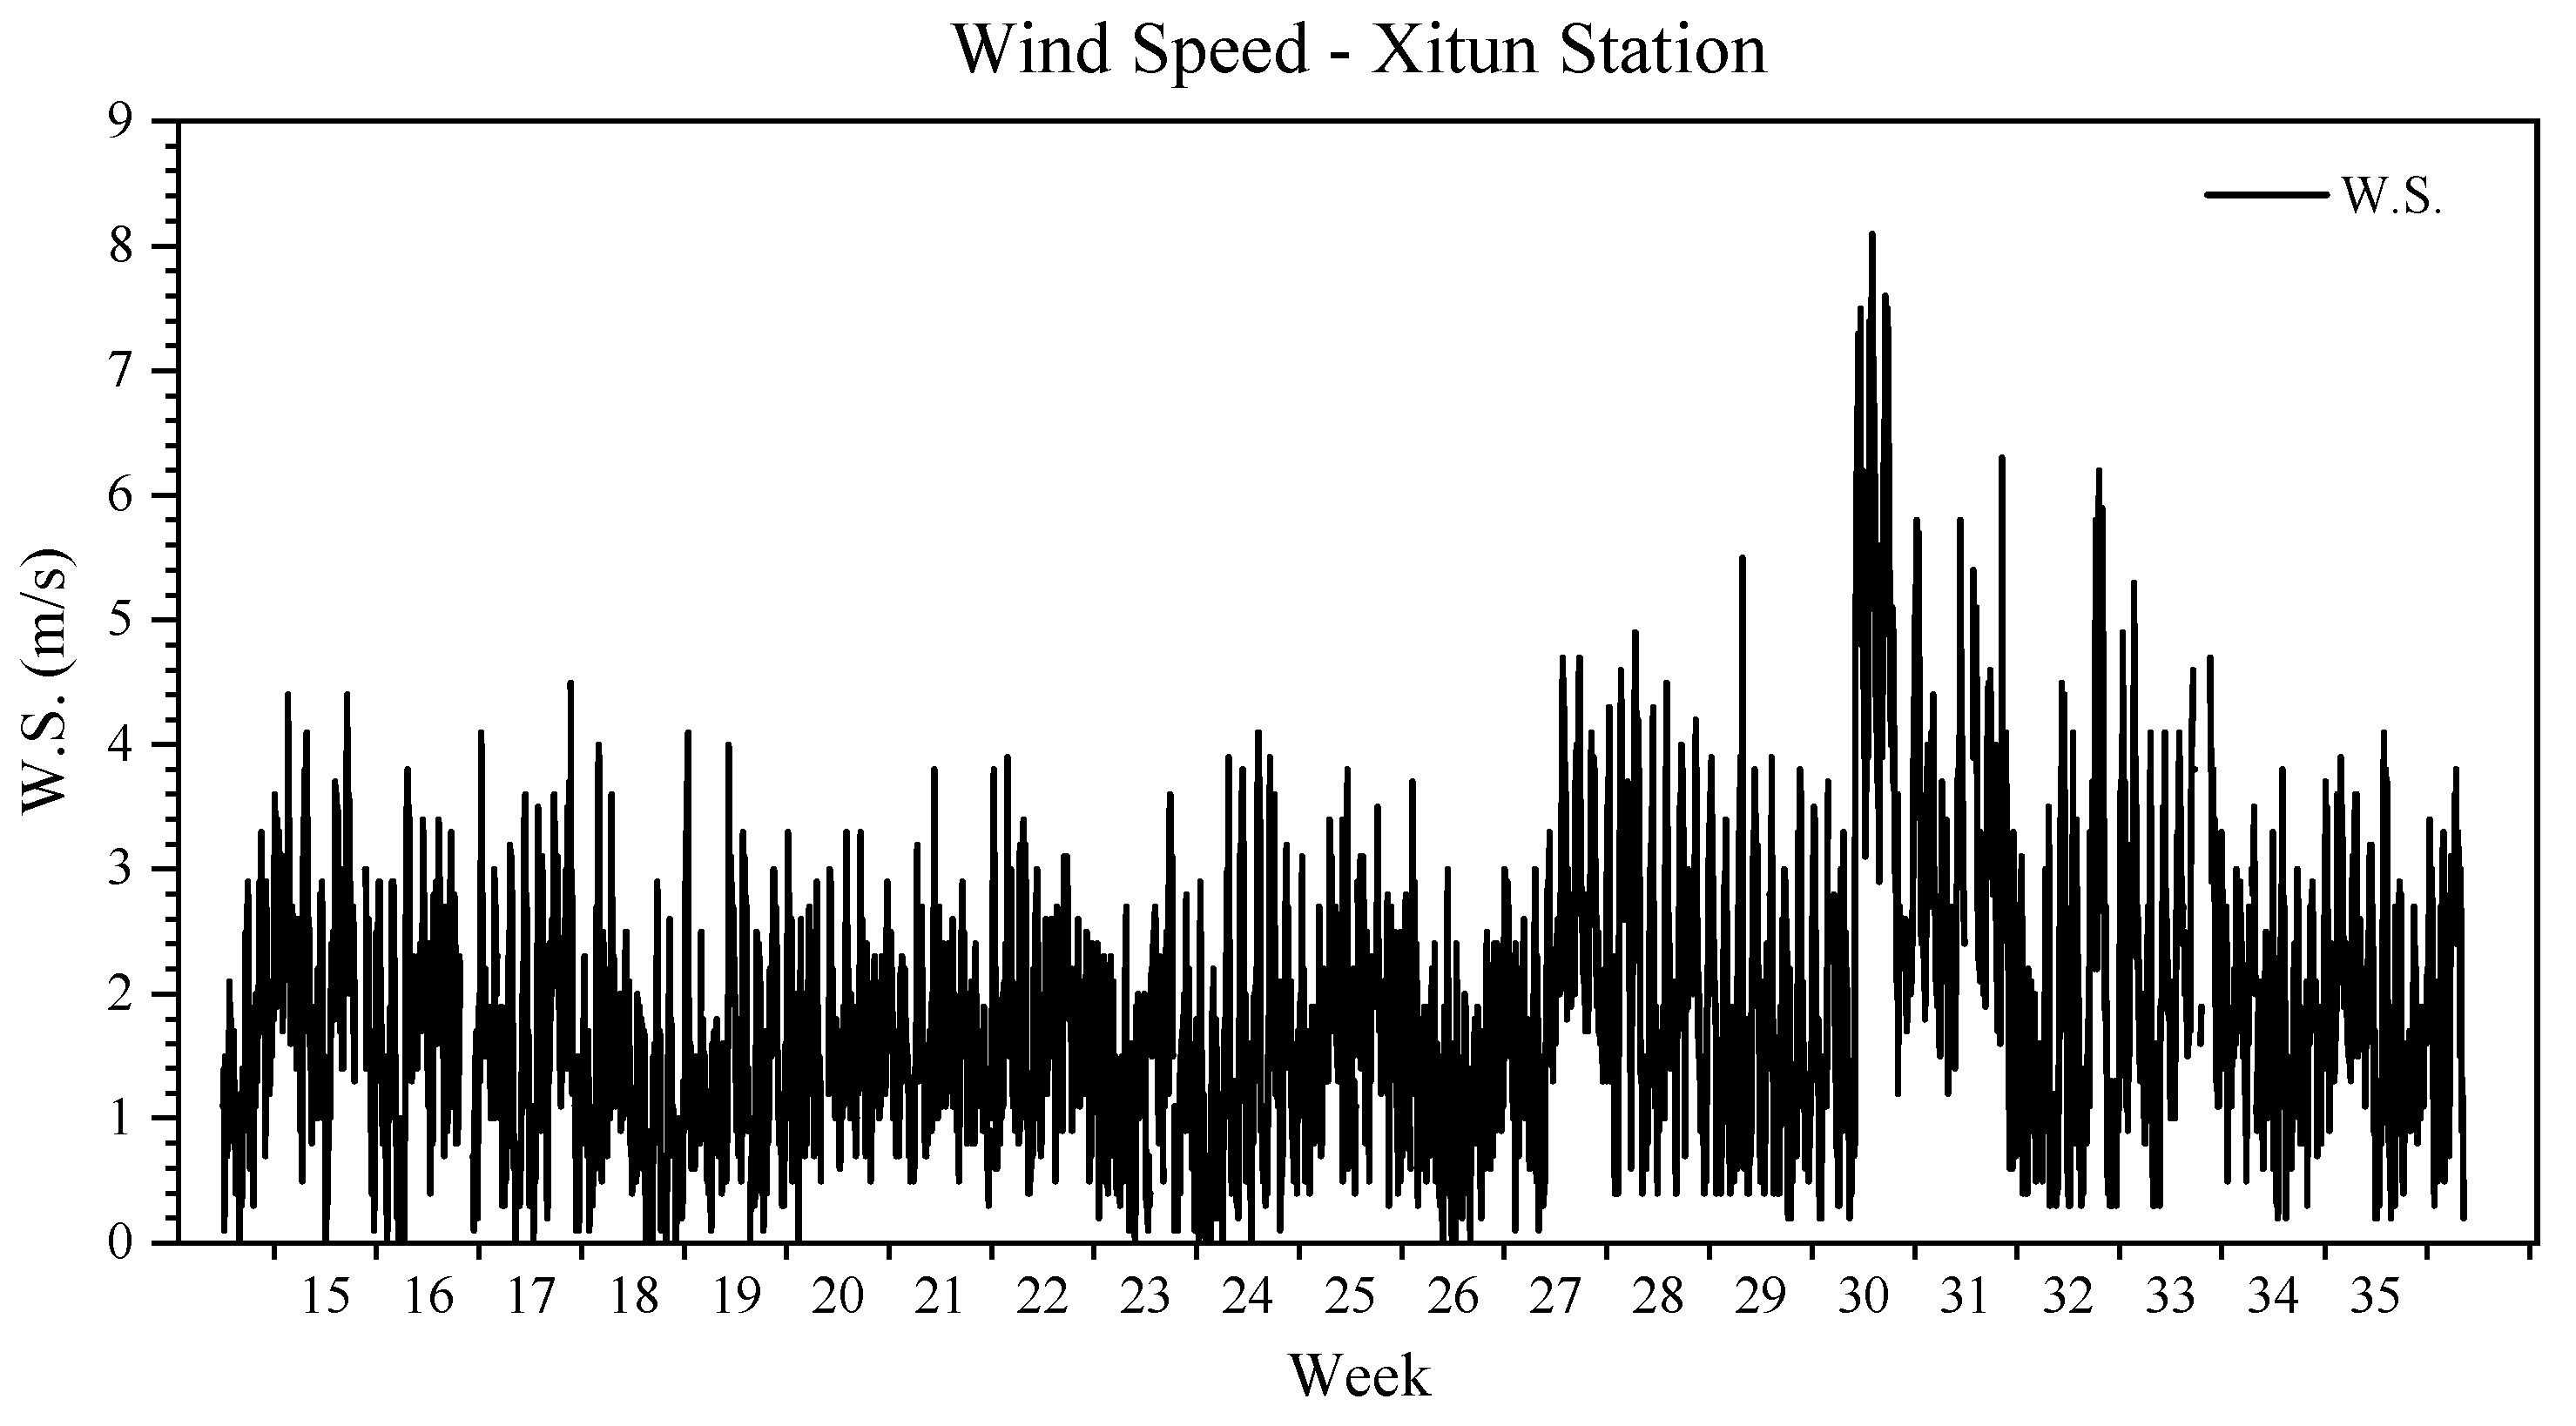
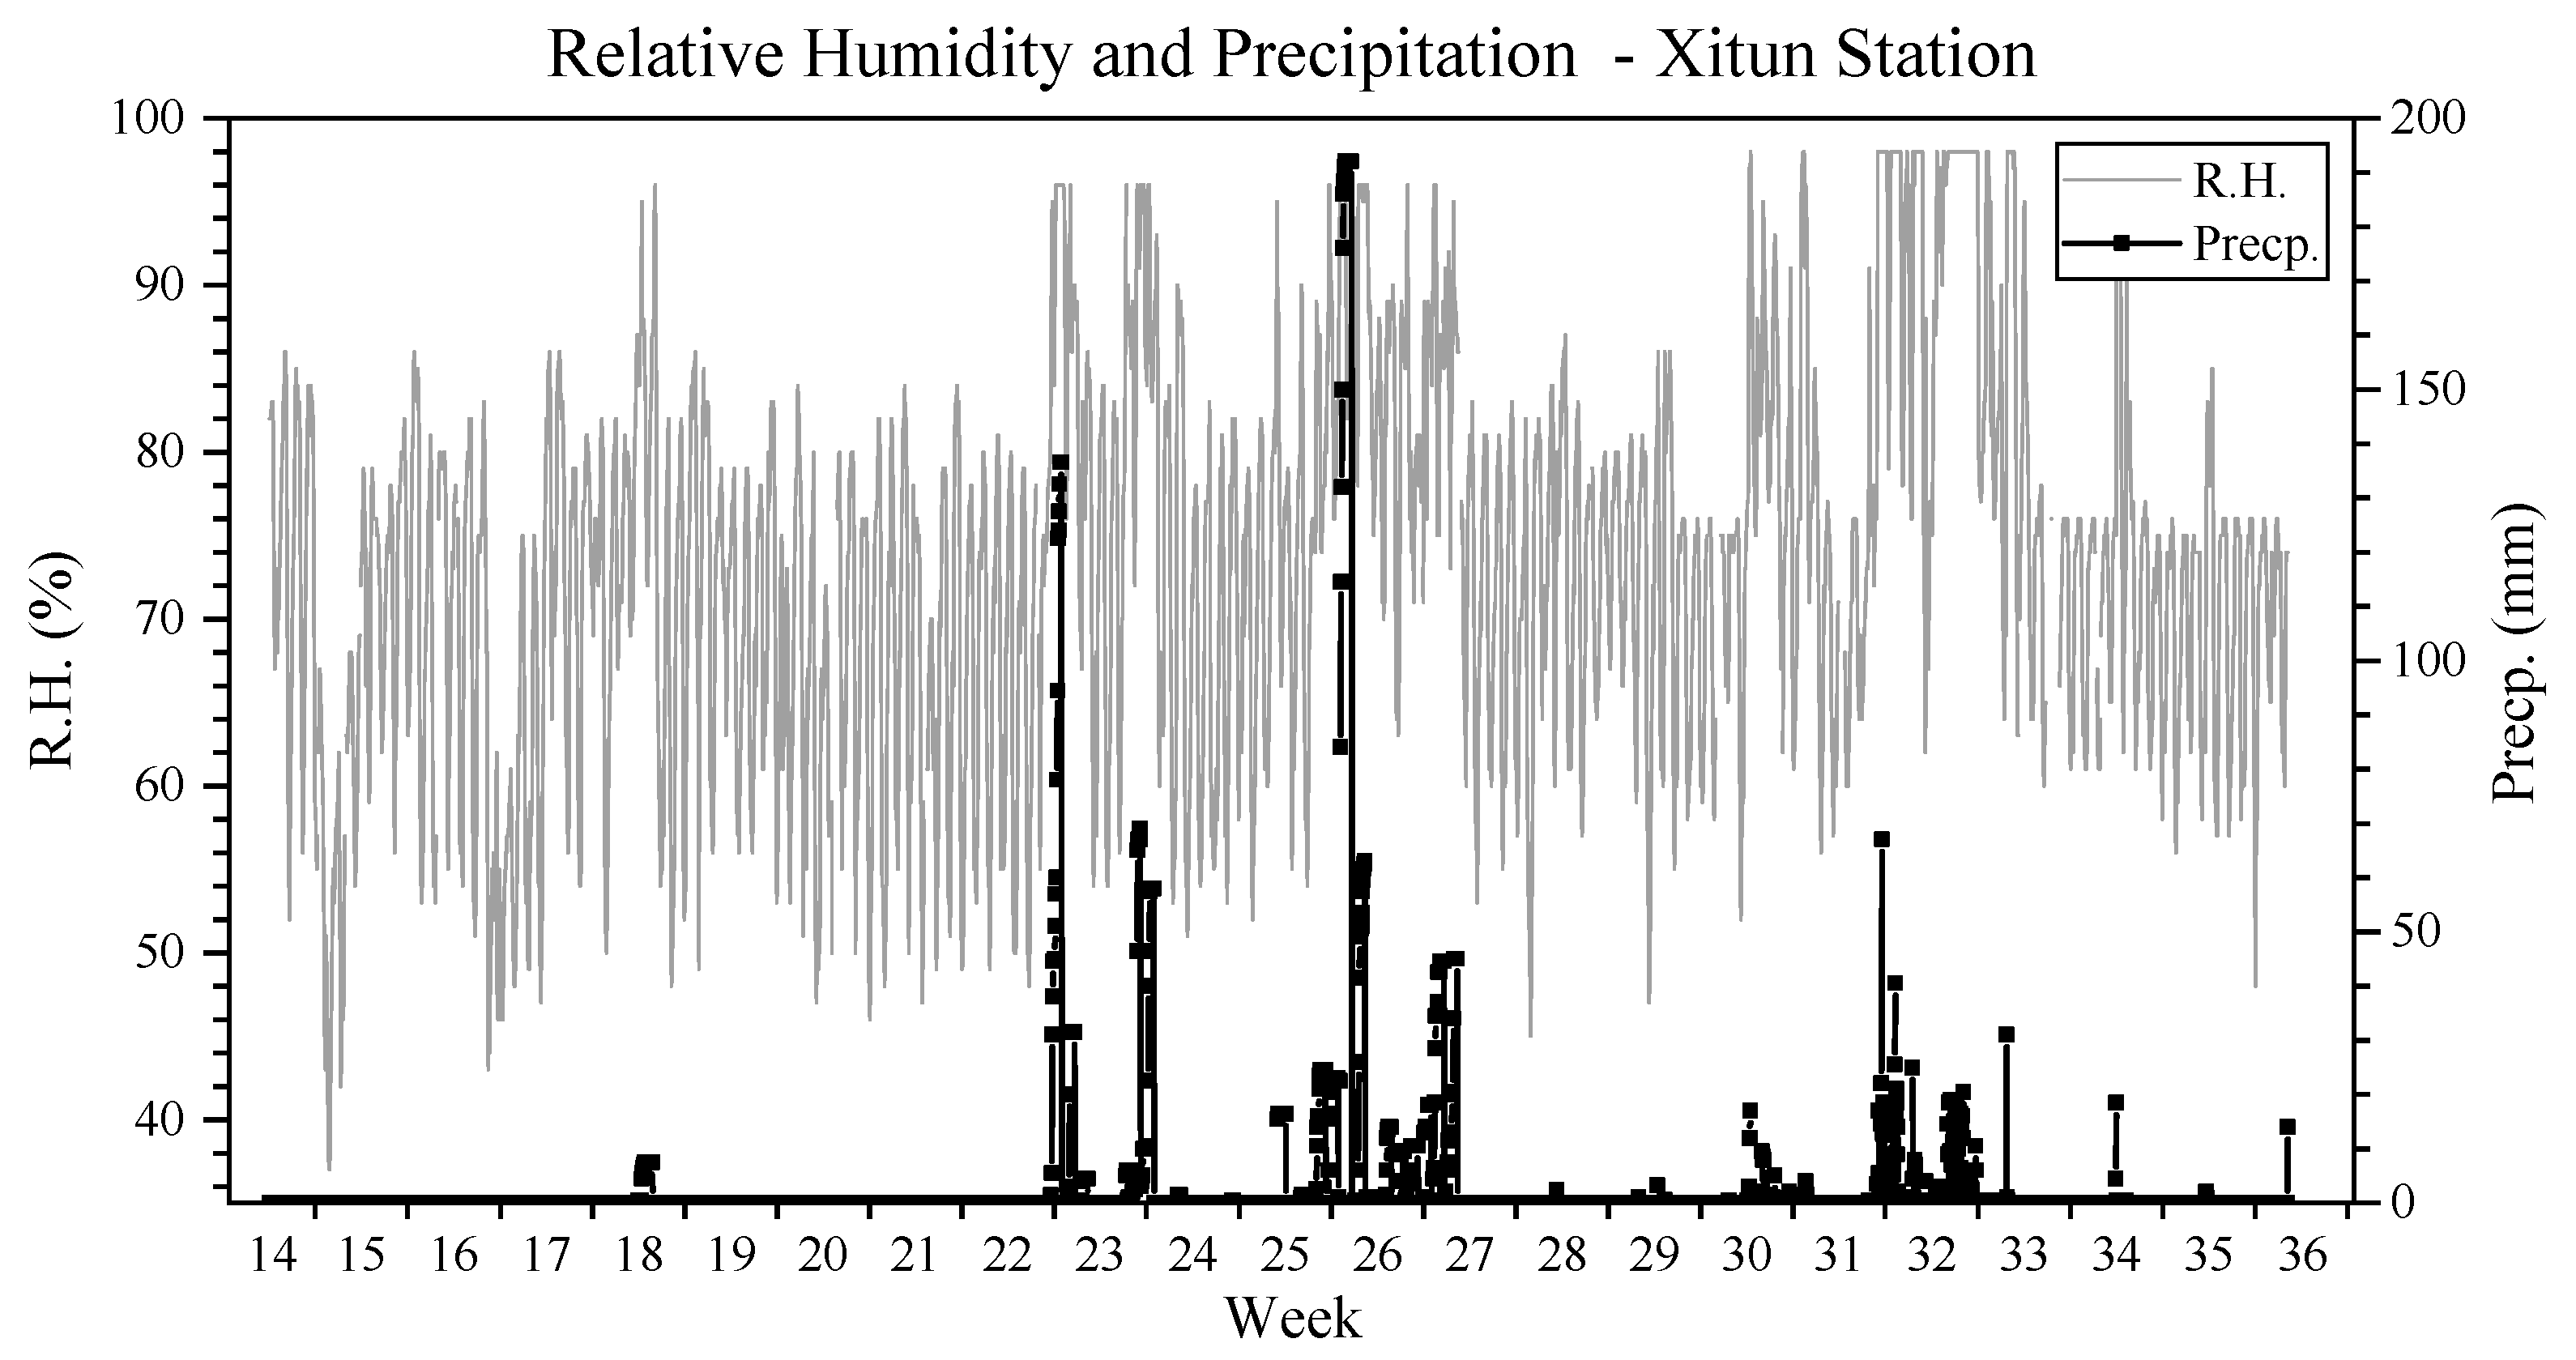
The PM2.5 concentrations at the Xitun Station in Taichung City of the Central Meteorological Administration were used as the baseline during the detection period. The changes of PM2.5 concentration, inspected at this station during the test phase, are shown in Figure 5. Since PM2.5 concentration is susceptible to weather factors, the basic climate data of the experimental stage, shown in Figure 6, Figure 7 and Figure 8, are temperature changes, east-west wind speed, relative humidity, and rainfall. This study only listed the east-west wind speed change figures in this test area because the PM2.5 concentration in this region is susceptible to easterly winds. Furthermore, rainfall has some improvement benefits for PM2.5 concentration [26,27]. Thus, the change of PM2.5 concentration affected by rainfall were not used as the basis for subsequent analyses of health impacts. The other data of PM2.5 concentration change per day were recorded exactly to analyze the correlation between the change of PM2.5 concentration and SDNN and LF/HF.

4.2.2. Relationship between Changes in Epidemic Outbreaks and PM2.5 Concentrations Variation

The correlation between changes in epidemic outbreaks and PM2.5 concentration variation is shown in Figure 9. The left y axis in the figure was the number of diagnoses, and the right y axis was PM2.5 concentration (units: μg/m3). From the relationship between the number of diagnoses and the PM2.5 concentration, it can be seen that the air quality of PM2.5 concentration was high before the epidemic outbreaks with high variation. With the increase of the number of diagnoses, the air quality of PM2.5 concentration gradually decreased, and, in the plateau period and plain period, showed a downward trend. However, with the gradual decline in the number of diagnoses, as the epidemic entered a period of decline and stabilization, the PM2.5 concentration and the variance gradually increased. This figure displayed that the PM2.5 concentration varied with the epidemic outbreak changes.

4.3. Statistical Analysis, Results, and Discussion

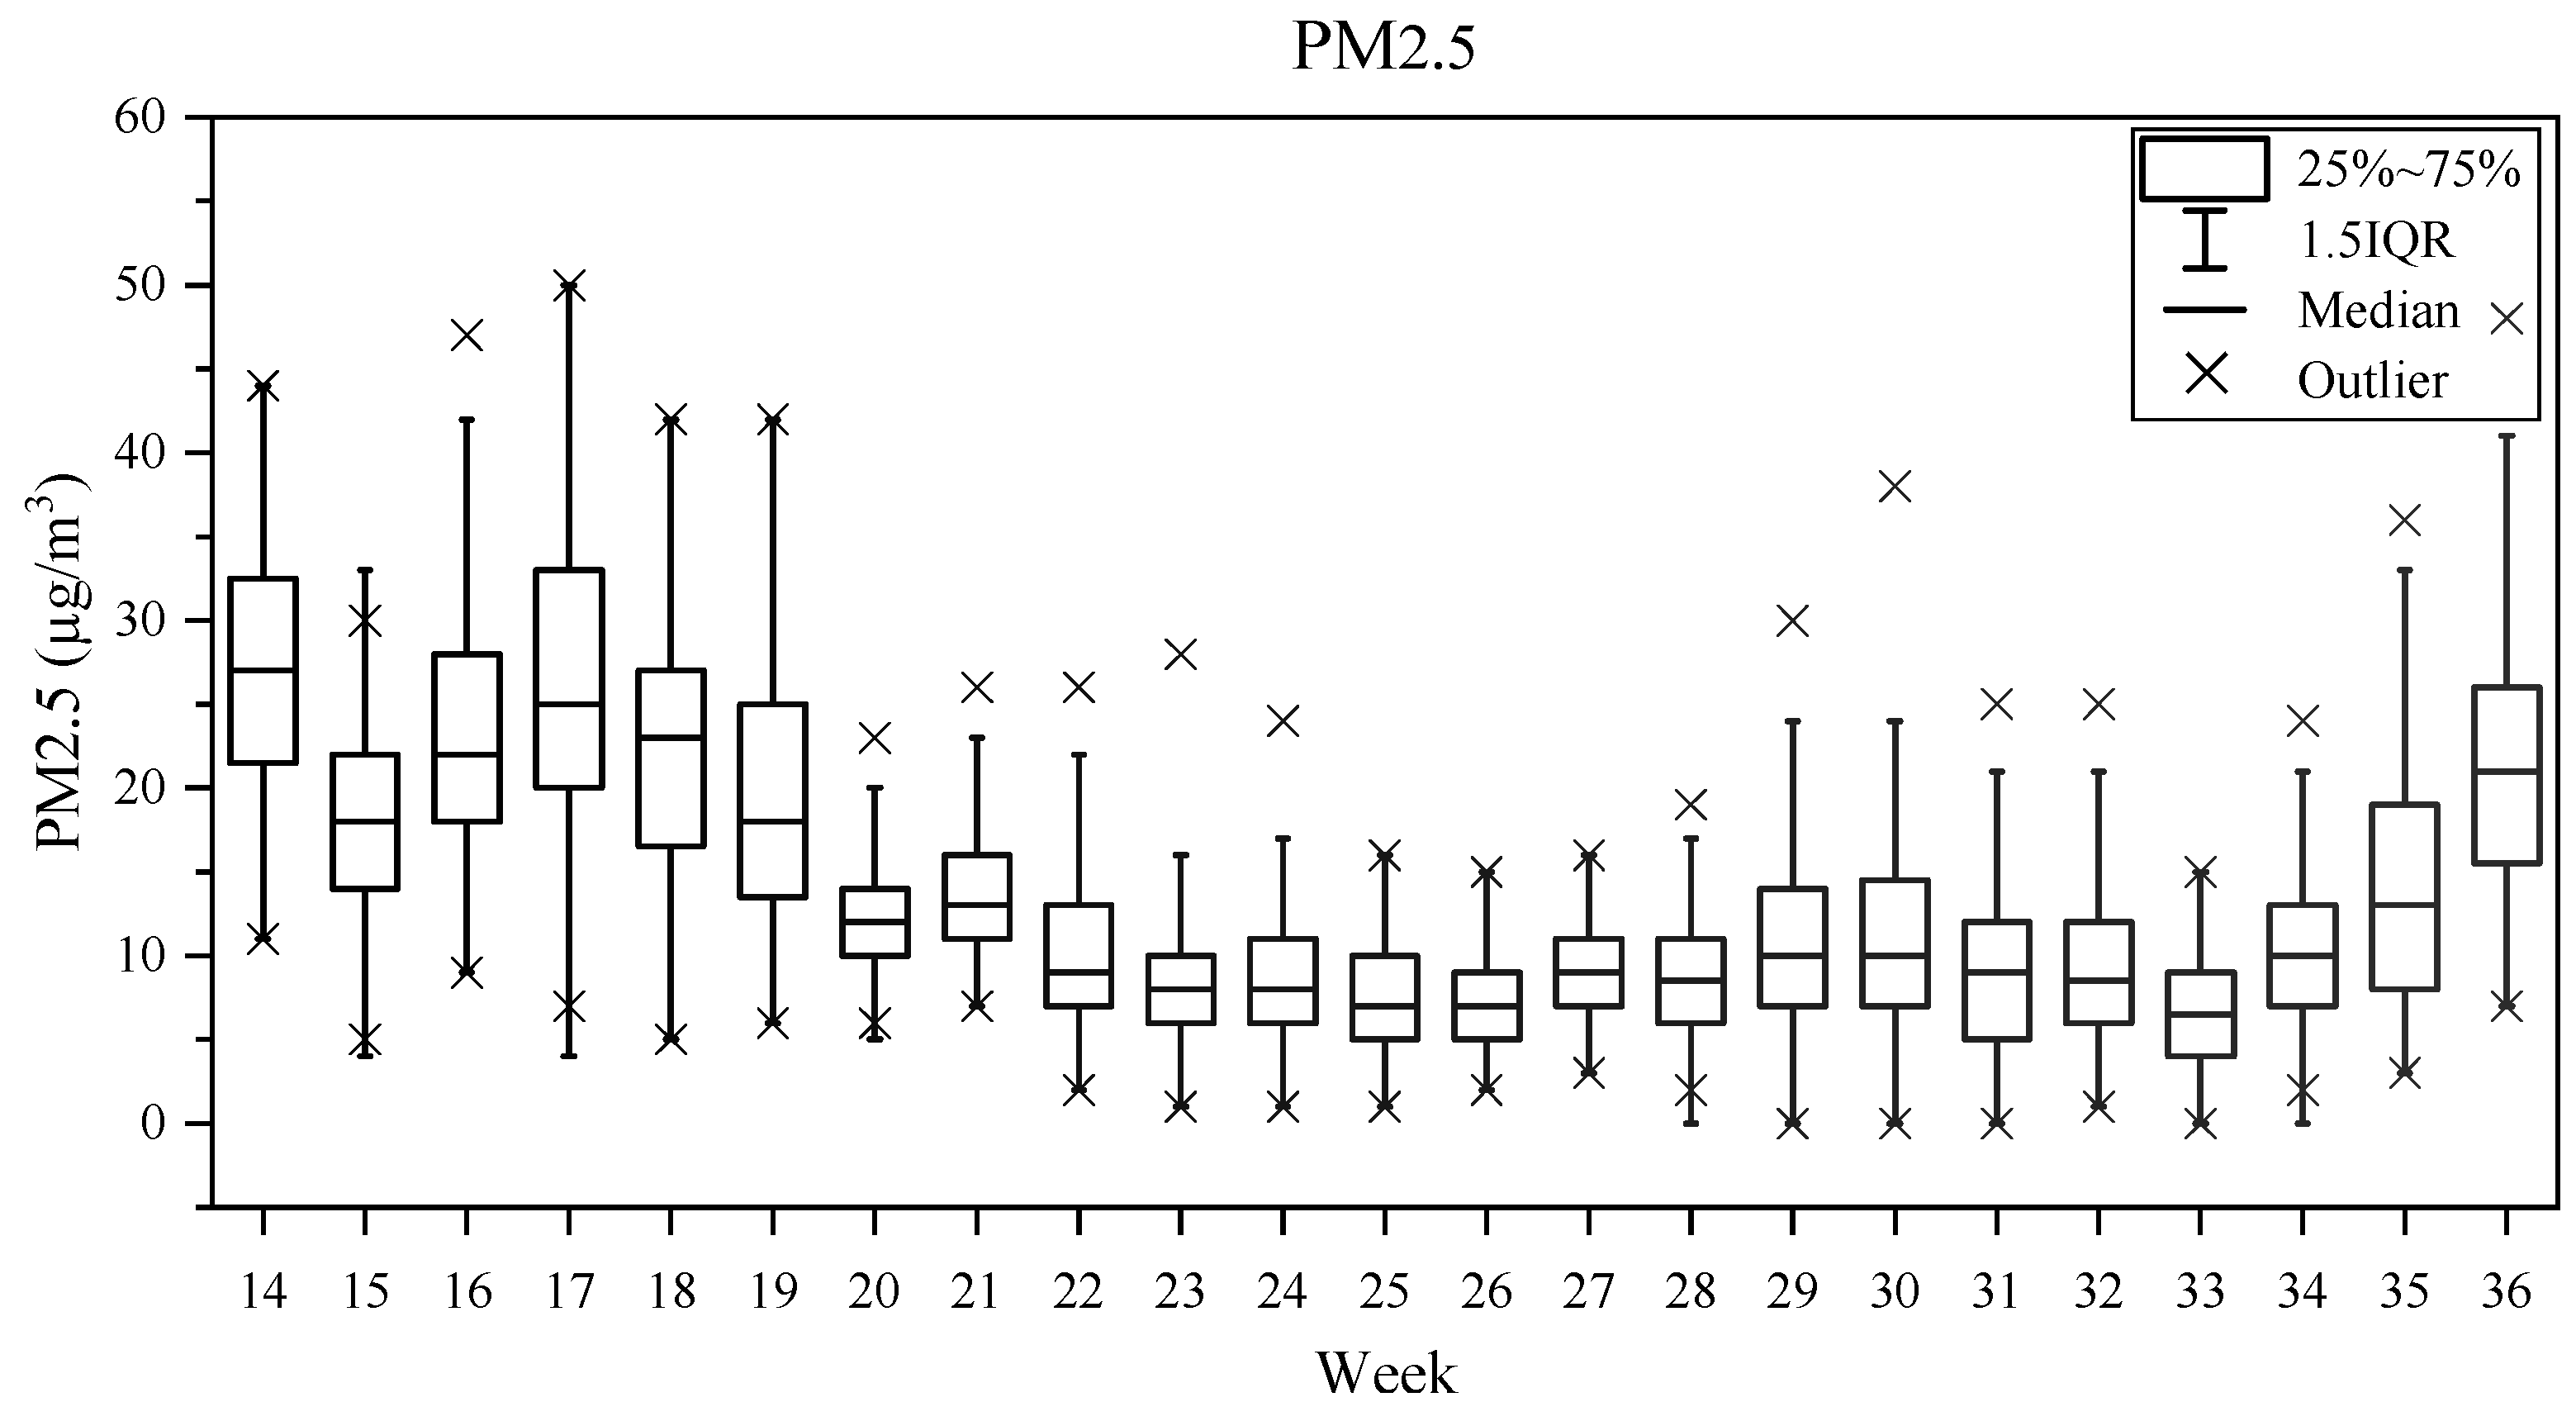
The value of PM2.5 concentration varies greatly and is affected by many uncertain factors. Therefore, according to the requirements of statistical analysis for sampling allocation, these detected data of PM2.5 concentration looked for the expected value and variation of the median statistic within the population. These detected data were discussed according to the sufficient, unbiased, efficiency, and consistency statistic of point estimates. The box and whisker plot, which was available based on the relevant data obtained, is shown in Figure 10. Figure 10 shows that the variation of PM2.5 concentration before the epidemic outbreak (before week 19) was known to be significant and was mainly related to human activities. However, as the epidemic outbreak increased during the plateau (week 20–week 23), the change in PM2.5 concentration decreased gradually. In particular, when the epidemic period entered into the plains stage (week 24–week 26), people were used to staying at home, so the PM2.5 change was gradually narrowing. However, as the epidemic outbreak slowed down (week 26–week 30), the daily number of people diagnosed with new coronary pneumonia was maintained at 80–100 people/day at the beginning of this period, and the PM2.5 concentration was still low with little variation. This trend may be the result of the epidemic being on a three-level alert, so residents had low levels of outdoor activity. However, with the number of diagnoses decreasing, and the number of people diagnosed with new coronary pneumonia being down to below 30 cases per day in week 30, the outbreak was expected to be reduced to the second-level alert. Residents started to get back to outdoor activities gradually, and the PM2.5 concentrations started to rise and the variations in PM2.5 increased.

4.3.1. The Relationship between Different Epidemic Outbreak Periods and PM2.5 Concentration Changes

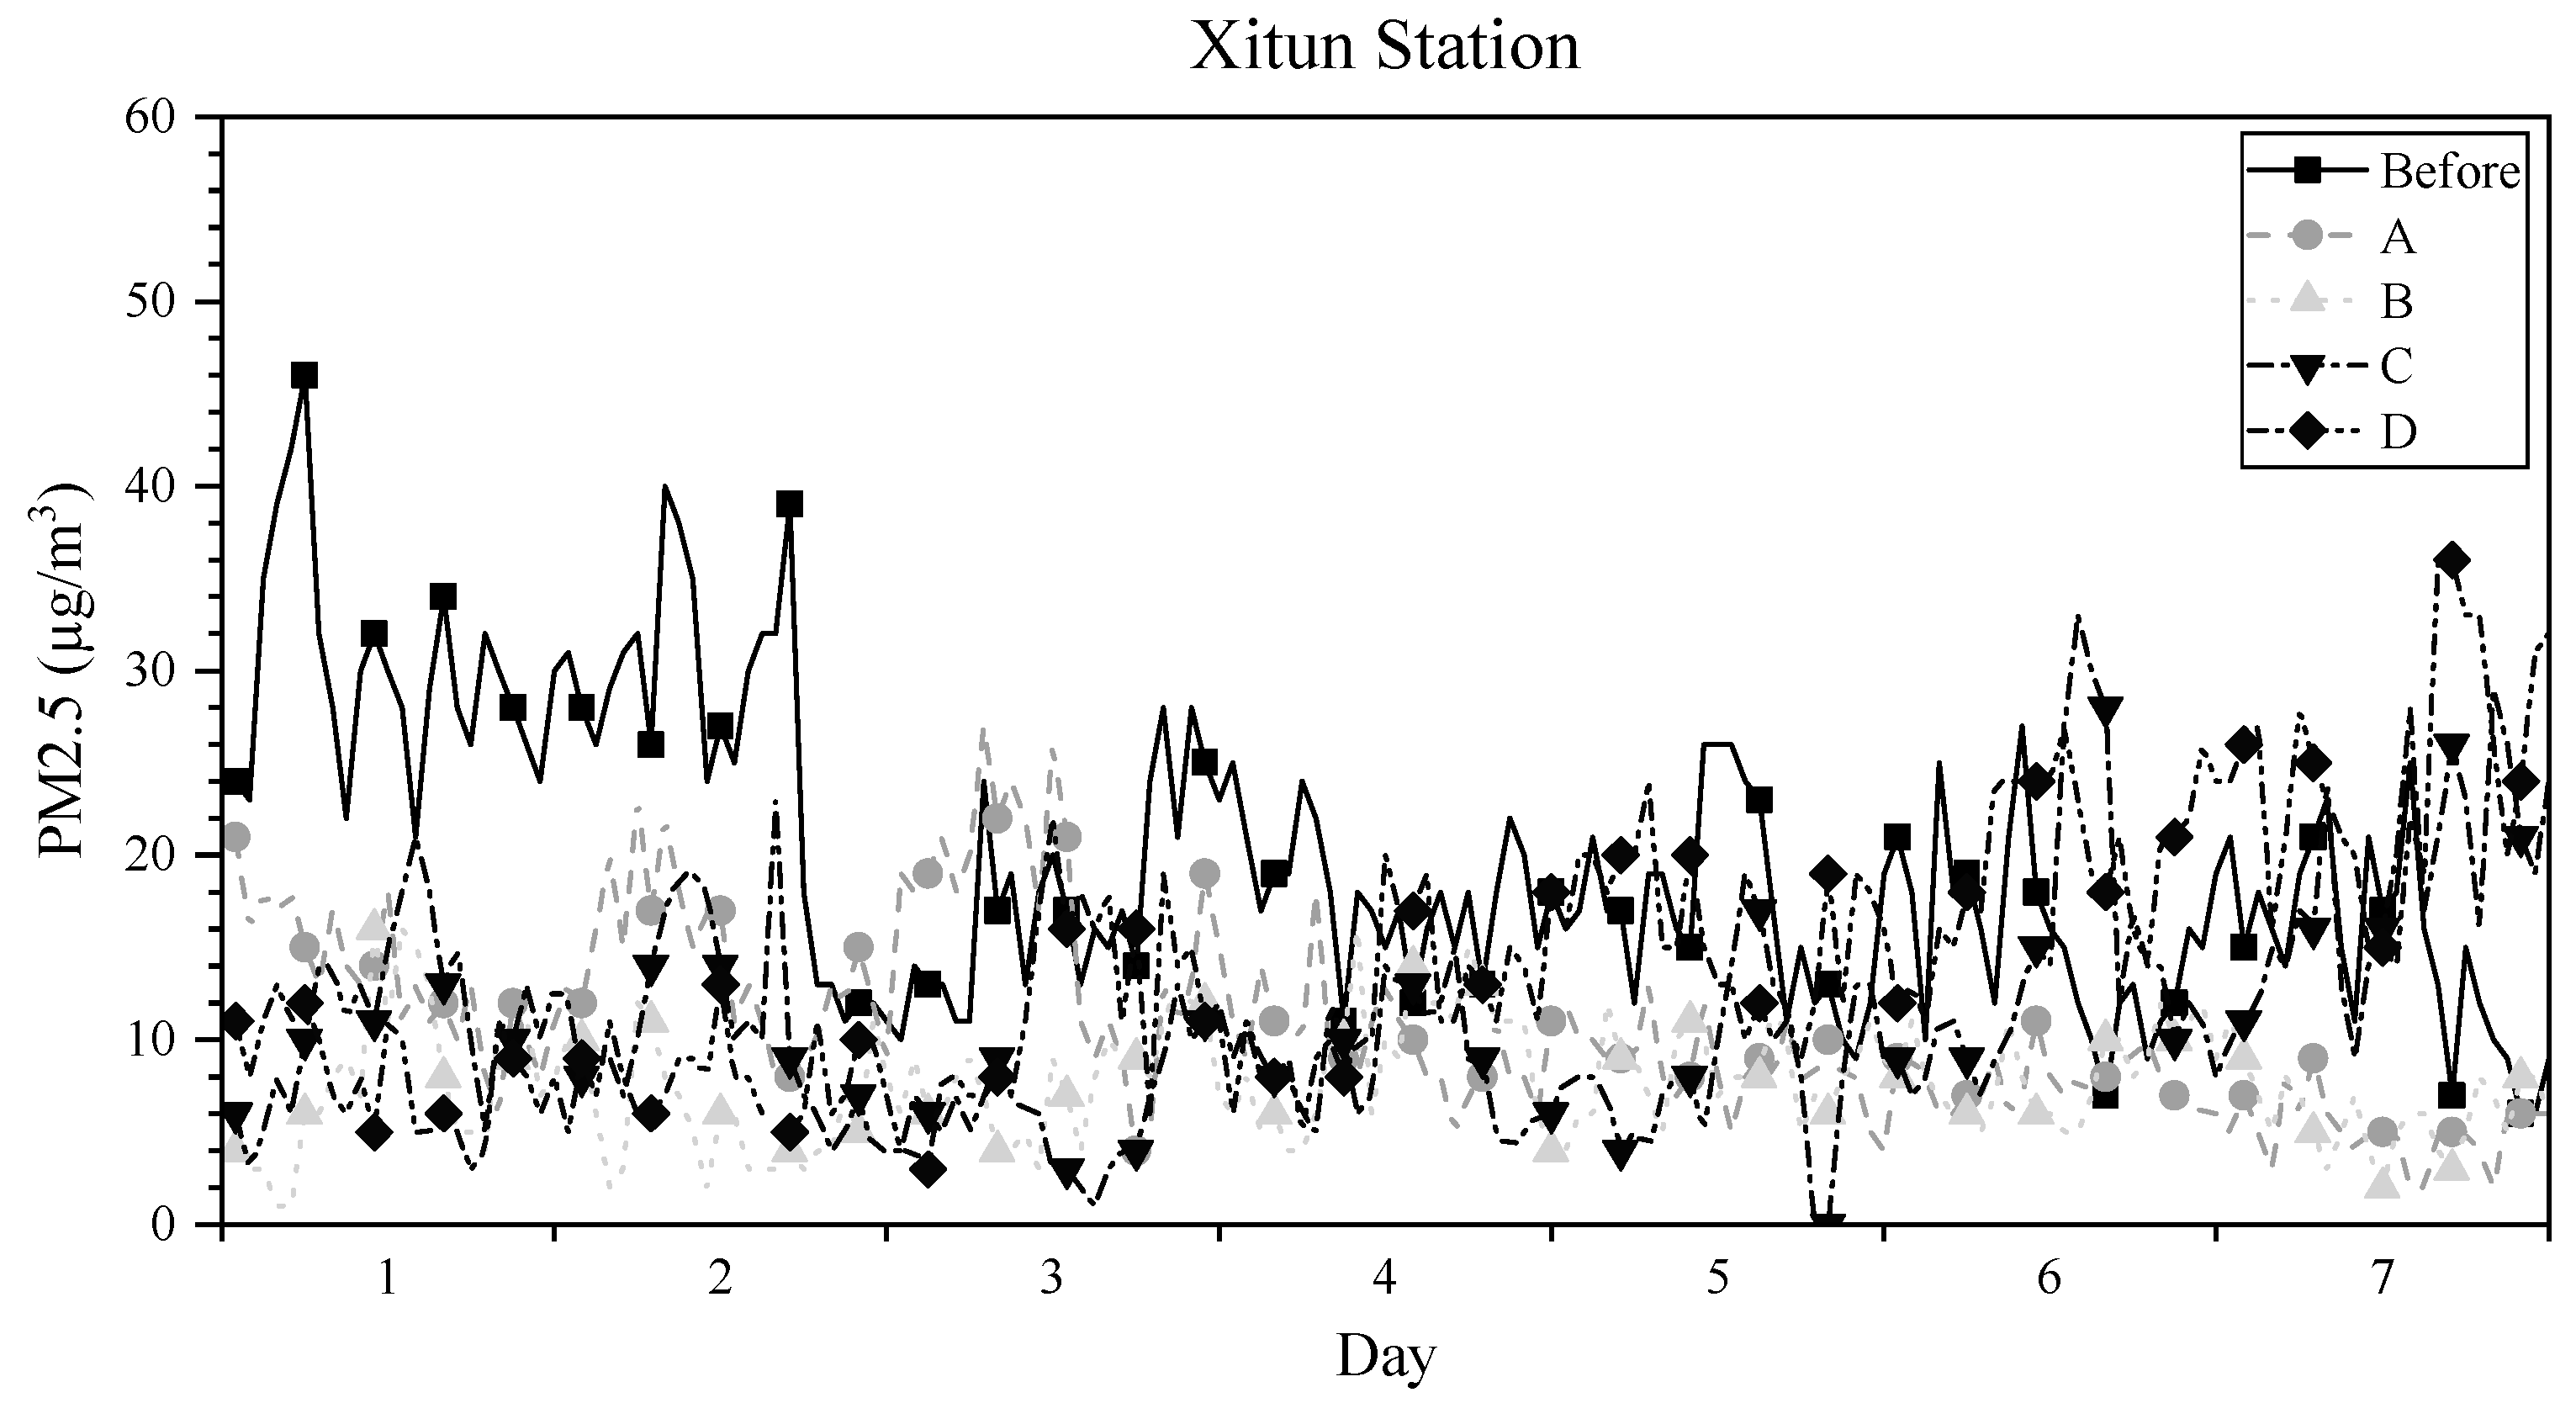
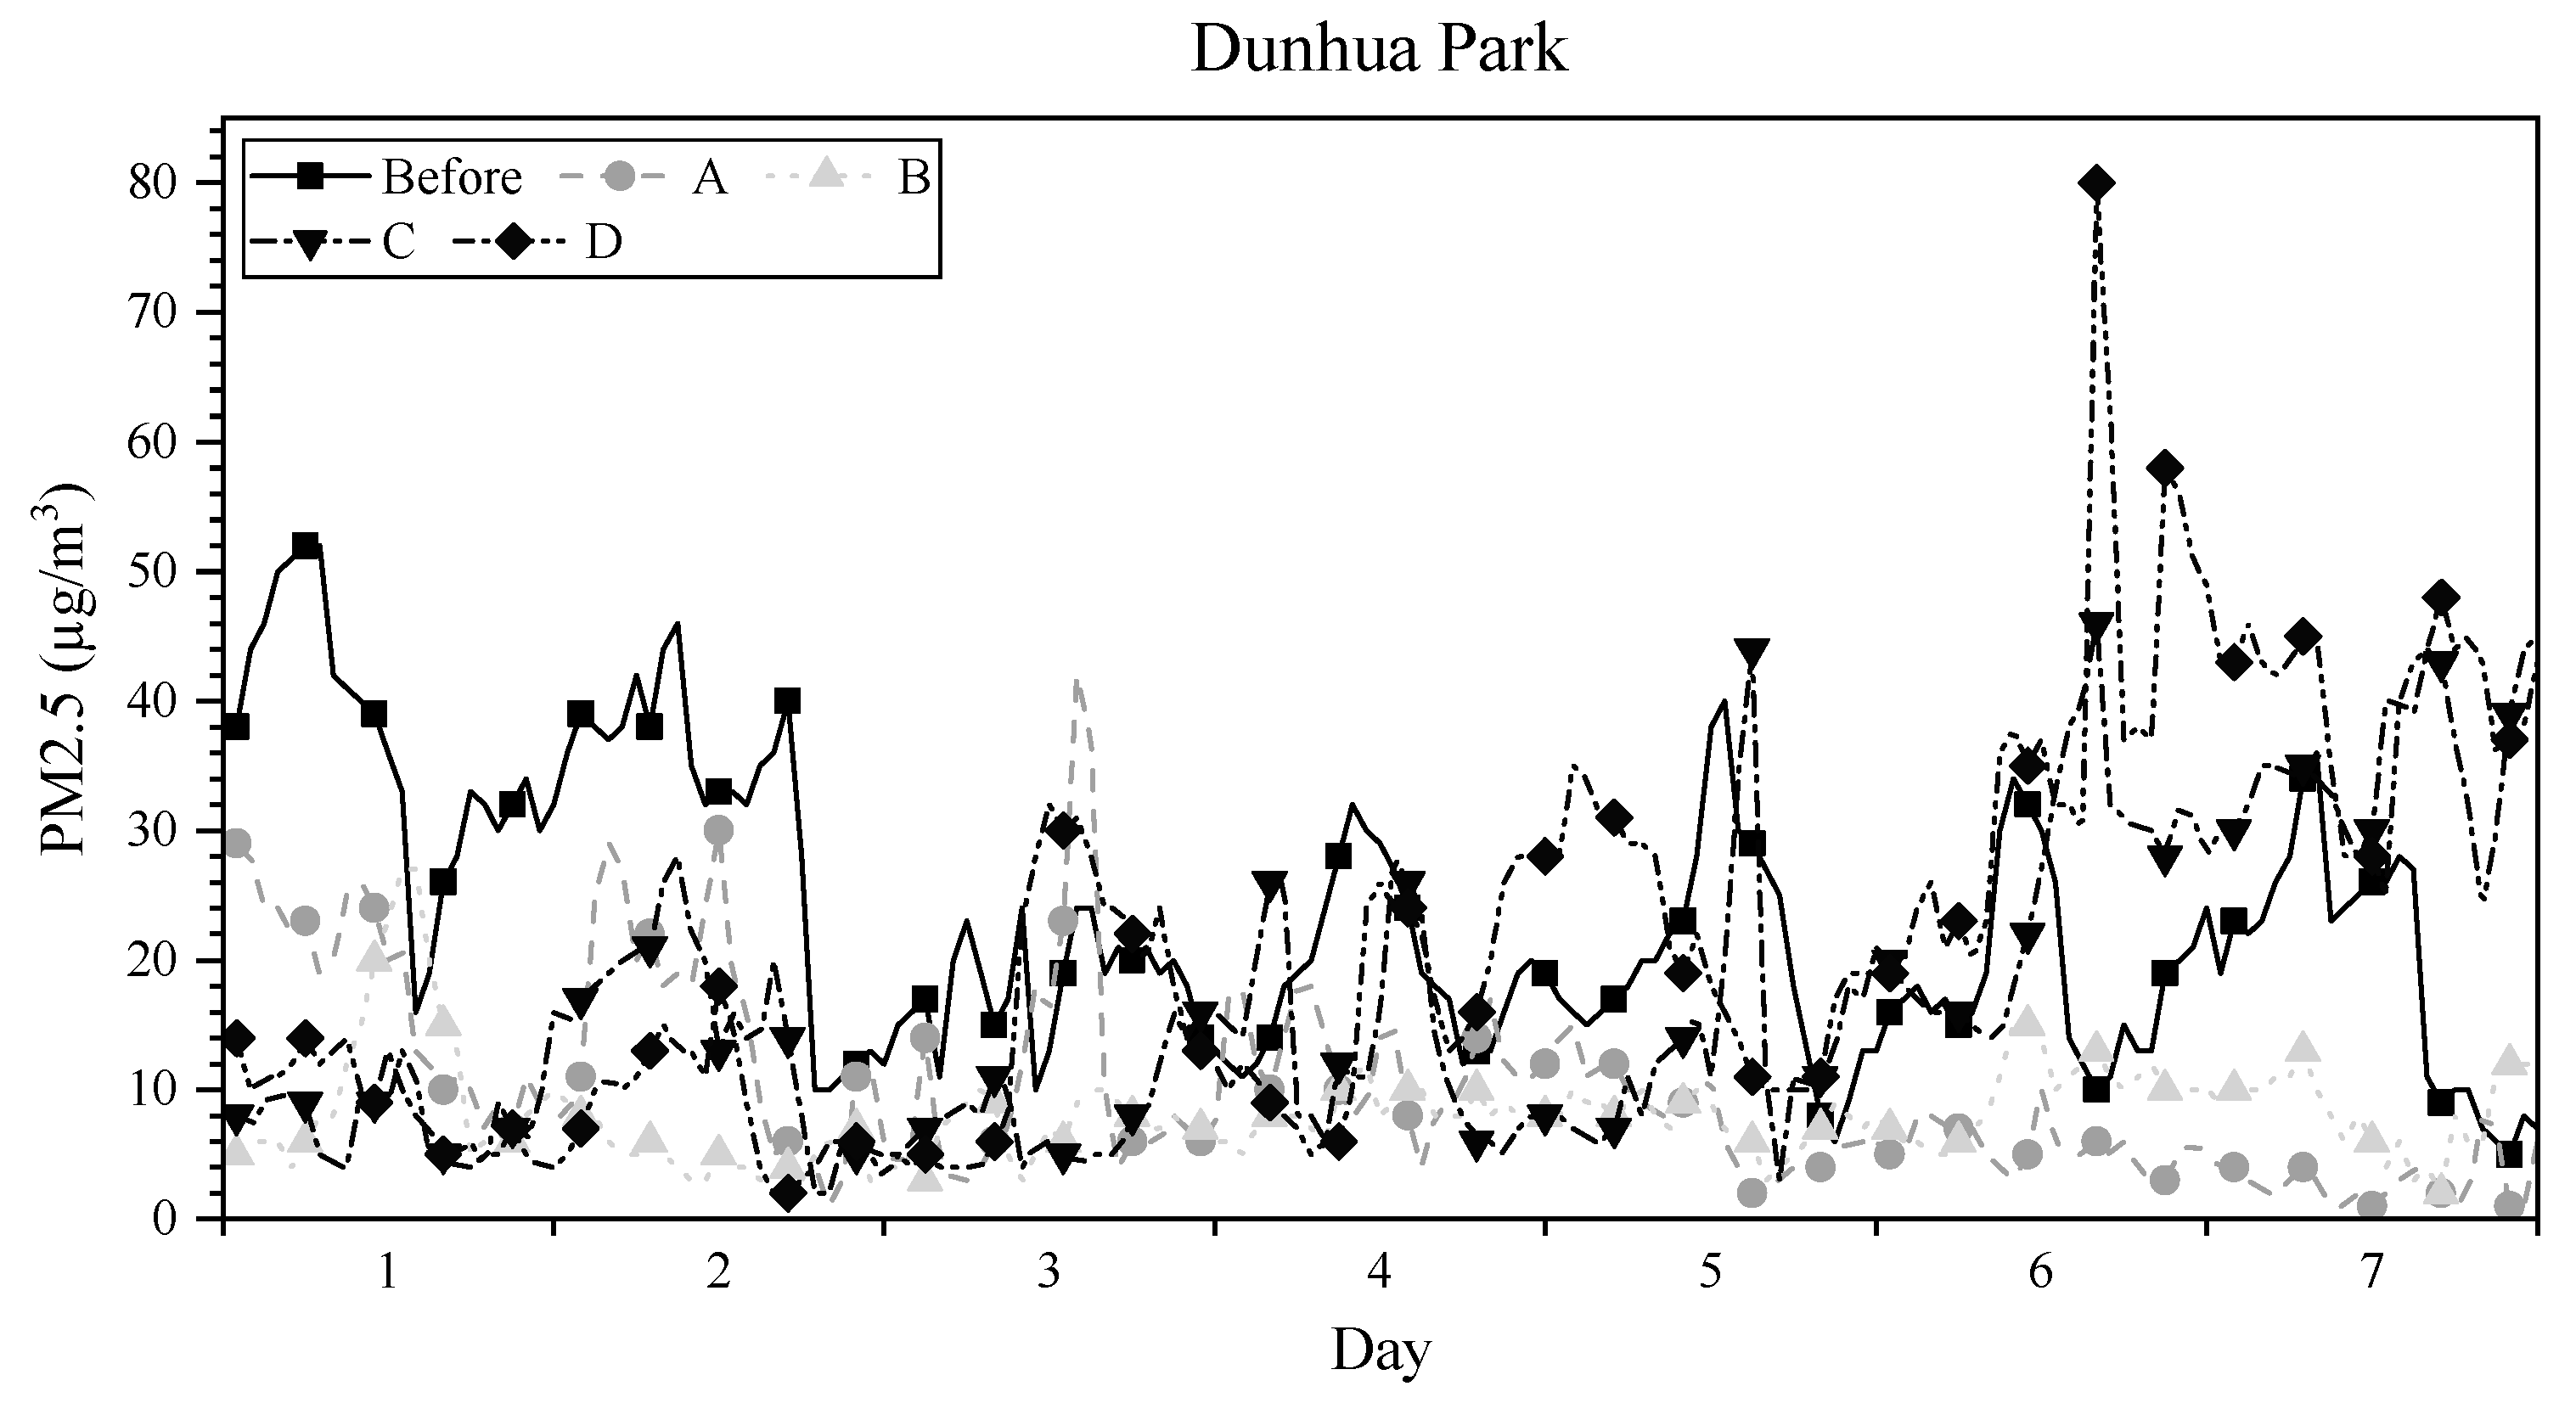
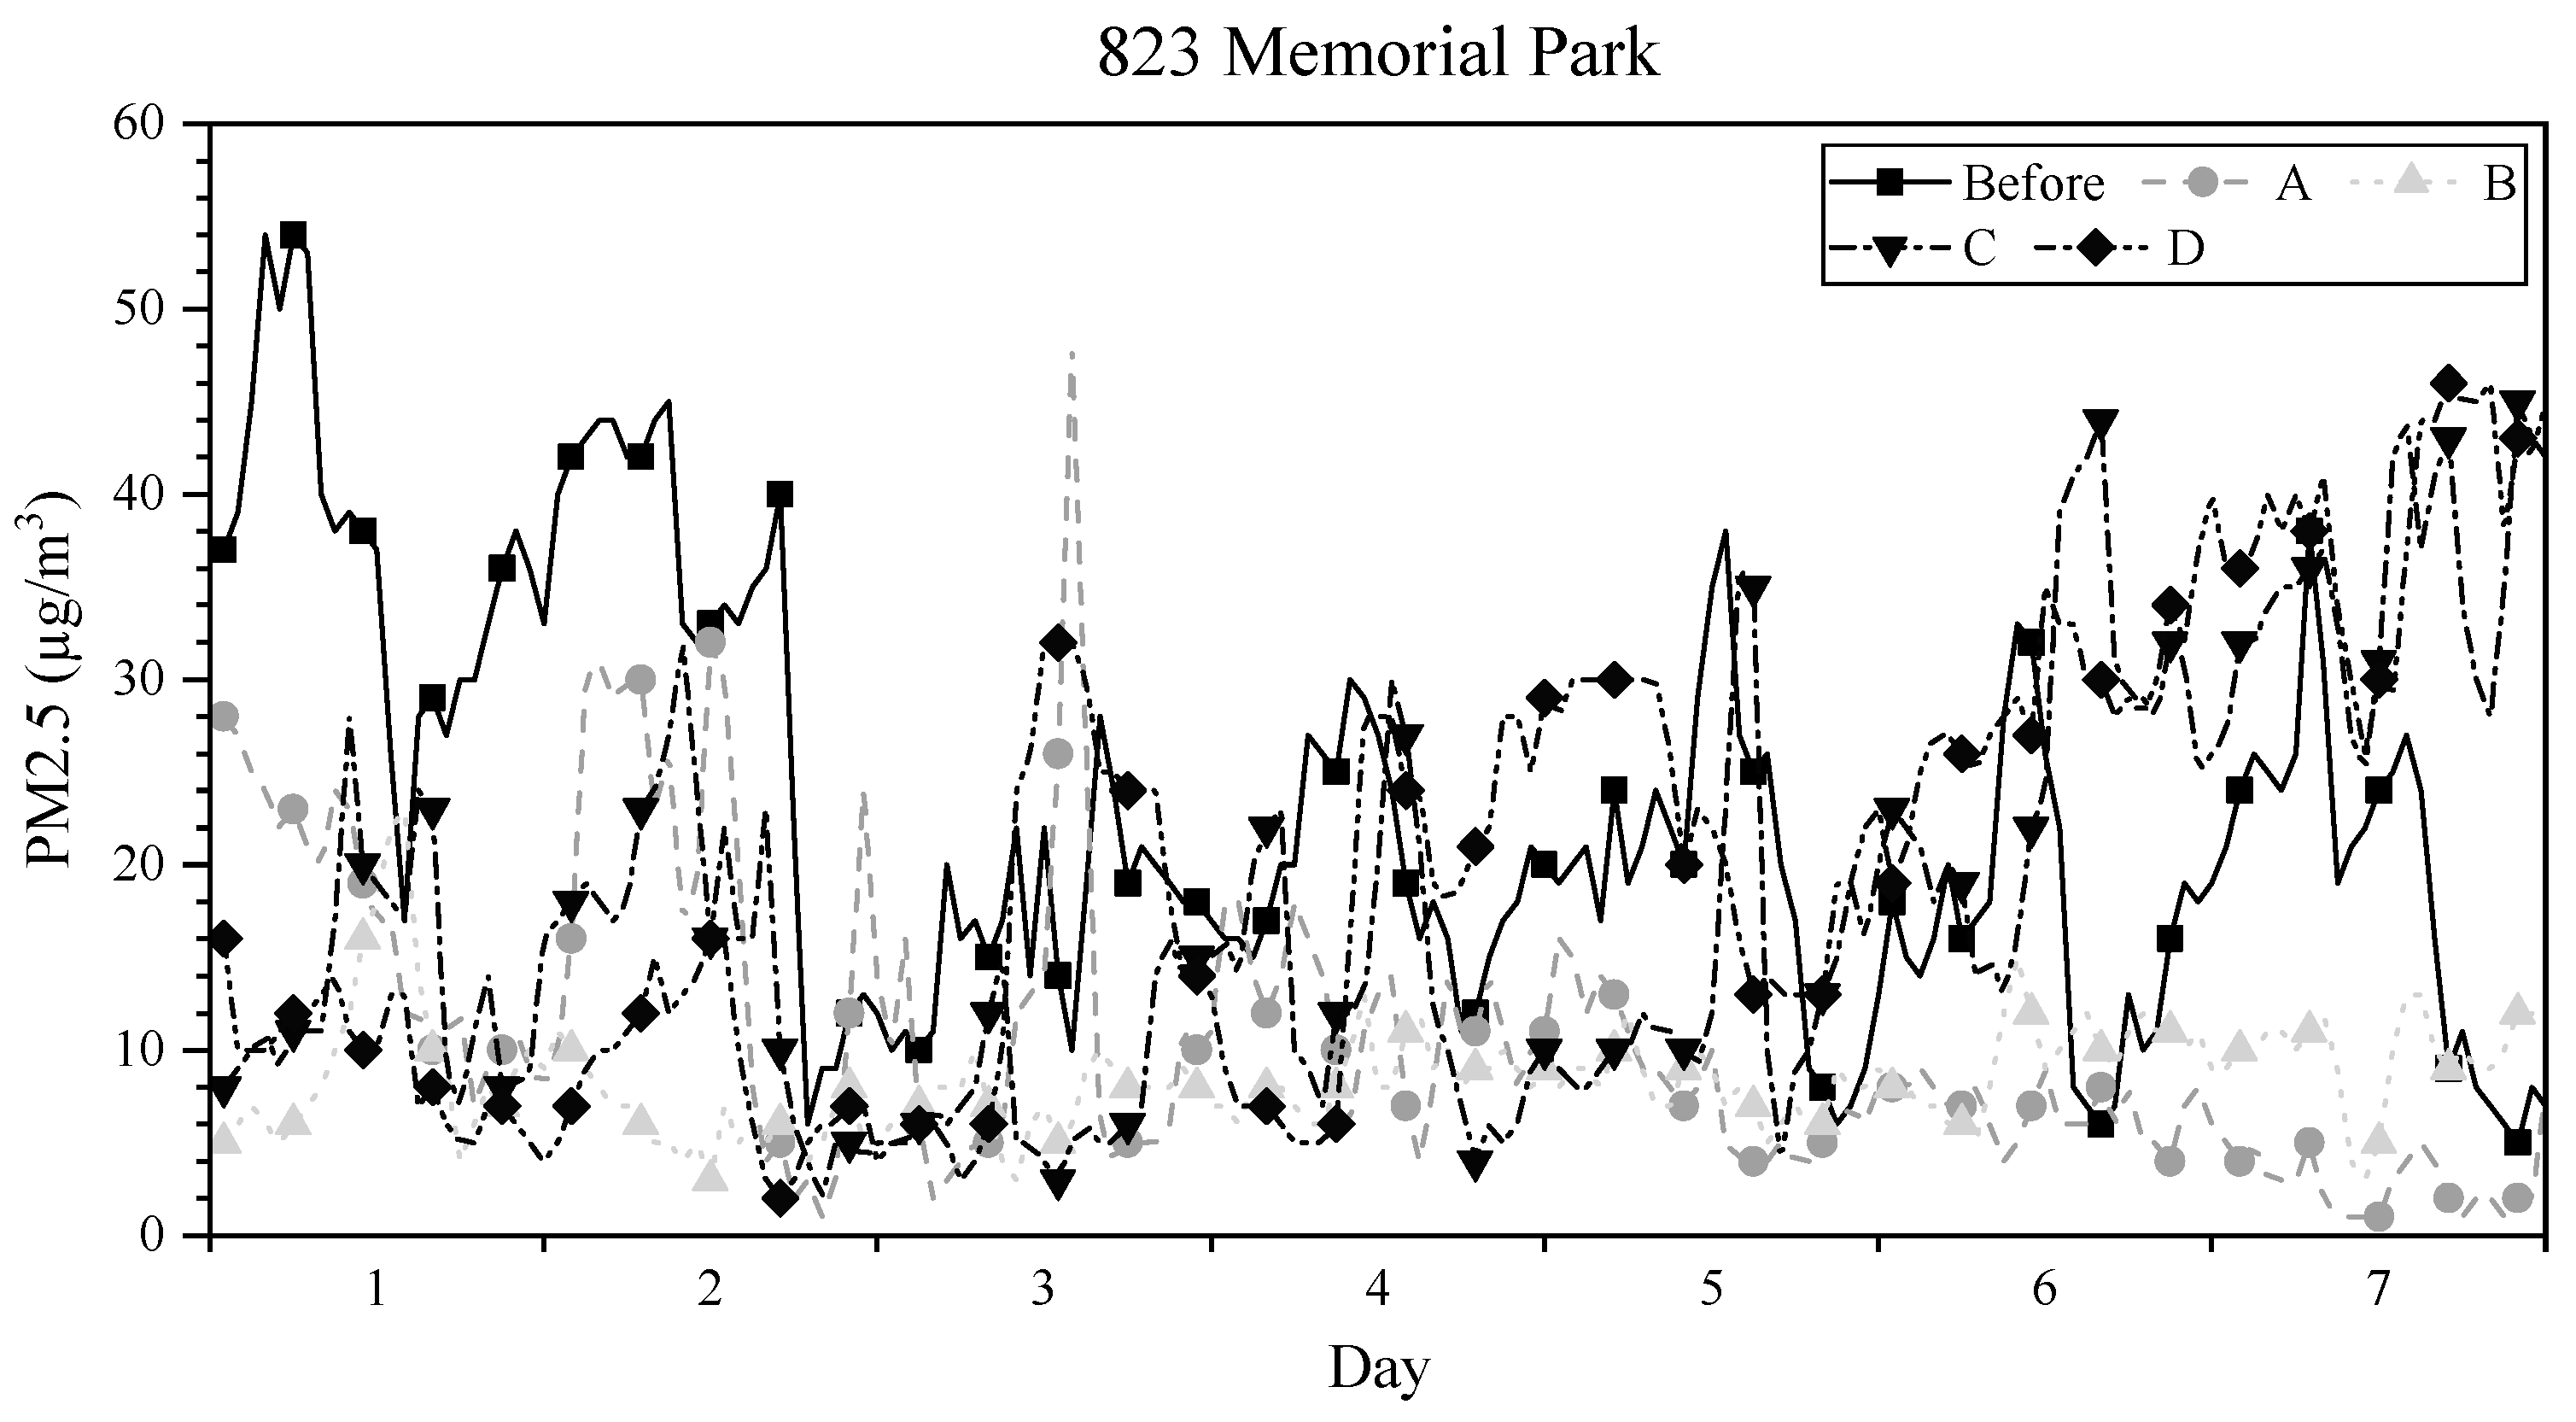
The PM2.5 concentration changes within one week at different epidemic outbreak stages were taken for analysis and evaluation. Figure 11, Figure 12 and Figure 13 show the comparison of PM2.5 concentrations at Xitun station, Dunhua Park, and 823 Memorial Park before the epidemic outbreak with different periods of the epidemic outbreak, respectively. These figures illustrate that PM2.5 concentration varied widely before the epidemic outbreak and during various epidemic outbreak periods. Part of the PM2.5 concentrations at these two parks exceeded those measured at meteorological station. It displayed that there was a high level of human outdoor activities at these two parks. These figures also show that human activities around these two parks were maintained when the epidemic outbreak entered the plateau period, but human activity in city had gradually declined. Therefore, the PM2.5 concentrations detected in these two parks exceeded the meteorological station. However, as the epidemic heated up, the detected data measured in the park and at the station showed a decrease in sync trend, which showed that the human activities in the city and in the park had gradually decreased. Therefore, the measured value of the PM2.5 concentration in these two parks and the meteorological station showed a clear downward trend. When the epidemic broke out, it entered the plains period. The human activities in the cities and the parks also tend to be at the lowest level. When the epidemic entered a downward phase, it was clear that PM2.5 concentration in the park was gradually and substantially exceeding the measured data at the meteorological station. When the outbreak entered a stable period, the government announced that the epidemic prevention measures were to be gradually loosened. The PM2.5 concentration data of the two parks and meteorological station showed a synchronous growth situation in the gradual unsealing of the epidemic. PM2.5 concentrations measured in the park were greater than those at the meteorological station. This was because the nearby residents returned to parks but the government had not yet officially announced the lift of the travel bans.

4.3.2. Statistical Measurement Analysis

The measured data of Figure 11, Figure 12 and Figure 13 were analyzed by statistical methods, which are listed in Table 2 and Table 3. These data show the mean, standard deviation, coefficient of variation (CV), mean deviation (MD), interquartile range (IQR), quartile deviation (QR), and mean absolute deviation (MAD), etc., analyzed on a weekly basis. The mean and standard deviation are used to investigate the degree of difference between the measurement data and its mean, and CVs are to explore the degree of numerical variation between the measurement intervals and MD. When the average deviation is large, the difference between the sign value and the arithmetic average is greater, and the mean is less representative of the arithmetic average. When the average difference is smaller, the difference between the sign value and the arithmetic average is smaller, and the mean is a better representation of the arithmetic average, which comprehensively reflects the degree of variation of the value of each unit of the population. The quartile (IQR) represents the gap between Q3 for the third quartile and Q1 for the first quartile, showing the dispersion of the measured data. QD shows the difference between a set of variables with a central half of the data size, or half of the IQR. MAD was used to discuss the average of the absolute values of the deviation between the observed value and the arithmetic mean. The above statistical analysis can accurately reflect the size of the error of the actual measurement value, so this study was used to explore the difference and dispersion of the detection data.
Table 2 and Table 3 show that when the outbreak entered the plateau period, the value of the PM2.5 concentration decreases with the epidemic outbreak and the values of SD, IQR, QD, and MAD were significantly reduced. The variation of statistical measurement data shows that the PM2.5 measurement changes gradually stabilized in 24 h a day. SD, IQR, QD, and MAD values also decreased from the peak of the epidemic outbreak to the plateau period, in addition to the decline in the average PM2.5 concentration. The MAD value illustrates that the measurement data within 24 h was quite stable. It can be found that the sharp fall in human activity had obviously affected air quality. As the epidemic outbreak enters a descent phase, human activity gradually returned to normal, and the average, SD, IQR, QD, and MAD values of PM2.5 measurements increased simultaneously in 24 h a day. Most of the measured data display that when human activity increased, an increase in the relevant measured data was observed. In addition, PM2.5 concentration decreased due to rainfalls during part of the investigation period.

4.4. The Influence of Epidemic Outbreak Changes on Health Effects

In order to investigate the effects of declined PM2.5 concentrations on human health due to reduced human activities, the research achievements [17] were quoted to explore its impact on improving the reduction in the SDNN and on the increase in the LF/HF. Table 4 shows the impact benefit of PM2.5 concentrations on SDNN and LF/HF, the step function of Equation (17) is used as a reference for analyzing the effects of PM2.5 concentration changes. Where the SDNN represents that the standard deviation of the normal cardiac rate, i.e., the square of the variance, the greater the standard deviation is, the greater the variability of the heart rate is. It can be used as the indicator on the overall heart rate variability. PM2.5 concentration increases the sense of the heart by reducing the regulation of the parasympathetic nerve, which affects the function of the heart. LF represents the activity index of low frequency component of the sympathetic nervous system and parasympathetic nerve and HF represents that the high frequency component of the sympathetic nervous system and parasympathetic nerve. The LF/HF have a significant relationship with autonomic nervous system regulation and cardiovascular disease-related mortality rates. Therefore, this study explored the effects of PM2.5 concentrations due to the epidemic changes on human health.
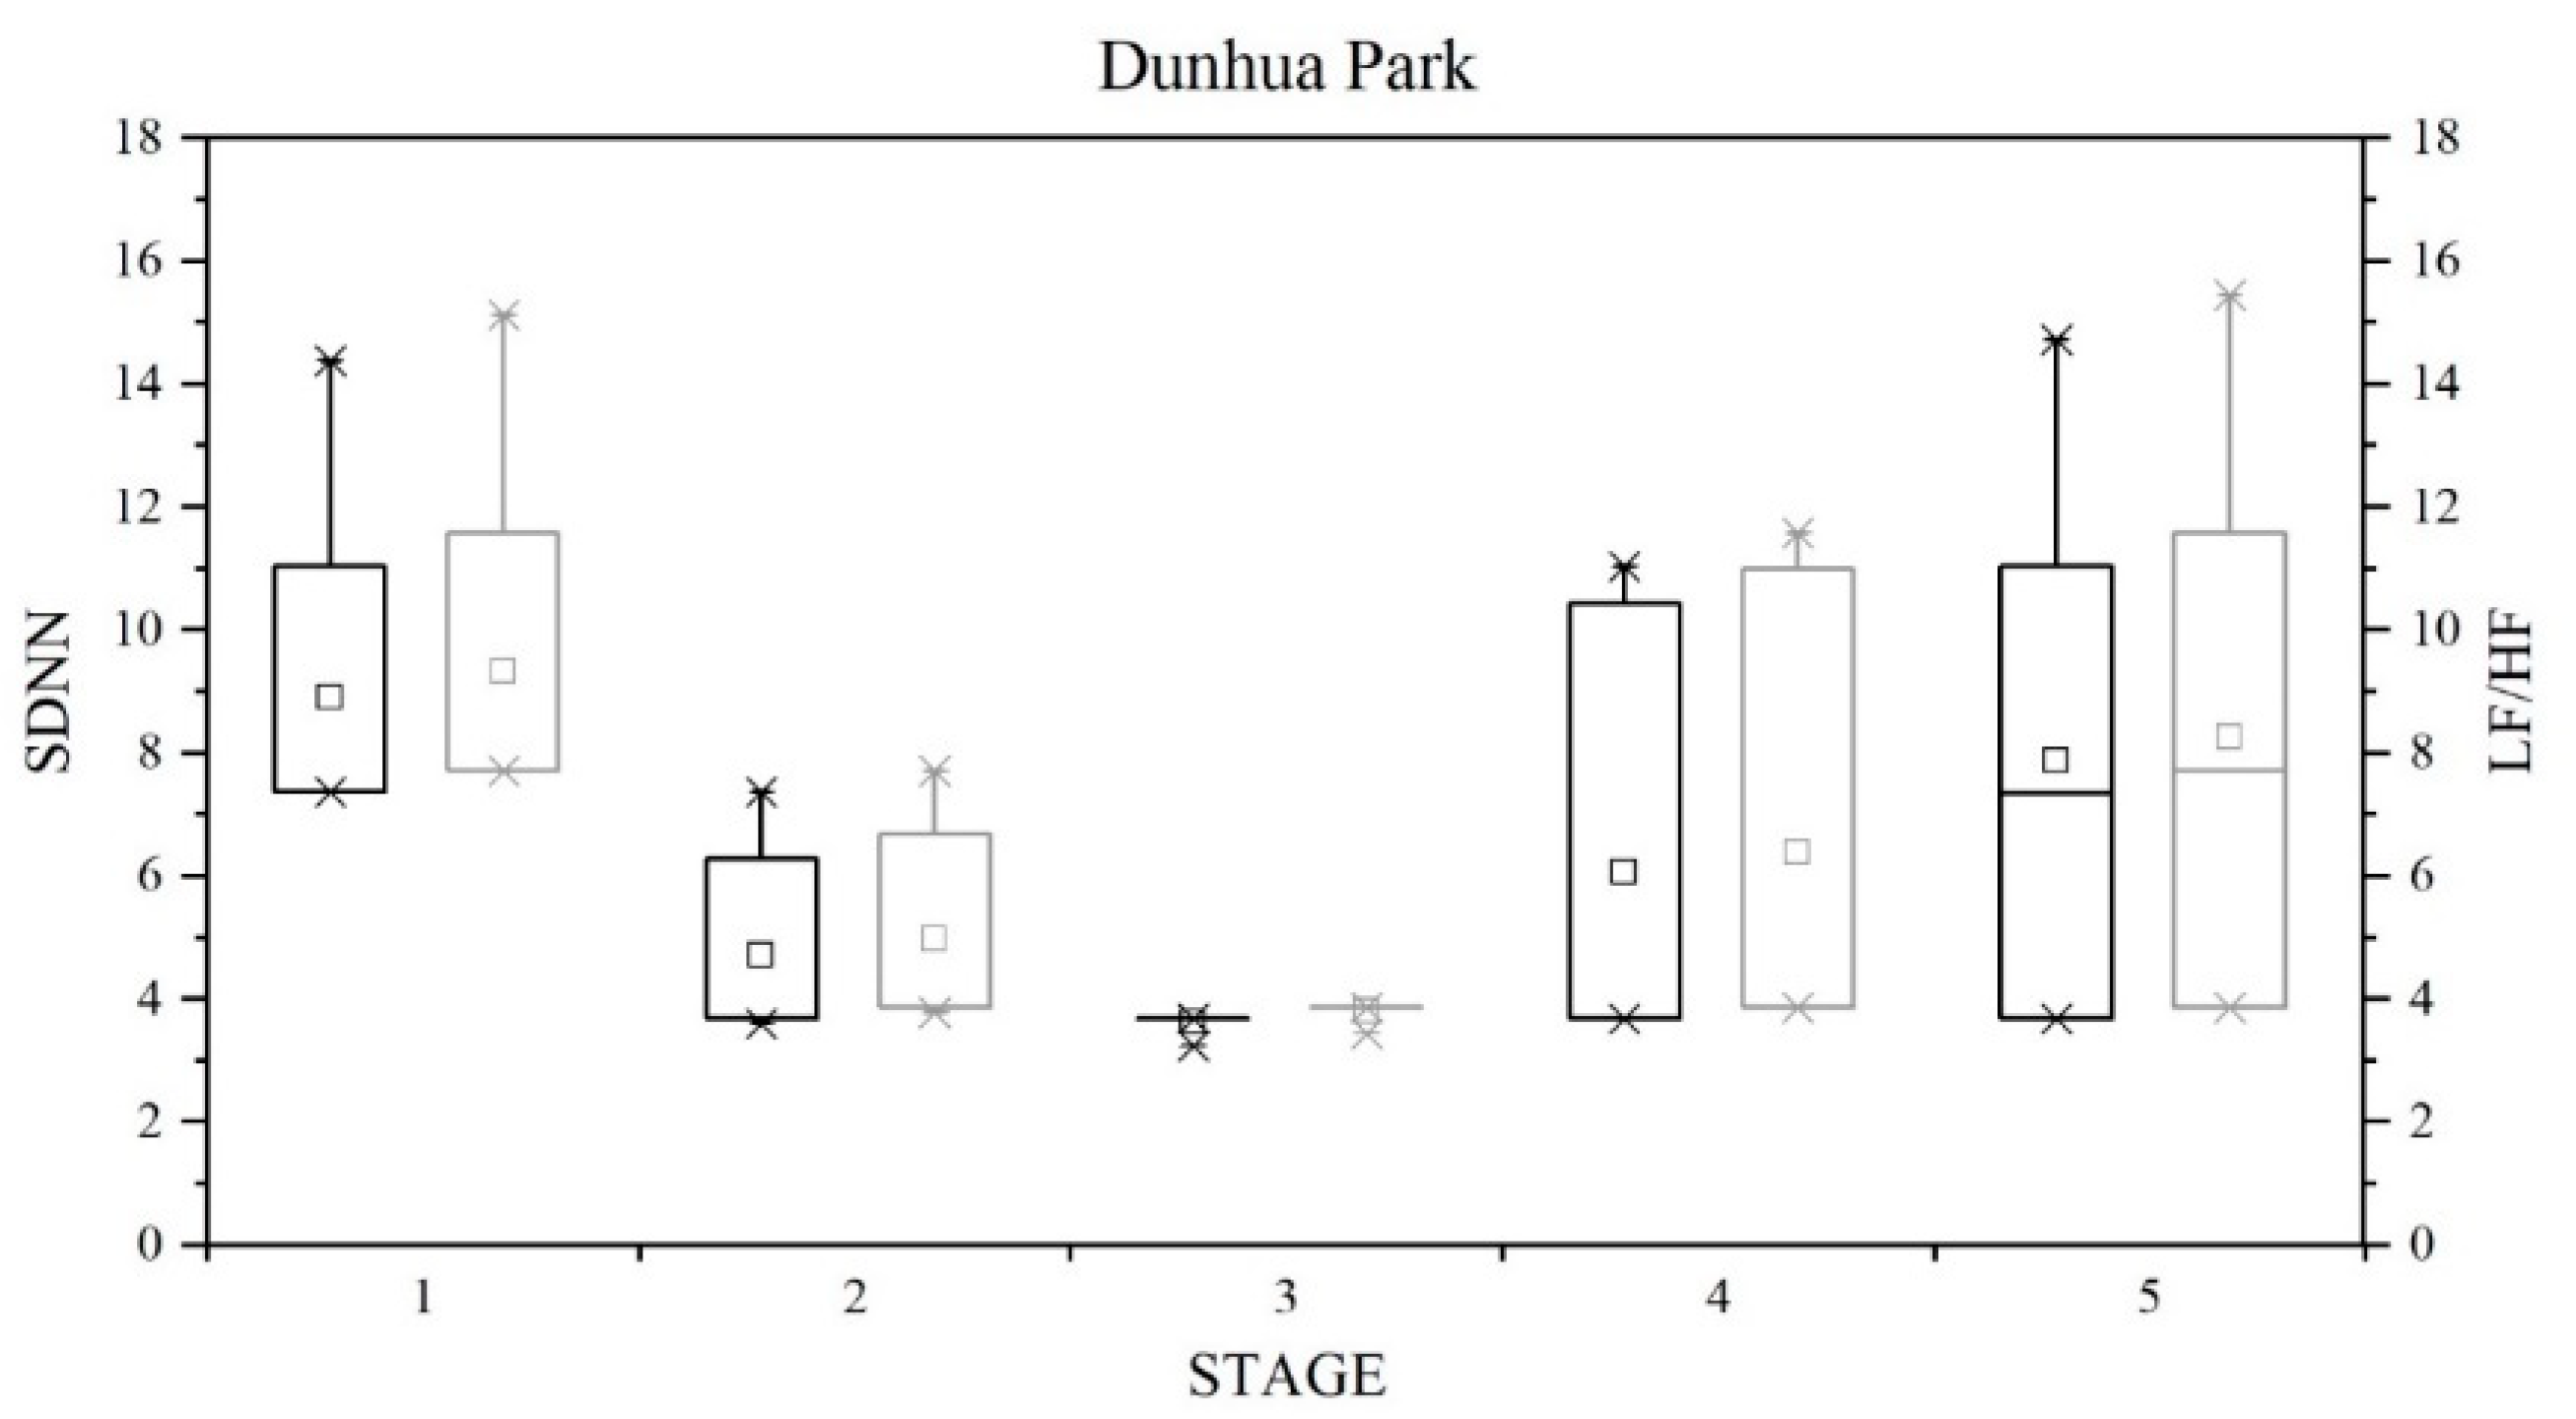
The analytical results are shown in Figure 14 and Figure 15. Figure 14 is the analytical results of Dunhua Park and Figure 15 is at 823 Memorial Park. The left y axis is the SDNN reduction scale and the right y axis is the LF/HF increase ratio, respectively. Figure 14 and Figure 15 show the effect of PM2.5 concentration on SDNN and LF/HF. These figures show that when the epidemic outbreak entered from the plateau period to the plain period, the SDNN and LF/HF had stable and obvious improvement benefits. The average of PM2.5 concentration in this region was 36.50 μg/m3. The health effects on SDNN and LF/HF can be improved by approximately 73.53%. Both parks have the same effect. When the epidemic gradually eases, the improved health effect decreased gradually as the value of PM2.5 concentration increased. When the social life activities returned to normal life, there was a significant effect on the regulation of the autonomic nervous system associated with cardiovascular disease mortality. The benefits on these two parks, shown in Figure 11, Figure 12 and Figure 13, obviously found that as the amount of public activity decreased, the PM2.5 concentrations were significantly reduced and also showed obvious benefits to human health. The reduced human outdoor activity had a certain improvement effect on human health. When the epidemic entered the decline period and the stabilization period, it can be clearly found that the variability of SDNN and LF/HF increased. The changes in PM2.5 concentration gradually increased within 24 h, and a correlation between PM2.5 and human activity and health was obviously found.

5. Conclusions

Epidemic outbreaks have a significant impact on human life, and a reduction in human activities also have relative benefits to the environment. This study took the PM2.5 concentration before and after the outbreak of the epidemic in Taiwan as the research object and explored the impact of human activities on the changes of urban PM2.5 concentration. As the outbreak occurred during Taiwan’s mid-summer period, people stayed home and took classes online, with electricity consumption increasing instead of decreasing. Most of Taiwan’s electrical power is generated by thermal power generation, so the basic PM2.5 concentrations have not changed and the background values are consistent. The following conclusions can be obtained from the relevant analysis of this study:
  • The relevant government information illustrates that electricity consumption did not decline during the epidemic outbreak and industrial production is also operating normally, while urban vehicles and the active population decreased significantly; thus, mobile pollution sources are relatively reduced, improving PM2.5 benefits significantly;
  • With the increased numbers of people diagnosed with COVID-19, the PM2.5 concentrations values decreased, which was positively correlated with a significant reduction of people’s outdoor activities;
  • Analytical results of the monitoring data showed that the reduction in public outdoor activities significantly reduced mobile pollution sources. The PM2.5 concentration benefits in the park were about 63.01% to 64.77%, and the benefits for health improvement could be increased by about 73.53%.
The PM2.5 concentration in the metropolitan area was mainly affected by public activities and mobile pollution sources. To improve air quality, people must propose more effective ways to improve their living habits and traffic conditions. In addition, the convenience of people’s life and leisure must be taken into account, as well as friendly living patterns.

Author Contributions

Conceptualization, W.-P.S. and C.-H.L.; methodology, W.-P.S. and C.-H.L.; software, W.-P.S.; formal analysis, W.-P.S. and C.-H.L.; data curation, W.-P.S. and C.-H.L.; writing—original draft preparation, W.-P.S. and C.-H.L.; writing—review and editing, W.-P.S. and C.-H.L.; visualization, W.-P.S. and C.-H.L.; project administration, W.-P.S.; funding acquisition, W.-P.S. All authors have read and agreed to the published version of the manuscript.

Funding

This research was funded by the Ministry of Science and Technology, Taiwan, grant number No. MOST-110-2410-H-167-002-MY2.

Institutional Review Board Statement

Not applicable.

Informed Consent Statement

Not applicable for this study not involving humans.

Data Availability Statement

All data are available within the article and also from the corresponding author upon request.

Conflicts of Interest

The authors declare that there is no conflict of interest regarding the publication of this paper.

References

  1. Zhu, N.; Zhang, D.; Wang, W.; Li, X.; Yang, B.; Song, J.; Zhao, X.; Huang, B.; Shi, W.; Lu, R.; et al. A Novel Coronavirus from Patients with Pneumonia in China, 2019. N. Engl. J. Med. 2020, 382, 727–733. [Google Scholar] [CrossRef] [PubMed]
  2. COVID-19 Dashboard. Available online: https://covid-19.nchc.org.tw/ (accessed on 3 December 2021).
  3. Taiwan National Infectious Disease Statistic System. Available online: https://www.cdc.gov.tw/Uploads/Files/05a8c38e-bdae-4d15-b073-8413488d818c.jpg (accessed on 21 January 2021).
  4. Tang, R.; Huang, X.; Zhou, D.; Wang, H.; Xu, J.; Ding, A. Global air quality change during the COVID-19 pandemic: Regionally different ozone pollution responses COVID-19:疫情期间全球空气质量变化:臭氧响应的区域间差异. Atmos. Ocean. Sci. Lett. 2021, 14, 100015. [Google Scholar] [CrossRef]
  5. Berman, J.D.; Ebisu, K. Changes in US air pollution during the COVID-19 pandemic. Sci. Total Environ. 2020, 739, 139864. [Google Scholar] [CrossRef] [PubMed]
  6. Contini, D.; Costabile, F. Does air pollution influence COVID-19 outbreaks? Atmosphere 2020, 11, 377. [Google Scholar] [CrossRef] [Green Version]
  7. Venter, Z.S.; Aunan, K.; Chowdhury, S.; Lelieveld, J. COVID-19 lockdowns cause global air pollution declines. Proc. Natl. Acad. Sci. USA 2020, 117, 18984–18990. [Google Scholar] [CrossRef] [PubMed]
  8. Dockery, D.W.; Pope, C.A., III; Xu, X.; Spengler, J.D.; Ware, J.H.; Fay, M.E.; Ferris, B.G., Jr.; Speizer, F.E. An association between air pollution and mortality in six US cities. N. Engl. J. Med. 1993, 329, 1753–1759. [Google Scholar] [CrossRef] [PubMed] [Green Version]
  9. World Health Organization (WHO). Ambient (Outdoor) Air Quality and Health, 2016. Available online: http://www.who.int/mediacentre/factsheets/fs313/en/ (accessed on 27 February 2017).
  10. Orru, H.; Maasikmets, M.; Lai, T.; Tamm, T.; Kaasik, M.; Kimmel, V.; Forsberg, B. Health impacts of particulate matter in five major Estonian towns: Main sources of exposure and local differences. Air Qual. Atmos. Health 2011, 4, 254. [Google Scholar] [CrossRef]
  11. Available online: https://www.who.int/home/cms-decommissioning (accessed on 26 September 2021).
  12. Lei, Y.-C.; Chan, C.-C.; Wang, P.-Y.; Lee, C.-T.; Cheng, T.-J. Effects of Asian dust event particles on imflammation markers in peripheral blood and bronchoalvelor lavage in pulmonary hypertensive rats. Environ. Res. 2004, 95, 71–76. [Google Scholar] [CrossRef]
  13. Chuang, K.-J.; Chan, C.-C.; Su, T.-C.; Lee, C.-T.; Tang, C.-S. The Effect of urban air pollution on inflammation, oxidative stress, coagulation, and autonomic dysfunction in young adults. Am. J. Respir. Crit. Care Med. 2007, 176, 370–376. [Google Scholar] [CrossRef] [PubMed]
  14. Chen, B.-Y.; Chao, H.J.; Chan, C.-C.; Lee, C.-T.; Wu, H.P.; Cheng, T.-J.; Guo, Y.-L. Effects of fine particulates and fungal spores on lung function in schoolchildren. Pediatrics 2011, 127, e690–e698. [Google Scholar] [CrossRef] [PubMed]
  15. U.S. Environmental Protection Agency. Integrated Science Assessment for Particulate Matter. 2009. Available online: https://cfpub.epa.gov/ncea/risk/recordisplay.cfm?deid=216546 (accessed on 27 February 2017).
  16. Underwood, E. Brain Pollution: Evidence Builds That Dirty Air Causes Alzheimer’s, Dementia. Sci. Mag, 2017. Available online: https://www.science.org/content/article/brain-pollution-evidence-builds-dirty-air-causes-alzheimer-s-dementia (accessed on 26 January 2017).
  17. Lung, S.C.C.; Chen, N.; Hwang, J.S.; Hu, S.C.; Wang, W.C.V.; Wen, T.Y.J.; Liu, C.H. Panel study using novel sensing devices to assess associations of PM2.5 with heart rate variability and exposure sources. J. Expo. Sci. Environ. Epidemiol. 2020, 30, 937–948. [Google Scholar] [CrossRef] [PubMed]
  18. Taichung Coal-Fired Power Plant, Taiwan. Available online: https://www.power-technology.com/projects/taichung (accessed on 7 October 2009).
  19. Pan, J.N.; Chou, H.L. Applying Step Loss Function in the Evaluation of Environmental Risk. J. Manag. Syst. 2007, 14, 409–433. [Google Scholar]
  20. Taguchi, G. Introduction to Quality Engineering: Designing Quality into Products and Processes; Asian Productivity Organization: Tokyo, Japan, 1986. [Google Scholar]
  21. Spiring, F.A. The Reflected Normal Loss Function. Can. J. Stat. 1993, 21, 321–330. [Google Scholar] [CrossRef]
  22. Pan, J.N.; Wang, J.H. A Study of Loss Functions for Product Interference Analysis. Ind. Eng. Res. 2000, 2, 80–100. [Google Scholar]
  23. Available online: https://github.com/avaldebe/AQmon/blob/master/Documents/PMS3003_LOGOELE.pdf (accessed on 17 July 2020).
  24. Kelly, K.E.; Whitaker, J.; Petty, A.; Widmer, C.; Dybwad, A.; Sleeth, D.; Martin, R.; Butterfield, A. Ambient and laboratory evaluation of a low-cost particulate matter sensor. Environ. Pollut. 2017, 221, 491–500. [Google Scholar] [CrossRef] [PubMed]
  25. Wu, Y.H. Characteristics of Airborne Particulates in Taichung Urban Area A Case Study from 2008 to 2010. Master’s Thesis, National Chung-Hsin University, Taichung, Taiwan, 2011. [Google Scholar]
  26. Chiang, Y.C. Study on the Distribution Phenomena and Possible Sources of PM2.5 in the Central Taiwan. Master’s Thesis, Chaoyang University of Technology, Taichung, Taiwan, 2017. [Google Scholar]
  27. Lin, C.L. Factors Affecting Haze Pollution of PM2.5 in Central Taiwan Using Multivariate Analysis. Master’s Thesis, National Chung-Hsin University, Taichung, Taiwan, 2017. [Google Scholar]
  28. COVID-19 Global Dashboard by Taiwan. Available online: https://covid-19.nchc.org.tw/dt_005-covidTable_taiwan.php (accessed on 31 August 2021).
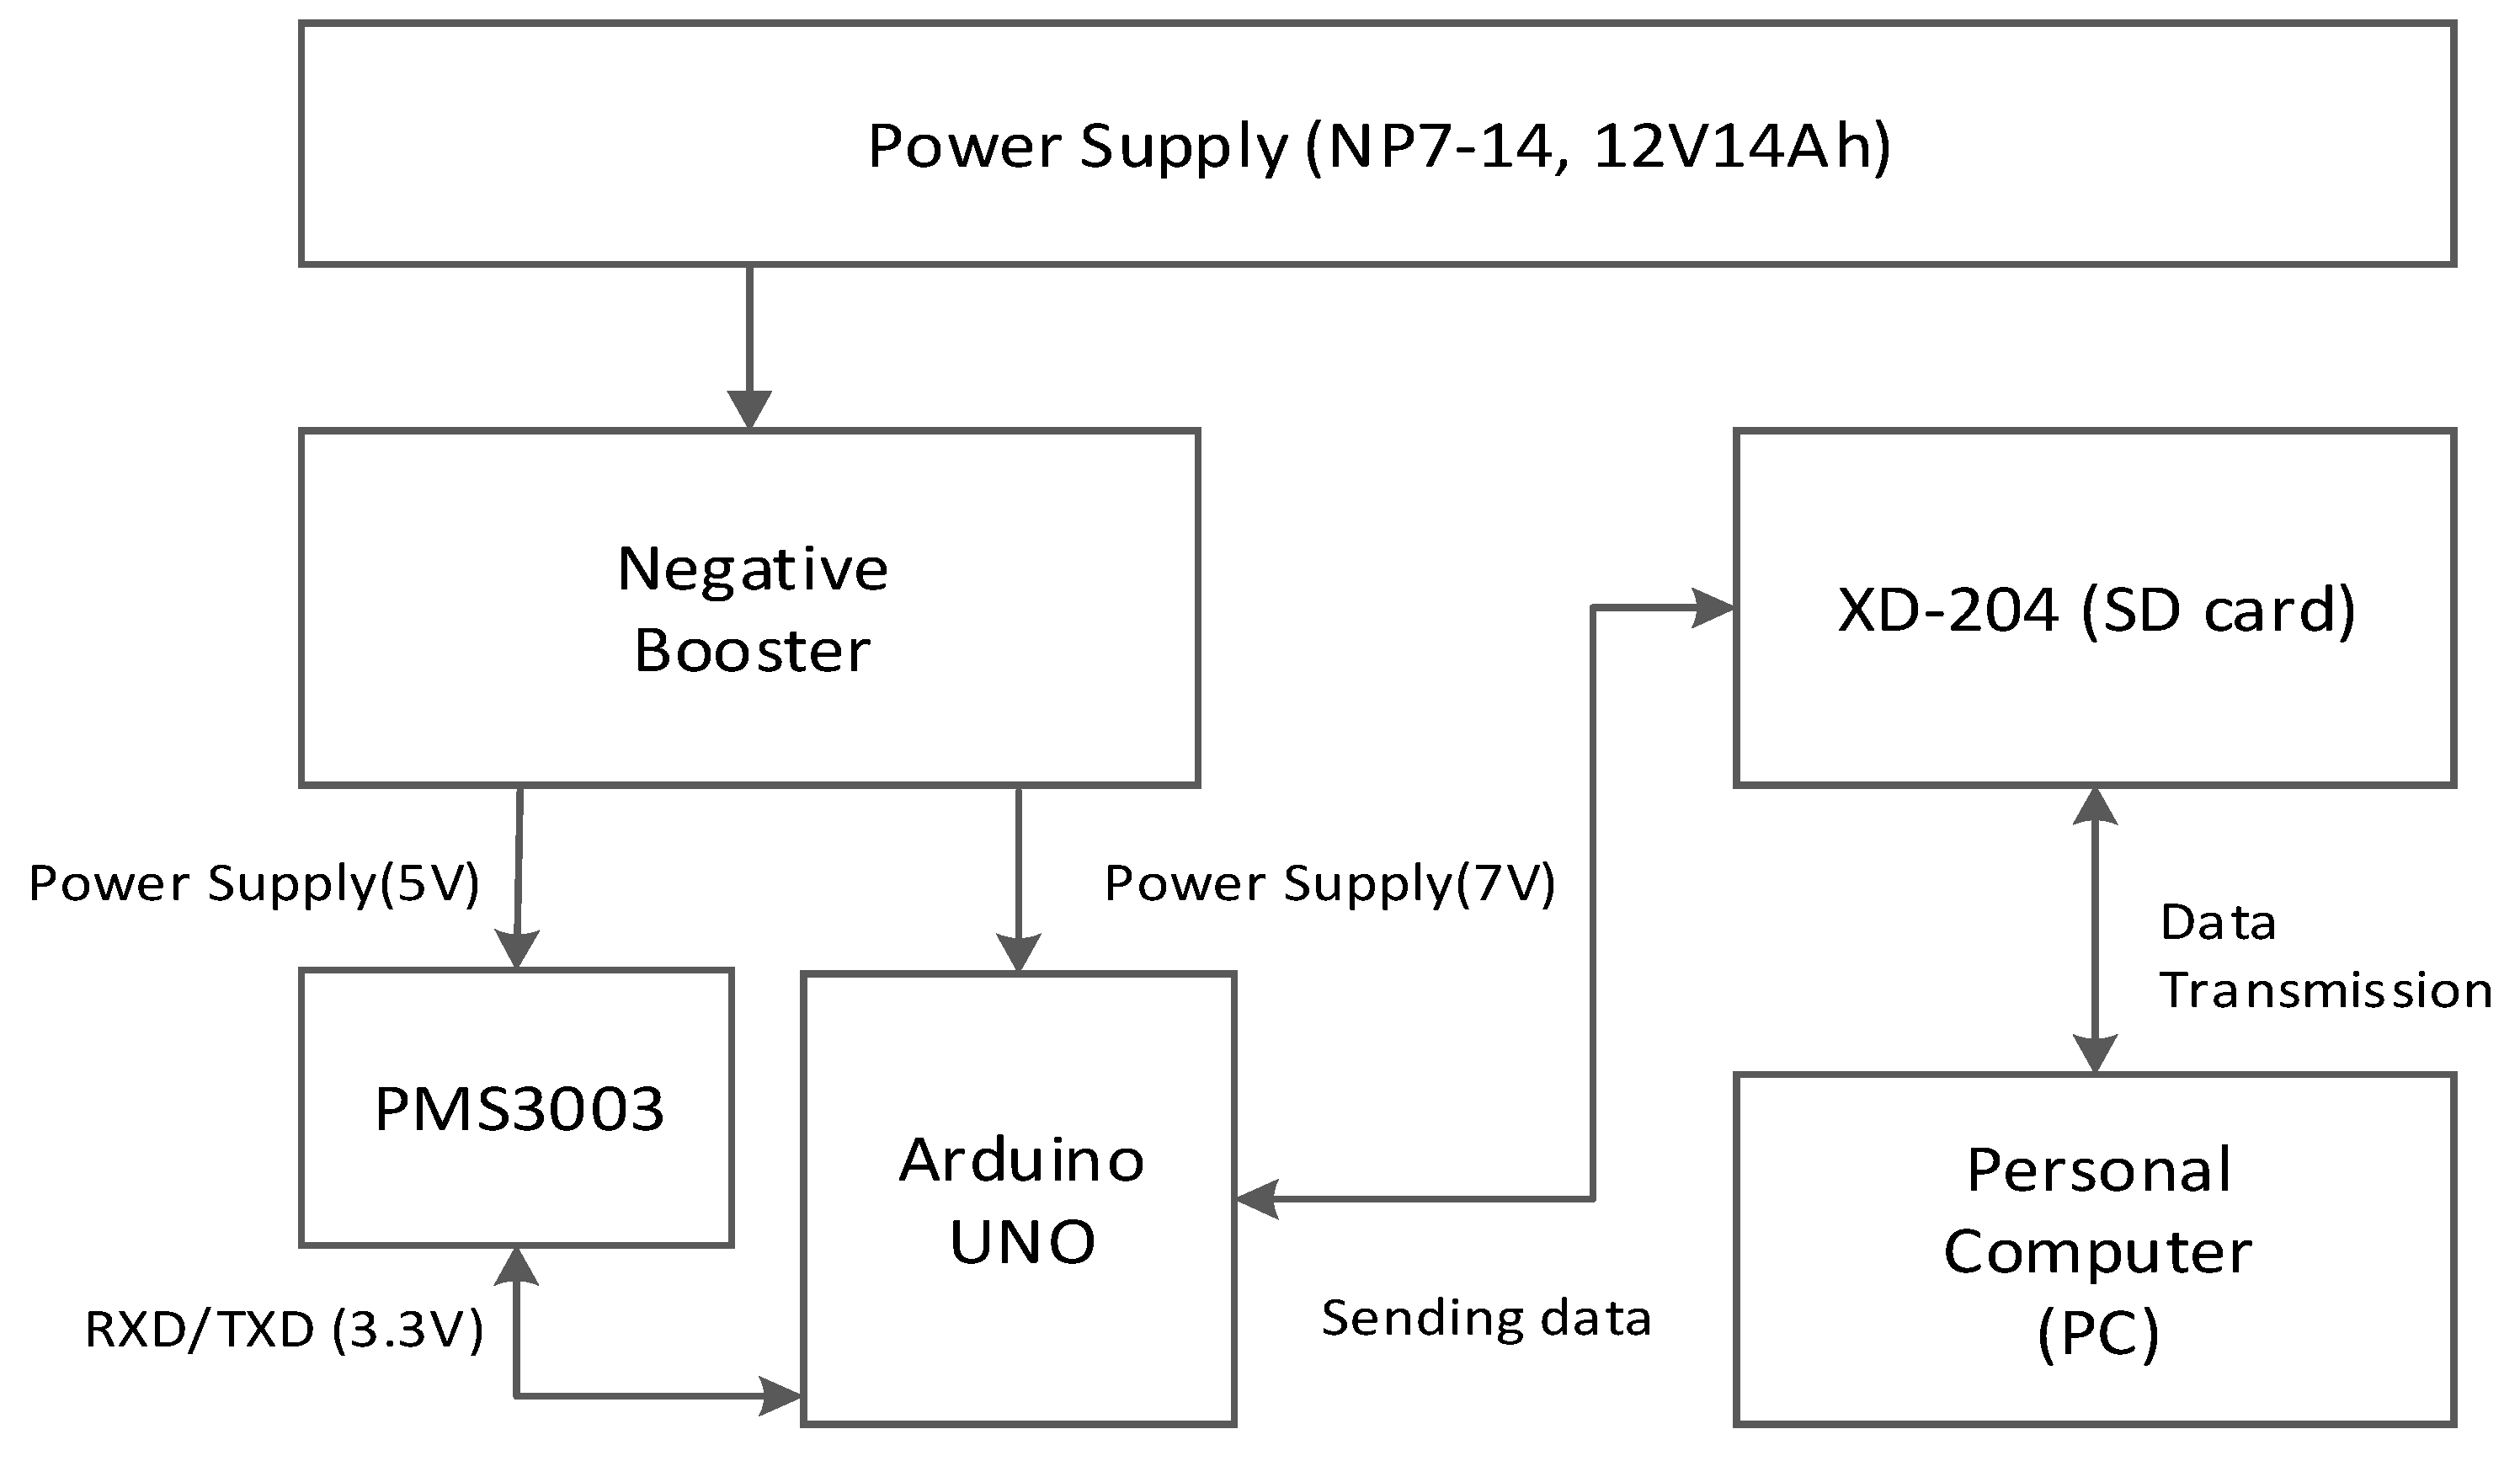
Figure 1. The hardware circuit of the developed aerosol sensing system.
Atmosphere 13 00276 g001
Figure 2. The experimental field of metropolitan parks at the north of Beitun District, Taichung, Taiwan.
Atmosphere 13 00276 g002
Figure 3. Photos of the (a) Dunhua park and (b) 823 Memorial park at the north of Beitun District, Taichung, Taiwan.
Atmosphere 13 00276 g003
Figure 4. The experimental data comparison of the PMS3003 aerosol sensor with the AEROCET 531S portable dust meter.
Atmosphere 13 00276 g004
Figure 5. The change of PM2.5 concentration at the Xitun station in Taichung City of the Central Meteorological Administration.
Atmosphere 13 00276 g005
Figure 6. The temperature variation at the Xitun station in Taichung City of the Central Meteorological Administration.
Atmosphere 13 00276 g006
Figure 7. The east-west wind speed variation at the Xitun station in Taichung City of the Central Meteorological Administration.
Atmosphere 13 00276 g007
Figure 8. The relative humidity and rainfall variation at the Xitun station in Taichung City of the Central Meteorological Administration.
Atmosphere 13 00276 g008
Figure 9. The relationship between epidemic changes and the variation of PM2.5 concentration.
Atmosphere 13 00276 g009
Figure 10. The box and whisker plot of the variation of PM2.5 concentration at different epidemic outbreak stages.
Atmosphere 13 00276 g010
Figure 11. The comparison of the PM2.5 concentration changes at Xitun station before the epidemic outbreak and at various periods of the epidemic outbreak.
Atmosphere 13 00276 g011
Figure 12. The comparison of the PM2.5 concentration changes at Dunhua Park before the epidemic outbreak and at various periods of the epidemic outbreak.
Atmosphere 13 00276 g012
Figure 13. The comparison of the PM2.5 concentration changes at 823 Park before the epidemic outbreak and at various periods of the epidemic outbreak.
Atmosphere 13 00276 g013
Figure 14. Improvement benefits for SDNN reduction and LF/HF promotion with the PM2.5 concentration change in Dunhua Park.
Atmosphere 13 00276 g014
Figure 15. Improvement benefits for SDNN reduction and LF/HF promotion with the PM2.5 concentration change in 823 Park.
Atmosphere 13 00276 g015
Table 1. The statistical comparison of test results for the PMS3003 and the AEROCET 531S.
RR2Adjusted R2Standard Estimation ErrorVariance of R2Variance of FVariance of Significanc F
0.920.840.844.570.841527.530.00
Table 2. Statistical analysis of daily PM2.5 concentrations for each outbreak period in Dunhua Park.
DayMeanSDCVMDIQRQDMAD
Before136.509.730.2735.0012.006.005.50
230.4211.910.3935.0017.508.753.50
318.004.010.2219.005.502.752.50
419.426.280.3219.0010.505.255.00
520.048.720.4318.0012.006.005.00
619.086.830.3617.008.004.003.50
719.299.560.5023.0016.508.255.00
A117.177.450.4319.5014.007.007.00
214.428.980.6214.0015.007.508.00
310.8310.180.946.507.503.752.50
412.213.760.3112.005.002.502.50
57.543.680.497.006.503.253.00
65.541.690.315.001.500.751.00
72.921.910.652.502.501.251.50
B111.387.110.638.009.004.502.50
24.961.710.345.002.001.001.00
37.042.100.307.003.501.752.00
48.331.610.198.001.500.751.00
57.581.860.258.002.501.251.00
69.792.990.3110.004.502.252.00
78.253.150.388.505.002.502.50
C17.882.890.378.003.501.752.00
214.547.600.5215.5013.006.505.00
38.423.870.468.005.502.753.00
413.467.520.5611.0010.005.004.00
513.839.090.6611.008.504.253.50
625.509.130.3627.5015.007.508.50
735.135.640.1634.509.504.754.50
D18.793.740.439.507.003.504.00
28.504.530.538.007.003.503.00
316.1310.250.6416.0019.009.5010.50
416.428.110.4915.0014.507.257.50
520.468.300.4119.0016.008.008.50
636.8315.550.4235.5020.0010.0012.00
739.796.540.1643.007.503.752.00
Table 3. Statistical analysis of daily PM2.5 concentrations for each outbreak period in 823 Memorial Park.
DayMeanSDCVMDIQRQDMAD
Before136.969.290.2537.009.504.755.50
231.0413.440.4334.5024.5012.258.00
317.174.710.2717.506.003.003.00
419.795.280.2718.508.504.252.50
519.838.330.4220.009.504.754.50
617.047.360.4316.507.503.753.50
718.929.150.4821.5016.508.255.00
A116.716.790.4117.0012.506.256.00
217.4610.970.6318.0023.0011.5011.50
310.7910.180.946.007.503.753.50
411.963.720.3111.504.002.002.50
58.083.740.467.505.502.752.50
66.711.460.227.002.001.001.00
72.921.790.612.502.501.251.50
B19.885.190.538.505.002.502.50
26.211.930.316.002.001.001.00
37.291.730.248.002.001.001.00
48.631.760.208.001.500.751.00
58.041.570.208.002.001.001.00
69.582.390.2510.003.001.502.00
79.752.560.2610.002.501.251.00
C113.675.870.4311.008.504.253.00
215.468.440.5517.0017.008.506.50
38.174.280.526.008.004.001.00
413.547.250.5412.0012.006.005.00
513.717.940.5810.506.503.251.50
626.008.930.3424.5011.505.756.00
735.335.870.1735.0010.005.004.50
D19.383.320.3510.005.502.753.00
28.714.250.498.006.503.253.00
316.9610.410.6116.0019.009.5010.00
417.259.320.5419.0019.509.759.00
521.966.700.3122.0015.007.508.00
629.174.720.1628.505.502.752.00
738.755.790.1539.008.004.004.50
Table 4. The relationship of the effect of PM2.5 concentration variation on SDNN and LF/HF [17].
PM2.5 (μg/m3)SDNN (Reduced)LF/HF (Increased)
I0.00–3.70NormalNormal
II3.70–14.403.68%3.86%
III14.40–25.107.36%7.72%
IV24.10–35.8011.04%11.58%
V35.80–49.2014.72%15.44%
VI>49.2018.40%19.30%
Publisher’s Note: MDPI stays neutral with regard to jurisdictional claims in published maps and institutional affiliations.