Abstract
The present study aims to analyze the high-resolution model-simulated meteorological conditions during the Chamoli rock-ice avalanche event, which occurred on 7 February 2021 in the Chamoli district of Uttarakhand, India (30.37° N, 79.73° E). The Weather Research and Forecasting (WRF) model is used to simulate the spatiotemporal distribution of meteorological variables pre- and post-event. The numerical simulations are carried out over two fine resolution nested model domains covering the Uttarakhand region over a period of 2 weeks (2 February to 13 February 2021). The model-simulated meteorological variables, e.g., air temperature, surface temperature, turbulent heat flux, radiative fluxes, heat and momentum transfer coefficients, specific humidity and upper wind patterns, were found to show significant departures from their usual patterns starting from 72 h until a few hours before the rock-ice avalanche event. The average 2 m air and surface temperatures near the avalanche site during the 48 h before the event were found to be much lower than the average temperatures post-event. In-situ observations and the ERA5-Land dataset also confirm these findings. The total turbulent heat flux mostly remained downward (negative) in the 72 h before the event and was found to have an exceptionally large negative value a few hours before the rock-ice avalanche event. The model-simulated rainfall and Global Precipitation Measurement (GPM, IMERG)-derived rainfall suggest that the part of the Himalayan region falling in the simulation domain received a significant amount of rainfall on 4 February, around 48 h prior to the event, while the rest of the days pre- and post-event were mostly dry. The results presented here might be helpful in further studies to identify the possible trigger factors of this event.
1. Introduction
The Uttarakhand Himalayas are prone to many extreme events, such as flash floods [1,2], landslides [3,4,5], cloudburst [6,7,8], and forest fire [9]. The geomorphologically sensitive Himalayan region is susceptible to slope failures in response to various triggers such as earthquakes and extreme rainfall events [10,11]. With accelerated warming of the high-altitude region, the intensity and frequency of occurrence of these events are increasing [12,13,14], leading to enhanced loss of life and infrastructure collapse. For example, recent changes in climate of the high-altitude Himalayan region have resulted in the formation of numerous water bodies ranging from meltwater ponds to new lakes on the surface of glaciers, while the existing ones are expanding dramatically [15,16,17]. Due to lower albedo, these water bodies could potentially accelerate glacier melt through positive feedback mechanisms and could result in more frequent glacial lake outburst events [16,18,19]. Thus, a better understanding of small-scale near-surface atmospheric physical phenomena occurring within the lowest part of the atmospheric boundary layer and surface–atmosphere interaction through energy fluxes (turbulent and radiative) is becoming crucial. In some cases, a particular weather system developed over a few days or even hours could be one of the possible precursors of an extreme event and could result in a sequence of hazards such as flash floods [8,20,21] and landslides [5,22,23,24,25]. While the human and infrastructural losses caused by extreme weather and climate events depends upon a complex combination of sequential events, vulnerability, and exposure [26], timely forecast of these events or at least identification of possible precursors is crucial for the carrying out of disaster mitigation and management processes by disaster management authorities.
Continuous monitoring of meteorological features using in situ observations plays a critical role in forecasting extreme events such as heavy precipitation, rainfall-induced landslide, forest fire, etc., and in mitigating the impact of these disaster events. However, due to the complex topography and fragile geographical system of the Himalayan region, the real-time monitoring of meteorological variables and weather systems through an observational network over a vast susceptible area at a sub-kilometer scale is challenging. Further, re-analysis products, e.g., CFSR [27], ECMWF-ERA5 [28], and regional climate model simulations [29,30] are too coarse to capture small-scale meteorological features that could act as possible precursors of extreme events.
The Weather Research and Forecasting (WRF) model [31] is one of the most-used community numerical weather forecast models designed for operational weather forecast and research purposes. It is widely used for operational weather forecast as well as air quality [32,33,34] and hydrometeorological research [35,36], modeling of forest fires [37], prediction of the track and intensity of tropical cyclones [38,39], extreme event analysis over the Himalayan region [8,20,40,41,42], and climate applications [43]. WRF is also being used operationally by government organizations worldwide [38,44,45,46], including the India Meteorological Department (IMD), for many applications related to weather and climate. Recently, Zhou et al. (2019) [47] presented a naïve approach to assessing the usability of the WRF model-simulated soil moisture for landslide monitoring in the Emilia Romagna region, northern Italy. They have argued that WRF model-simulated soil moisture could be utilized as a potential tool for the prediction of landslide occurrence. Nuryanto et al. (2020, 2021) [48,49] and Susandi et al. (2018) [50] have also utilized WRF-model-simulated rainfall for the development of landslide early warning system in Indonesia.
We have utilized the WRF model to numerically simulate meteorological conditions during an extreme event generally referred to as the Chamoli rock-ice avalanche event [51,52] or Chamoli disaster, Uttarakhand, India (30.37° N, 79.73° E). The triggering factors behind this rock-ice avalanche event could be unusual local meteorological conditions (temperatures, precipitation, winds speed and pattern, wind stress, radiative and turbulent fluxes, etc.), climatic conditions (long-term changes in surface and air temperatures and precipitation patterns), and geological factors (extremely steep slope, destabilization of the rock due to the decreased ice cover, seismic activity) [28,51,52,53,54].
The present work aims to identify any unusual meteorological conditions that developed within a few days prior to the event that might have been an additional triggering factor behind the Chamoli rock-ice avalanche event. To the best of our knowledge, no attempt has yet been made to analyze the possible role of meteorological conditions over the area as an additional cause of the event. In the absence of a dense observational network near a remote disaster site like this, real-time weather forecasts at fine resolution and analysis using numerical weather modeling techniques blended with available observational data could be potentially less expensive assets for predicting and mitigating the impact of such types of events in the future.
2. Material and Methods
2.1. Event Description
The event took place in the Tapovan area of Joshimath in the Chamoli District of Uttarakhand, India on 7 February 2021 at 4:51 UTC [51,52,53,55] (Figure 1A,B). During this event, a massive rock and ice avalanche happened approximately 22 km upstream of Tapovan Hydropower Project, below Ronti peak in the Nanda Devi massif [51,53,55], which led to a sequence of events that resulted in the loss of many lives and the infrastructural damage of two major hydropower projects in the Rishiganga and Dhauliganaga valleys (Figure 1C). Based on analysis of satellite imagery, seismic record, and numerical modeling, Shugar et al. (2021) [51] argue that ‘a huge volume of rock and glacier had fallen from Ronti peak which rapidly transformed into huge debris flow and resulted into a sequence of disaster events’.
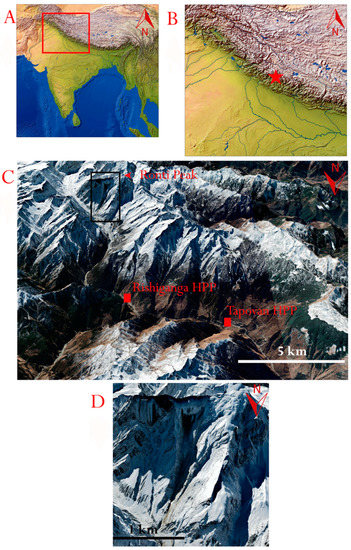
Figure 1.
The location of the Chamoli disaster, Uttarakhand, India, is shown in panels (A,B). The exact location of the failure and nearby areas are marked in panel (C), and a post-event image of the site is displayed in panel (D). (Images for (A,B) are taken from https://www.naturalearthdata.com/, (accessed on 9 January 2022) and images for (C,D) are obtained from Google Earth Pro version 7.3.4.8248). The symbol ★ denotes the location of the disaster site.
2.2. Climatic and Physical Characteristics of the Study Region
The climate of the area is characterized by warm-wet summers (June–September) and cold-wet winters (December–February) [55]. The monthly average 2 m air temperature and surface temperature during February remain well below the freezing point, e.g., ~−10 °C and ~−12 °C, respectively (Figure 2). The maximum temperatures are found during the summer monsoon season (Figure 2). The site receives precipitation from both westerlies and the summer monsoon [51,55]. More than half of total precipitation is due to southwest monsoonal rainfall in June–September (JJAS), while winter precipitation is mostly associated with the western disturbances. Geologically, the area of the rock-ice avalanche hosts central Himalayan crystalline rocks of meta-sedimentary origin [56]. Predominant rock types in this area are gneiss, kyanite-schist, quartzite, calc-silicate, marble, migmatite-gneiss, and quartz-mica schists from the Proterozoic age [57,58,59]. The elevation range of the rockslide body is about 5600 masl, and the slope angle of the sliding body just before the event was about 40° [54]. The rock-ice avalanche occurred in rocks of migmatite-gneiss, with marble bands having many existing glacier spurs [54].
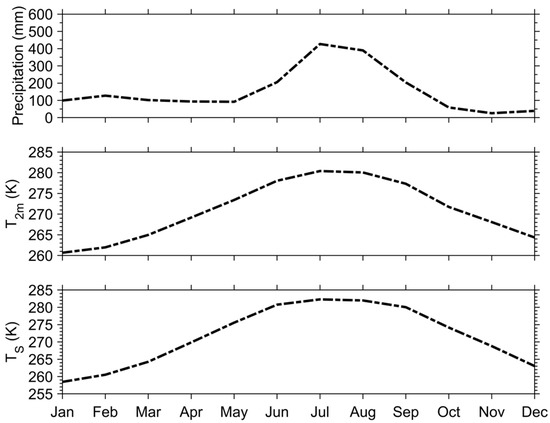
Figure 2.
Average monthly precipitation, surface temperature, and 2 m temperature derived from the ERA5-Land dataset around the event site (1991–2021).
2.3. WRF Model Simulation Details
The WRF numerical model version 4.2.2 [31], which is fully compressible, has a non-hydrostatic dynamical core, and uses terrain-following hydrostatic pressure for the vertical coordinate, was used for numerical simulations. Figure 3 shows the geographic coverage of model domains. The study domain consists of two one-way nested domains, namely domain d01 (9 × 9 km) and domain d02 (1.8 × 1.8 km), each shown with a black rectangular box (Figure 3).
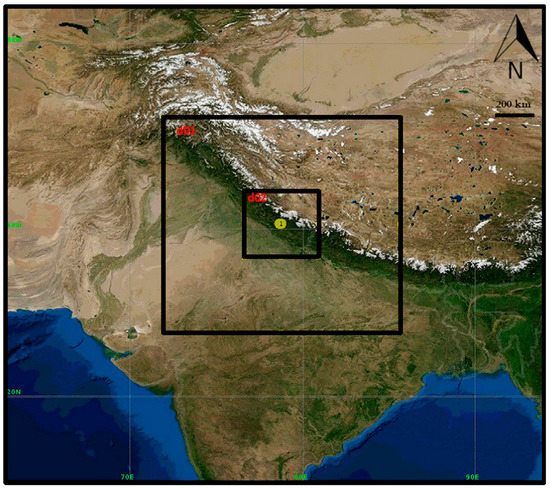
Figure 3.
The two nested domains, namely domain d01 (9 km × 9 km) and domain d02 (1.8 km × 1.8 km) for WRF model simulations, are shown with black rectangular boxes.
For d01, there are 146 east–west and 151 north–south grid points covering a 1314 km × 1359 km area, while d02 has 226 east–west and 231 north–south grid points covering a 406.8 × 415.8 km2 spatial region around the center point (30.27° N, 78.39° E). Each domain was configured with 50 vertical layers from the ground level to the top pressure of 50 hPa. The model’s lowest five eta levels above the surface are 0.9975, 0.9965, 0.995, 0.992, and 0.990, and the thickness of the layer was set to increase with height. Initial and boundary conditions were provided by ERA5 reanalysis data from the European Centre for Medium-Range Weather Forecasts (ECMWF), available at 0.25° × 0.25° horizontal resolution and 6 h temporal resolution [28] (Copernicus Climate Change Service (C3S), 2017). United States Geological Survey (USGS) 25-category land use/land cover (LULC) data, modified for the Indian region by the Indian Space Research Organization (ISRO) using the Advanced Wide Field Sensor (AWiFS) [60] for the year 2018–2019 were utilized to provide LU/LC data to the model. Topographic data available at 30s (~1 km) from GMTED2010 [61], which is suitable for our fine resolution (1.8 km × 1.8 km) inner domain (d02), was utilized here. The model physics setup utilized for simulations is as follows and summarized in Table 1.
The revised MM5 surface layer scheme [62,63] was used to parameterize momentum, heat, and moisture fluxes from the surface to the atmosphere. As a non-local, first-order closure scheme, the Yonsei University (YSU) [64] Planetary Boundary Layer (PBL) scheme was selected for PBL parameterizations along with stability-dependent turbulent orographic form drag [65] parameterization (topo_wind option = 1). The other physics packages include the Noah MP land-surface model [66], the micro-physics scheme by [67], the Dudhia shortwave scheme [68], and the Rapid Radiative Transfer Model (RRTM) longwave scheme [69]. These settings of physics modules were found to be near the optimum configuration for the WRF model over the Himalayan region in the studies reported in the literature [70].

Table 1.
Summary of model setup.
Table 1.
Summary of model setup.
| Parameter | Description |
|---|---|
| Initial and boundary data | ERA5 reanalysis |
| Temporal interval of boundary data | 6 h |
| Grid size | Domain 1: (146 × 151) × 50 |
| Domain 2: (226 × 231) × 50 | |
| Horizontal resolution | Domain 1: 9 km |
| Domain 2: 1.8 km | |
| Nesting | One way |
| Vertical levels | 50 |
| Time step | 15s |
| Land use land cover data | USGS data updated using AWiFS [60] |
| Topographic data | GMTED2010 [61] |
| Microphysics | Thompson scheme [67] |
| PBL scheme | YSU scheme [64] |
| Cumulus parameterization | Kain-Fritsch scheme [71] |
| Shortwave radiation | Dudhia scheme [68] |
| Longwave radiation | RRTM scheme [69] |
| Land surface model | Noah-MP land-surface model [66] |
| Surface-layer | Revised MM5 scheme [62] |
The model simulations were performed for 13 days in February 2021, starting from 1 February 2021. The whole 13-day simulation period was divided into segments of 4 days, each with a 24 h overlapping period, and the model was run continuously for four days, with the first day for each individual run taken as spin-up time and discarded, leading to a continuous 12-day model simulation from 2 February to 13 February 2021.
2.4. Data Analysis
Data from four sources were utilized for model validation and further analysis: (i) hourly time-series of 2 m temperature at three locations (Patiala (30.3398° N, 76.3869° E), Chandigarh (30.7333° N, 76.7794° E) and Delhi (28.7041° N, 77.1025° E)) lying in domain 2; (ii) hourly time-series of air temperature at three locations (Papoli (29.914° N, 79.938° E), Kathmandu (27.7172° N, 85.3240° E), Sherpagaon (28.1622° N, 85.3980° E); (iii) 2 m and surface temperatures from ERA5-Land data available at 0.1° × 0.1° resolution; (iv) rainfall estimates from Integrated Multi-satellite Retrievals for GPM (IMERG) (0.1° × 0.1°) half-hourly pass (4–6 h after the scan) [72]. Out of these four datasets (i), (iii), and (iv) were utilized for the validation of model simulations. The ERA5-Land dataset is reported to have a good correlation with in situ observations of temperature and precipitation over the high altitude Himalayan region [73,74]. IMERG precipitation estimates are reported to be relatively more consistent over the Indian region [75] for the summer monsoon season. Note that for IMERG, the satellite-gauge product is made available ~3.5 months after the observation month, using both forward and backward morphing and including monthly gauge analyses.
Two approaches have been adopted to validate the WRF model simulations with ERA5-Land. Firstly, 2 m temperature and surface temperature from ERA5-Land at the grid point (representative of ~10 km × 10 km area) nearest to the disaster site were validated against 4-grid point averaged values of those simulated by WRF model near to the site. Further, for a consistent comparison, WRF model simulations were re-gridded over the ERA5-Land data grids and the spatial distributions of these variables were analyzed.
3. Results and Discussion
3.1. Model Validation
Figure 4 shows the comparison of hourly variation of (a) surface temperature, Ts (K) and (b) 2 m air temperature, T2m (K) obtained from WRF model simulations and derived from ERA5-Land data. In each panel, the time durations of approximately three days pre- and post-event are highlighted with pink and grey rectangular boxes, respectively. The model was found to capture the diurnal variation of Ts and T2m with an acceptable range of important statistical parameters such as mean absolute bias (MAB), root mean square error (RMSE), and correlation coefficient (CC). The MAB, RMSE, and CC for T2m were found to be 2.31, 1.87, 0.86, respectively, while the values of the same statistical parameters for Ts were found to be 4.83, 3.93, and 0.82 (Table 2). Both the ERA5-Land data and model-simulated values suggest that a significant cooling occurred around the study region approximately three days prior to the event and afterwards both the temperatures increased until few hours before the event.
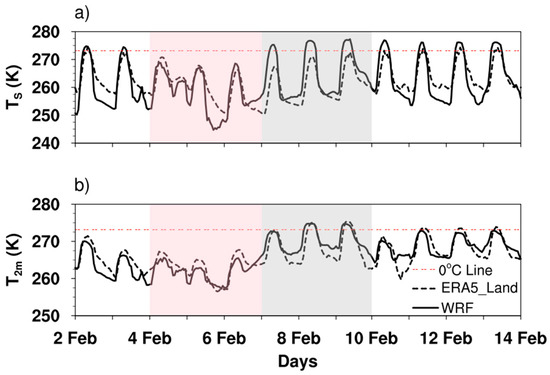
Figure 4.
Comparison of hourly variation of (a) surface temperature, Ts (K) (b) 2 m air temperature, T2m (K) obtained from WRF model simulations and ERA5-Land data. The time durations approximately 3 days pre- and post-event are highlighted with pink and grey rectangular boxes, respectively.

Table 2.
Comparison statistics for T2m. The mean absolute bias, root mean square error, and correlation coefficient are shown. Note that values shown in brackets are for corresponding statistics for Ts.
We found an excellent agreement between the model-simulated values of T2m and those derived from three meteorological stations lying in domain 2 (Figure 5), and the same was confirmed by the statistical parameters shown in Table 2. Interestingly, the model was found to capture the cooling and then warming trend recorded in all three stations. To further establish confidence in our model-simulated results, the model-simulated values of T2m and Ts from the fine resolution domain (d02) were re-gridded over ERA5-Land data grids and spatial distributions of these variables were analyzed. For brevity, we present a comparison of the spatial distribution of these variables for 4, 5, and 6 February 2021, which were found to be representative of the rest of the days (Figure 6). In this case, the model was found to capture the spatial distribution of both T2m and Ts very well, with the MAB averaged over the whole domains being 1.84 K and 2.76 K, respectively.
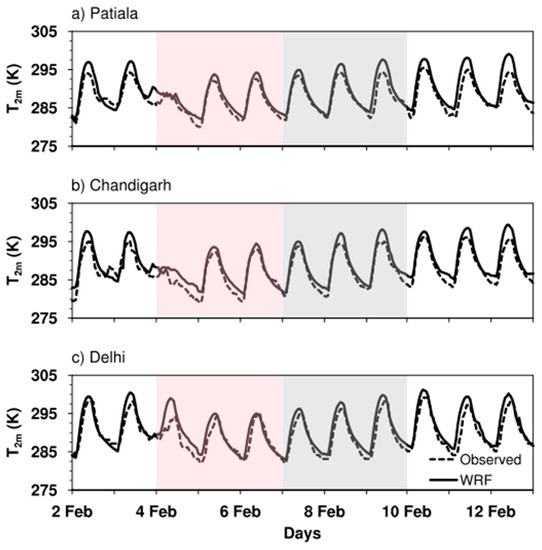
Figure 5.
Comparison of hourly variation of T2m (K) obtained from WRF model simulations with those observed at (a) Patiala, (b) Chandigarh, and (c) Delhi meteorological stations.
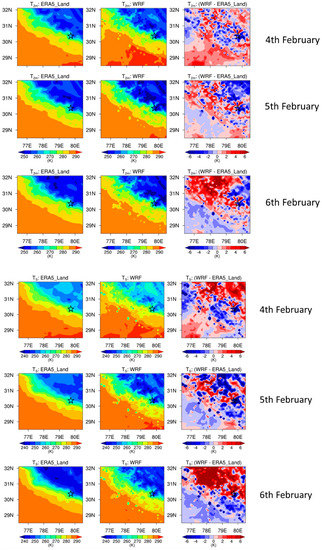
Figure 6.
Spatial distributions of 2 m air temperature, T2m (K), and surface temperature Ts (K) for 4, 5, and 6 February from ERA5-Land and WRF re-gridded values along with the corresponding changes in each parameter are shown. The symbol ☆ denotes the location of the disaster site.
We further analyzed the rainfall distribution as simulated by the WRF model and from the Global Precipitation Measurement (GPM, IMERG). Figure 7 shows the daily accumulated rainfall from the WRF model (upper panel) and the GPM (IMERG) (lower panel) on 3, 4, 5, and 6 February 2021. Notice that moderate to heavy precipitation over the region occurred on 3 and 4 February 2021, where the precipitation on 4 was more intense and widely spread across the whole domain, including the disaster site. A western disturbance passed across Kashmir and northwest India from 4 to 6 February 2021 that might have contributed to the heavy precipitation and led to high flows downstream [55]. These findings agree well with the results presented by Pandey et al. (2021), Zhou et al. (2021), and Mao et al. (2022) [53,54,76].
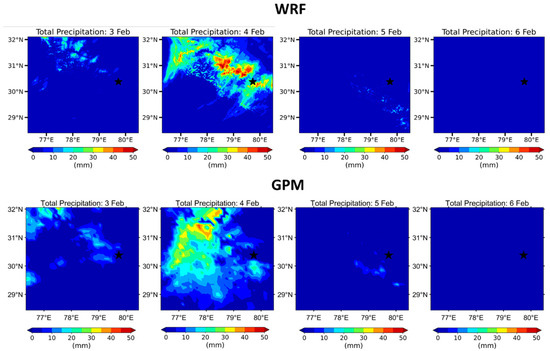
Figure 7.
Total daily accumulated rainfall simulated from WRF model and derived from GPM on 3, 4, 5 and 6 February 2021. The symbol ★ denotes the location of the disaster site.
GPM-derived rainfall distribution over the model domain was found to agree well with the WRF-derived rainfall. Both the products show the occurrence of significant rainfall around the disaster location, with a maximum rainfall of ~50 mm on 4 February. Both the GPM-derived rainfall and the model-simulated rainfall suggest that 24 h prior to the event, dry conditions prevailed over and around the disaster site. There is a slight disagreement in the exact spatial distribution of rainfall from both products. However, within the existing limitations of numerical weather prediction models, the agreement still appears to be reasonable.
3.2. Analysis of Meteorological Conditions near the Disaster Location
The analysis presented here is based on the spatial and temporal variation of parameters derived from the simulations of 12 days for inner domain d02. For the time series analysis, the model-simulated meteorological variables, e.g., air temperature, surface skin temperature, turbulent heat flux, radiative fluxes, and heat and momentum transfer coefficients, were obtained at a grid point in domain d02 nearest to the Chamoli rock-ice avalanche location, i.e., (30.37° N, 79.73° E).
Figure 8 shows the time variation of atmospheric variables such as surface temperature Ts (K), 2 m air temperature T2m (K), total (sensible + latent) heat flux (W/m2), heat transfer coefficient CH, incoming shortwave radiation SW (W/m2), outgoing longwave radiation OLR (W/m2), incoming longwave radiation at ground GLW (W/m2), 10 m wind speed U10 (m s−1), and drag coefficient CD obtained from WRF model outputs for a 12-day period at a point nearest to the disaster site (30.37° N, 79.73° E). For clarity, the time durations of approximately three days pre- and post-event are highlighted with pink and grey rectangular boxes, respectively.
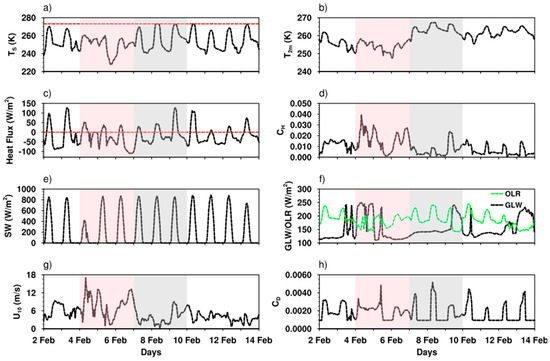
Figure 8.
Time series of (a) surface skin temperature, Ts (K), (b) 2-m air temperature, T2m (K), (c) total (sensible + latent) heat flux (W/m2), (d) heat transfer coefficient, CH, (e) incoming shortwave radiation SW (W/m2), (f) outgoing longwave radiation OLR (W/m2) and incoming longwave radiation at ground GLW (W/m2), (g) 10 m wind speed, U10 (m/s), (h) drag coefficient CD from WRF model simulations for the 2 February to 13 February 2021 period at a point in the neighborhood of the disaster site (30.37° N, 79.73° E). The time durations of approximately three days pre- and post-event are highlighted with pink and grey rectangular boxes, respectively.
The average Ts near the rock-ice avalanche site during the 48 h prior to the event (−26.08 °C) was found to be approximately 8.5 °C cooler than the average Ts post-event (−17.48 °C) (Figure 8a). The simulation results show a similar trend for T2m pre-event, which was found to be approximately 13 °C lower than that found after the event (Figure 8b). This suggests that both the surface and the air above the surface significantly cooled down within a short span of time before the event. A sudden drop in surface temperature to −45.1 °C at 1700 UTC on 5 February was observed ~36 h before the event. Mao et al. (2022) [54] have also noticed that 24 h before the event, the air temperature decreased from −10 °C to −22 °C in the first 12 h and, afterward, it increased continuously from −22 °C to −2.5 °C during the 12 h prior to the event. They have argued that the sudden increase in the temperature might have led to a reduction in the ice strength, which might have been the final trigger of the event. Pandey et al. (2021) [53] have also argued that sudden changes in the weather conditions might have affected the bedrock stability of the already destabilized rock. They have also documented that the sudden increase in temperature was ‘felt by people of nearby areas’ on and a day before the event [53]. Zhou et al. (2021) [47,76] argued that a winter warming was observed within 40 days before the event, which might have led to a winter melting. While it is not possible to validate the arguments of Zhou et al. (2021) [47,76] from our model results, our analysis based on model-simulated variables qualitatively conform the findings of Mao et al. (2022) [54] and Pandey et al. (2021) [53].
Interestingly, the air and surface temperatures did not simultaneously attain their minimum. A time delay of approximately 8 h was found when the air temperature attained its minimum value of −25.6 °C at 0100 UTC on 6 February. While the time of minimum temperature (around 06:30 Indian standard time) appears physically consistent, a dramatic fall in the surface temperature within a span of few hours during the evening to early nighttime on 5 February 2021 seems to be unusual. We speculate that an enhanced radiative cooling might have occurred due to clear sky conditions, while the downward turbulent heat transport was not strong enough to compensate for the heat loss due to surface cooling, leading to exceptionally low surface temperature. Model-simulated results also show that the downward transport of turbulent heat flux (Figure 8c) was considerably low during this period. Both the surface and air temperatures were found to have significantly deviated from their normal diurnal pattern starting from a few days before the event, and then were quickly restored to their normal diurnal patterns a few hours after the event. The air temperature quickly rose after the event, but remained well below the freezing level, while the maximum surface temperature broke the freezing point a few times after the event.
Notice that the deceasing and then increasing nature of temperature does not appear to be a model artifact, as it was captured well by the in situ observations, as well as the ERA5-Land data. We further analyzed air temperature measurements of a few additional sites, which are not necessarily available at 2 m height above the surface. We noticed that this decreasing and increasing nature was consistent with air temperature measurements at three additional locations over high-altitude regions, namely: Papoli (29.914° N, 79.938° E), Kathmandu (27.7172° N, 85.3240° E), and Sherpagaon (28.1622° N, 85.3980° E) (Figure 9).
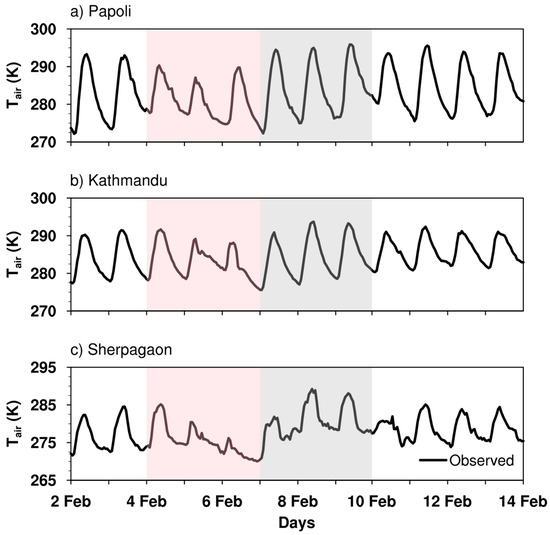
Figure 9.
Hourly variation of air temperature observed at meteorological stations at (a) Papoli (India), (b) Kathmandu (Nepal), and (c) Sherpagaon (Nepal).
We speculate that the rapid freezing that occurred days before the avalanche might have let fresh snow/ice settle over the rock mass cap. This fresh ice/snow might have melted rapidly during the event due to a sudden increase in temperature (Figure 4a and Figure 8a). However, we do not have any mechanistic evidence of freeze-thaw within the rock mass [77,78,79,80], but our analysis results reveal favorable weather conditions for its occurrence.
The total turbulent heat flux (sensible and latent heat) mostly remained downward (negative) throughout the 72 h before the event, while it had positive values (upward) for a shorter period during daytime conditions. Similar to the behavior of surface and air temperatures, the physically consistent diurnal pattern was not observed during this period. Notice that on 4 February, the heat flux showed a bi-modal distribution, attaining peak values twice. The turbulent heat flux had an exceptionally large negative value (~ −112 W/m2) just a few hours before the event, which possibly led to an increase in the surface and air temperatures from their relatively much lower values during pre-event days/hours. In general, although the value of the heat transfer coefficient became rather large during a few days before the event, the heat flux remained low due to a weak temperature gradient.
The incoming shortwave radiative flux (Figure 8e) showed a clear diurnal pattern, with nearly identical variation throughout the simulation period except on 4 February 2021, when the peak radiative flux was significantly reduced (~50%). The reduction in the peak value of incoming radiative flux suggests that cloudy conditions might have prevailed over the region on 4 February. This finding is consistent with the studies of Pandey et al. (2021) and Shrestha et al. (2021) [53,55]. The outgoing longwave radiation (OLR) and incoming longwave radiation at the ground (GLW) also captured the signal of changes in the atmospheric conditions during the few days prior to the event. While OLR was significantly reduced on the 4th and 5th and then followed its usual pattern, the GLW increased during those two days before dramatically decreasing, and remained low until a few days after the event. In terms of surface energy balance, the persistent downward transport of turbulent heat is well correlated with the differences between the OLR and GLW.
The 10 m surface wind speed, which mostly remained below 6 m/s for normal days, significantly increased during the 72 h prior to the event, reaching up to 17 m/s on 4 February and 12 m/s just 12 h before the event. No significant change was found in the nature of the surface momentum transfer coefficient throughout the simulation period around the failure site.
The results presented so far are based on the model-simulated meteorological variables over only one grid point nearest to the disaster site. To better understand possible meteorological features, we present the spatial distribution of relevant meteorological variables over an approximately 406.8 km × 415.8 km spatial region around the center point (30.27° N, 78.39° E) pre- and post-event. To analyze possible changes in meteorological conditions pre- and post-event, the time duration approximately three days prior to the event (4th, 5th, 6th) and the remaining days (2nd, 3rd, 7th, 8th, 9th, 10th, 11th, 12th, and 13th) were selected as two separate cases. The days 4, 5, and 6 were chosen as Case A, while the remaining days 2, 3, 7, 8, 9, 10, 11, 12, and 13 were chosen as Case B. The average spatial distribution of model-simulated meteorological variables in domain d02 was analyzed for both the cases to quantify differences pre-and post-event. Figure 10, Figure 11, Figure 12 and Figure 13 show the average spatial distribution of various variables for Case A and Case B; the corresponding changes in each variable between Case A and Case B are referred to as CaseA-CaseB.
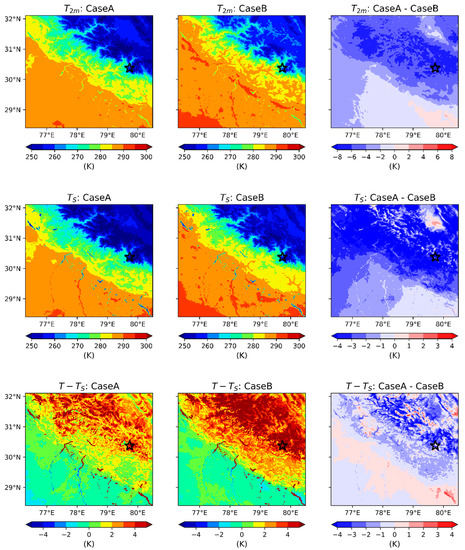
Figure 10.
Spatial distribution of 2 m air temperature, T2m (K), surface temperature Ts (K) and bulk temperature gradient T2m–Ts for Case A (4th, 5th, 6th) and Case B (2nd, 3rd, 7th, 8th, 9th, 10th, 11th, 12th, and 13th), along with the corresponding changes in each parameter between Case A and Case B, are shown. The symbol ☆ denotes the location of the disaster site.
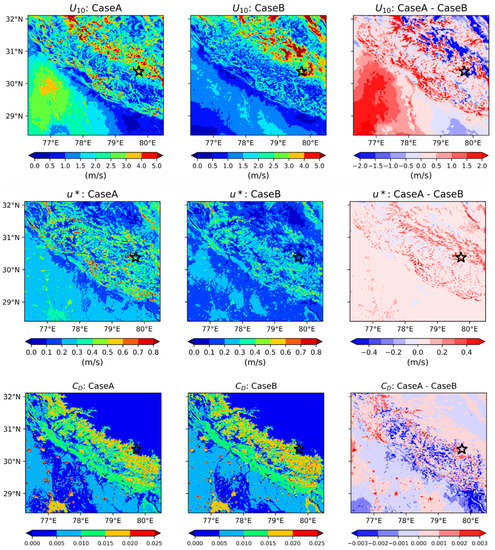
Figure 11.
Spatial distribution of 10 m wind speed U10 friction velocity u* and drag coefficient, CD for Case A (4th, 5th, 6th) and Case B (2nd, 3rd, 7th, 8th, 9th, 10th, 11th, 12th, and 13th), along with the corresponding changes in each variable between Case A and Case B, are shown. The symbol ☆ denotes the location of the disaster site.
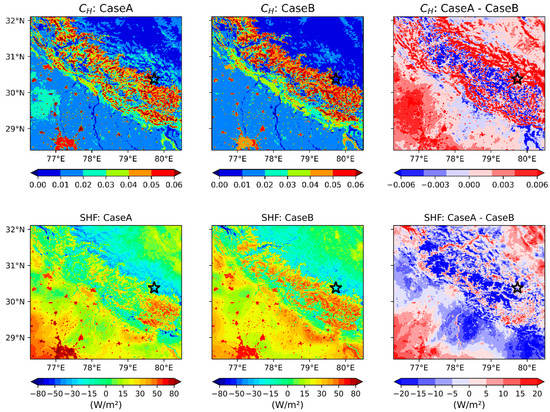
Figure 12.
Spatial distribution of heat transfer coefficient, CH, and sensible heat flux (SHF) for Case A (4th, 5th, 6th) and Case B (2nd, 3rd, 7th, 8th, 9th, 10th, 11th, 12th, and 13th), along with the corresponding changes in each parameter between Case A and Case B, are shown. The symbol ☆ denotes the location of the disaster site.
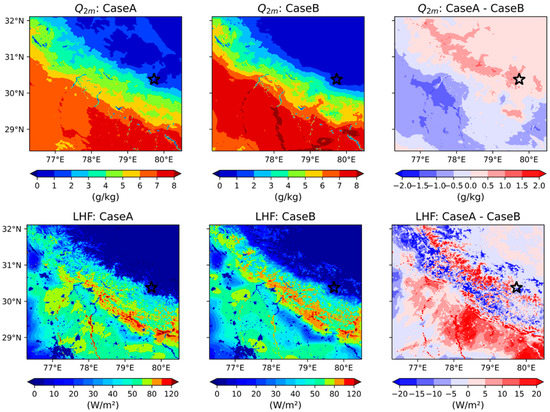
Figure 13.
Same as Figure 6, but for specific humidity, Q2m (g/kg−1) and latent heat flux (LHF) (W/m2). The symbol ☆ denotes the location of the disaster site.
It was observed that average surface and air temperature decreased significantly before the event over both the lower and higher altitude regions (Figure 10). Over the high-altitude region, the 3-day average surface (air) temperature prior to the event became ~7 °C (4 °C) lower, which shows that significant cooling observed around the avalanche site was not localized, but persisted over a much larger area. The 3-day average bulk temperature gradient (T2m–Ts) became relatively weak (Figure 10) before the event over the high-altitude region. U10 was increased prior to the event over both the lower and higher altitude regions (Figure 11), and the increase in winds was more pronounced over lower altitudes. u* was also significantly increased before the event over the whole domain. In contrast, CD was increased around the site, but did not show any clear pattern over the other areas in the simulation domain.
The 3-day average turbulent sensible heat flux (SHF) decreased before the event over higher altitude regions and largely remained downward (negative), which is consistent with the conclusions drawn using model results at a particular grid point near the failure site (Figure 8c). The SHF increased over the lower altitude land regions and mostly remained upward (positive) (Figure 12).
The 3-day average surface specific humidity was found to have increased before the event over higher altitude regions, while it decreased over the lower altitude land regions (Figure 13). The magnitude of latent heat flux (LHF) was quite low over the whole high-altitude region, while it remained high over lower altitudes, with no clear pattern of change observed post- and pre-event.
Figure 14 shows composite wind field (a) averaged over 4, 5, and 6 February 2021 and (b) 2, 3, 7, 8, 9, 10, 11, 12, and 13 February 2021. Notice that northwesterly winds mostly prevailed during the 3 days prior to the event and remained relatively strong over lower altitude regions as compared to higher altitudes.
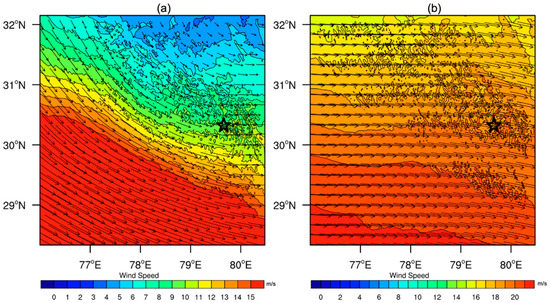
Figure 14.
Composite wind field at 400 hPa (a) averaged over 4, 5, and 6 February 2021 (Case A) and (b) 2, 3, 7, 8, 9, 10, 11, 12, and 13 February 2021 (Case B). The symbol ☆ denotes the location of the disaster site.
Post-event winds were largely westerlies and relatively stronger over both lower and higher altitude regions. Figure 15 shows the wind field on the day of the event, e.g., 7 February 2021 at (a) 00 UTC, (b) 06 UTC, (c) 12 UTC, and (d) 18 UTC. Notice that 400 hPa winds around the disaster site were very strong a few hours before and after the event (00 UTC and 06 UTC) and were predominately blowing from North, slowly becoming north-northwesterly after 12 UTC and 18 UTC on 7 February.
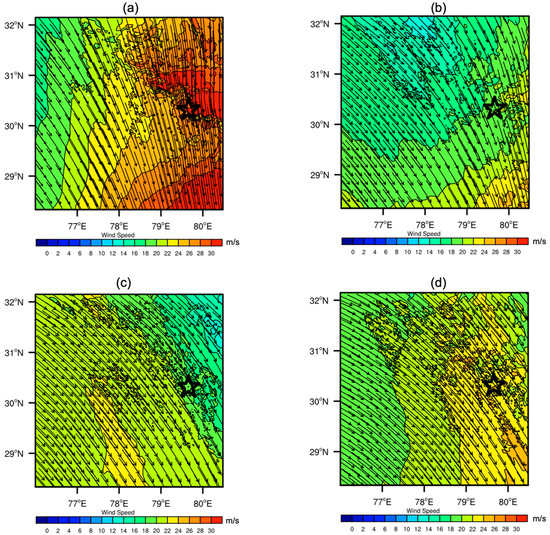
Figure 15.
Wind field for 7 February 2021 at (a) 00 UTC, (b) 06 UTC, (c) 12 UTC, and (d) 18 UTC. The symbol ☆ denotes the location of the disaster site.
The analysis presented here using the spatial distribution of meteorological variables and wind patterns suggests that the changes noticed pre- and post-disaster event around the Chamoli disaster site were not localized and correlated with similar changes found over a much larger area. Note that events such as this could result due to a complex interaction of various earth and atmospheric components such as geological conditions, seismic activity, changes in the geometrical structure of the rock, thermal regime changes of the rock body, changes in surface/air temperature, and solid as well as liquid precipitation. It is hard to delineate the impact of each component on the development of failure at the site. Further, due to our limited understanding of the complex high-altitude region, it is hard to deterministically quantify the role of factors responsible for such types of events. Additionally, we would like to point out that the WRF model has some limitations in simulating meteorological features over complex terrain. However, it is still used for operational weather forecasting and is simultaneously being improved continuously via ongoing studies over complex terrain. Further studies in this direction are desirable.
4. Conclusions
A timely forecast of weather and climate change-induced extreme events over the complex topographical region such as the Indian Himalayas is required to minimize the human and infrastructural loss caused by these events. In the absence of a dense observational network for understanding the possible meteorological feedback, we have adopted an alternative approach and used community numerical weather forecast models to numerically simulate meteorological conditions during the Chamoli rock-ice avalanche event that took place in the Chamoli District of Uttarakhand, India on 7 February 2021. We have presented the meteorological conditions that developed within a few days prior to the event, which might have been additional triggering factors behind this event. The numerical simulations were carried out over a period of 2 weeks (2 February to 13 February 2021).
Our simulation results show that starting from 72 h until a few hours before the Chamoli rock-ice avalanche event, there was a noticeable deviation in the usual nature of relevant meteorological variables, e.g., surface and air temperatures, turbulent and radiative fluxes, and upper wind patterns, over a larger area around the disaster location. A significant cooling of the surface as well as the overlying atmosphere was found to have occurred 48 h prior to the event. The surface temperature was found to be approximately 8.5 °C cooler during the 3 days prior to the event compared to rest of the days, and rose dramatically starting a few hours before the event up to the time of the event. The 2 m air temperature found to have a similar pattern and reported to be approximately 13 °C cooler compared to that observed during the remaining model simulation days. Model-simulated rainfall and Global Precipitation Measurement Mission-derived rainfall suggest that this part of the Himalayan region received a significant amount of rainfall 2 days prior to the event. In contrast, the rest of pre- and post-event days mostly remained dry.
The present analysis suggests that sudden unusual cooling and significant rainfall a few days before the event and persistently strong northwesterly winds might have worked as an additional contributing factor behind the Chamoli rock-ice avalanche event. This study explicitly presents out the meteorological conditions that prevailed during, before, and after the rock-ice avalanche event to better understand the weather conditions as a possible triggering factor. Our results may be helpful in further studies to find the possible trigger mechanisms of the event with regards to the freezing and thawing of rock masses.
Author Contributions
P.S. undertook the conceptualization, methodology, validation, and writing—original draft; P.S. and P.N. analyzed the model simulation results. P.K.S. analyzed the GPM data and undertook the writing—review and editing. All authors have read and agreed to the published version of the manuscript.
Funding
This work is supported by the Inspire Faculty Fellowship to PS from the Department of Science and Technology (DST), Government of India (DST/INSPIRE/04/2019/003125).
Institutional Review Board Statement
Not applicable.
Informed Consent Statement
Not applicable.
Data Availability Statement
Not applicable.
Acknowledgments
This work is supported by Inspire Faculty Fellowship to P.S. from the Department of Science and Technology (DST), Government of India (DST/INSPIRE/04/2019/003125). The authors acknowledge the computing facility provided by ICC and CoEDMM, IIT Roorkee, which was useful for conducting this study. Authors recognize the Real-time Asian Meteorological Observatory (REAMO) for providing data on Kathmandu and Sherpagaon (Nepal), and the Central Pollution Control Board, India, for providing data from meteorological stations at Patiala, Chandigarh, and Delhi. The meteorological data of (Papoli) Kosi-Katarmal, Almora, India, were collected and compiled using resources of a NMHS, MoEFCC, GoI, funded project (ID:NMHS_SM_MG_64) and shared with Sumit Sen, Department of Hydrology, IIT Roorkee, India, as a research partner. The weather profiler at Almora was established by CSIR 4-PI, Bangaluru, India, in collaboration with GBPNIHE, Almora. The Director, GBPNIHE, Almora is acknowledged for allowing the use of the meteorological data through research collaboration between GBPNIHE and IIT Roorkee. We thank S Srikrishnan, CoEDMM, IIT Roorkee, for the useful discussion.
Conflicts of Interest
The authors declare no conflict of interest.
Abbreviations
| Abbreviation | Meaning |
| WRF | Weather Research and Forecasting |
| T2m | 2 Meter Air Temperature (K) |
| Ts | Surface/Skin Temperature (K) |
| ERA5-Land | ECMWF Reanalysis v3 Land |
| GPM | Global Precipitation Measurement |
| IMERG | Integrated Multi-satellitE Retrievals for GPM |
| CFSR | Climate Forecast System Reanalysis |
| ECMWF | European Centre for Medium-Range Weather Forecasts |
| IMD | India Meteorological Department |
| JJAS | June-July-August-September |
| masl | Meters Above Sea Level |
| hPa | Hectopascal |
| USGS | United States Geological Survey |
| LULC | Land Use and Land Cover |
| ISRO | Indian Space Research Organisation |
| AWiFS | Advanced Wide Field Sensor |
| GMTED2010 | Global Multi-resolution Terrain Elevation Data 2010 |
| YSU | Yonsei University |
| PBL | Planetary Boundary Layer |
| RRMT | Rapid Radiative Transfer Model |
| MAB | Mean Absolute Bias |
| RMSE | Root Mean Square Error |
| CH | Heat Transfer Coefficient |
| CD | Drag Coefficient |
| SW | Shortwave |
| OLR | Outgoing Longwave Radiation (W/m2) |
| GLW | Ground Longwave |
| U10 | 10 m Wind Speed (m/s) |
| u* | Friction Velocity (m/s) |
| SHF | Sensible Heat Flux (W/m2) |
| LHF | Latent Heat Flux (W/m2) |
| q2m | Specific Humidity at 2 m |
References
- Arora, M.; Singh, P.; Goel, N.K.; Singh, R.D. Spatial Distribution and Seasonal Variability of Rainfall in a Mountainous Basin in the Himalayan Region. Water Resour. Manag. 2006, 20, 489–508. [Google Scholar] [CrossRef]
- Devrani, R.; Singh, V.; Mudd, S.M.; Sinclair, H.D. Prediction of flash flood hazard impact from Himalayan river profiles. Geophys. Res. Lett. 2015, 42, 5888–5894. [Google Scholar] [CrossRef]
- Asthana, A.K.L.; Sah, M.P. Landslides and cloudbursts in the Mandakini Basin of Garhwal Himalaya. Himal. Geol. 2007, 28, 59–67. [Google Scholar]
- Islam, M.A.; Chattoraj, S.L.; Ray, P.K. Ukhimath landslide 2012 at Uttarakhand, India: Causes and consequences. Int. J. Geomat. Geosci. 2014, 4, 544–557. [Google Scholar]
- Dikshit, A.; Sarkar, R.; Pradhan, B.; Segoni, S.; Alamri, A.M. Rainfall Induced Landslide Studies in Indian Himalayan Region: A Critical Review. Appl. Sci. 2020, 10, 2466. [Google Scholar] [CrossRef]
- Das, S.; Ashrit, R.; Moncrieff, M.W. Simulation of a Himalayan cloudburst event. J. Earth Syst. Sci. 2006, 115, 299–313. [Google Scholar] [CrossRef]
- Dimri, A.P.; Chevuturi, A.; Niyogi, D.; Thayyen, R.J.; Ray, K.; Tripathi, S.N.; Pandey, A.K.; Mohanty, U.C. Cloudbursts in Indian Himalayas: A review. Earth-Sci. Rev. 2017, 168, 1–23. [Google Scholar] [CrossRef]
- Kumar, P.; Shukla, B.P.; Sharma, S.; Kishtawal, C.M.; Pal, P.K. A high-resolution simulation of catastrophic rainfall over Uttarakhand, India. Nat. Hazards 2016, 80, 1119–1134. [Google Scholar] [CrossRef]
- Dobriyal, M.; Bijalwan, A. Forest fire in western Himalayas of India: A review. N. Y. Sci. J. 2017, 10, 39–46. [Google Scholar]
- Dubey, S.; Goyal, M.K. Glacial Lake Outburst Flood Hazard, Downstream Impact, and Risk Over the Indian Himalayas. Water Resour. Res. 2020, 56, e2019WR026533. [Google Scholar] [CrossRef]
- Liu, J.; Wu, Y.; Gao, X. Increase in occurrence of large glacier-related landslides in the high mountains of Asia. Sci. Rep. 2021, 11, 1635. [Google Scholar] [CrossRef]
- Goswami, B.N.; Venugopal, V.; Sengupta, D.; Madhusoodanan, M.S.; Xavier, P.K. Increasing Trend of Extreme Rain Events Over India in a Warming Environment. Science 2006, 314, 1442–1445. [Google Scholar] [CrossRef] [PubMed]
- López-Moreno, J.I.; Pomeroy, J.W.; Morán-Tejeda, E.; Revuelto, J.; Navarro-Serrano, F.M.; Vidaller, I.; Alonso-González, E. Changes in the frequency of global high mountain rain-on-snow events due to climate warming. Environ. Res. Lett. 2021, 16, 094021. [Google Scholar] [CrossRef]
- IPCC. Climate Change 2021: The Physical Science Basis. Contribution of Working Group I to the Sixth Assessment Report of the Intergovernmental Panel on Climate Change; Masson-Delmotte, V., Zhai, P., Pirani, A., Connors, S.L., Péan, C., Berger, S., Caud, N., Chen, Y., Goldfarb, L., Gomis, M.I., et al., Eds.; Cambridge University Press: Cambridge, UK, 2021; in press. [Google Scholar]
- Richardson, S.D.; Reynolds, J.M. An overview of glacial hazards in the Himalayas. Quat. Int. 2000, 65–66, 31–47. [Google Scholar] [CrossRef]
- Nie, Y.; Liu, Q.; Wang, J.; Zhang, Y.; Sheng, Y.; Liu, S. An inventory of historical glacial lake outburst floods in the Himalayas based on remote sensing observations and geomorphological analysis. Geomorphology 2018, 308, 91–106. [Google Scholar] [CrossRef]
- Shugar, D.H.; Burr, A.; Haritashya, U.K.; Kargel, J.S.; Watson, C.S.; Kennedy, M.C.; Bevington, A.R.; Betts, R.A.; Harrison, S.; Strattman, K. Rapid worldwide growth of glacial lakes since 1990. Nat. Clim. Chang. 2020, 10, 939–945. [Google Scholar] [CrossRef]
- King, O.; Bhattacharya, A.; Bhambri, R.; Bolch, T. Glacial lakes exacerbate Himalayan glacier mass loss. Sci. Rep. 2019, 9, 18145. [Google Scholar] [CrossRef]
- Rinzin, S.; Zhang, G.; Wangchuk, S. Glacial Lake Area Change and Potential Outburst Flood Hazard Assessment in the Bhutan Himalaya. Front. Earth Sci. 2021, 9, 1136. [Google Scholar] [CrossRef]
- Chevuturi, A.; Dimri, A.P.; Das, S.; Kumar, A.; Niyogi, D. Numerical simulation of an intense precipitation event over Rudraprayag in the central Himalayas during 13–14 September 2012. J. Earth Syst. Sci. 2015, 124, 1545–1561. [Google Scholar] [CrossRef]
- Singh, R.; Siingh, D.; Gokani, S.A.; Sreeush, M.G.; Buchunde, P.S.; Maurya, A.K.; Singh, R.P.; Singh, A.K. Brief Communication: Climatic, meteorological and topographical causes of the 16–17 June 2013 Kedarnath (India) natural disaster event. Nat. Hazards Earth Syst. Sci. 2015, 15, 1597–1601. [Google Scholar] [CrossRef]
- Sati, S.P.; Sundriyal, Y.P.; Rana, N.; Dangwal, S. Recent landslides in Uttarakhand: Nature’s fury or human folly. Curr. Sci. 2011, 100, 1617–1620. [Google Scholar]
- Naithani, A.K.; Rawat, G.S.; Nawani, P.C. Investigation of landslide events on 12th July 2007 due to cloudburst in Chamoli district, Uttarakhand, India. Int. J. Earth Sci. Eng. 2011, 4, 777–786. [Google Scholar]
- Bhan, S.C.; Devrani, A.K.; Sinha, V. An analysis of monthly rainfall and the meteorological conditions associated with cloudburst over the dry region of Leh (Ladakh), India. Mausam 2015, 66, 107–122. [Google Scholar] [CrossRef]
- Allen, S.K.; Rastner, P.; Arora, M.; Huggel, C.; Stoffel, M. Lake outburst and debris flow disaster at Kedarnath, June 2013: Hydrometeorological triggering and topographic predisposition. Landslides 2016, 13, 1479–1491. [Google Scholar] [CrossRef]
- Raymond, C.; Horton, R.M.; Zscheischler, J.; Martius, O.; AghaKouchak, A.; Balch, J.; Bowen, S.G.; Camargo, S.J.; Hess, J.; Kornhuber, K.; et al. Understanding and managing connected extreme events. Nat. Clim. Chang. 2020, 10, 611–621. [Google Scholar] [CrossRef]
- Saha, S.; Moorthi, S.; Pan, H.-L.; Wu, X.; Wang, J.; Nadiga, S.; Tripp, P.; Kistler, R.; Woollen, J.; Behringer, D.; et al. The NCEP Climate Forecast System Reanalysis. Bull. Am. Meteorol. Soc. 2010, 91, 1015–1058. [Google Scholar] [CrossRef]
- Copernicus Climate Change Service (C3S). ERA5: Fifth generation of ECMWF atmospheric reanalyses of the global climate. Copernic. Clim. Chang. Serv. Clim. Data Store 2017, 15, 2020. [Google Scholar]
- Pattnayak, K.C.; Panda, S.K.; Saraswat, V.; Dash, S.K. How good is regional climate model version 4 in simulating the monsoon onset over Kerala? Int. J. Climatol. 2019, 39, 2197–2208. [Google Scholar] [CrossRef]
- Pattnayak, K.C.; Panda, S.K.; Saraswat, V.; Dash, S.K. Assessment of two versions of regional climate model in simulating the Indian Summer Monsoon over South Asia CORDEX domain. Clim. Dyn. 2018, 50, 3049–3061. [Google Scholar] [CrossRef]
- Skamarock, W.C.; Klemp, J.B.; Dudhia, J.; Gill, D.O.; Liu, Z.; Berner, J.; Wang, W.; Powers, J.G.; Duda, M.G.; Barker, D.M. A description of the advanced research WRF model version 4. Natl. Cent. Atmos. Res. Boulder CO USA 2019, 145, 145. [Google Scholar]
- Mohan, M.; Sati, A.P. WRF model performance analysis for a suite of simulation design. Atmos. Res. 2016, 169, 280–291. [Google Scholar] [CrossRef]
- Sati, A.P.; Mohan, M. The impact of urbanization during half a century on surface meteorology based on WRF model simulations over National Capital Region, India. Theor. Appl. Climatol. 2018, 134, 309–323. [Google Scholar] [CrossRef]
- Kumar, A.; Jiménez, R.; Belalcázar, L.C.; Rojas, N.Y. Application of WRF-Chem Model to Simulate PM10 Concentration over Bogota. Aerosol Air Qual. Res. 2016, 16, 1206–1221. [Google Scholar] [CrossRef]
- Gochis, D.J.; Barlage, M.; Dugger, A.; FitzGerald, K.; Karsten, L.; McAllister, M.; McCreight, J.; Mills, J.; RafieeiNasab, A.; Read, L. The WRF-Hydro Modeling System Technical Description, Version 5.0. 2020. Available online: https://ral.ucar.edu/projects/wrf_hydro/technical-description-user-guide (accessed on 1 January 2022).
- Sun, M.; Li, Z.; Yao, C.; Liu, Z.; Wang, J.; Hou, A.; Zhang, K.; Huo, W.; Liu, M. Evaluation of Flood Prediction Capability of the WRF-Hydro Model Based on Multiple Forcing Scenarios. Water 2020, 12, 874. [Google Scholar] [CrossRef]
- Coen, J.L.; Cameron, M.; Michalakes, J.; Patton, E.G.; Riggan, P.J.; Yedinak, K.M. WRF-Fire: Coupled Weather–Wildland Fire Modeling with the Weather Research and Forecasting Model. J. Appl. Meteorol. Climatol. 2013, 52, 16–38. [Google Scholar] [CrossRef]
- Tallapragada, V.; Bernardet, L.; Biswas, M.K.; Ginis, I.; Kwon, Y.; Liu, Q.; Marchok, T.; Sheinin, D.; Thomas, B.; Tong, M.; et al. Hurricane Weather Research and Forecasting (HWRF) Model: 2015 Scientific Documentation. Dev. Testbed Cent. 2015, 113, 99. [Google Scholar]
- Zhang, J.A.; Kalina, E.A.; Biswas, M.K.; Rogers, R.F.; Zhu, P.; Marks, F.D. A Review and Evaluation of Planetary Boundary Layer Parameterizations in Hurricane Weather Research and Forecasting Model Using Idealized Simulations and Observations. Atmosphere 2020, 11, 1091. [Google Scholar] [CrossRef]
- Krishnamurti, T.N.; Kumar, V.; Simon, A.; Thomas, A.; Bhardwaj, A.; Das, S.; Senroy, S.; Roy Bhowmik, S.K. March of buoyancy elements during extreme rainfall over India. Clim. Dyn. 2017, 48, 1931–1951. [Google Scholar] [CrossRef]
- Kotal, S.D.; Roy, S.S.; Bhowmik, S.K.R. Catastrophic heavy rainfall episode over Uttarakhand during 16–18 June 2013–observational aspects. Curr. Sci. 2014, 234–245. [Google Scholar]
- Chaudhuri, C.; Tripathi, S.; Srivastava, R.; Misra, A. Observation- and numerical-analysis-based dynamics of the Uttarkashi cloudburst. Ann. Geophys. 2015, 33, 671–686. [Google Scholar] [CrossRef]
- Zhang, Y.; Hemperly, J.; Meskhidze, N.; Skamarock, W.C. The Global Weather Research and Forecasting (GWRF) Model: Model Evaluation, Sensitivity Study, and Future Year Simulation. Atmos. Clim. Sci. 2012, 2, 231–253. [Google Scholar] [CrossRef][Green Version]
- Hsiao, L.-F.; Chen, D.-S.; Kuo, Y.-H.; Guo, Y.-R.; Yeh, T.-C.; Hong, J.-S.; Fong, C.-T.; Lee, C.-S. Application of WRF 3DVAR to Operational Typhoon Prediction in Taiwan: Impact of Outer Loop and Partial Cycling Approaches. Weather Forecast. 2012, 27, 1249–1263. [Google Scholar] [CrossRef]
- Powers, J.G.; Klemp, J.B.; Skamarock, W.C.; Davis, C.A.; Dudhia, J.; Gill, D.O.; Coen, J.L.; Gochis, D.J.; Ahmadov, R.; Peckham, S.E.; et al. The Weather Research and Forecasting Model: Overview, System Efforts, and Future Directions. Bull. Am. Meteorol. Soc. 2017, 98, 1717–1737. [Google Scholar] [CrossRef]
- Benjamin, S.G.; Weygandt, S.S.; Brown, J.M.; Hu, M.; Alexander, C.R.; Smirnova, T.G.; Olson, J.B.; James, E.P.; Dowell, D.C.; Grell, G.A.; et al. A North American Hourly Assimilation and Model Forecast Cycle: The Rapid Refresh. Mon. Weather Rev. 2016, 144, 1669–1694. [Google Scholar] [CrossRef]
- Zhuo, L.; Dai, Q.; Han, D.; Chen, N.; Zhao, B. Assessment of simulated soil moisture from WRF Noah, Noah-MP, and CLM land surface schemes for landslide hazard application. Hydrol. Earth Syst. Sci. 2019, 23, 4199–4218. [Google Scholar] [CrossRef]
- Nuryanto, D.E.; Fajariana, Y.; Pradana, R.P.; Anggraeni, R.; Badri, I.U.; Sopaheluwakan, A. Modeling of Heavy Rainfall Triggering Landslide Using WRF Model. Agromet 2020, 34, 55–65. [Google Scholar] [CrossRef]
- Nuryanto, D.E.; Satyaningsih, R.; Nuraini, T.A.; Fajariana, Y.; Anggraeni, R.; Sopaheluwakan, A.; Yuliyanti, M.S. Prediction of soil moisture and rainfall induced landslides: A comparison of several PBL parameters in the WRF model. IOP Conf. Ser. Earth Environ. Sci. 2021, 893, 12025. [Google Scholar] [CrossRef]
- Susandi, A.; Tamamadin, M.; Pratama, A.; Faisal, I.; Wijaya, A.R.; Pratama, A.F.; Pandini, O.P.; Widiawan, D.A. Development of Hydro-Meteorological Hazard Early Warning System in Indonesia. J. Eng. Technol. Sci. 2018, 50, 461–468. [Google Scholar] [CrossRef]
- Shugar, D.H.; Jacquemart, M.; Shean, D.; Bhushan, S.; Upadhyay, K.; Sattar, A.; Schwanghart, W.; McBride, S.; de Vries, M.V.W.; Mergili, M.; et al. A massive rock and ice avalanche caused the 2021 disaster at Chamoli, Indian Himalaya. Science 2021, 373, 300–306. [Google Scholar] [CrossRef]
- Thayyen, R.J.; Mishra, P.K.; Jain, S.K.; Wani, J.M.; Singh, H.; Singh, M.K.; Yadav, B. Hanging glacier avalanche (Raunthigad—Rishiganga) and Debris flow disaster of 7th February 2021, Uttarakhand, India, A Preliminary assessment. Nat. Hazards 2022, in press. [Google Scholar] [CrossRef]
- Pandey, P.; Chauhan, P.; Bhatt, C.M.; Thakur, P.K.; Kannaujia, S.; Dhote, P.R.; Roy, A.; Kumar, S.; Chopra, S.; Bhardwaj, A.; et al. Cause and Process Mechanism of Rockslide Triggered Flood Event in Rishiganga and Dhauliganga River Valleys, Chamoli, Uttarakhand, India Using Satellite Remote Sensing and in situ Observations. J. Indian Soc. Remote Sens. 2021, 49, 1011–1024. [Google Scholar] [CrossRef]
- Mao, W.; Wu, L.; Singh, R.P.; Qi, Y.; Xie, B.; Liu, Y.; Ding, Y.; Zhou, Z.; Li, J. Progressive destabilization and triggering mechanism analysis using multiple data for Chamoli rockslide of 7 February 2021. Geomat. Nat. Hazards Risk 2022, 13, 35–53. [Google Scholar] [CrossRef]
- Arun, B.S.; Steiner, J.; Nepal, S.; Maharjan, S.B.; Jackson, M.; Rasul, G.; Bajracharya, B. Understanding the Chamoli Flood: Cause, Process, Impacts, and Context of Rapid Infrastructure Development. 2021. Available online: https://www.icimod.org/article/understanding-the-chamoli-flood-cause-process-impacts-and-context-of-rapid-infrastructure-development (accessed on 1 January 2022).
- Valdiya, K.S. Emergence and evolution of Himalaya: Reconstructing history in the light of recent studies. Prog. Phys. Geogr. Earth Environ. 2002, 26, 360–399. [Google Scholar] [CrossRef]
- Martha, T.R.; Roy, P.; Jain, N.; Vinod Kumar, K.; Reddy, P.S.; Nalini, J.; Sharma, S.V.; Shukla, A.K.; Durga Rao, K.H.; Narender, B.; et al. Rock avalanche induced flash flood on 07 February 2021 in Uttarakhand, India—A photogeological reconstruction of the event. Landslides 2021, 18, 2881–2893. [Google Scholar] [CrossRef]
- Pandey, V.K.; Kumar, R.; Singh, R.; Kumar, R.; Rai, S.C.; Singh, R.P.; Tripathi, A.K.; Soni, V.K.; Ali, S.N.; Tamang, D.; et al. Catastrophic ice-debris flow in the Rishiganga River, Chamoli, Uttarakhand (India). Geomat. Nat. Hazards Risk 2022, 13, 289–309. [Google Scholar] [CrossRef]
- Jiang, R.; Zhang, L.; Peng, D.; He, X.; He, J. The Landslide Hazard Chain in the Tapovan of the Himalayas on 7 February 2021. Geophys. Res. Lett. 2021, 48, e2021GL093723. [Google Scholar] [CrossRef]
- Biswadip, G. IRS-P6 AWiFS Derived Gridded Land Use/Land Cover Data Compatible to Mesoscale Models (MM5 and WRF) over Indian Region; NRSC Technical Document No. NRSC-ECSA-ACSG-OCT-2014-TR-651; NRSC: Hyderabad, India, 2014. [Google Scholar]
- Danielson, J.J.; Gesch, D.B. Global Multi-Resolution Terrain Elevation Data 2010 (GMTED2010); US Department of the Interior, US Geological Survey: Washington, DC, USA, 2011.
- Jiménez, P.A.; Dudhia, J.; González-Rouco, J.F.; Navarro, J.; Montávez, J.P.; García-Bustamante, E. A Revised Scheme for the WRF Surface Layer Formulation. Mon. Weather Rev. 2012, 140, 898–918. [Google Scholar] [CrossRef]
- Srivastava, P.; Sharan, M.; Kumar, M. A note on surface layer parameterizations in the weather research and forecast model. Dyn. Atmos. Ocean. 2021, 96, 101259. [Google Scholar] [CrossRef]
- Hong, S.-Y.; Noh, Y.; Dudhia, J. A New Vertical Diffusion Package with an Explicit Treatment of Entrainment Processes. Mon. Weather Rev. 2006, 134, 2318–2341. [Google Scholar] [CrossRef]
- Jiménez, P.A.; Dudhia, J. Improving the Representation of Resolved and Unresolved Topographic Effects on Surface Wind in the WRF Model. J. Appl. Meteorol. Climatol. 2012, 51, 300–316. [Google Scholar] [CrossRef]
- Niu, G.-Y.; Yang, Z.-L.; Mitchell, K.E.; Chen, F.; Ek, M.B.; Barlage, M.; Kumar, A.; Manning, K.; Niyogi, D.; Rosero, E.; et al. The community Noah land surface model with multiparameterization options (Noah-MP): 1. Model description and evaluation with local-scale measurements. J. Geophys. Res. 2011, 116, D12109. [Google Scholar] [CrossRef]
- Thompson, G.; Field, P.R.; Rasmussen, R.M.; Hall, W.D. Explicit Forecasts of Winter Precipitation Using an Improved Bulk Microphysics Scheme. Part II: Implementation of a New Snow Parameterization. Mon. Weather Rev. 2008, 136, 5095–5115. [Google Scholar] [CrossRef]
- Dudhia, J. Numerical Study of Convection Observed during the Winter Monsoon Experiment Using a Mesoscale Two-Dimensional Model. J. Atmos. Sci. 1989, 46, 3077–3107. [Google Scholar] [CrossRef]
- Mlawer, E.J.; Taubman, S.J.; Brown, P.D.; Iacono, M.J.; Clough, S.A. Radiative transfer for inhomogeneous atmospheres: RRTM, a validated correlated-k model for the longwave. J. Geophys. Res. Atmos. 1997, 102, 16663–16682. [Google Scholar] [CrossRef]
- Norris, J.; Carvalho, L.M.V.; Jones, C.; Cannon, F.; Bookhagen, B.; Palazzi, E.; Tahir, A.A. The spatiotemporal variability of precipitation over the Himalaya: Evaluation of one-year WRF model simulation. Clim. Dyn. 2017, 49, 2179–2204. [Google Scholar] [CrossRef]
- Kain, J.S.; Fritsch, J.M. Convective Parameterization for Mesoscale Models: The Kain-Fritsch Scheme. In The Representation of Cumulus Convection in Numerical Models; American Meteorological Society: Boston, MA, USA, 1993; pp. 165–170. [Google Scholar]
- Huffman, G.J.; Stocker, E.F.; Bolvin, D.T.; Nelkin, E.J.; Tan, J. GPM IMERG Final Precipitation L3 Half Hourly 0.1 degree x 0.1 degree V06. 2019. Available online: https://disc.gsfc.nasa.gov/datasets/GPM_3IMERGHH_06/summary (accessed on 1 January 2022).
- Chen, Y.; Sharma, S.; Zhou, X.; Yang, K.; Li, X.; Niu, X.; Hu, X.; Khadka, N. Spatial performance of multiple reanalysis precipitation datasets on the southern slope of central Himalaya. Atmos. Res. 2021, 250, 105365. [Google Scholar] [CrossRef]
- Azam, M.F.; Srivastava, S. Mass balance and runoff modelling of partially debris-covered Dokriani Glacier in monsoon-dominated Himalaya using ERA5 data since 1979. J. Hydrol. 2020, 590, 125432. [Google Scholar] [CrossRef]
- Mitra, A.K.; Kaushik, N.; Kumar Singh, A.; Parihar, S.; Bhan, S.C. Evaluation of INSAT-3D satellite derived precipitation estimates for heavy rainfall events and its validation with gridded GPM (IMERG) rainfall dataset over the Indian region. Remote Sens. Appl. Soc. Environ. 2018, 9, 91–99. [Google Scholar] [CrossRef]
- Zhou, Y.; Li, X.; Zheng, D.; Li, Z.; An, B.; Wang, Y.; Jiang, D.; Su, J.; Cao, B. The joint driving effects of climate and weather changes caused the Chamoli glacier-rock avalanche in the high altitudes of the India Himalaya. Sci. China Earth Sci. 2021, 64, 1909–1921. [Google Scholar] [CrossRef]
- McColl, S.T.; Davies, T.R. Evidence for a rock-avalanche origin for ‘The Hillocks’ “moraine”, Otago, New Zealand. Geomorphology 2011, 127, 216–224. [Google Scholar] [CrossRef]
- Ballantyne, C.K.; Sandeman, G.F.; Stone, J.O.; Wilson, P. Rock-slope failure following Late Pleistocene deglaciation on tectonically stable mountainous terrain. Quat. Sci. Rev. 2014, 86, 144–157. [Google Scholar] [CrossRef]
- Grämiger, L.M.; Moore, J.R.; Gischig, V.S.; Loew, S. Thermomechanical Stresses Drive Damage of Alpine Valley Rock Walls During Repeat Glacial Cycles. J. Geophys. Res. Earth Surf. 2018, 123, 2620–2646. [Google Scholar] [CrossRef]
- Fan, X.; Yunus, A.P.; Yang, Y.-H.; Srikrishnan, S.S.; Zou, C.; Dai, L.; Dou, X.; Narayana, A.C.; Avtar, R.; Xu, Q.; et al. Imminent Threat of Rock-Ice Avalanches in High Mountain Asia. SSRN Electron. J. 2021, in press. [Google Scholar] [CrossRef]
Publisher’s Note: MDPI stays neutral with regard to jurisdictional claims in published maps and institutional affiliations. |
© 2022 by the authors. Licensee MDPI, Basel, Switzerland. This article is an open access article distributed under the terms and conditions of the Creative Commons Attribution (CC BY) license (https://creativecommons.org/licenses/by/4.0/).