
Odour Emissions from Livestock Buildings


Abstract
1. Introduction
2. Materials and Methods
2.1. Studied Buildings
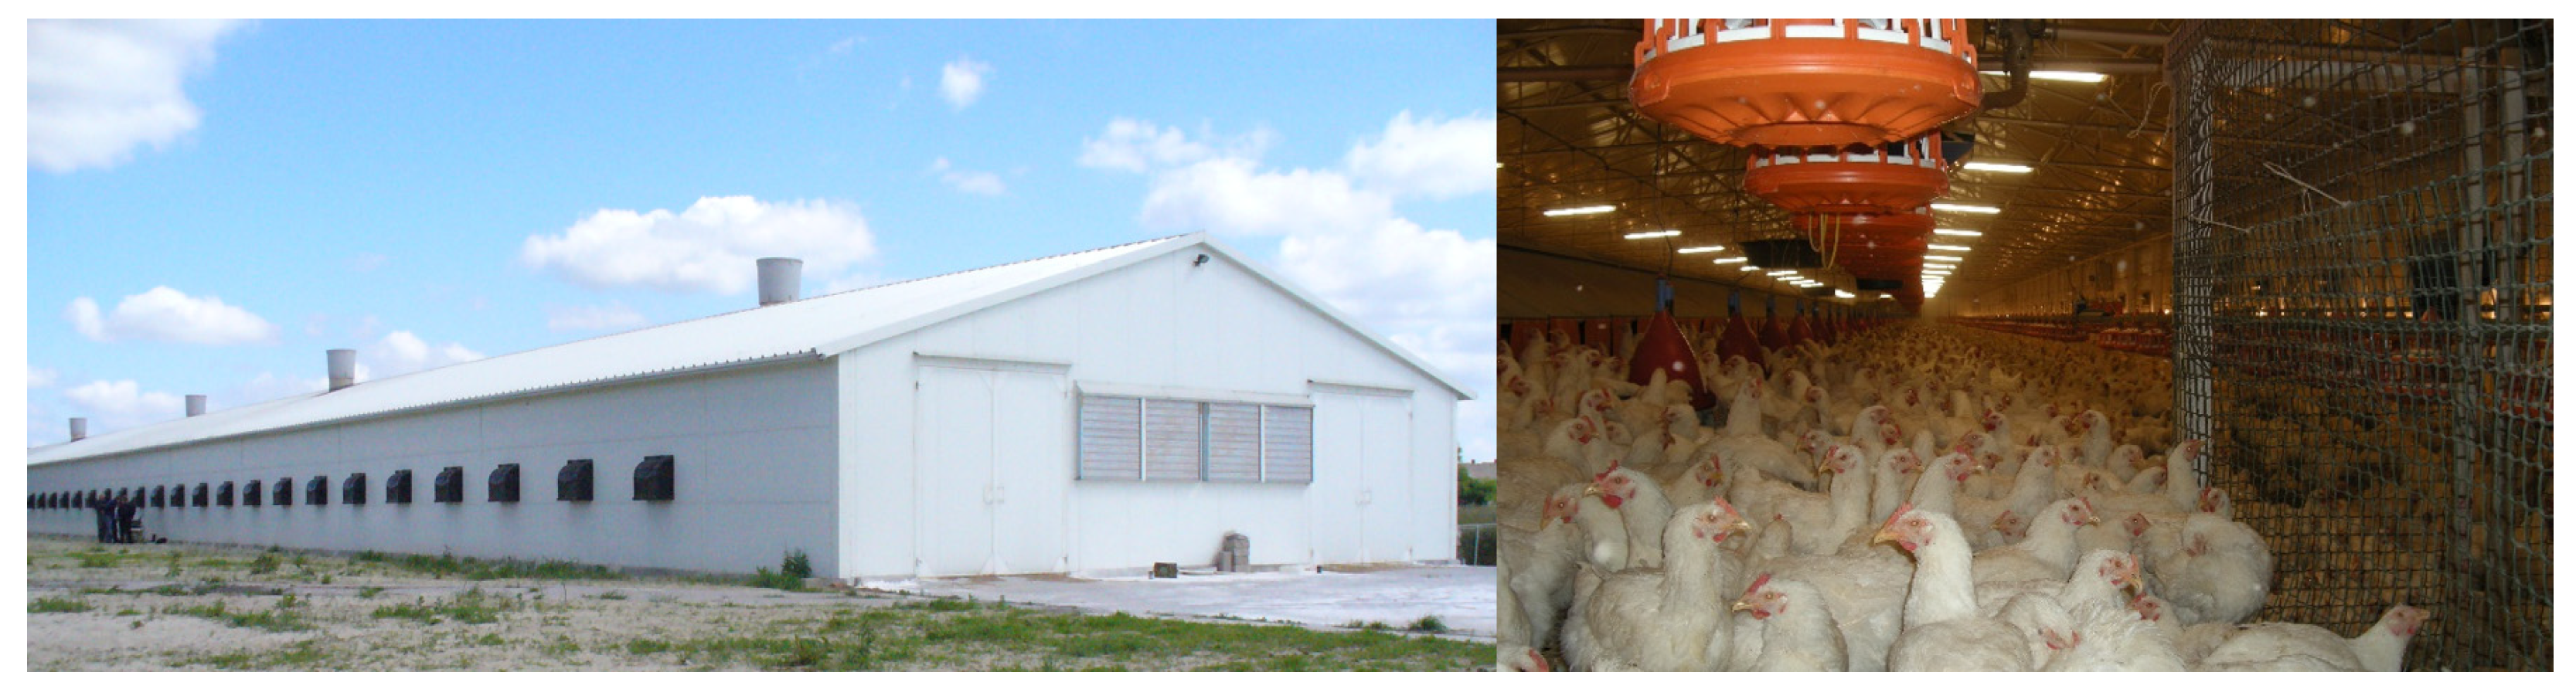
2.1.1. Breeding Hens
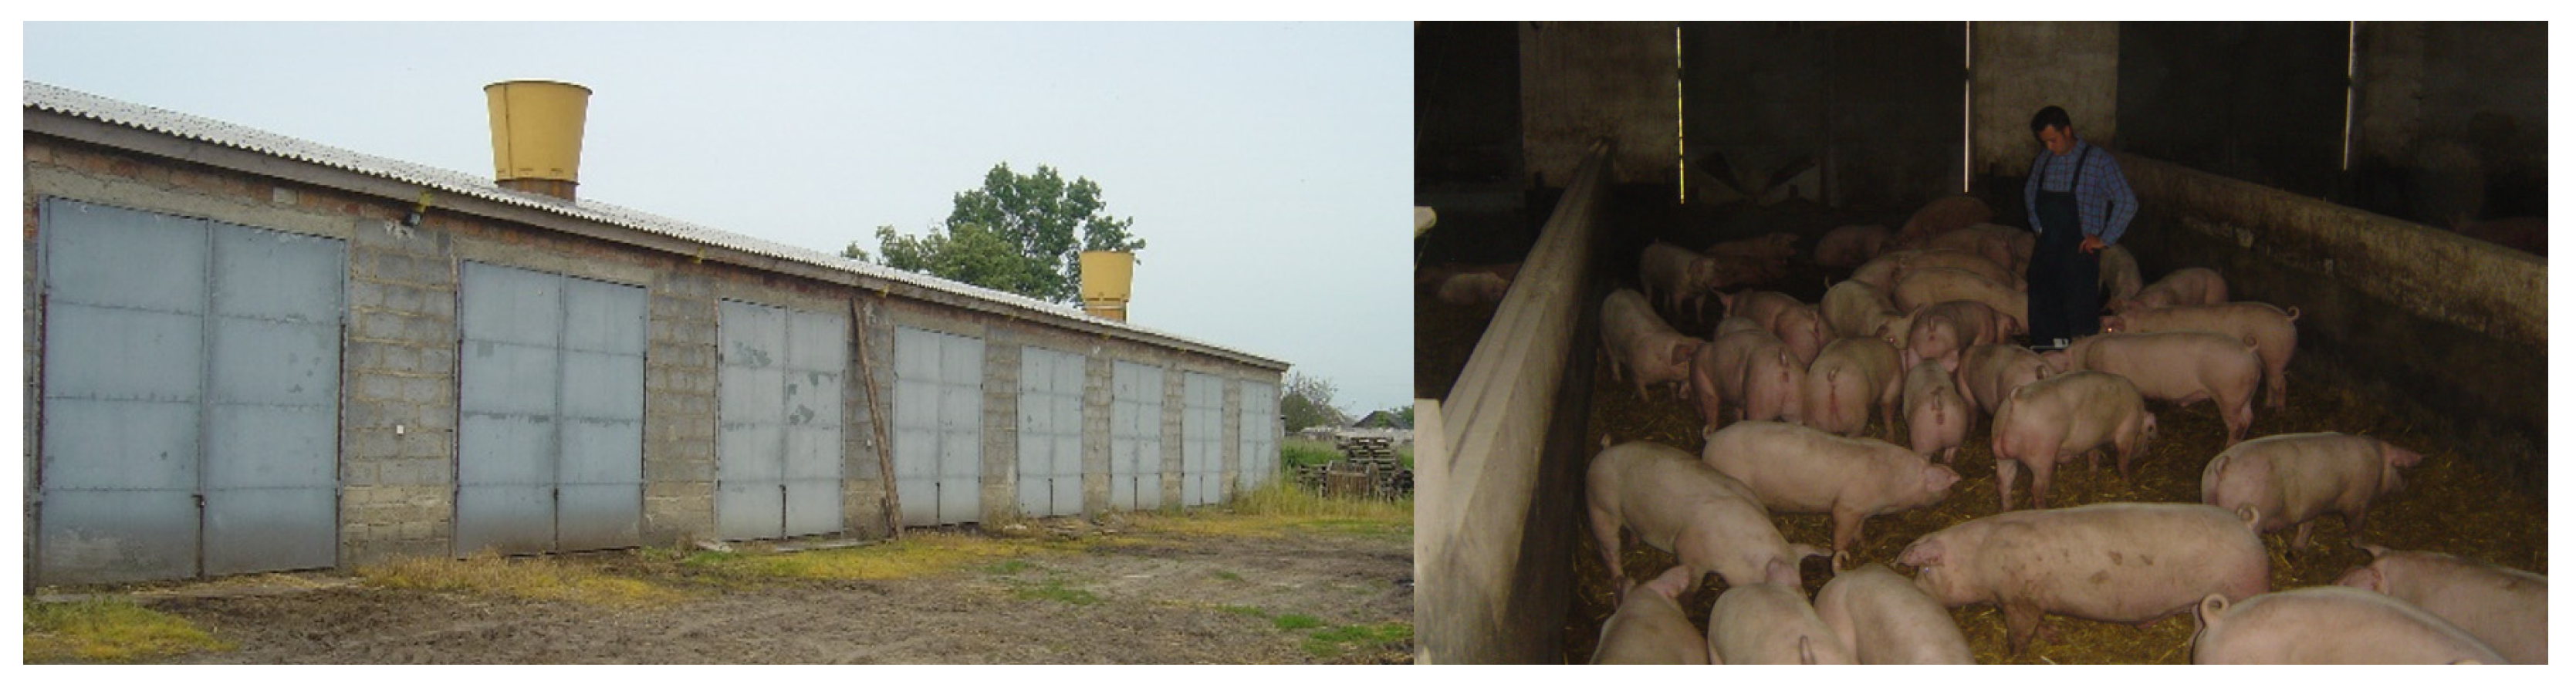
2.1.2. Fattening Pigs
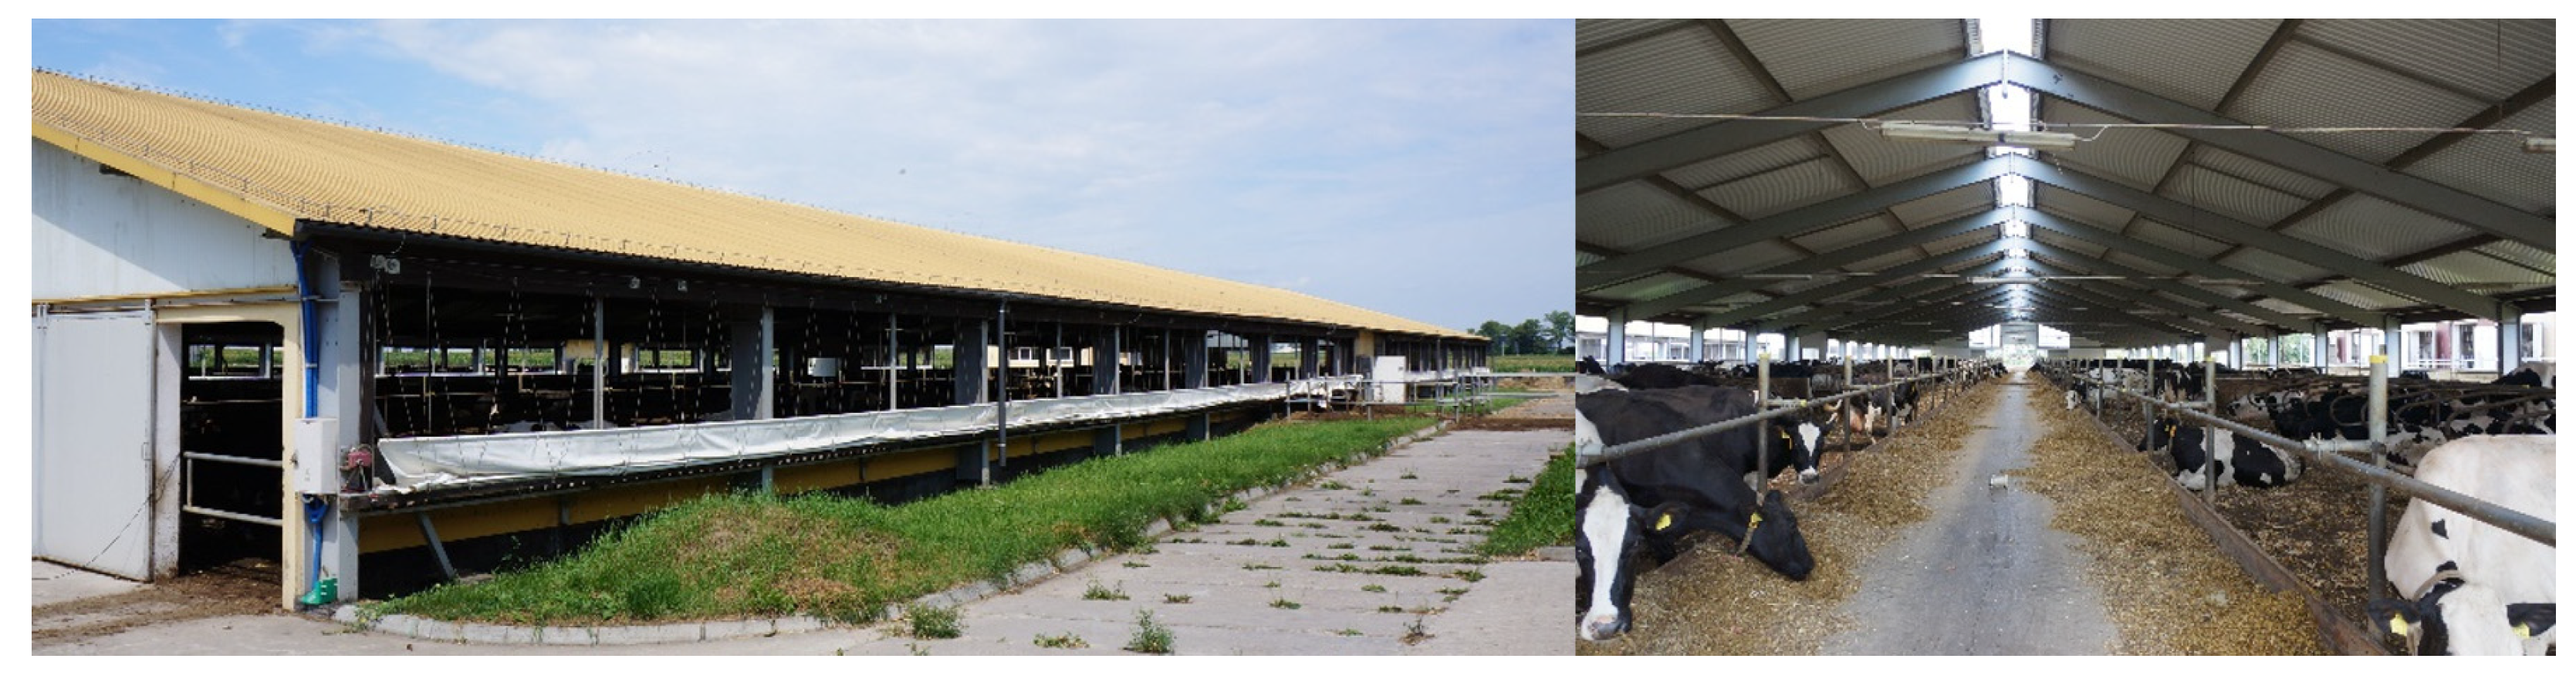
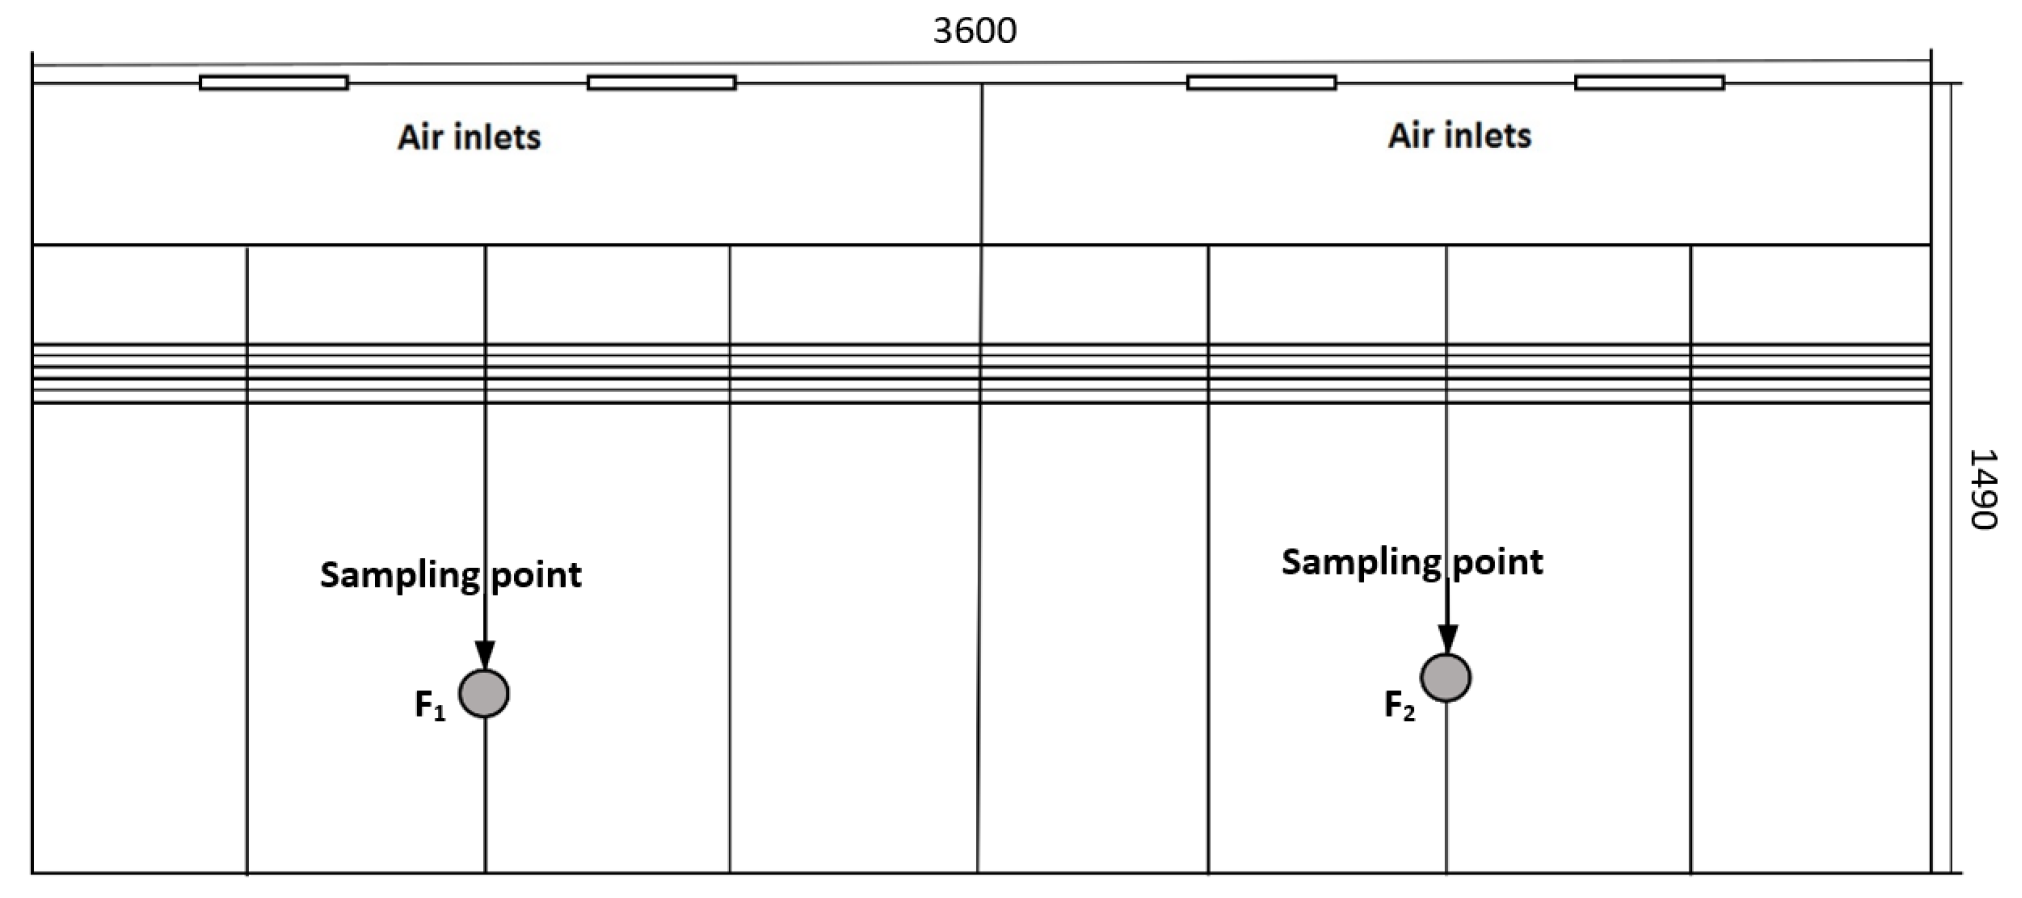
2.1.3. Dairy Cows
2.2. Ventilation Rate
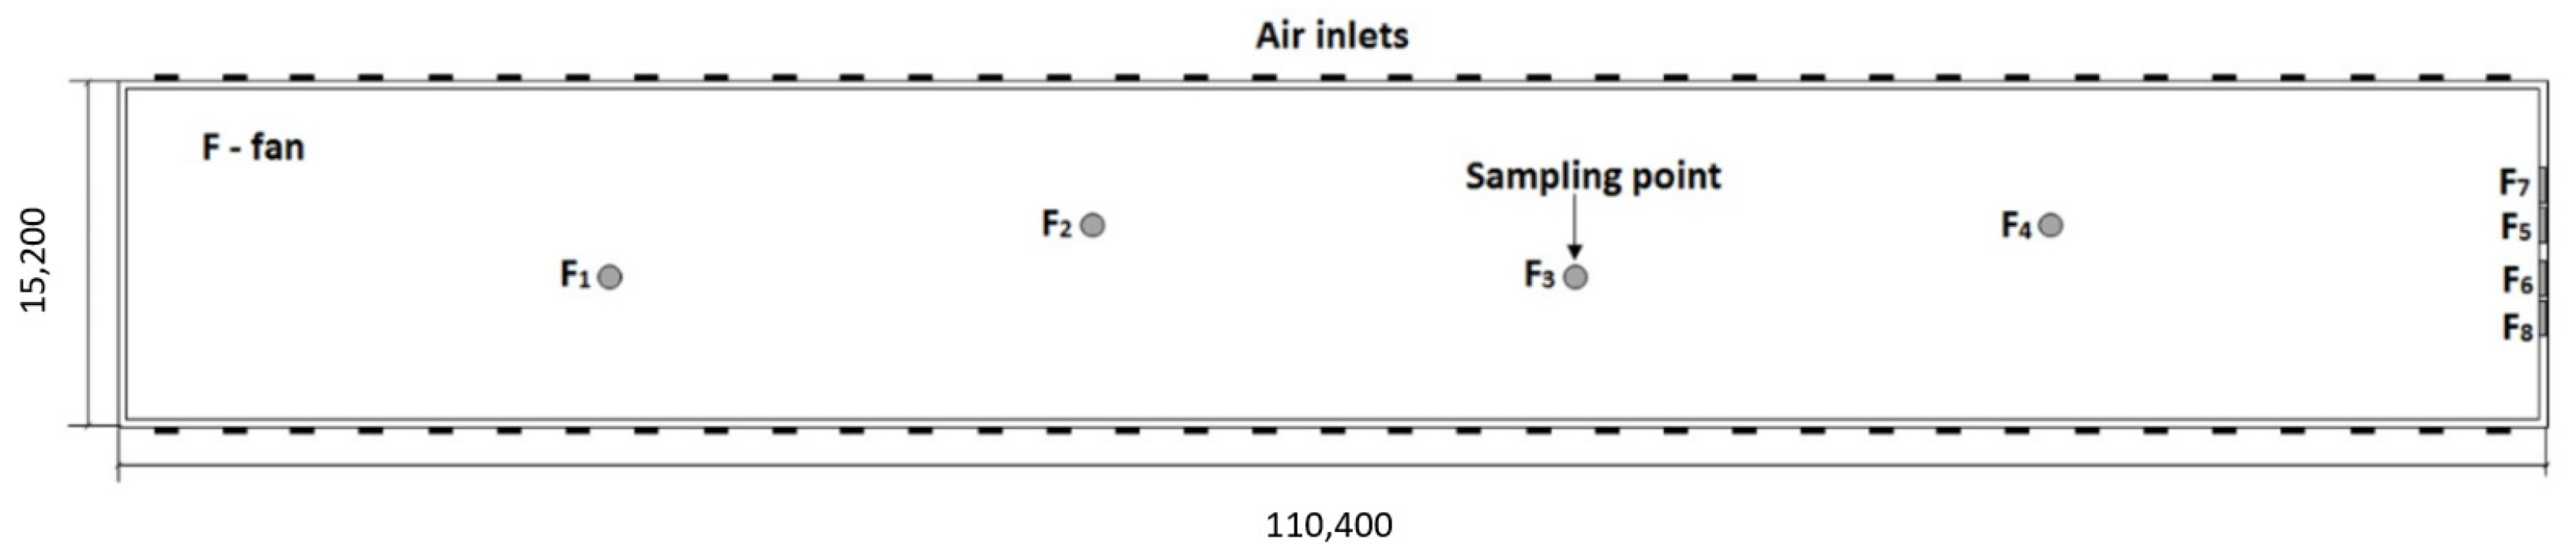
2.2.1. Breeding Hens
2.2.2. Fattening Pigs
2.2.3. Dairy Cows
2.2.4. Odour Concentration and Emission
3. Results
3.1. Breeding Hens
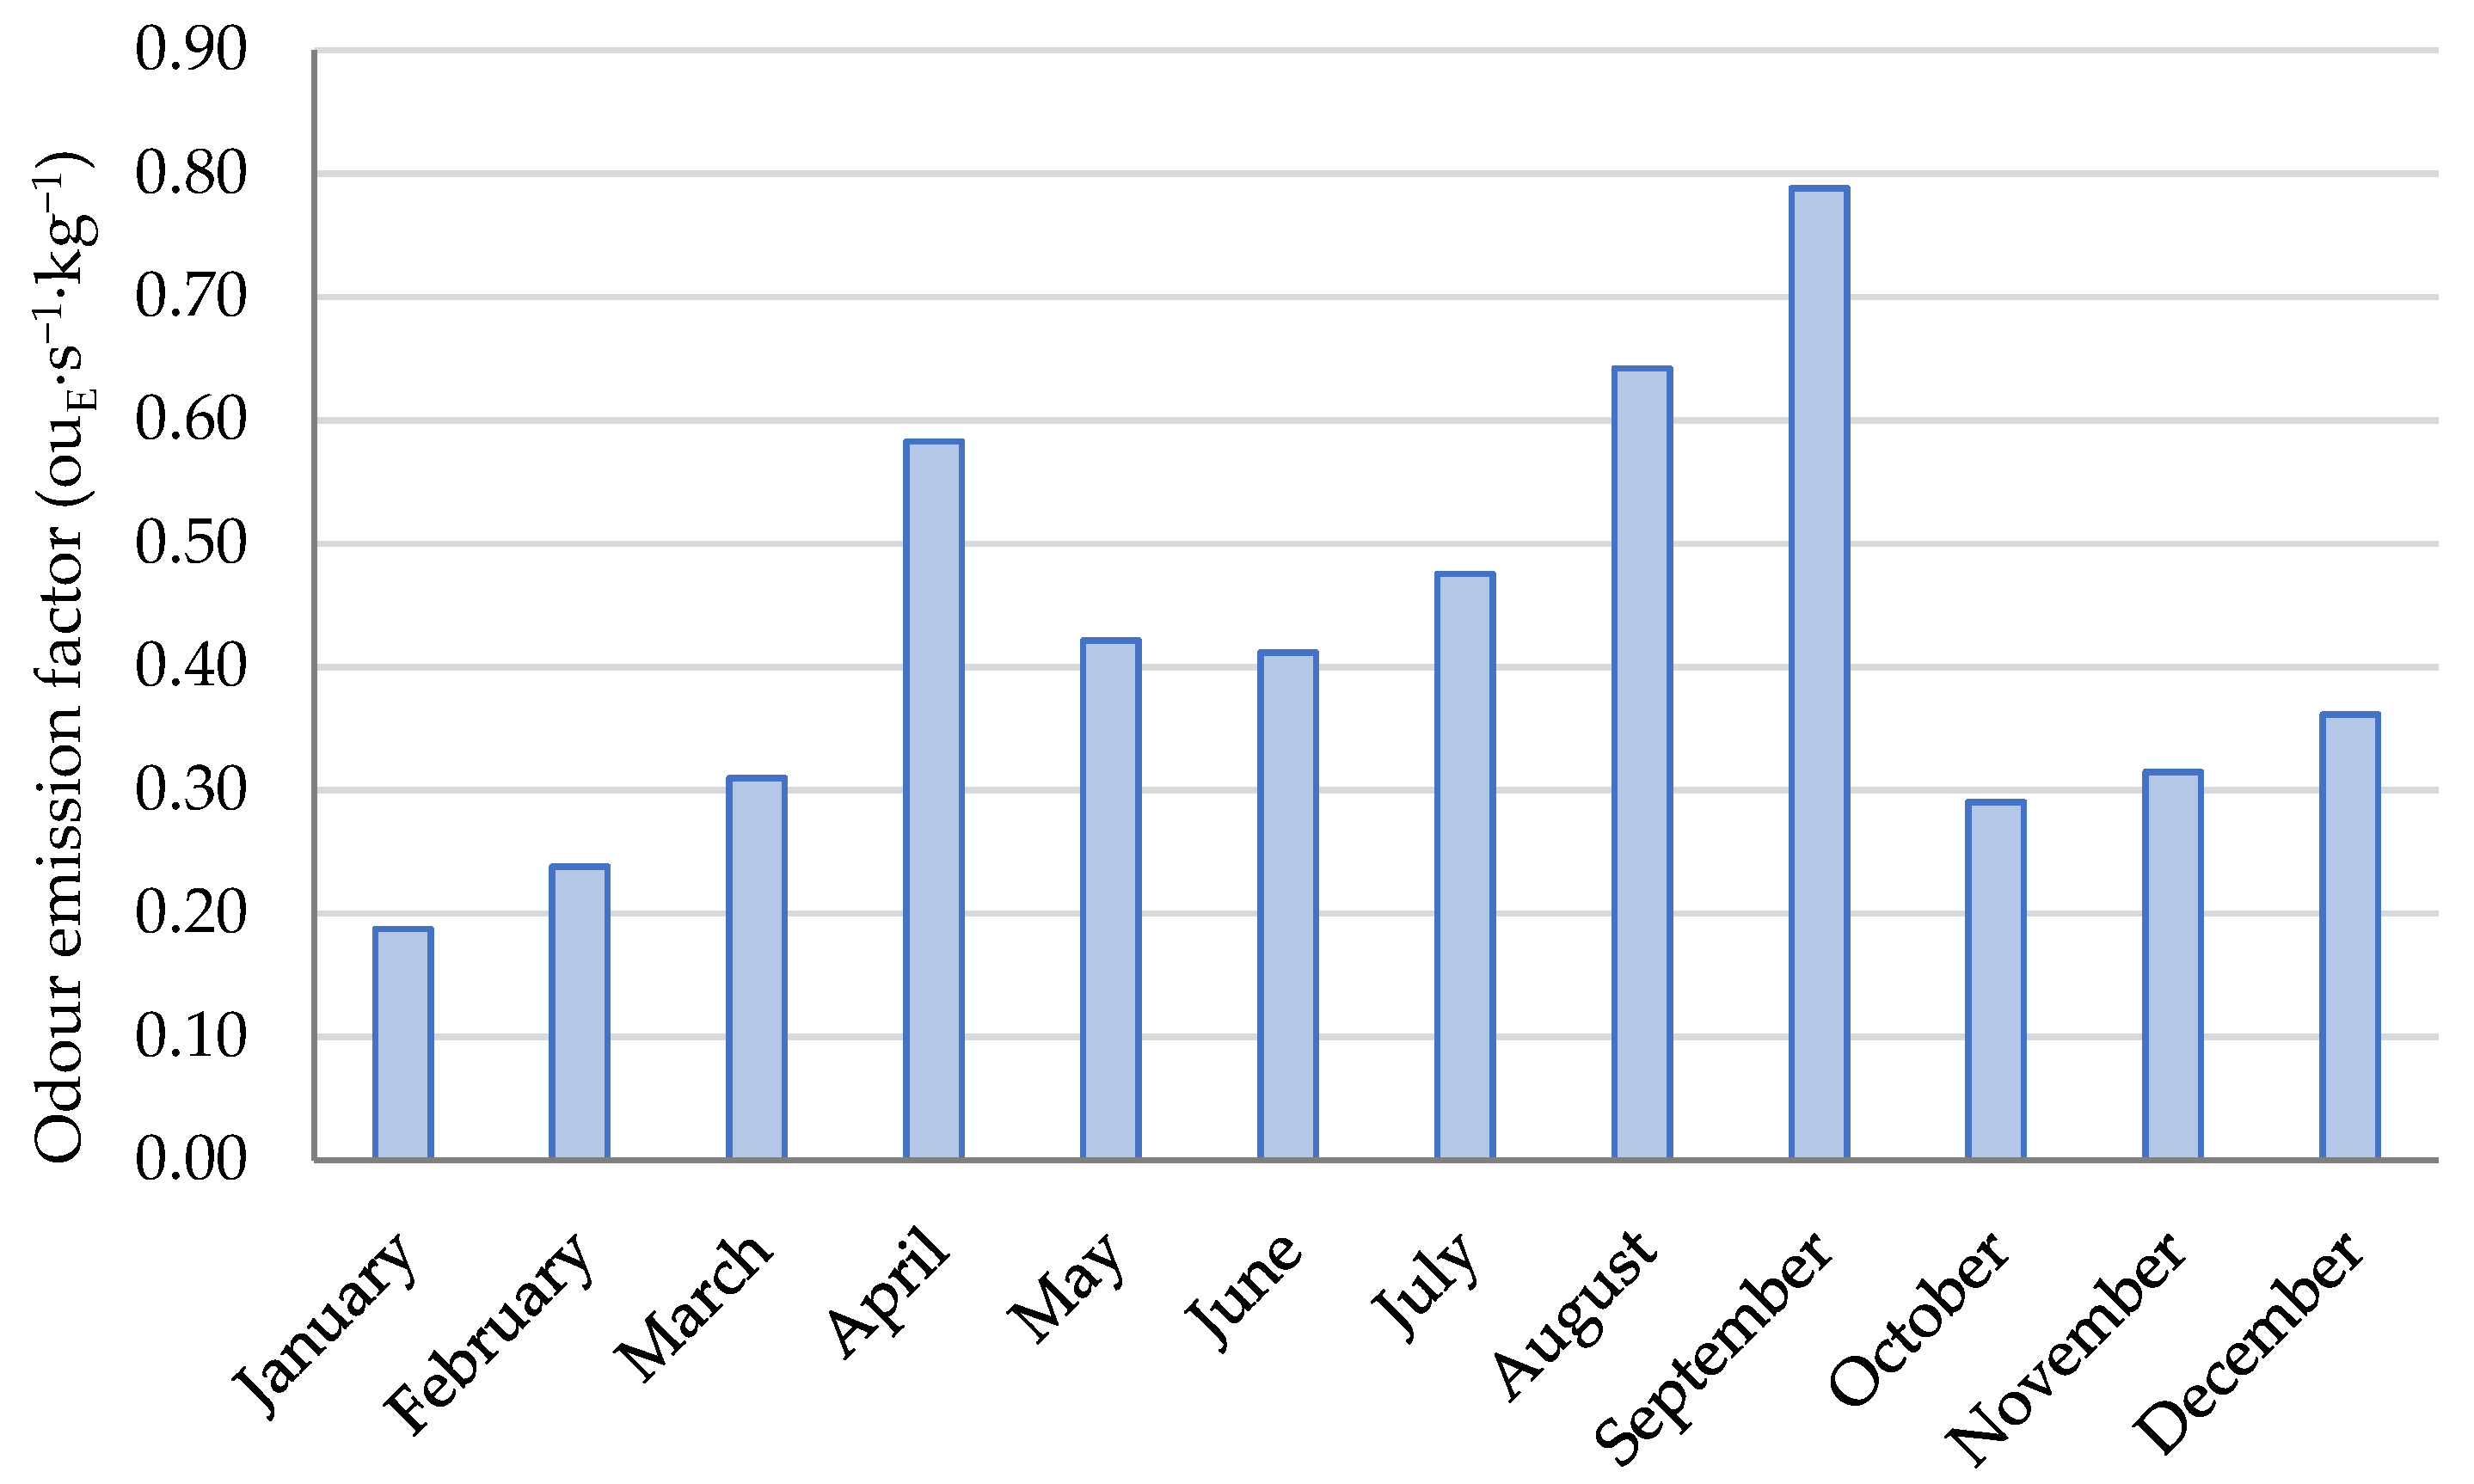
3.2. Fattening Pigs
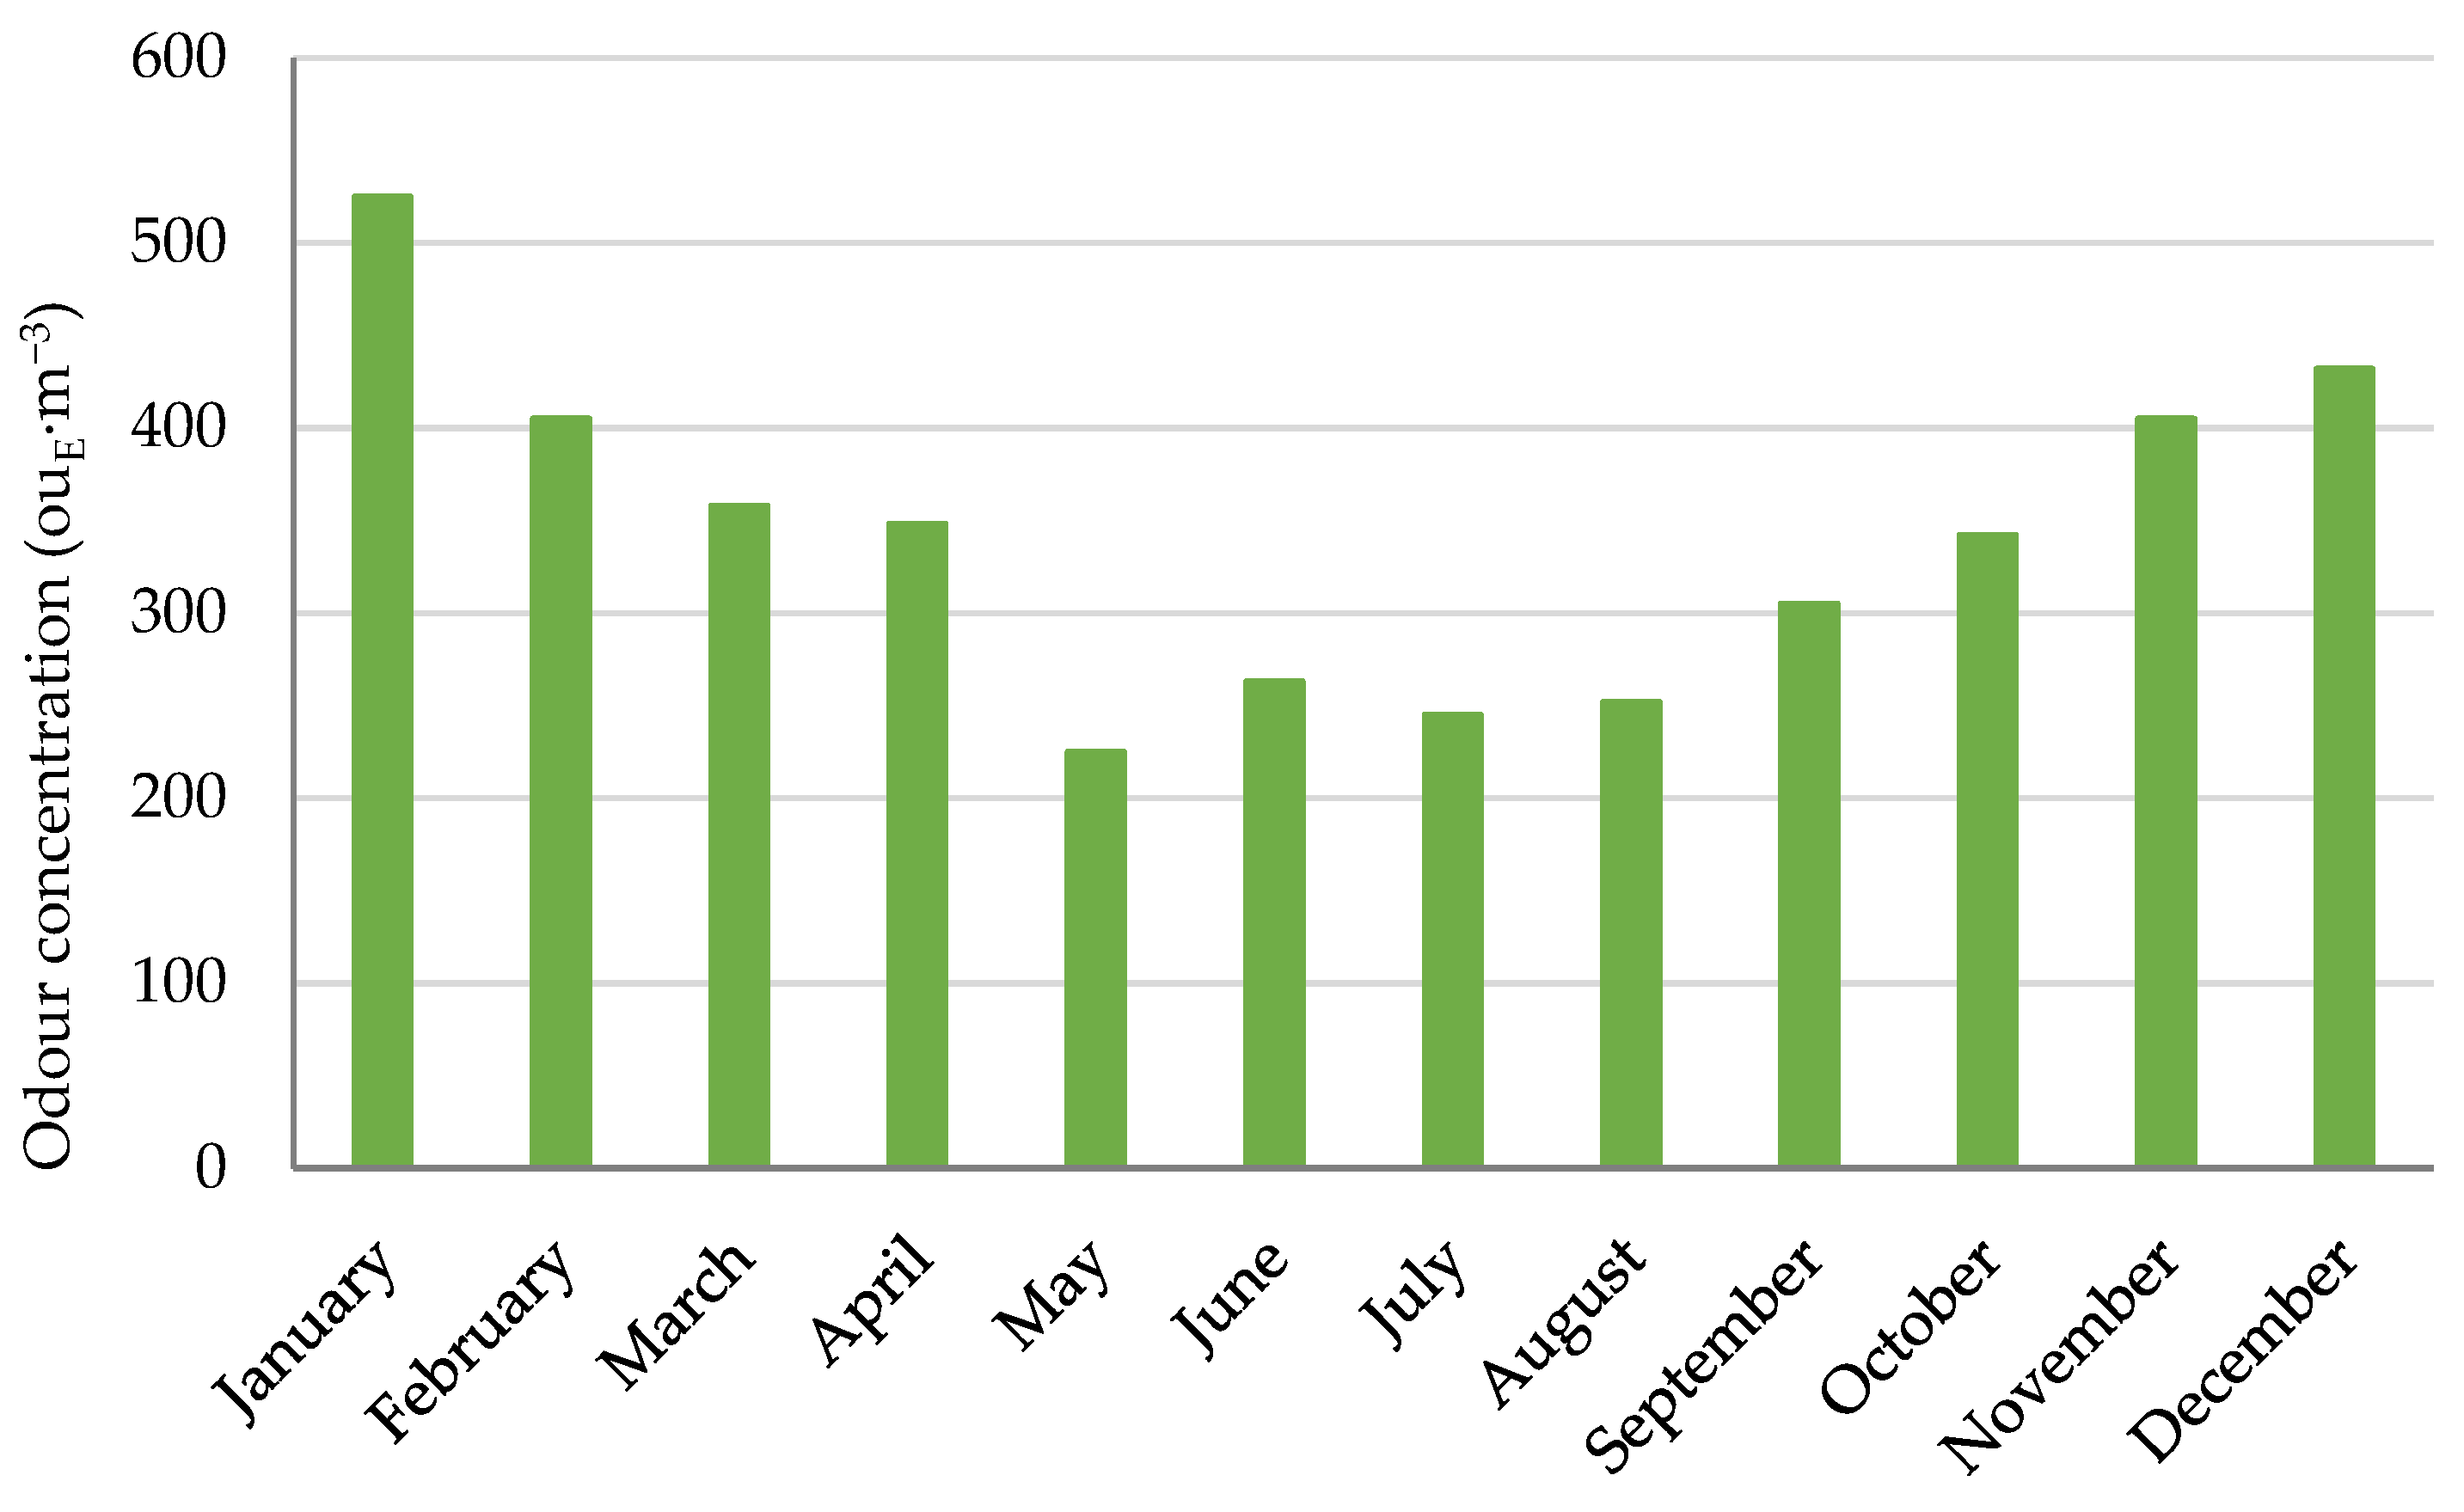
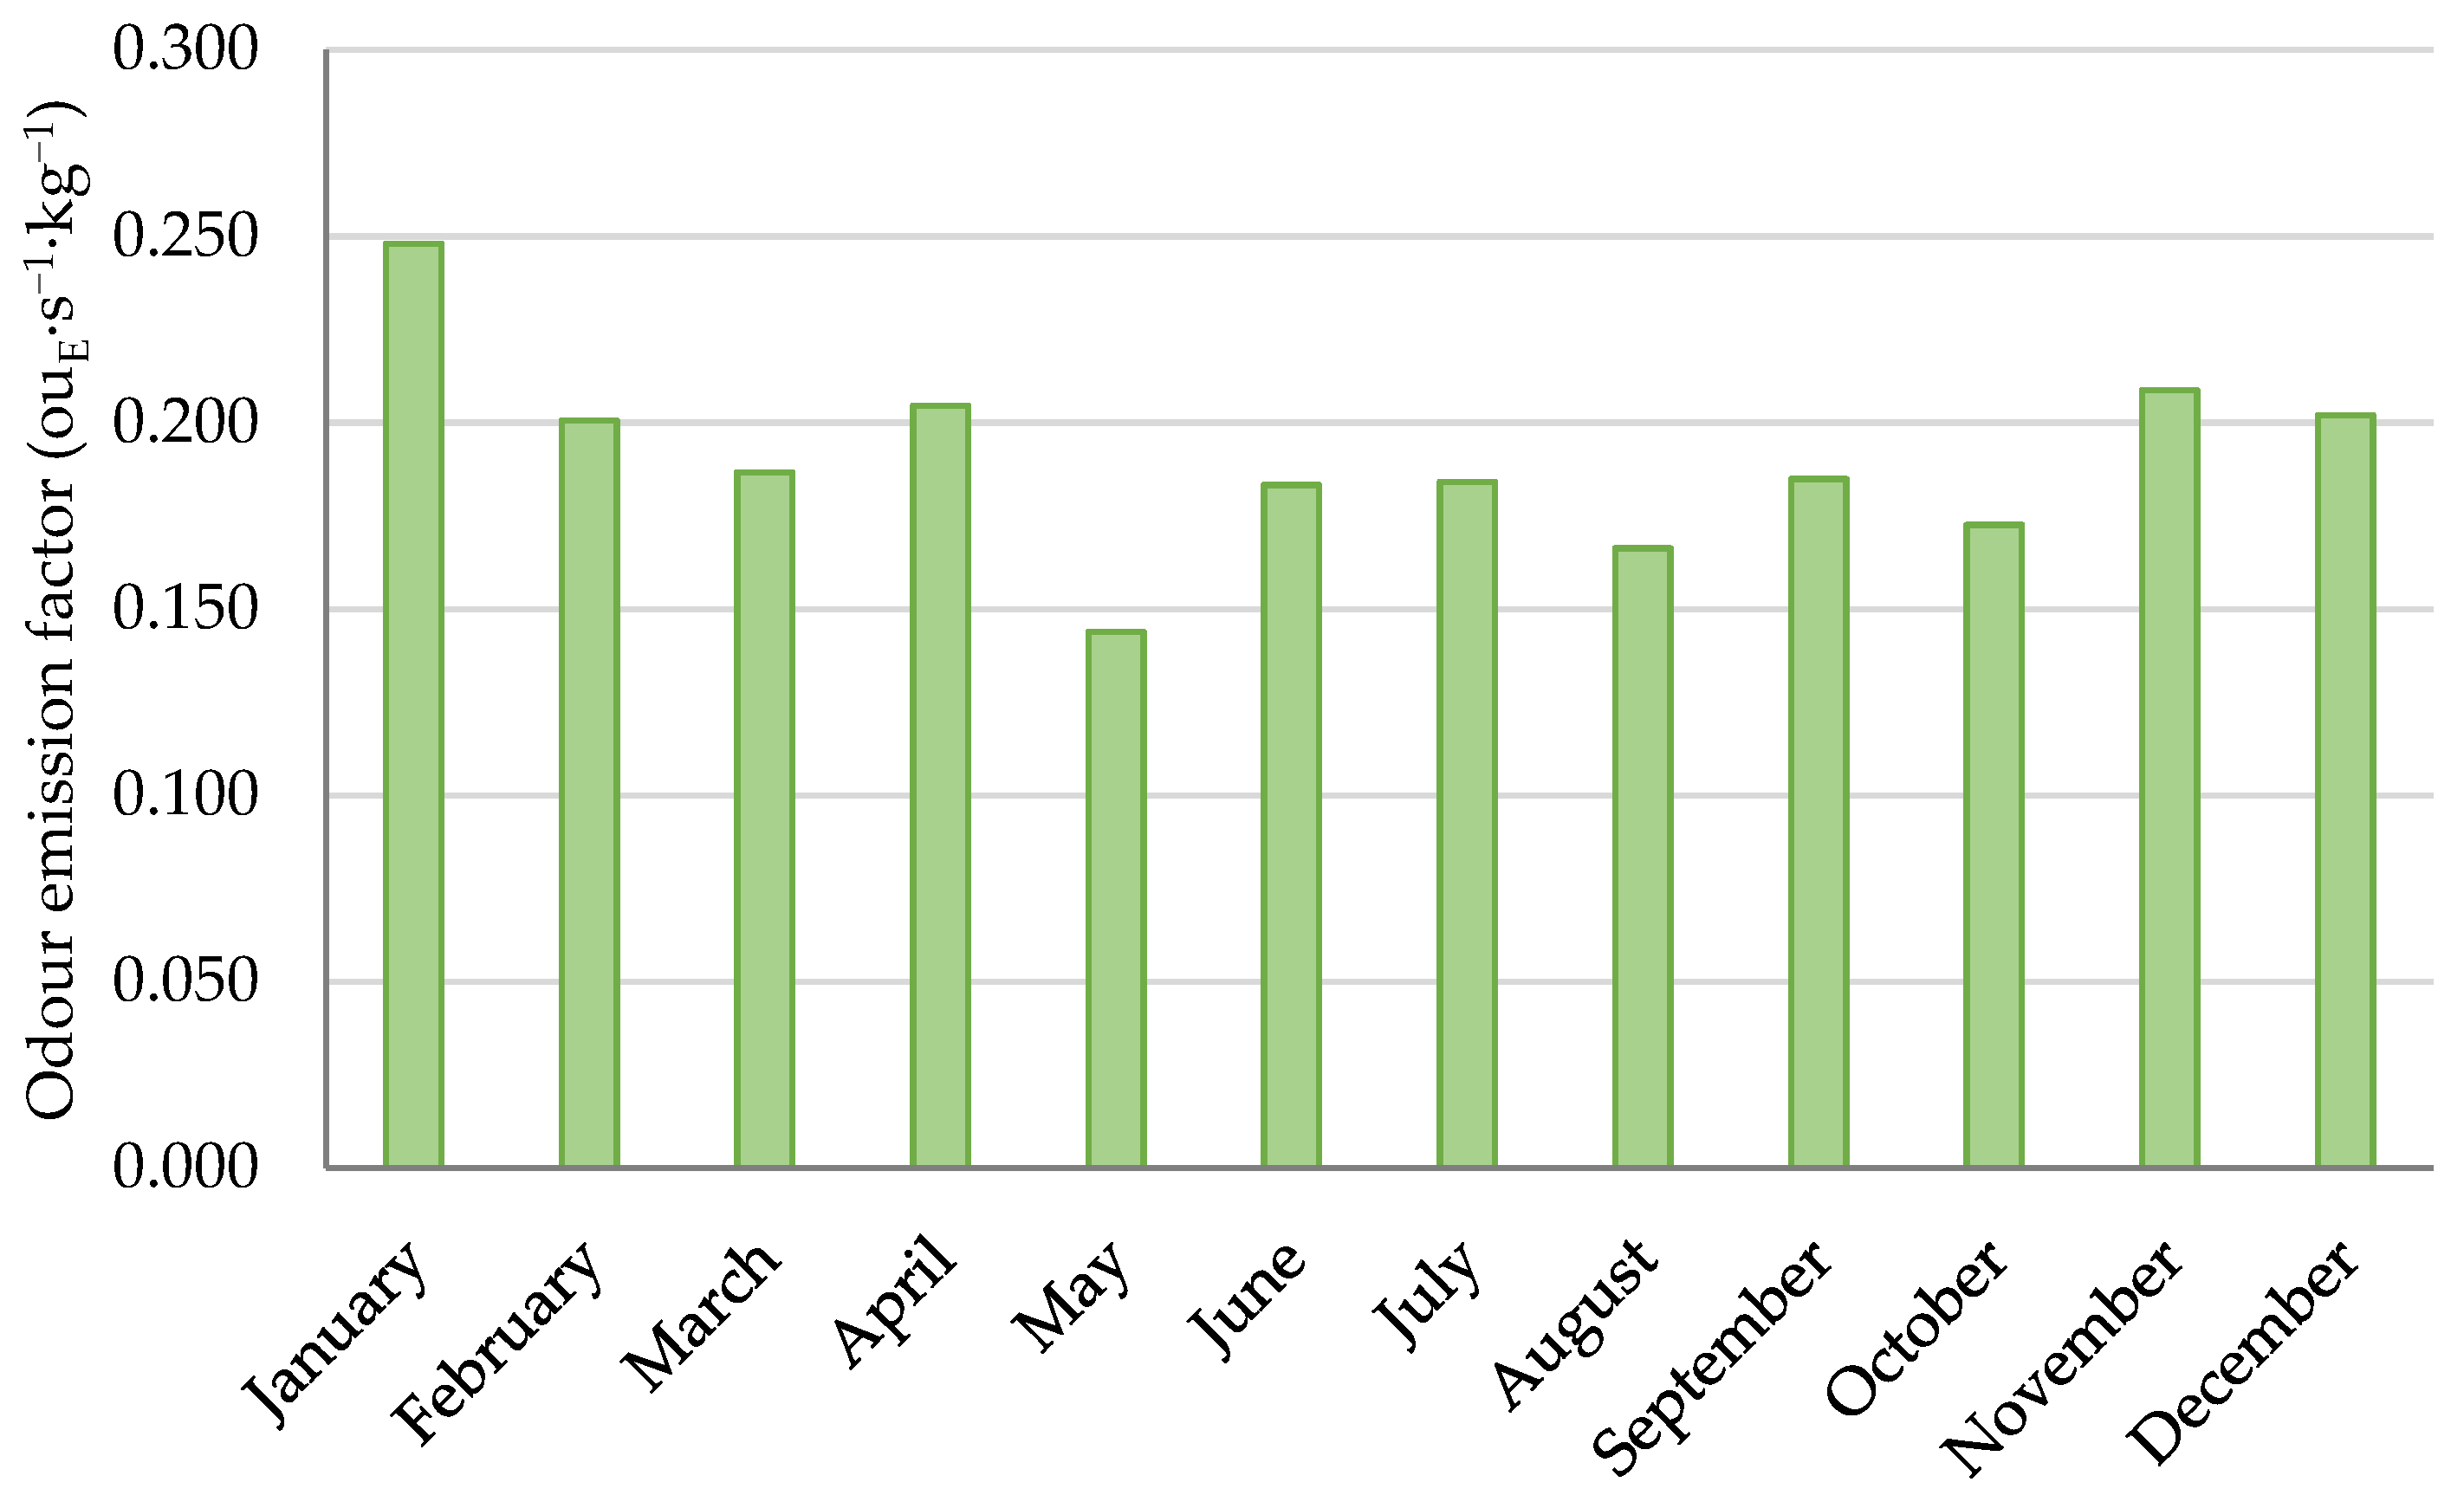
3.3. Dairy Cows
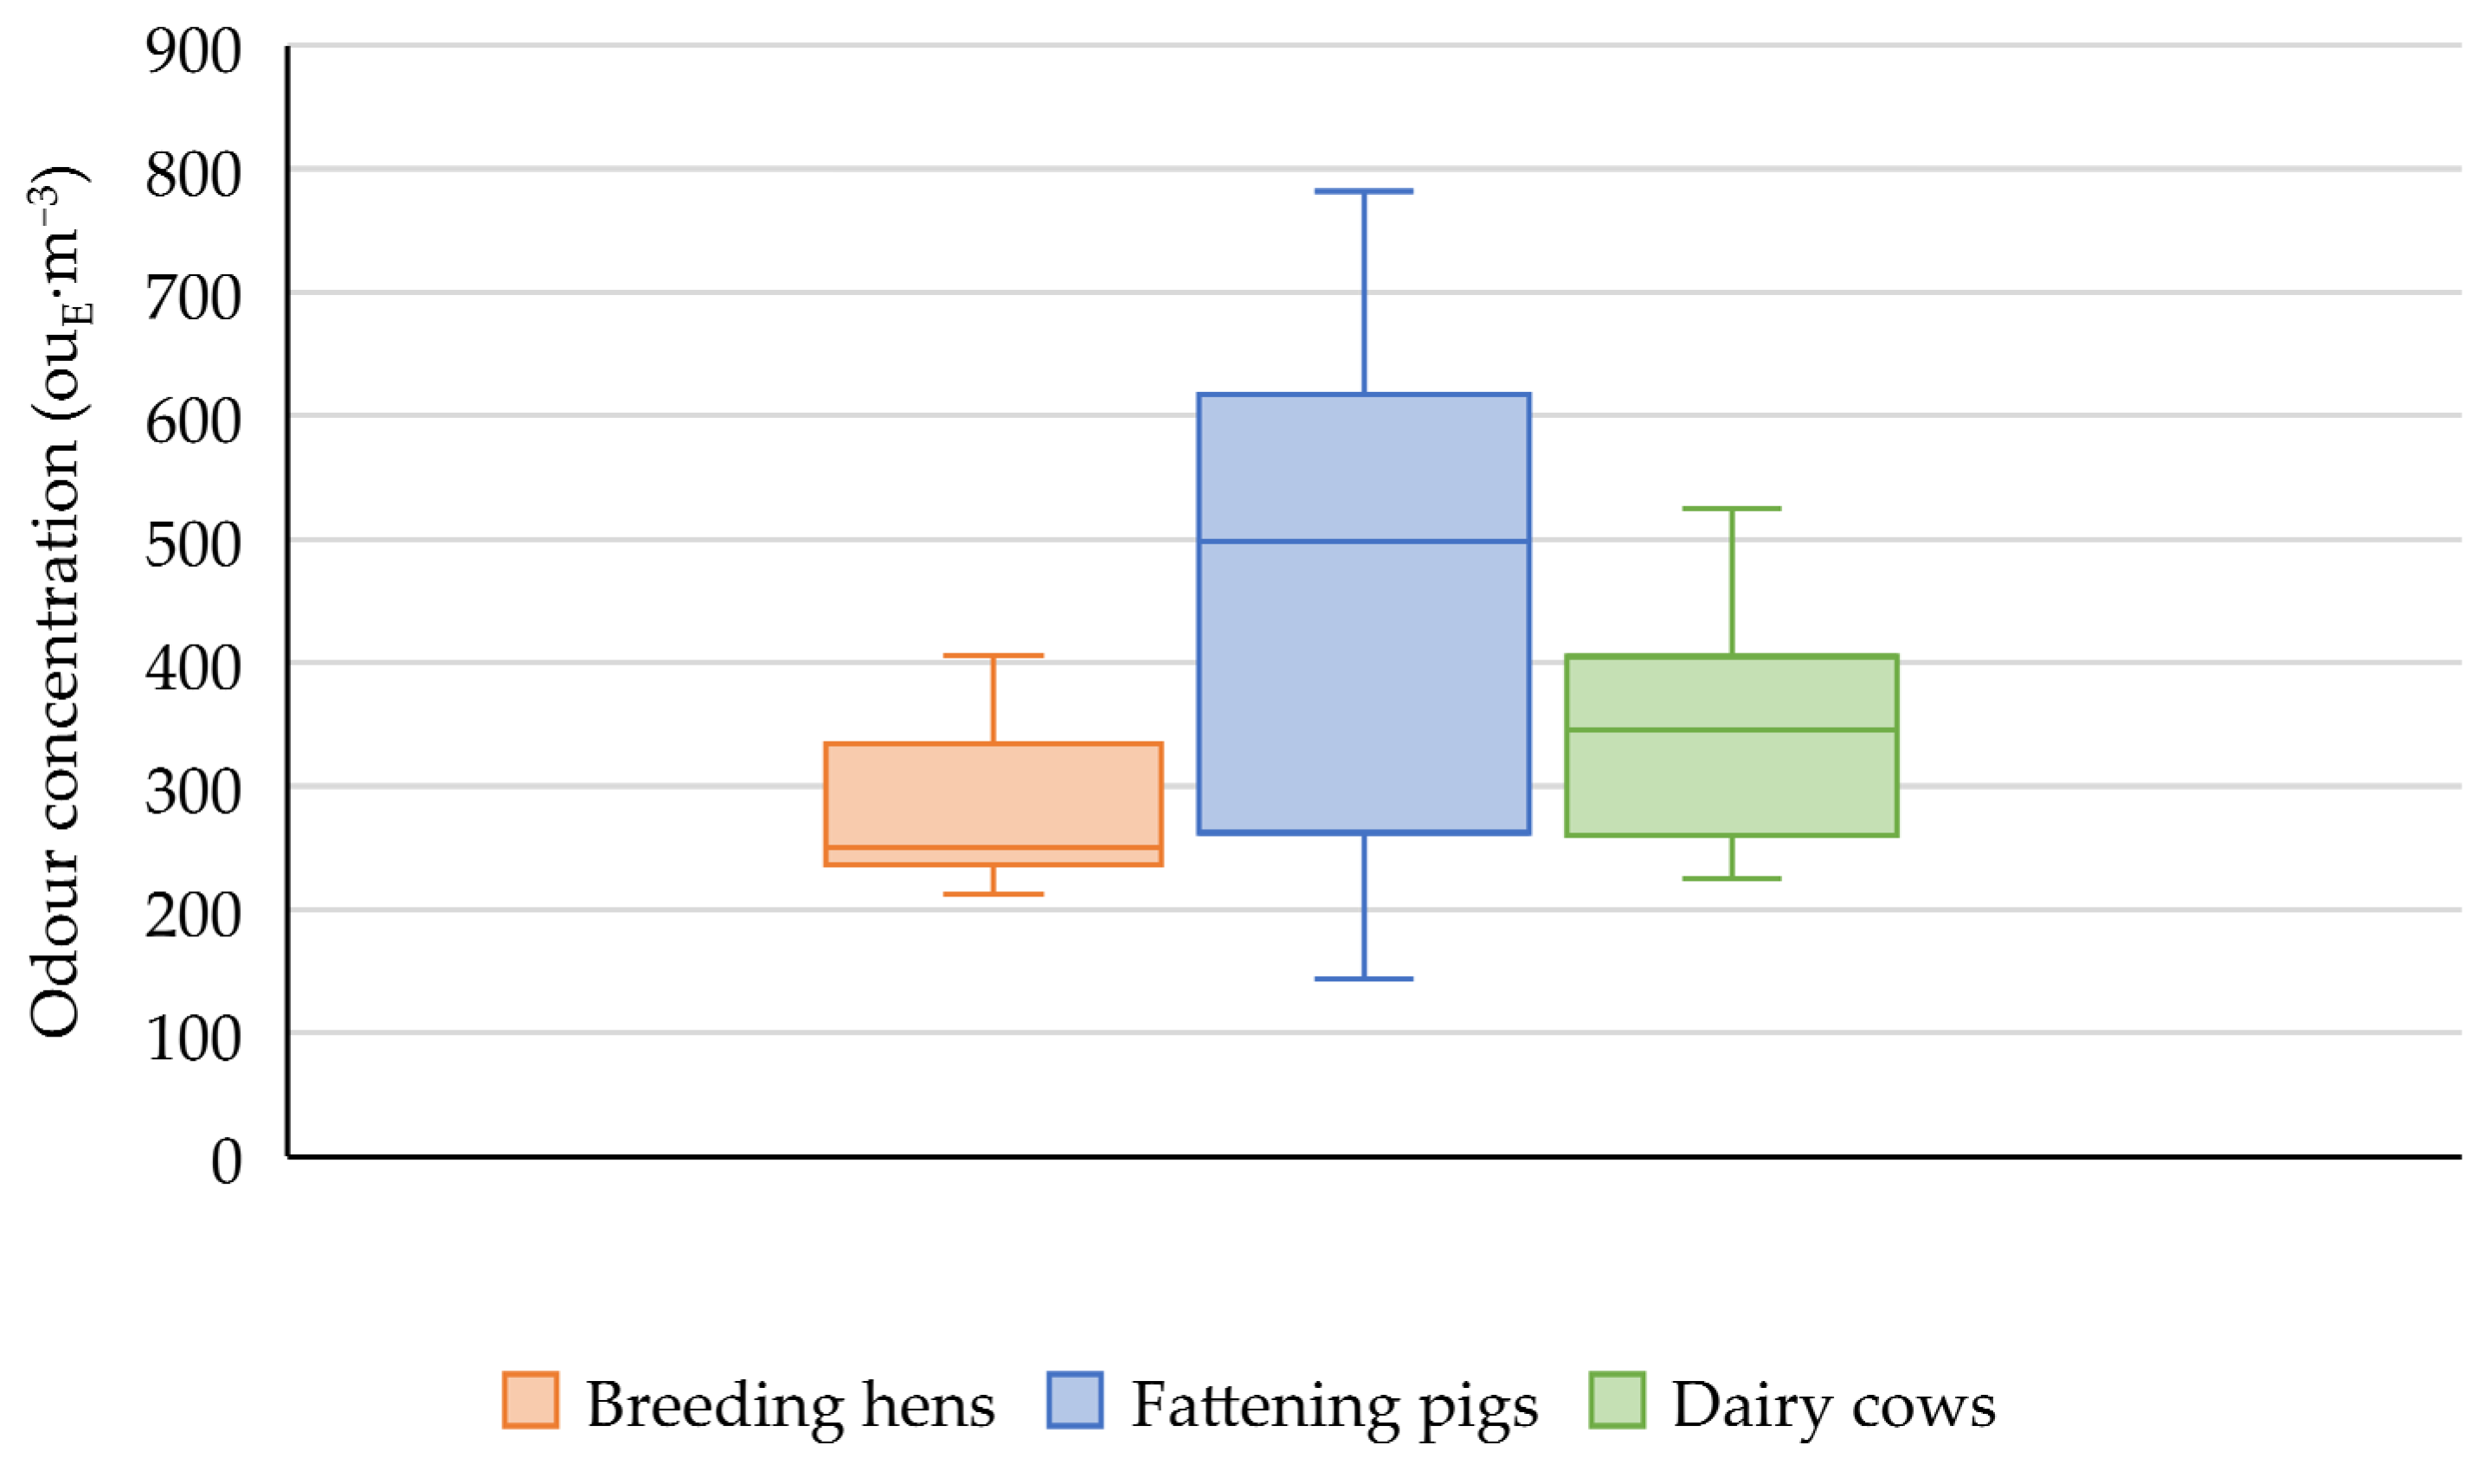
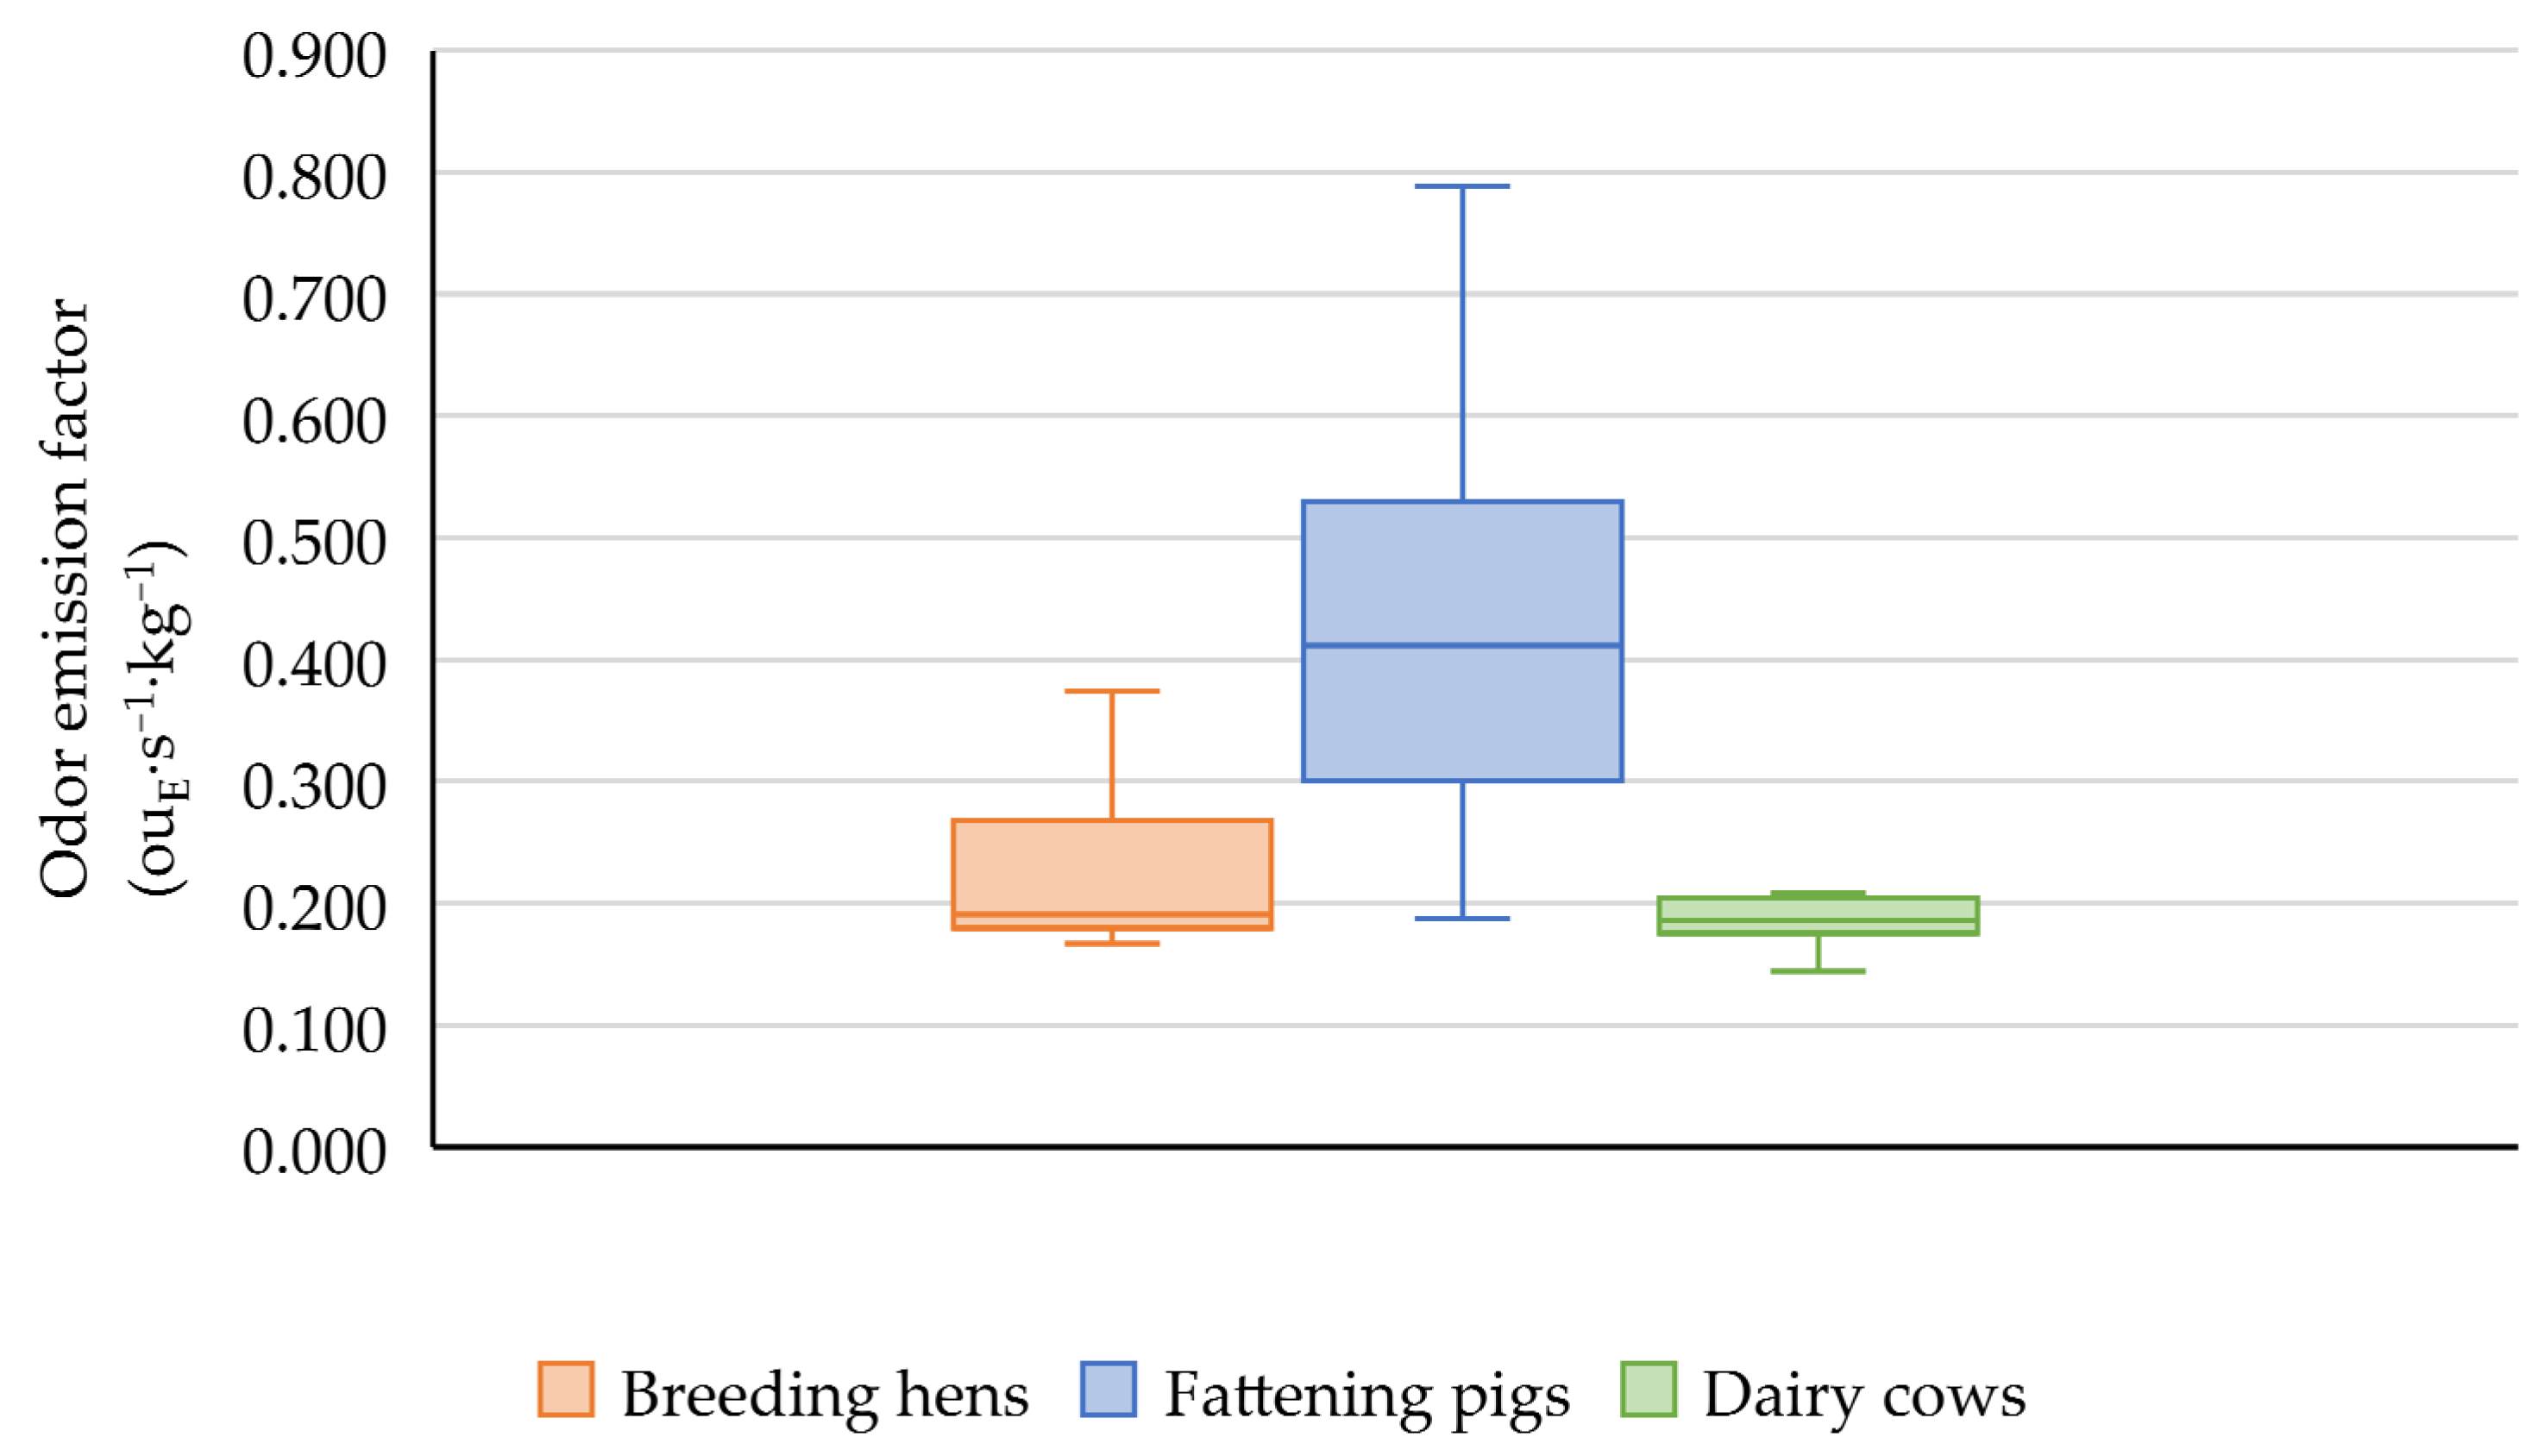
3.4. Comparison of Odour Concentrations and Emission Factors
4. Conclusions
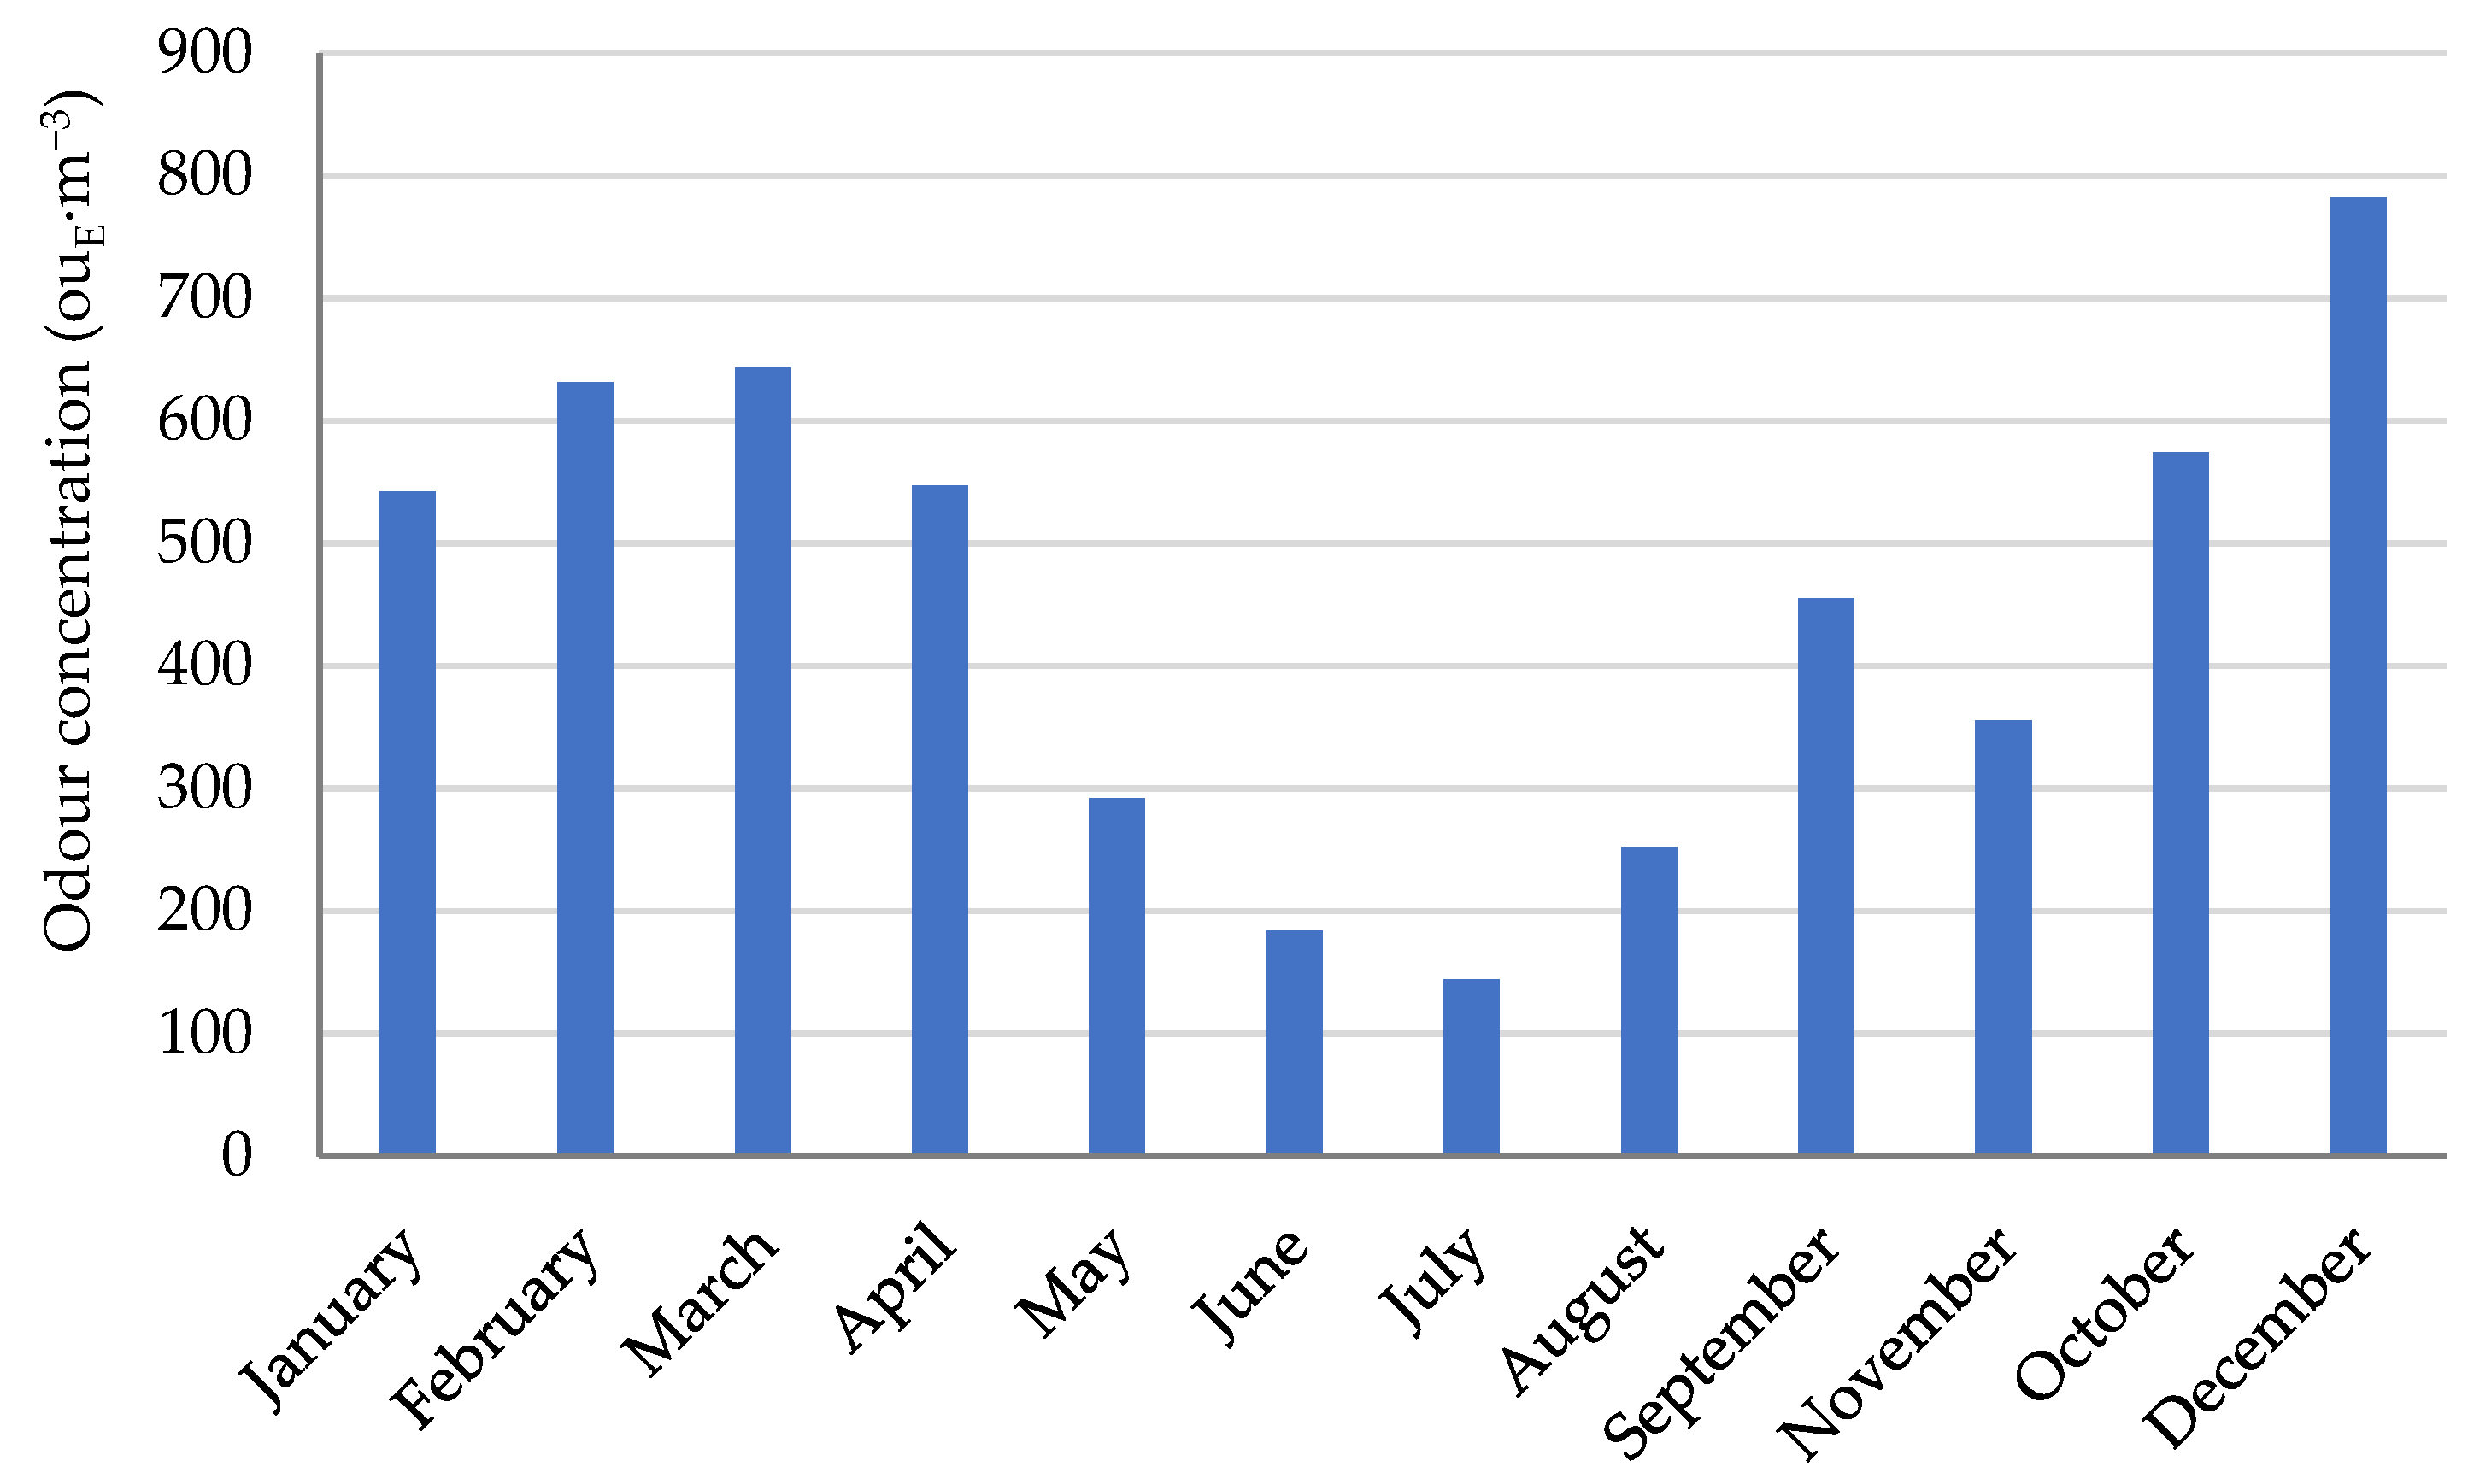
- Odor concentration in fattening house ranged from 144 ouE·m−3 to 782 ouE·m−3 (mean value 450 ouE·m−3), and odor emission factor was from 0.188 ouE·s−1·kg−1 to 0.788 ouE·s−1·kg−1 (mean value 0.419 ouE·s−1·kg−1). The values were the highest among studied facilities.
- Lower odor concentration (mean value 342 ouE·m−3) and emission factor (mean value 0.190 ouE·s−1·kg−1) were noted in free-stall barn. The range of odor concentration and emission factor was from 225 ouE·m−3 to 435 ouE·m−3 and from 0.144 ouE·s−1·kg−1 to 0.248 ouE·s−1·kg−1, respectively
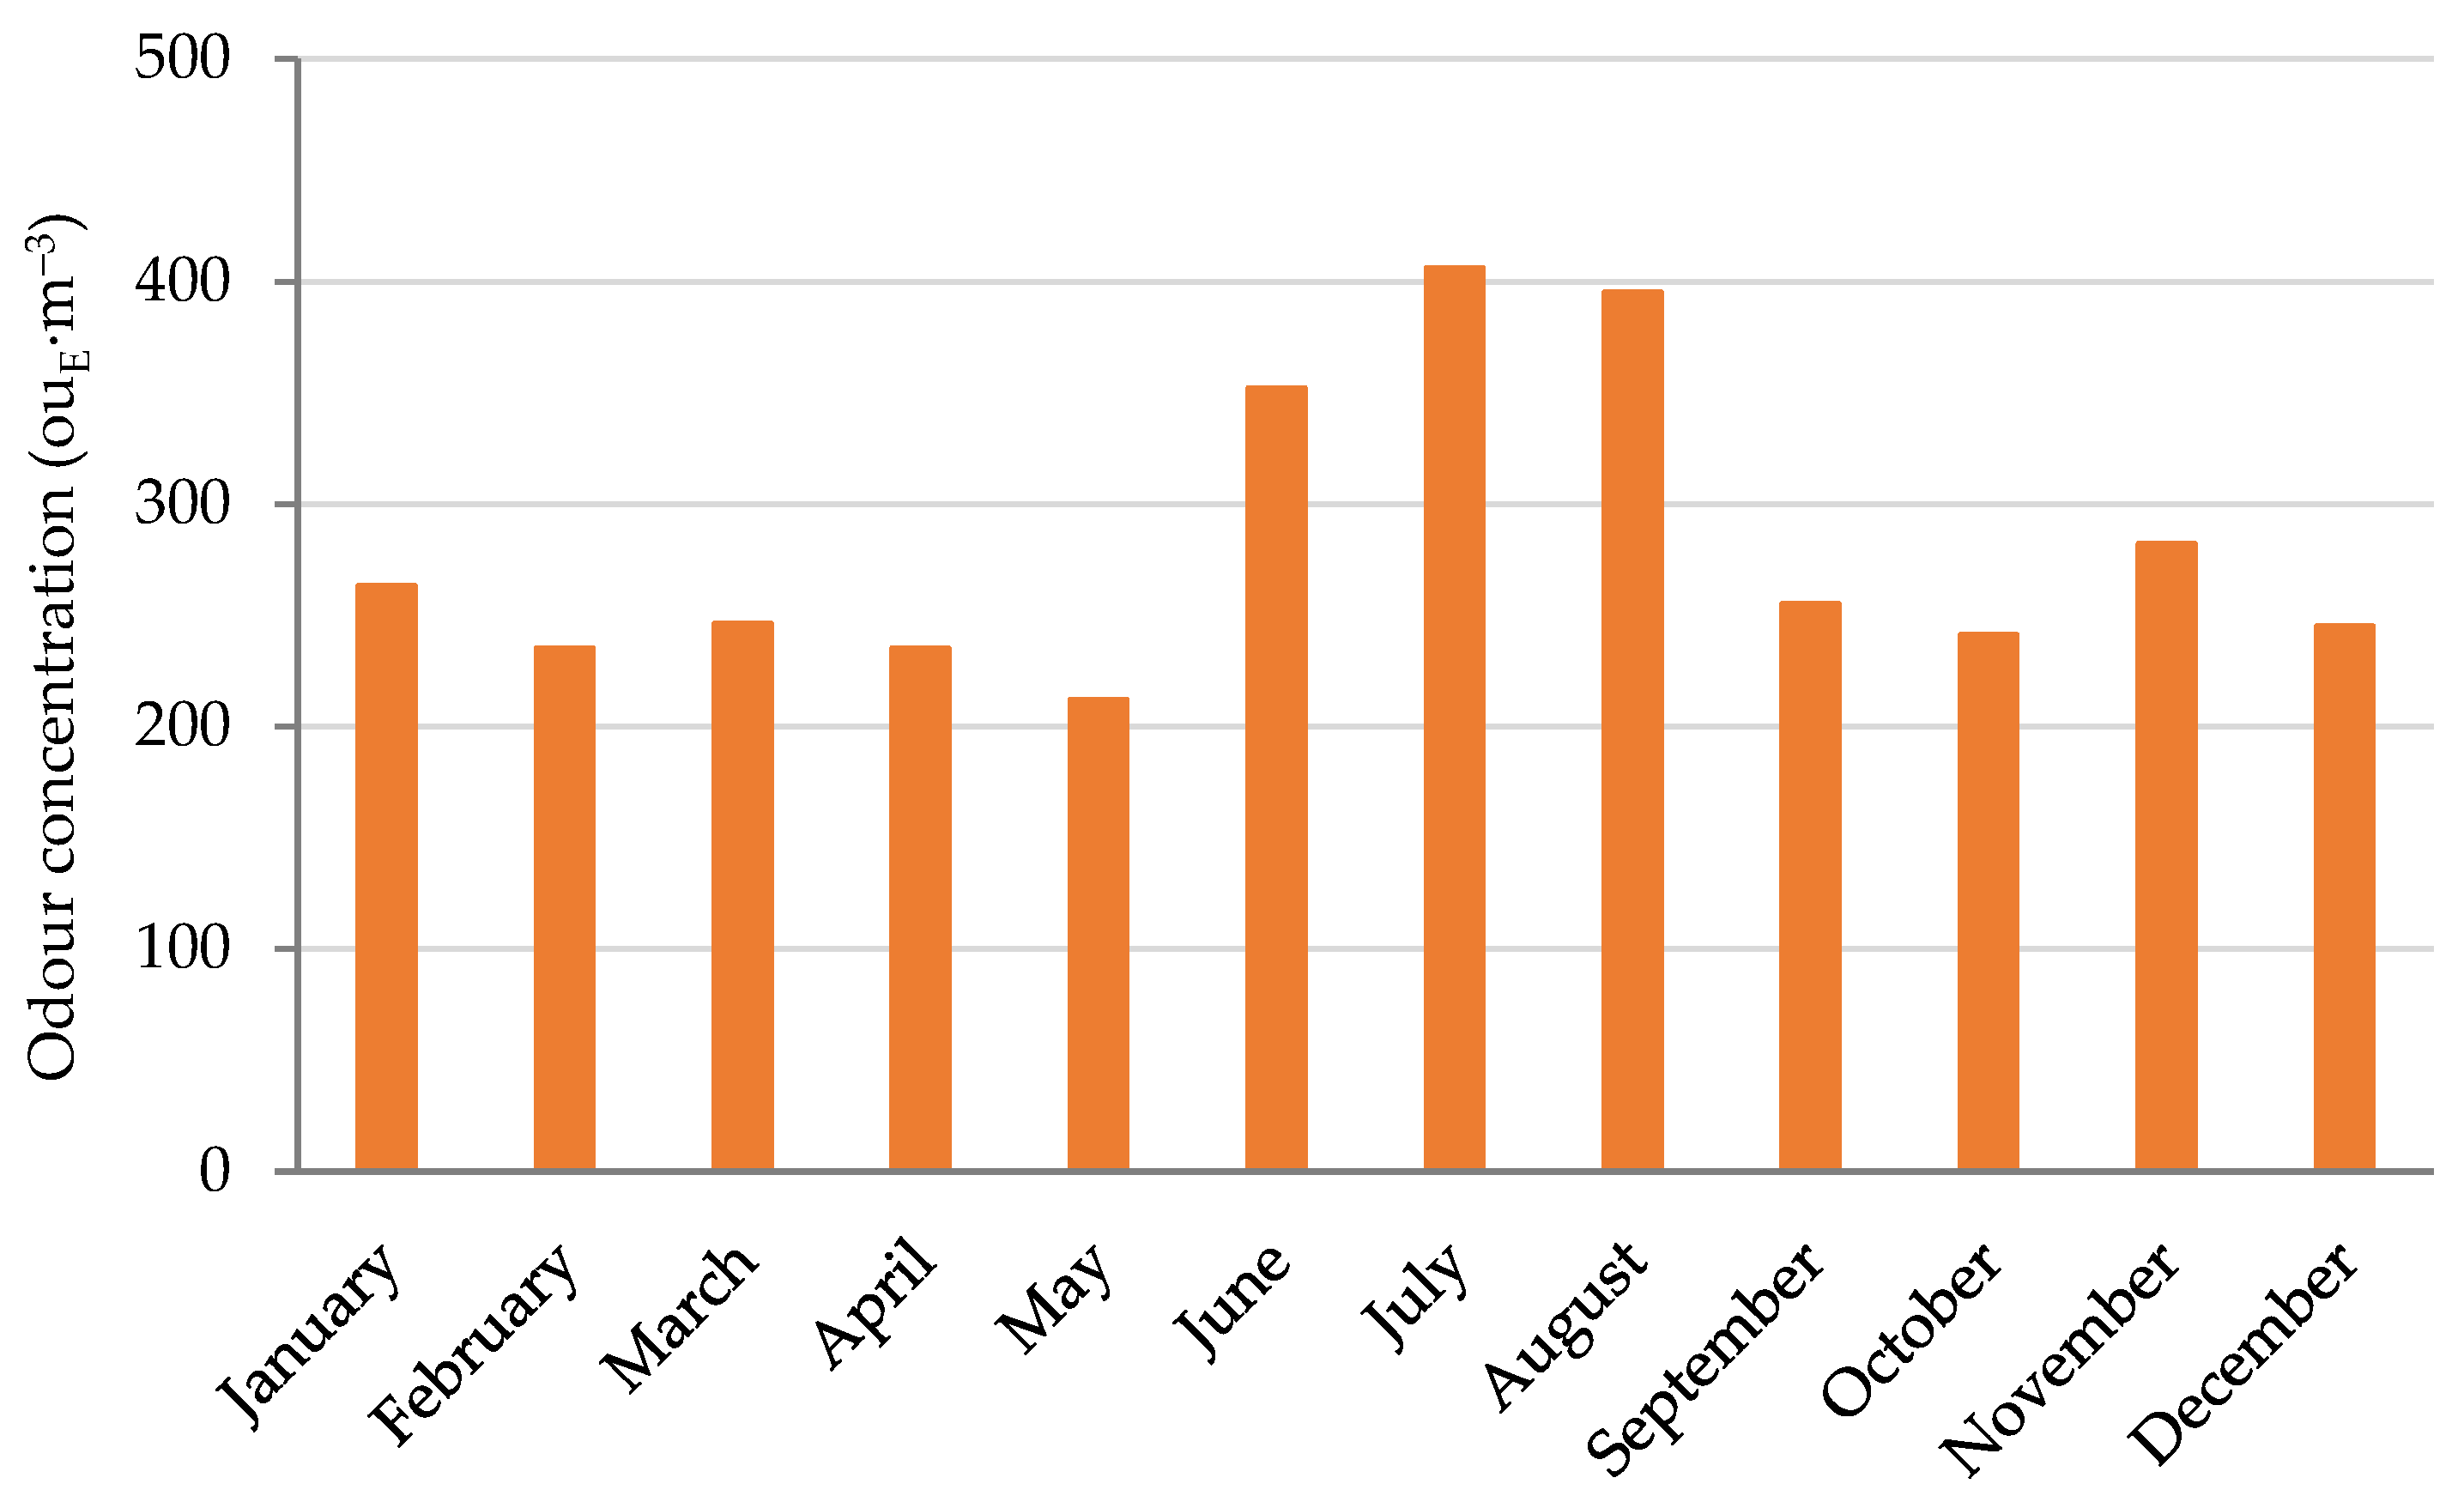
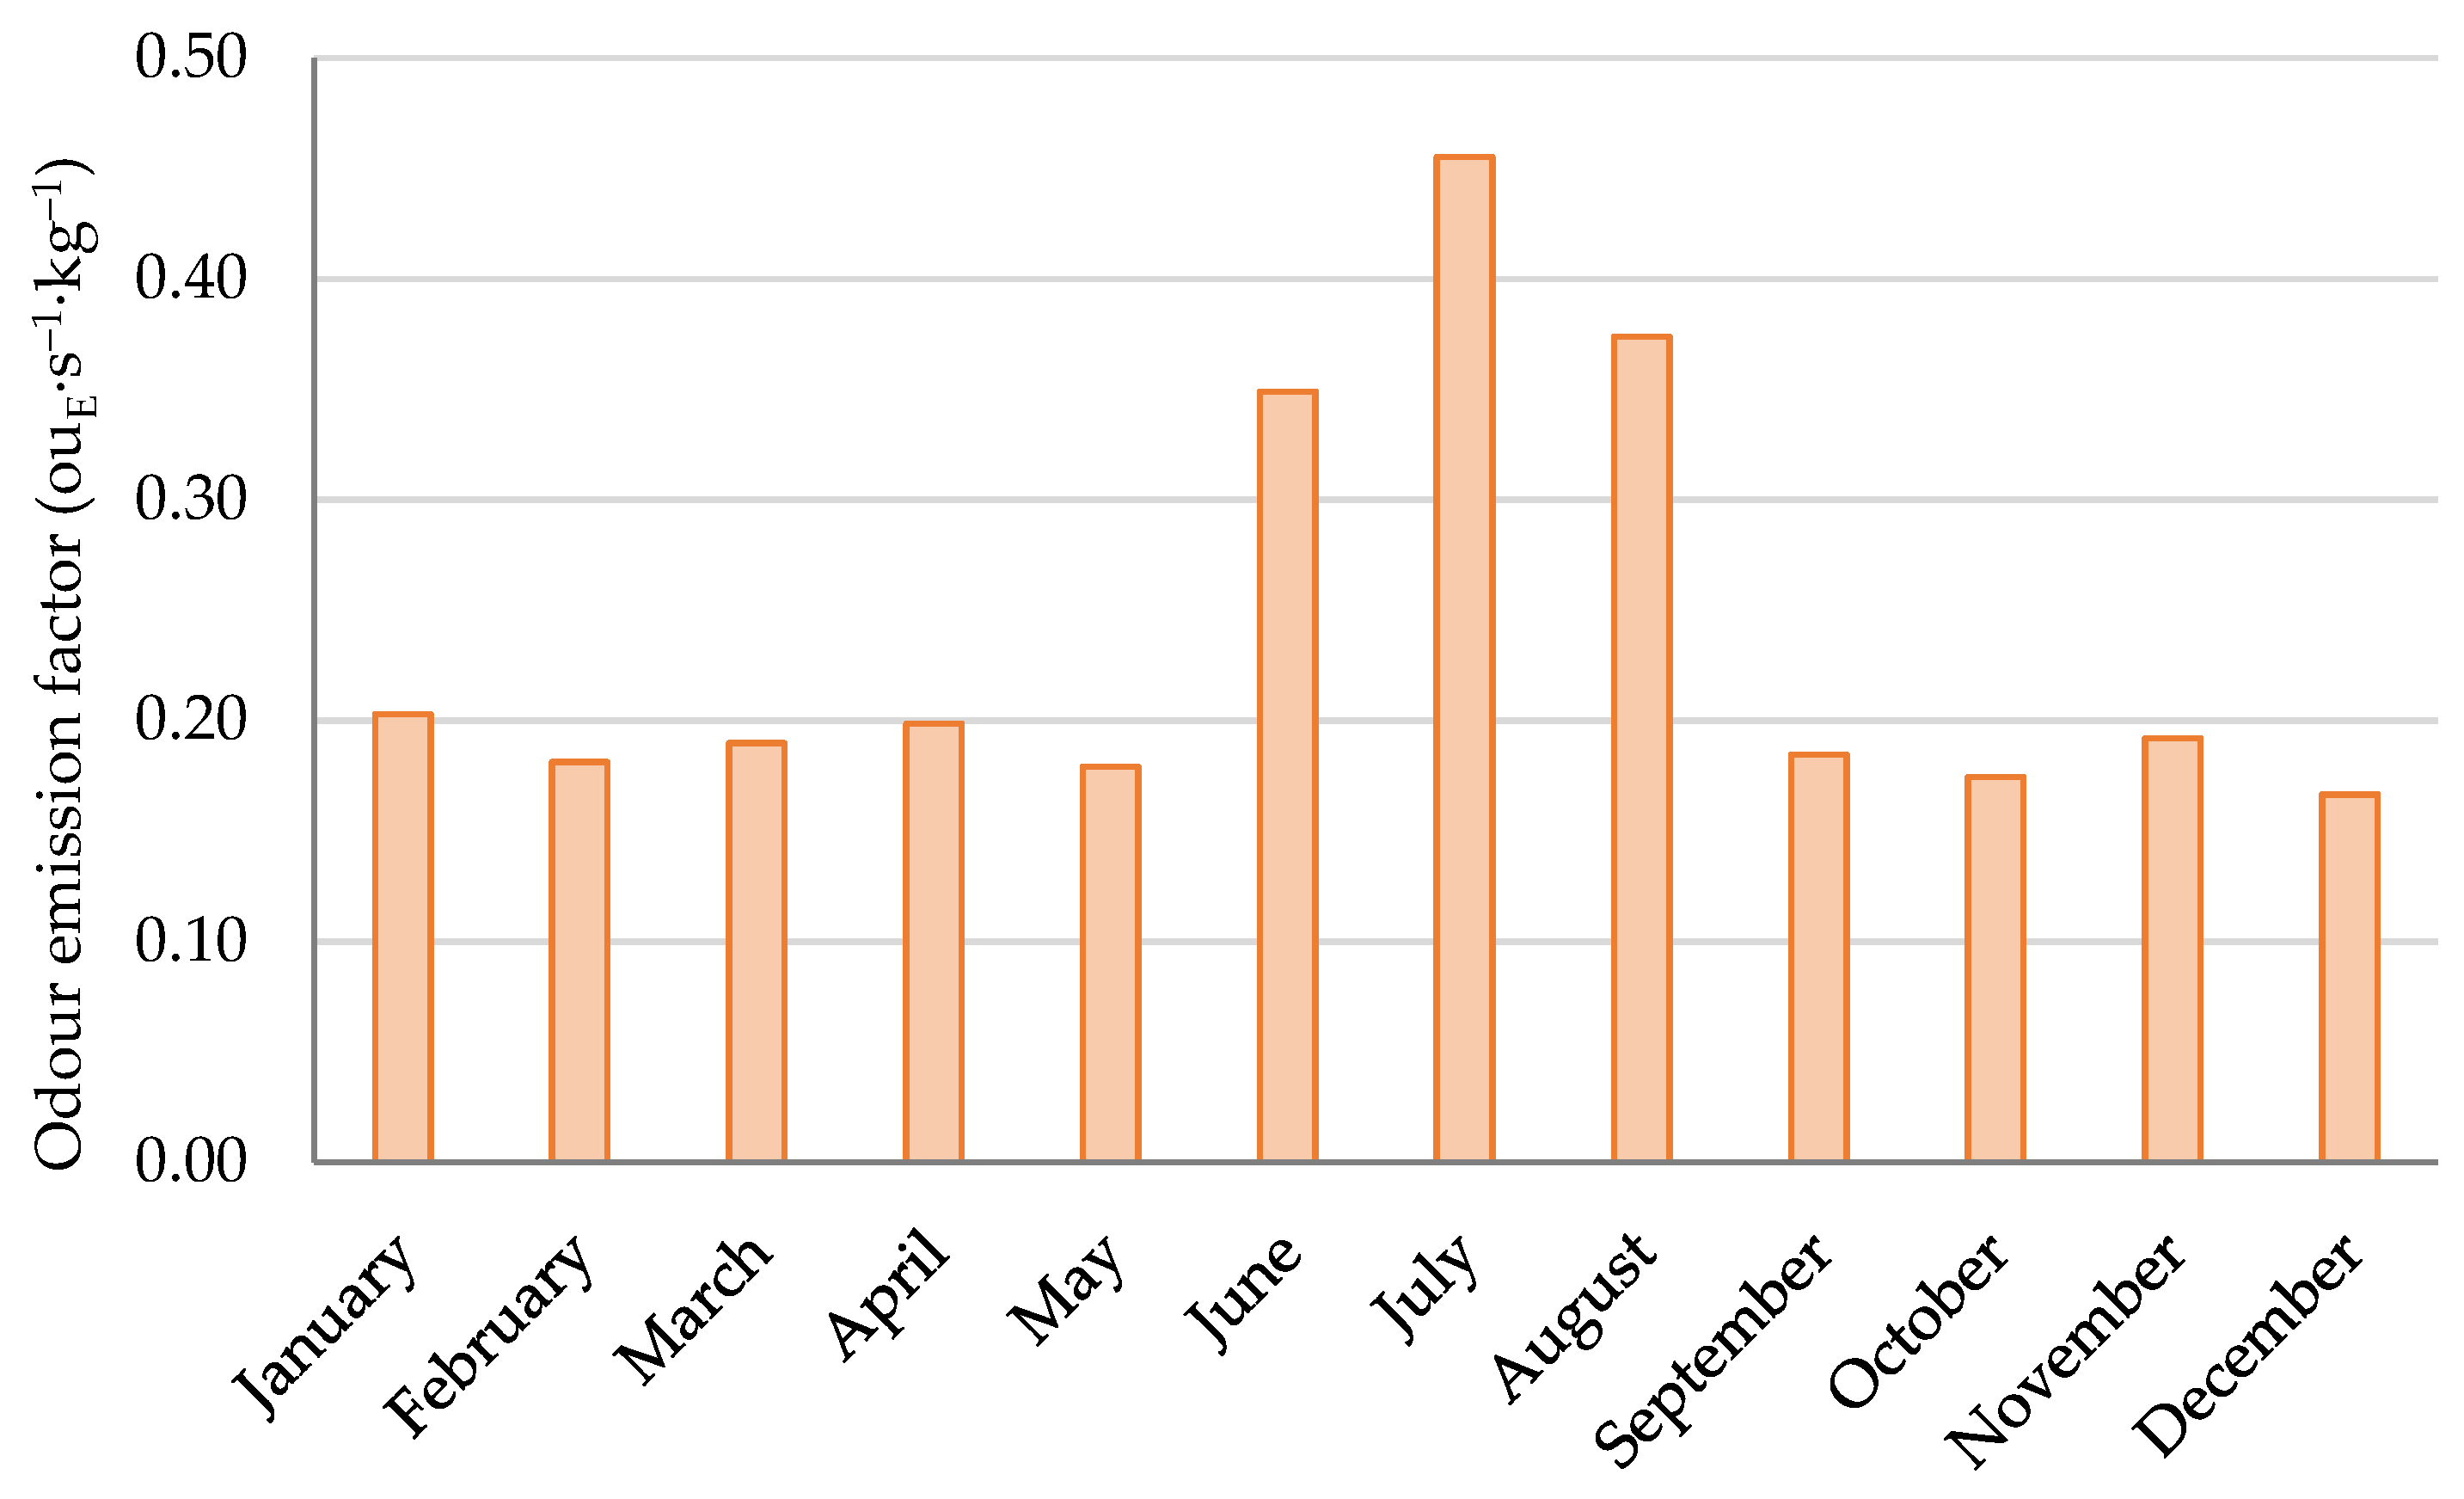
- Mean odor concentration in the hen house (281 ouE·m−3) was 18% lower than in the dairy cow barn. It ranged from 212 ouE·m−3 to 406 ouE·m−3. The emission factor for poultry was from 0.167 ouE·s−1·kg−1 to 0.455 ouE·s−1·kg−1 (mean value 0.232 ouE·s−1·kg−1)
Author Contributions
Funding
Institutional Review Board Statement
Informed Consent Statement
Data Availability Statement
Conflicts of Interest
References
- Communication from the Commission to the Council and the European Parliament. Thematic Strategy on air pollution. Brussels, Belgium, 21 September 2005. [Google Scholar]
- Communication from the Commission to the European Parliament, the Council, the European Economic and Social Committee and the Committee of the Regions. A Clean Air Programme for Europe. Brussels, Belgium, 18 December 2013. [Google Scholar]
- Bibbiani, C.; Russo, C. Odour emission from intensive livestock production system: Approaches for emission abatement and evaluation of their effectiveness. Large Animal Rev. 2012, 18, 135–138. [Google Scholar]
- Peters, G.; Murphy, K.; Adamsen, A.P.S.; Bruun, S.; Svanström, M.; Hoeve, M.T. Improving odour assessment in LCA—the odour footprint. Int. J. Life Cycle Assess. 2014, 19, 1891–1900. [Google Scholar] [CrossRef]
- Strohmaier, C.; Krommweh, M.S.; Büscher, W. Suitability of Different Filling Materials for a Biofilter at a Broiler Fattening Facility in Terms of Ammonia and Odour Reduction. Atmosphere 2019, 11, 13. [Google Scholar] [CrossRef]
- Schauberger, G.; Piringer, M.; Wu, C.; Koziel, J.A. Environmental Odour. Atmosphere 2021, 12, 1293. [Google Scholar] [CrossRef]
- Palmiotto, M.; Fattore, E.; Paiano, V.; Celeste, G.; Colombo, A.; Davoli, E. Influence of a municipal solid waste landfill in the surrounding environment: Toxicological risk and odor nuisance effects. Environ. Int. 2014, 68, 16–24. [Google Scholar] [CrossRef]
- Blanes-Vidal, V. Air pollution from biodegradable wastes and non-specific health symptoms among residents: Direct or annoyance-mediated associations? Chemosphere 2015, 120, 371–377. [Google Scholar] [CrossRef]
- Ubeda, Y.; López-Jiménez, P.A.; Nicolas, J.; Calvet, S. Strategies to control odours in livestock facilities: A critical review. Span. J. Agric. Res. 2013, 11, 1004. [Google Scholar] [CrossRef]
- Dunlop, M.W.; Blackall, P.J.; Stuetz, R. Odour emissions from poultry litter—A review litter properties, odour formation and odorant emissions from porous materials. J. Environ. Manag. 2016, 177, 306–319. [Google Scholar] [CrossRef] [PubMed]
- Valli, L.; Moscatelli, G.; Labartino, N. Odour emissions from livestock production facilities. Chem. Eng. Trans. 2008, 15, 239–246. [Google Scholar]
- Wang, K.; Wei, B.; Zhu, S.; Ye, Z. Ammonia and odour emitted from deep litter and fully slatted floor systems for growing-finishing pigs. Biosyst. Eng. 2011, 109, 203–210. [Google Scholar] [CrossRef]
- Akdeniz, N.; Jacobson, L.D.; Hetchler, B.P.; Bereznicki, S.D.; Heber, A.J.; Koziel, J.A.; Cai, L.; Zhang, S.; Parker, D.B. Odor and Odorous Chemical Emissions from Animal Buildings: Part 2. Odor Emissions. Trans. ASABE 2012, 55, 2335–2345. [Google Scholar] [CrossRef]
- Mielcarek, P.; Rzeźnik, W. Odor Emission Factors from Livestock Production. Pol. J. Environ. Stud. 2015, 24, 27–35. [Google Scholar] [CrossRef]
- CIGR. 4th Report of working group on climatisation of animalhouses: Heat and moisture production at animal and house levels. Commission Internationale du Génie Rural: Horsens, Denmark, 2002. [Google Scholar]
- Albright, L.D. Environment control for animals and Plants, 1st ed.; American Society of Agricultural Engineers: St. Joseph, MI, USA, 1990. [Google Scholar]
- Lindley, J.A.; Whitaker, J.H. Agricultural buildings and structures. Rev. 96; American Society of Agricultural Engineers: St. Joseph, MI, USA, 1996. [Google Scholar]
- European Committee for Standardization CEN. Air Quality—Determination of Odour Concentration by Dynamic Olfactometry; EN 13725:2003; CEN: Brussels, Belgium, 2003. [Google Scholar]
- Lim, T.T.; Heber, A.J.; Ni, J.Q. Air quality measurements at a laying hen house: Odor and hydrogen sulfide emissions. In Proceedings of the International Symposium on Control of Gaseous and Odor Emissions from Animal Production Facilities, Horsens, Denmark, 1–4 June 2003; Danish Institute of Agricultural Sciences: Foulum, Denmark, 2003; pp. 273–282. [Google Scholar]
- Huang, D.; Guo, H. Relationships between odor properties and determination of odor concentration limits in odor impact criteria for poultry and dairy barns. Sci. Total Environ. 2018, 630, 1484–1491. [Google Scholar] [CrossRef] [PubMed]
- Hayes, E.; Curran, T.; Dodd, V. Odour and ammonia emissions from intensive poultry units in Ireland. Bioresour. Technol. 2006, 97, 933–939. [Google Scholar] [CrossRef] [PubMed]
- Fournel, S.; Pelletier, F.; Godbout, S.; Lagacé, R.; Feddes, J. Odour emissions, hedonic tones and ammonia emissions from three cage layer housing systems. Biosyst. Eng. 2012, 112, 181–191. [Google Scholar] [CrossRef]
- Rzeźnik, W.; Mielcarek, P.; Rzeźnik, I. Odour emission from deep litter farming system for fattening pigs. Probl. Agri-Cult. Eng. 2014, 1, 91–99. (In Polish) [Google Scholar]
- Guo, H.; Dehod, W.; Agnew, J.; Feddes, J.R.; Lague, C.; Pang, S. Daytime Odor Emission Variations from Various Swine Barns. Trans. ASABE 2007, 50, 1365–1372. [Google Scholar] [CrossRef]
- Guo, H.; Dehod, W.; Agnew, J.; Lague, C.; Feddes, J.R.; Pang, S. Annual odor emission rate from different types of swine production buildings. Trans. ASABE 2006, 49, 517–525. [Google Scholar] [CrossRef][Green Version]
- Sun, G.; Guo, H.; Peterson, J. Seasonal Odor, Ammonia, Hydrogen Sulfide, and Carbon Dioxide Concentrations and Emissions from Swine Grower-Finisher Rooms. J. Air Waste Manag. Assoc. 2010, 60, 471–480. [Google Scholar] [CrossRef]
- Romain, A.-C.; Nicolas, J.; Cobut, P.; Delva, J.; Nicks, B.; Philippe, F.-X. Continuous odour measurement from fattening pig units. Atmos. Environ. 2013, 77, 935–942. [Google Scholar] [CrossRef]
- Zhao, L.Y.; Brugger, M.F.; Manuzon, R.B.; Arnold, G.; Imerman, E. Variations in Air Quality of New Ohio Dairy Facilities with Natural Ventilation Systems. Appl. Eng. Agric. 2007, 23, 339–346. [Google Scholar] [CrossRef]
- Maasikmets, M.; Teinemaa, E.; Kaasik, A.; Kimmel, V. Measurement and analysis of ammonia, hydrogen sulphide and odour emissions from the cattle farming in Estonia. Biosyst. Eng. 2015, 139, 48–59. [Google Scholar] [CrossRef]
- Keck, M.; Schmidlin, A.; Zeyer, K.; Emmenegger, L.; Schrade, S. Odour concentration and emission from naturally ventilated dairy loose housings with an outdoor exercise area. Chem. Eng. Trans. 2010, 23, 195–200. [Google Scholar]


| Ventilation Mode | Temperature (°C) | Operating Time (s) | Break Time (s) | Fans | Air flow by Inlet (%) | |||||
|---|---|---|---|---|---|---|---|---|---|---|
| F1 | F2 | F3 | F4 | F5,6 | F7,8 | I | ||||
| 0 | 20.0 | 60 | 240 | c | c | c | c | • | • | 32 |
| 1 | 20.1 | 130 | 170 | c | c | c | c | • | • | 32 |
| 2 | 20.6 | 900 | 60 | c | c | c | c | • | • | 33 |
| 3 | 21.1 | - | - | f | f | f | f | • | • | 42 |
| 4 | 22.0 | - | - | f | f | f | f | • | • | 52 |
| 5 | 23.0 | - | - | f | f | f | f | f | • | 62 |
| 6 | 23.7 | - | - | f | f | f | f | f | • | 72 |
| 7 | 24.7 | - | - | f | f | f | f | f | • | 81 |
| 8 | 25.5 | - | - | f | f | f | f | f | • | 85 |
| 9 | 26.5 | - | - | f | f | f | • | f | f | 90 |
| 10 | 27.8 | - | - | f | f | f | • | f | f | 100 |
| Month | Temperature (°C) | Odour Concentration (ouE·m−3) | Ventilation Rate (m−3·s−1) | Odour Emission (ouE·s−1) | Odour Emission Factor (ouE·s−1·kg−1) |
|---|---|---|---|---|---|
| January | 20.5 | 263 | 23.53 | 6188 | 0.203 |
| February | 20.1 | 235 | 23.53 | 5530 | 0.181 |
| March | 20.3 | 246 | 23.53 | 5788 | 0.190 |
| April | 21.4 | 235 | 25.77 | 6056 | 0.199 |
| May | 21.2 | 212 | 25.77 | 5463 | 0.179 |
| June | 23.7 | 352 | 29.78 | 8723 | 0.349 |
| July | 28.6 | 406 | 33.7 | 13,682 | 0.455 |
| August | 28 | 395 | 33.7 | 13,312 | 0.374 |
| September | 22 | 255 | 25.77 | 6571 | 0.185 |
| October | 21 | 241 | 25.77 | 6211 | 0.174 |
| November | 20.3 | 282 | 24.22 | 6830 | 0.192 |
| December | 20.1 | 245 | 24.22 | 5934 | 0.167 |
| Month | Temperature (°C) | Odour Concentration (ouE·m−3) | Ventilation Rate (m−3·s−1) | Odour Emission (ouE·s−1) | Odour Emission Factor (ouE·s−1·kg−1) |
|---|---|---|---|---|---|
| January | 15.1 | 542 | 3.36 | 1821 | 0.188 |
| February | 15.6 | 631 | 3.36 | 2120 | 0.238 |
| March | 16.5 | 643 | 3.62 | 2328 | 0.310 |
| April | 18.7 | 547 | 4.1 | 2243 | 0.583 |
| May | 21.3 | 292 | 4.51 | 1317 | 0.421 |
| June | 24 | 184 | 5.9 | 1086 | 0.412 |
| July | 25.3 | 144 | 6.12 | 881 | 0.476 |
| August | 25.1 | 252 | 6.09 | 1535 | 0.642 |
| September | 20.3 | 455 | 4.93 | 2243 | 0.788 |
| October | 17.8 | 355 | 3.81 | 1353 | 0.290 |
| November | 17.3 | 574 | 3.81 | 2187 | 0.315 |
| December | 16.8 | 782 | 3.62 | 2831 | 0.361 |
| Month | Temperature (°C) | Odour Concentration (ouE·m−3) | Ventilation Rate (m−3·s−1) | Odour Emission (ouE·s−1) | Odour Emission Factor (ouE·s−1·kg−1) |
|---|---|---|---|---|---|
| January | 5.3 | 525 | 0.307 | 161 | 0.248 |
| February | 6.4 | 405 | 0.322 | 130 | 0.201 |
| March | 8.9 | 358 | 0.339 | 121 | 0.187 |
| April | 14.8 | 348 | 0.382 | 133 | 0.205 |
| May | 18.6 | 225 | 0.4159 | 94 | 0.144 |
| June | 24.3 | 263 | 0.453 | 119 | 0.183 |
| July | 27.1 | 245 | 0.4886 | 120 | 0.184 |
| August | 23.5 | 252 | 0.429 | 108 | 0.166 |
| September | 15.2 | 305 | 0.394 | 120 | 0.185 |
| October | 11.3 | 342 | 0.328 | 112 | 0.173 |
| November | 5.6 | 405 | 0.335 | 136 | 0.209 |
| December | 3.7 | 432 | 0.304 | 131 | 0.202 |
Publisher’s Note: MDPI stays neutral with regard to jurisdictional claims in published maps and institutional affiliations. |
© 2022 by the authors. Licensee MDPI, Basel, Switzerland. This article is an open access article distributed under the terms and conditions of the Creative Commons Attribution (CC BY) license (https://creativecommons.org/licenses/by/4.0/).
Share and Cite
Rzeźnik, W.; Mielcarek-Bocheńska, P. Odour Emissions from Livestock Buildings. Atmosphere 2022, 13, 254. https://doi.org/10.3390/atmos13020254
Rzeźnik W, Mielcarek-Bocheńska P. Odour Emissions from Livestock Buildings. Atmosphere. 2022; 13(2):254. https://doi.org/10.3390/atmos13020254
Chicago/Turabian StyleRzeźnik, Wojciech, and Paulina Mielcarek-Bocheńska. 2022. "Odour Emissions from Livestock Buildings" Atmosphere 13, no. 2: 254. https://doi.org/10.3390/atmos13020254
APA StyleRzeźnik, W., & Mielcarek-Bocheńska, P. (2022). Odour Emissions from Livestock Buildings. Atmosphere, 13(2), 254. https://doi.org/10.3390/atmos13020254