Article

Marine Air Pollution in Israel: Extent, Proposed Mitigation Targets, Benefits and Feasibility

1
The Environmental Regulation Clinic, Faculty of Law, Bar-Ilan University, Ramat-Gan 5290002, Israel
2
AVIV AMCG Ltd., Rosh HaAyin 4801777, Israel
3
SP Interface, Rehovot 7610001, Israel
*
Authors to whom correspondence should be addressed.
Atmosphere 2022, 13(2), 241; https://doi.org/10.3390/atmos13020241
Submission received: 22 November 2021 / Revised: 24 January 2022 / Accepted: 27 January 2022 / Published: 31 January 2022
(This article belongs to the Special Issue Air Pollution and Human Exposures in Israel)

Abstract

:
Marine air pollution is a major contributor to seaports and coastal air pollution, and Israel has yet to seriously confront this issue. This study aimed to update previous marine air pollution estimations in Israel’s two major ports: Haifa and Ashdod. The objectives were to examine technical and regulatory measures to address the problem, to propose mitigation targets and to estimate their potential benefits. Based on a model of emission-calculations that relies on an updated ship-inventory data as well as real-time ships’ location and movement tools, the combined marine NOx, SOx and PM2.5 annual emissions in these ports were found to be 18,415, 15,128 and 1453 tons, respectively. These values are considerably higher than previous estimates, are comparable to the constant pollution emitted at ground level from a 1000-MW coal powered city power plant and are 3–20 times higher than the industrial and land transportation sectors in these cities. Relatively high nickel concentration in PM was found in Israel only relatively adjacent to the Haifa and Ashdod ports. Since high nickel concentration in PM is today mainly associated with marine air pollution, this finding supports the hypothesis that marine air pollution worsens the air quality in these cities. SOx and PM2.5 emissions can be reduced by 78% and 27%, respectively, if Israel enforces the revised International Convention for the Prevention of Pollution from Ships (MARPOL) Annex VI regulations in its territorial waters. While the latter step can achieve external benefits of NIS 518.4 million/year (EUR 132 million/year), additional mitigation actions and local regulations are suggested, focusing on NOx emissions but also on other pollutant criteria. Such actions can achieve further benefits of NIS 274.3 million/year (EUR 70 million/year). Achieving the suggested targets is challenging yet attainable, and their potential benefits will probably outweigh their costs.

1. Introduction

1.1. Global Marine Air Pollution

Marine transportation and freight are more efficient compared to land and air. Freight of one ton of cargo by air or by land emits 50–2000% more CO2, compared to marine freight [1,2]. However, marine fuels are the dirtiest fuels used. Most ships usually use residual oil fuel, also called heavy fuel oil (HFO) [3,4]. HFO is a low-grade fuel that emits high levels of air pollution upon combustion in the engine. Moreover, it is common that other materials, such as hazardous chemicals, waste oil and motor oil, are blended with the HFO. The use of this mixed fuel is even worse [5], and although some ships use marine diesel that is cleaner than HFO, marine diesel fuel is still associated with high levels of air pollution emissions (SOx, NOx, PM, CO, VOCs and heavy metals) [5,6,7].
Thus, even though the 2017 international marine sector accounted for only 3% of the global greenhouse gas emissions [8], it accounted for 13% and 20% of global SOx and NOx emissions, respectively [1,8,9,10] (see Figure 1). While some of this air pollution is emitted at sea and poses a health risk only for the crew (and passengers if there are any), 70% of all ship emissions occur within 400 km of the coast [11,12].
Moreover, a significant portion is emitted within a few dozens of km from the coast or within major rivers, and especially near and in ports. There, it often affects coastal and inland air quality, where hundreds of millions of people reside [13,14,15,16]. About 62,000 deaths, and USD 156 billion in health damages costs are attributed to international shipping PM2.5 and ozone air pollution annually [17,18]. These values might even be an underestimation, since PM (particulate matter) from marine sources is known to be especially enriched with toxic heavy metals and polycyclic aromatic hydrocarbons, that are more harmful for health compared to ‘regular’ PM [19,20].
The challenge of dealing with air pollution from ships harboring at coastal waters and ports is a complex one [6,21]. It is estimated that in the absence of sufficient policies, ship emissions might grow by 50–250% until 2050 [1,3,7]. One of the main reasons for this is that marine air pollution is one of the last air pollution sources to be globally regulated by international standards [1,6]. Furthermore, while local jurisdictions can restrict air emissions within 12 nautical miles from their shorelines (territorial waters), they cannot dictate design, structure, staffing and equipment. Only the International Maritime Organization (IMO) can approve air pollutant emissions’ restrictions beyond that region (within exclusive economic zone and international waters) [6,21,22]. This makes any local (state) jurisdiction attempt to establish emissions’ restrictions on ships (within the 12 nautical miles), to be highly dependent on the IMO’s related regulations as well as specific actions made by other local jurisdictions in the region (such as group of states within certain sea-zones).
An Emission Control Area (ECA) is usually an area of sea or ocean waters, within 370 km (200 nautical miles) of the coast, in which stricter controls are established to minimize airborne emissions from ships. An ECA can be approved only by the IMO. In an SOx ECA (SECA), SOx emissions are restricted; in a NOx ECA (NECA), NOx emissions are restricted. Present ECAs exist along North America, Northern Europe, and the United States and France Caribbean coasts [23]. Both SECAs and NECAs, are based on implementing the full International Convention for the Prevention of Pollution from Ships (MARPOL), which includes IMO’s Tier III (Appendix B, Appendix G and Figure A1) MARPOL Annex VI regulation 13 [5,7,23,24,25].
Following the establishment of the North Sea SECA in 2007 (reducing sulfur fuel content from 4.5% to 1.5%), SOx emissions from ships dropped by 45% [26]. Lowering the SOx limit even more from 1% to 0.1% was followed by a further three-fold reduction in the relative ships SOx contribution to air pollution [27].
Additionally, implementation and enforcement of the recent MARPOL Annex VI amendment for use of fuel with up to 0.5% of sulfur [28], can significantly reduce Sox emissions globally. Regardless of these global air pollution emissions’ restrictions, for 20 years now, regional, national and local regulations in the developed world [24,29,30,31,32,33,34,35,36,37,38,39,40] and recently also in China [41,42,43,44,45], are successfully reducing marine air pollution.
Air pollution mitigation techniques vary in their technical complexity and cost (see Section 3.2.1 and Appendix G). They include measures such as speed-control, conversion to alternative fuels, scrubbers installation, connection to electric shore power (ESP) and engine modification or replacement [23]. Particularly in the case of NOx emission reduction techniques, some of these techniques require retrofitting large fleets of relatively older ships. Since the lifespan of a ship can reach to more than 25 years, such older ships constitute a significant portion of most international fleets [46,47,48].

1.2. Marine Air Pollution in Israel

To the best of our knowledge, no previous peer-reviewed papers have been published aiming to calculate air pollution emissions from ships in Israel, while examining feasible mitigation scenarios and their potential benefits. One previous non-peer-reviewed report that used 2007 data, calculated that ships are responsible for 0.003–5.6% of air pollutants in Israel, expressed mainly in emissions of criteria air pollutants such as SOx, NOx and PM2.5 [49]. These emissions which were 3–9 times higher than their relative CO2 share, were not spread evenly across the country, but rather mostly emitted next to the two main ports in Israel: the Haifa and Ashdod ports. Each of these ports is located adjacent to a highly populated area; approximately 550,000 and 250,000 inhabitants live within 10 km of these ports, respectively [50,51,52]. The elevated levels of air pollution around the Haifa-bay area are considered a well-known public issue, and some studies have also correlated the latter with increased risk of adverse health effects in specific areas around the bay [53,54,55].
Interestingly, the total calculated NOx and SOx emissions for Israeli marine vessels in 2007 was similar (~9000 ton/year) and three times lower respectively, compared to that of oil refinery operations in Israel [49]. However, while local regulations have since forced industrial air emissions to decrease, the lack of local regulations in the marine sector coupled with the rise in marine activity probably led to a shift in the balance of air pollution between the two industries. For example, SO2 emissions from Oil Refineries Ltd. (ORL or BAZAN), famously known for being a high source for air pollution in Israel, and particularly in the Haifa Bay [56], dropped by 80% between 2009 and 2014 [57,58]. In principle, any country can establish local marine emission restrictions within its own territorial waters. For example. China is restricting emissions in its own Domestic ECA (DECA) [41,42,43,44,45]. However, for a ‘small marine actor’ such as Israel, it appears to be a challenging task from both regulatory and economic perspectives. Moreover, to date, Israel has not yet established the legal framework that can allow it to enforce in its territorial waters the 2020 MARPOL Annex VI regulation. This regulation is important as it restricts the use of marine fuel with a sulfur content of up to 0.5%, or alternatively requires the use of different sulfur emissions reduction technique with similar effects.
A future possible Mediterranean SECA, in which ships are restricted to use fuel with sulfur content of up to 0.1%, could further reduce SOx emissions. Yet, declaration of SECA requires international cooperation and agreements [6,22,59,60]. Therefore, until such complex, multinational agreements are achieved, and since the Haifa and Ashdod ports are located close to large populations in the country, special state efforts should be considered to deal with the marine sector. Such efforts, for example, can come in the form of a local state plan for reducing the air pollution and/or in the form of establishment of DECAs.

1.3. Are Marine Emissios in Isreal Higher Than Previously Esimated, and What Can Be Done to Combat the Problem?

The calculation of the 2007 marine emissions mentioned previously, considered emissions only from hoteling and from an hour of maneuvering per vessel. No study in Israel considered emissions from ships in other navigation phases that can also affect the coastal air quality: ships in the stand-by phase, that wait for an average of 2 days within 3 km of the port; and ships cruising between 3–20 km of the ports. These additional emissions are relevant since marine emissions within 20 km (and even further away) from the shore can contribute to shoreline air pollution and to adverse health effects [11,17,41,61].
Moreover, since 2007, marine activity increased by 40–80% in these ports [62,63,64], and new ports are being commissioned in both Haifa and Ashdod (2021–2022) These additional port activities within Haifa and Ashdod are expected to increase marine emissions even further once the new ports are fully operational [65,66]. Therefore, Israeli marine traffic poses an elevated risk today and in the future for the surrounding population, compared to 2007.
Furthermore, no study in Israel has yet presented a mitigation framework to combat this problem and the potential benefits that can be achieved by such a step, while considering regulation-aspects, mitigation technologies, future marine trends, and the expected expansions of marine activities at both Haifa and Ashdod areas due to the new ports that will soon be fully operational.
In this paper it is suggested that the extent of air pollution attributed to ships at the Haifa and Ashdod ports is considerably larger than previously estimated, and while reducing it is highly challenging, it is possible, and it could achieve major external benefits. Four key-items to assist policymakers in determining the priority and means to address the problem are presented: (1) An updated calculation of the level of air pollution emitted from the marine sector in the Haifa and Ashdod ports; (2) Proposed targets for reducing the current air pollution levels from this sector (for the year 2030), based on a combination of feasible solutions that can be incorporated in a mitigation plan; (3) Estimation of potential environmental–health–economic benefits that can be achieved by such mitigation plan; and (4) Highlight policy and regulatory aspects to consider and prioritize in the plan.

2. Materials and Methods

2.1. Calculation of 2018 Marine Emissions in the Haifa and Ashdod Ports

2.1.1. Calculation of NOx, SOx, PM2.5, CO and VOCs Emissions

A new yearly ship emissions inventory in the Haifa and Ashdod ports was created. It was based on calculation of instantaneous emissions towards the coast, from ships in three marine navigation phases: (1) cruising–sailing within 1–10 km from the port, upon arriving to the stand-by position, and after leaving the port; (2) stand-by–waiting in line within 0.5–5 km from the port before entering the port, and maneuvering–sailing between standby and hoteling and vice versa; and (3) hoteling–docking at the port (see Figure 2).
To characterize the typical daily number of ships entering each port, as a function of the factors affecting ship emissions (described below), a number of data sources were used: previous inventories prior to 2016; further EIA documents from 2016 submitted to Israeli regulatory bodies in request for approval of plans for ports expansions [49,65,66,69]; interviews and collection of information from related Israeli officials; sampling and tracking of daily/weekly/monthly ships` movements and locations at each port during the year 2018. The last data source was from “Marine Traffic.Com”, Global Ship Tracking Intelligence. It has daily tracking information available (based on real-time GPS locations) and a live map that allows for viewing the current placement of each ship, its speed and distance from each port [67].
Related emission factors were attributed to the different types of navigation phases. The following main variables were analyzed and characterized for using related emission factors: number of ships by type, engine size, manufacture year, fuel type and engine duty; average time spent for cruising, maneuvering and stand-by, and hoteling; other physical parameters such as: stacks heights, gas temperature and velocity, emissions rate and more (see Appendix A, Appendix B, Appendix C).
Relevant specific emission factors for NOx, SOx, PM2.5, CO and VOCs were obtained from the Entec Ship Emissions Inventory [70] and the USA EPA AP-42 Emission Factors [71,72]. All emission factors were normalized as detailed in Appendix A and Appendix B. Eventually, the total emissions of each pollutant (from each type of vessel) were divided into the three operational regimes, which are a function of the ship’s navigation phase: cruising, maneuvering and stand-by and hoteling. The emission rates and total volumes are strongly dependent on these navigation phases. For a single vessel, the emissions can be expressed as:
E v e s s e l = E c r u i s i n g + E m a n o e u v r i n g + E h o t e l i n g
where Evessel is all the emissions per vessel, Ecruising is emissions from cruising etc. Fuel types are BFO (Bunker Fuel Oil), MDO (Marine Diesel Oil) and MGO (Marine Gas Oil). When fuel consumption for each navigation phase is known, the emissions of pollutant i, can be calculated by the following equation:
E v e s s e l , i , e , f = p F C e , f , p × E F i , e , f , p
where: Evessel is overall emission from a vessel (ton); FC is fuel consumption (ton); EFi is the emission factor for pollutant i in kg pollutant per ton fuel (kg/ton); i is the pollutant (NOx/CO/VOC/PM2.5/SOx); f is the fuel type (BFO/MDO/MGO); e is the engine type (slow-/medium-/high- speed diesel or gas turbine); p is the navigation phase (cruising, maneuvering, hoteling). An alternative calculation method was applied in cases where fuel consumption per navigation phase were not known. In such cases, the emissions were calculated based on the engine duty installed (power and operation time) at the different phases. In the case of emissions from installed auxiliary engines, a load factor and total time in hours for each phase using the following equation was assumed:
E v e s s e l , i , e , f = p T × P × e c P e c × L F e c × E F i ,   e c , e , f , p
where Evessel is the overall emission from a vessel (grams, g); EFi is the emission factor for pollutant i (g/kWh) (see Appendix B); LF is the engine load factor (%); P is the engine nominal power (kW); T is the time under the specific condition (hour); ec is the engine category (main/auxiliary); i is the pollutant (NOx/CO/VOC/PM2.5/SOx); f is the fuel type (BFO/MDO/MGO); e is the engine type (slow-/medium-/high- speed diesel or gas turbine); p is the phase of the navigation (cruise, maneuvering, hoteling); see Appendix A, Appendix B, Appendix C, Appendix D.
Explanations, data sources and calculations of industrial zones and land transportation emissions in Haifa and Ashdod, and of a typical 1000 MW coal power plant, can be found in Appendix E.

2.1.2. Calculation of Average Nickel Concentration in Total Suspended Particulate (TSP) Monitored by Air Quality Monitoring Stations

Average nickel concentration in TSP (µg/m3 of air) in Israeli air quality monitoring stations for 2018 was calculated using data from the 17 monitoring stations that measured nickel during 2018 [73,74]. Each station measured nickel concentrations between 1–26 times annually (the monitoring stations do not necessarily measure air quality on a regular basis in every place). Standard deviation was also measured for the nickel concentrations.

2.1.3. Calculation of Different Marine Activities Share in NOx Emissions

The share of different marine activities in NOx emissions was calculated based on the inventory of ships visiting the Haifa and Ashdod ports during 2018, marine vessels and engines emission factors, and the distribution of the time the ships spent in each of the 3 navigation phases; see Section 2.1.1, and the Appendix A, Appendix B, Appendix C.

2.1.4. Calculation of Visiting Ships Manufacturing Year-Range Distribution, for the Haifa and Ashdod Ports

The distribution of the manufacturing year-range of the ships visiting the ports was calculated. The fleet for the year 2018 was calculated based on [49], adjusted to the ports in Israel (based on additional data from [63,64,69]). Prediction for 2030 was calculated for this study as detailed in Appendix D.

2.2. Marine Emission Mitigation

2.2.1. Marine Emission Feasibility Assessment of Mitigation Techniques

The feasibility of marine emission mitigation techniques was assessed qualitatively by the following criteria: cost, installation time, technique maturity, technique prevalence in ships and ports around the world and special considerations regarding implementation in Israel.

2.2.2. Calculation of Future Emission Scenarios for 2030

First, a ‘business as usual’ (BAU) emission scenario was created for the year 2030, assuming no specific proactive local (state) regulations and mitigation actions are applied, except for the enforcement of MARPOL VI (regarding use of fuel with sulfur of up to 0.5% or other measures with a similar SOx and PM reduction effect). This scenario also considered the upcoming expansions of both Haifa and Ashdod ports, in accordance with current national plans for building and operation of Hamifratz and Hadarom ports next to Haifa and Ashdod ports respectively [65,66]. The expected replacement rate of older ships with newer ships (in international fleets) was also considered.
The BAU scenario was then compared to a mitigation scenario, which was based primarily on several suggested state proactive steps for mitigating the emissions (compared to BAU), referred to as the MPS (‘Mitigation Plan Scenario’). The MPS was constructed by:
(a)
Reviewing various mitigation techniques that can be applied on ships to reduce NOx, SOx, PM2.5, CO and VOCs emissions. This was carried out while considering that some new ships manufactured since 2016 have to meet more strict emission standards [23,75], and yet as suggested in this paper, their portion in fleets is expected to be limited even by year 2030. So, the MPS focused on techniques that can be used on existing ships (up to Tier II). Additionally, other non-technological “soft” management methods were considered. For example: port congestion management, control on ship speeds, imposing green levies related to specific emissions and other types of management and operational aspects that can affect air pollution performance around ports areas.
(b)
Determining the feasibility of each technique, based on if the technique has been well proven as a technically feasible method (used in ships) while considering its emission reduction effectiveness and cost-efficiency.
(c)
Calculating emission scenario after implementation of a mitigation plan, based on creating different sub-emission reduction scenarios which rely on varying portions of incorporation of the different available mitigation techniques. The MPS assumes that one holistic policy framework is implemented to require and/or incentivize the techniques incorporation, while considering that there are different ways (combinations of techniques) that can lead to a general mitigation outcome (‘mitigation scenario’). The outcome of the mitigation scenario assumed the following key elements: (1) All ships at each port would comply with MARPOL VI concerning use of fuel with sulfur content of up to 0.5%; (2) A total of 70% of the current most polluting ships at each port would install NOx reduction technologies, would use LNG (liquefied natural gas) as alternative fuel, or would convert hoteling engines to electric auxiliary engines powered by ESP (electric shore power); (3) The other 30% of these ships would allow stand-by for porting at distance of at least 5 km from each port/ shore; see Appendix D.

2.3. Calculation of Emissions’ Environmental-Health Damage Cost and the Potential Benefits of MPS

The 2018 combined Haifa and Ashdod ports emissions environmental-health damage cost (externalities) was calculated. Using Haifa and Ashdod ports combined NOx, PM2.5 and SOx emissions calculation for 2018 (Figure A2 in Appendix D), BAU 2030 and MPS 2030 scenarios and the externalities costs for marine air pollutants as presented in the Israeli Ministry of Environmental Protection Green Book [76], the emissions environmental-health damage cost were calculated per air pollutant, per scenario (see Appendix E). The differences between BAU 2030 and the present costs, and between BAU 2030 and the MPS 2030 costs, were calculated, based on the following formula:
M P B = p E B i × C i E A i × C i
where MBP is the Mitigation Plan Benefits; EBi is Emissions (in ton) of pollutant i in BAU scenario (assuming no mitigation is applied); Ci is Damage costs (externalities) in ILS2020 (NIS: Israeli Shekels) per ton of emissions of pollutant, based on recent prices accepted in Israel for the year 2020, published by the Israeli Ministry of Environmental Protection [76]; EAi is Emissions (in ton) of pollutant, assuming mitigation plan is applied. The criteria pollutants included in the MPB were SO2 as SOx, NOx and PM2.5. Average EUR2020 (Euro) to ILS2020 exchange rate for 2020 was 3.92 ILS [77].

3. Results and Discussion

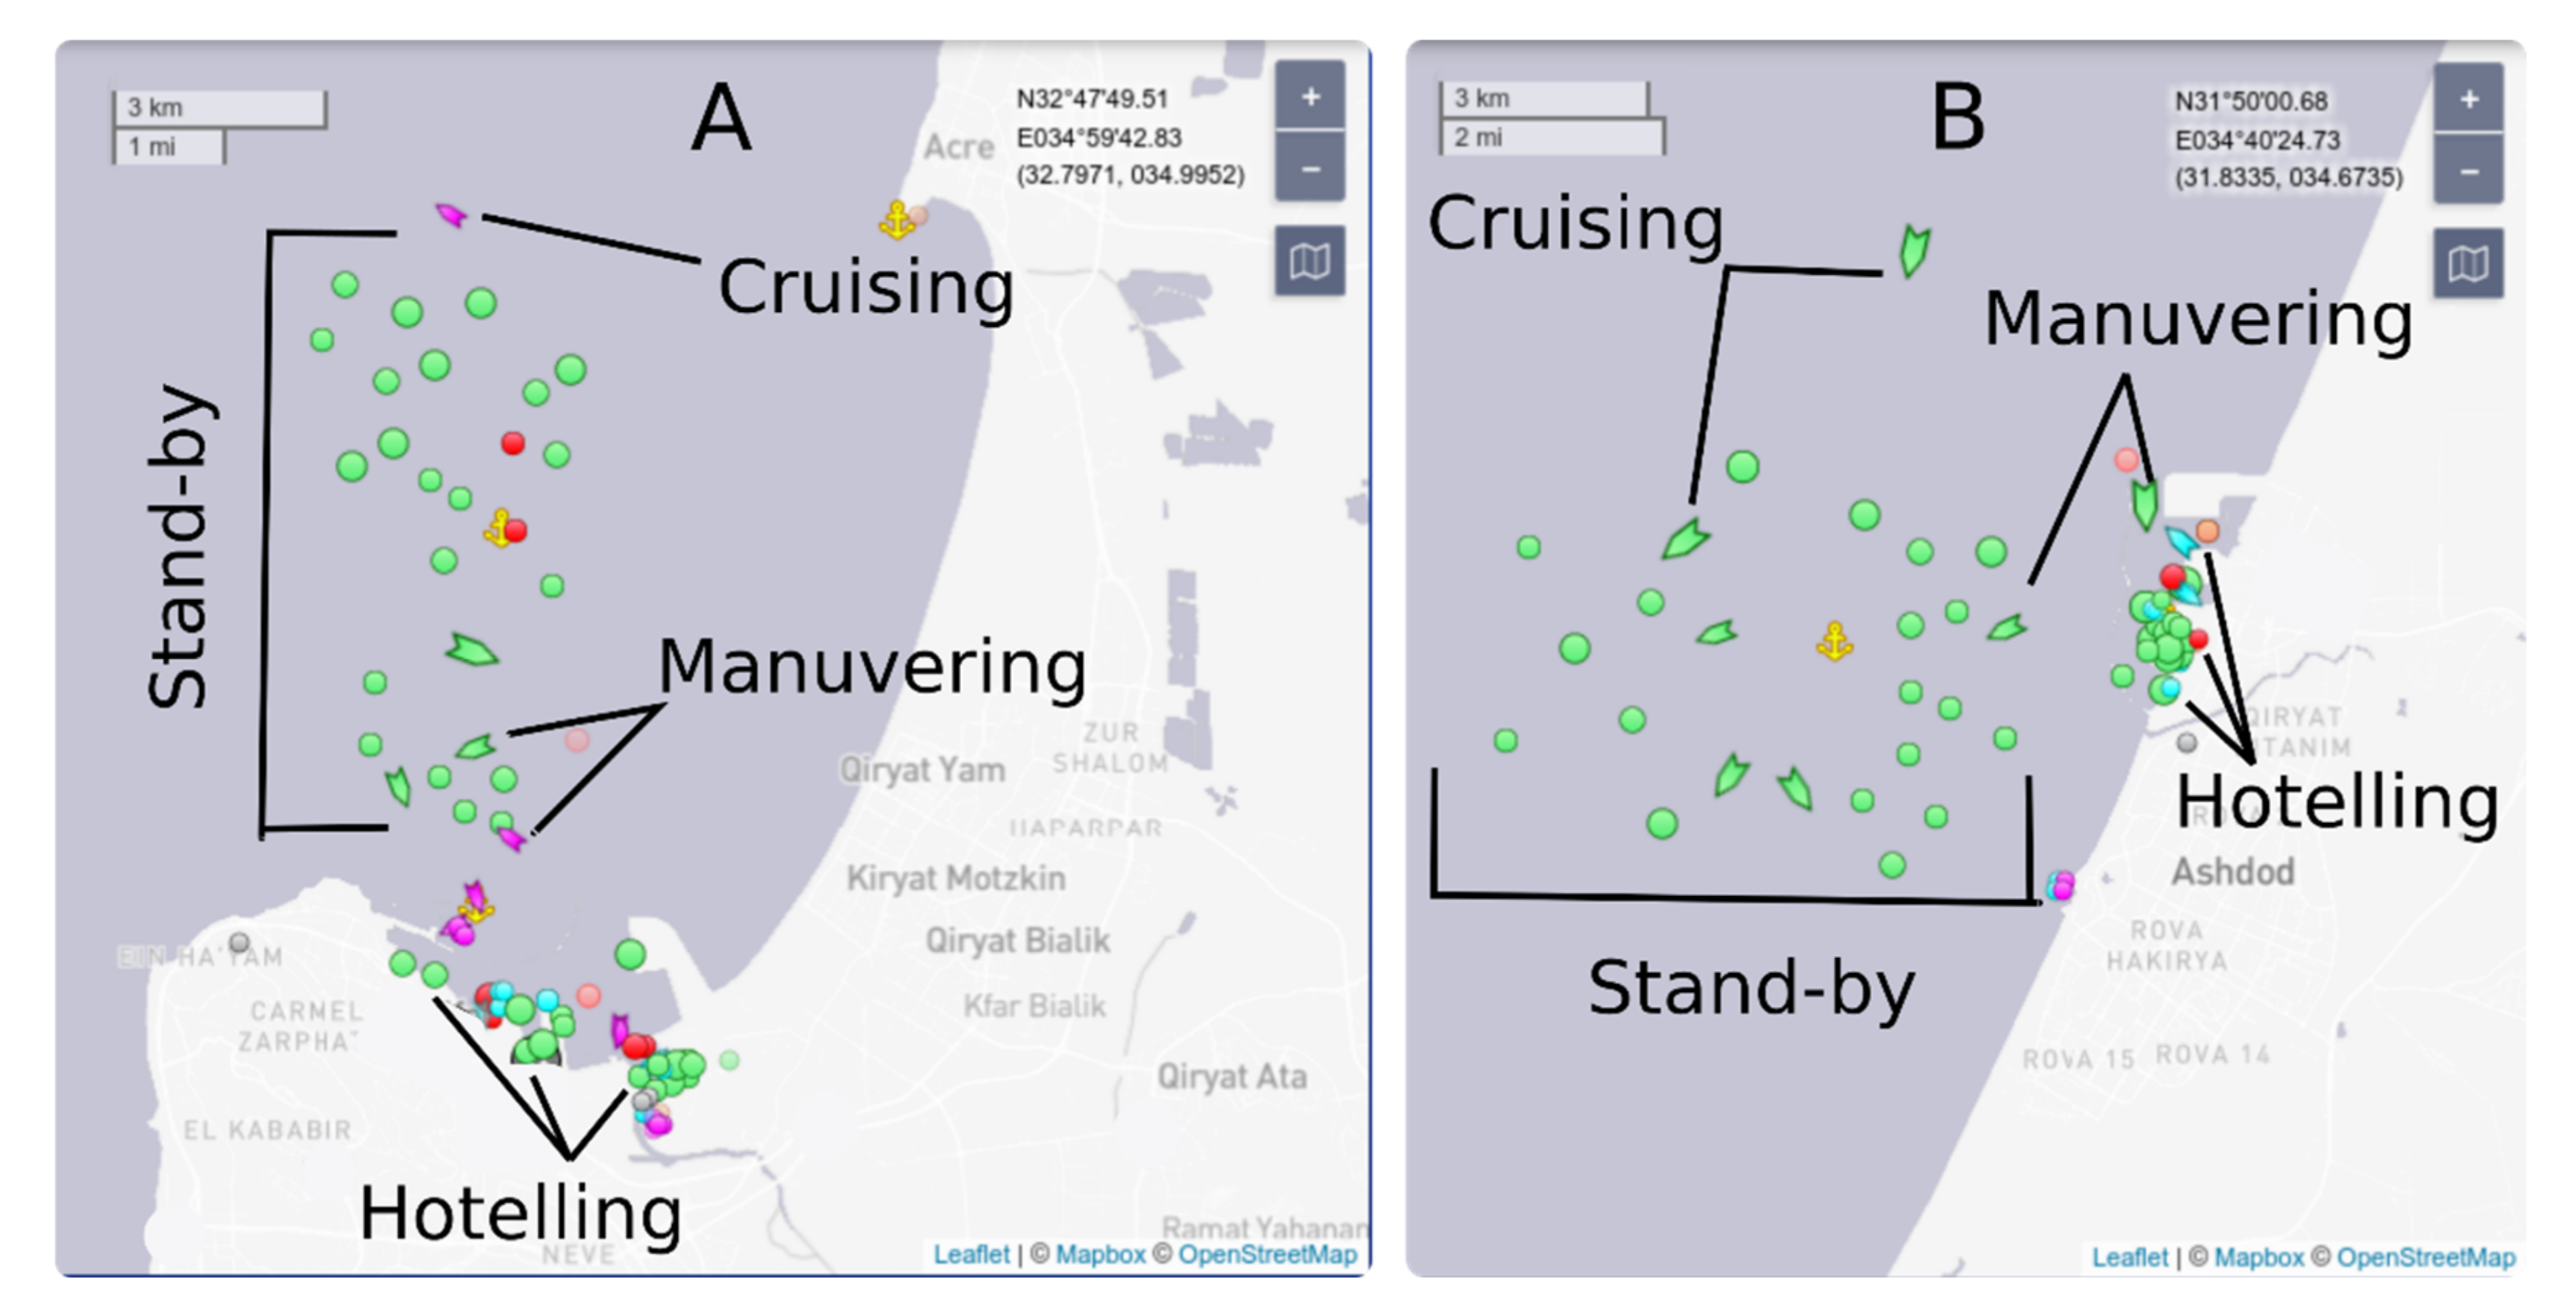
3.1. Marine Vessels Air Pollution Emissions in and Adjacent to the Haifa and Ashdod Ports for 2018

3.1.1. Total NOx, SOx, PM2.5, C, and VOCs Emissions from Marine Activity

Haifa and Ashdod ports marine vessels air pollutants emissions were calculated for 2018 by preparing updated ships’ emissions inventory and using relevant emissions factors (see Section 2.1.1, and Appendix A, Appendix B, Appendix C).
The current calculated annual air pollution emissions from both Haifa and Ashdod ports are provided in Figure 3. The emitted pollutant criteria with relatively high values are NOx, SOx, and PM2.5, with all other pollutants examined (VOCs, and CO) reaching relatively lower values. From Haifa port, the emissions are 11,167 ton/year NOx, 8877 ton/year SOx, 889 ton/year PM2.5, 444 ton/year VOCs and 1778 ton/year CO. From Ashdod port, the emissions are 7248 ton/year NOx, 6251 ton/year SOx, 564 ton/year PM2.5, 281 ton/year VOCs and 1127 ton/year CO.
This difference in marine activities between Haifa and Ashdod reflects the fact that the total emissions of all pollutants examined in Haifa port are higher than in Ashdod. Absolute emission values are presented in Figure 3A, and values normalized to the emissions of the Haifa port are presented in Figure 3B (to present the ratio between the different emission sources).
To provide perspective, the Haifa and Ashdod ports emissions were compared to the emissions from the Haifa Bay and North Ashdod industrial zones, from the Haifa metropolitan and the Ashdod area land transportation, and from a typical 1000 MW coal power plant. The Haifa and Ashdod ports NOx emissions were comparable to those of a 1000 MW coal plant, and 3–12 times higher than that of the industrial zones, and land transportation. VOCs emissions from the ports were 37–60% lower than that of the Haifa Bay industrial zone, similar or 40% lower than the those of the Haifa metropolitan land transportation and the North Ashdod industrial zone and similar to or twice as high as that of the Ashdod area land transportation.
SOx emissions in the ports were about half of the typical 1000 MW coal plant, and 10 times higher than those of the industrial zone. PM2.5 emissions from the ports were 4–20 times higher than those of the sectors. CO emissions from the ports were 55–70% lower than that of the Haifa metropolitan land transportation, similar to or 40% lower compared to that of the Ashdod area land transportation, and 1.4–2.2 times higher than that of a typical 1000 MW coal power plant.
Such a high air pollution burden attributed to the ships at the ports is especially concerning when considering that both Haifa and Ashdod are the third and sixth highest populated cities in the country, respectively, and within 10 km of each port, approximately 550,000 and 250,000 inhabitants live, respectively [50,51,52]. Both ports are located next to large industrial zones with many heavy industries, such as oil refineries and various chemical factories. And yet, the ships’ NOx, PM2.5 and SOx emissions overwhelmingly surpass the emissions from all other sources in and next to the cities.
While all active coal power plants emit their emissions through a 100–300 m chimney that reduces the air pollutants concentrations once they flow back to ground level, marine vessels emit their air pollutants at ground level or up to a few dozens of meters of the ground. Therefore, marine vessels’ air pollution, could be more harmful to the nearby population, compared to a coal power plant air pollution with similar emissions [78,79].
The ports’ air emission values were 2–3 times higher than the previous estimation [49]. It is suggested that the present calculations are higher due to two main reasons: first, the present data are more updated as they represents port activities during 2018, as opposed to the previous calculated data for the year 2007. Between 2007–2018, the shipment activity at both Haifa and Ashdod ports increased by 40–80%, depending on the port and on the type of port activity examined [62,63,64,80]. This activity can be measured by the number of container cargos, liquid, bulk or other types of cargos handled in the port per year.
Second, the previous estimation has calculated yearly emissions primarily based on the total annual number and type of ships entering the ports, and took into account only emissions from hoteling and from an hour of maneuvering. However, the present study found that on an average operational moment, approximately 40 ships are hoteling at the Haifa port, while an additional 20 ships are waiting in line at the stand-by area, about 2 km from the port. Similarly, in the Ashdod port at any typical moment, there are approximately 30 ships hoteling and 10 ships waiting in line (see Figure 1 and Appendix C).
For comparison, the Piraeus port in Greece (the most active passenger port in Europe) had almost 18,000 ship calls in 2018, while Haifa and Ashdod had 3500 and 2300, respectively. Most of the ship calls in the Piraeus port (13,000) are of relatively small passenger ships, while almost all of those in Haifa and Ashdod are of cargo ships. The Piraeus port handled about 1,000,000 TEUs (20-foot equivalent unit) of cargo, while Haifa and Ashdod handled about 1,500,000 TEUs each [63,81,82,83].
Between 2009–2018, while ship calls in the Piraeus port rose from 10,500 to 18,000, SOx emissions dropped from 722 to 191 ton/year, and NOx emissions rose from 1790 to 4366 ton/year. The relatively low values and decline in SOx emissions compared to Haifa and Ashdod reflect the low sulfur content allowed in marine fuel in EU ports and in passenger ships in the EU (0.1% today). The increase in NOx emissions reflects an increase in marine activity and the fact that there were no effective NOx mitigation regulations in place. Still, the Piraeus port NOx emissions are only 60% and 40% of those of Ashdod and Haifa ports, respectively [63,81,82,83].
Furthermore, for the Piraeus port, only emissions from the hoteling and from one hour of the maneuvering navigation phases were, considered, while in the present study cruising emissions were also considered (comprising 17% of the emissions; see Section 3.1.3). Lastly, the stand-by time in the Ashdod and Haifa ports is relatively long (about 2 days prior to the COVID-19 pandemic) and was considered in the present study but was not considered in the Piraeus port studies [63,81,82,83].

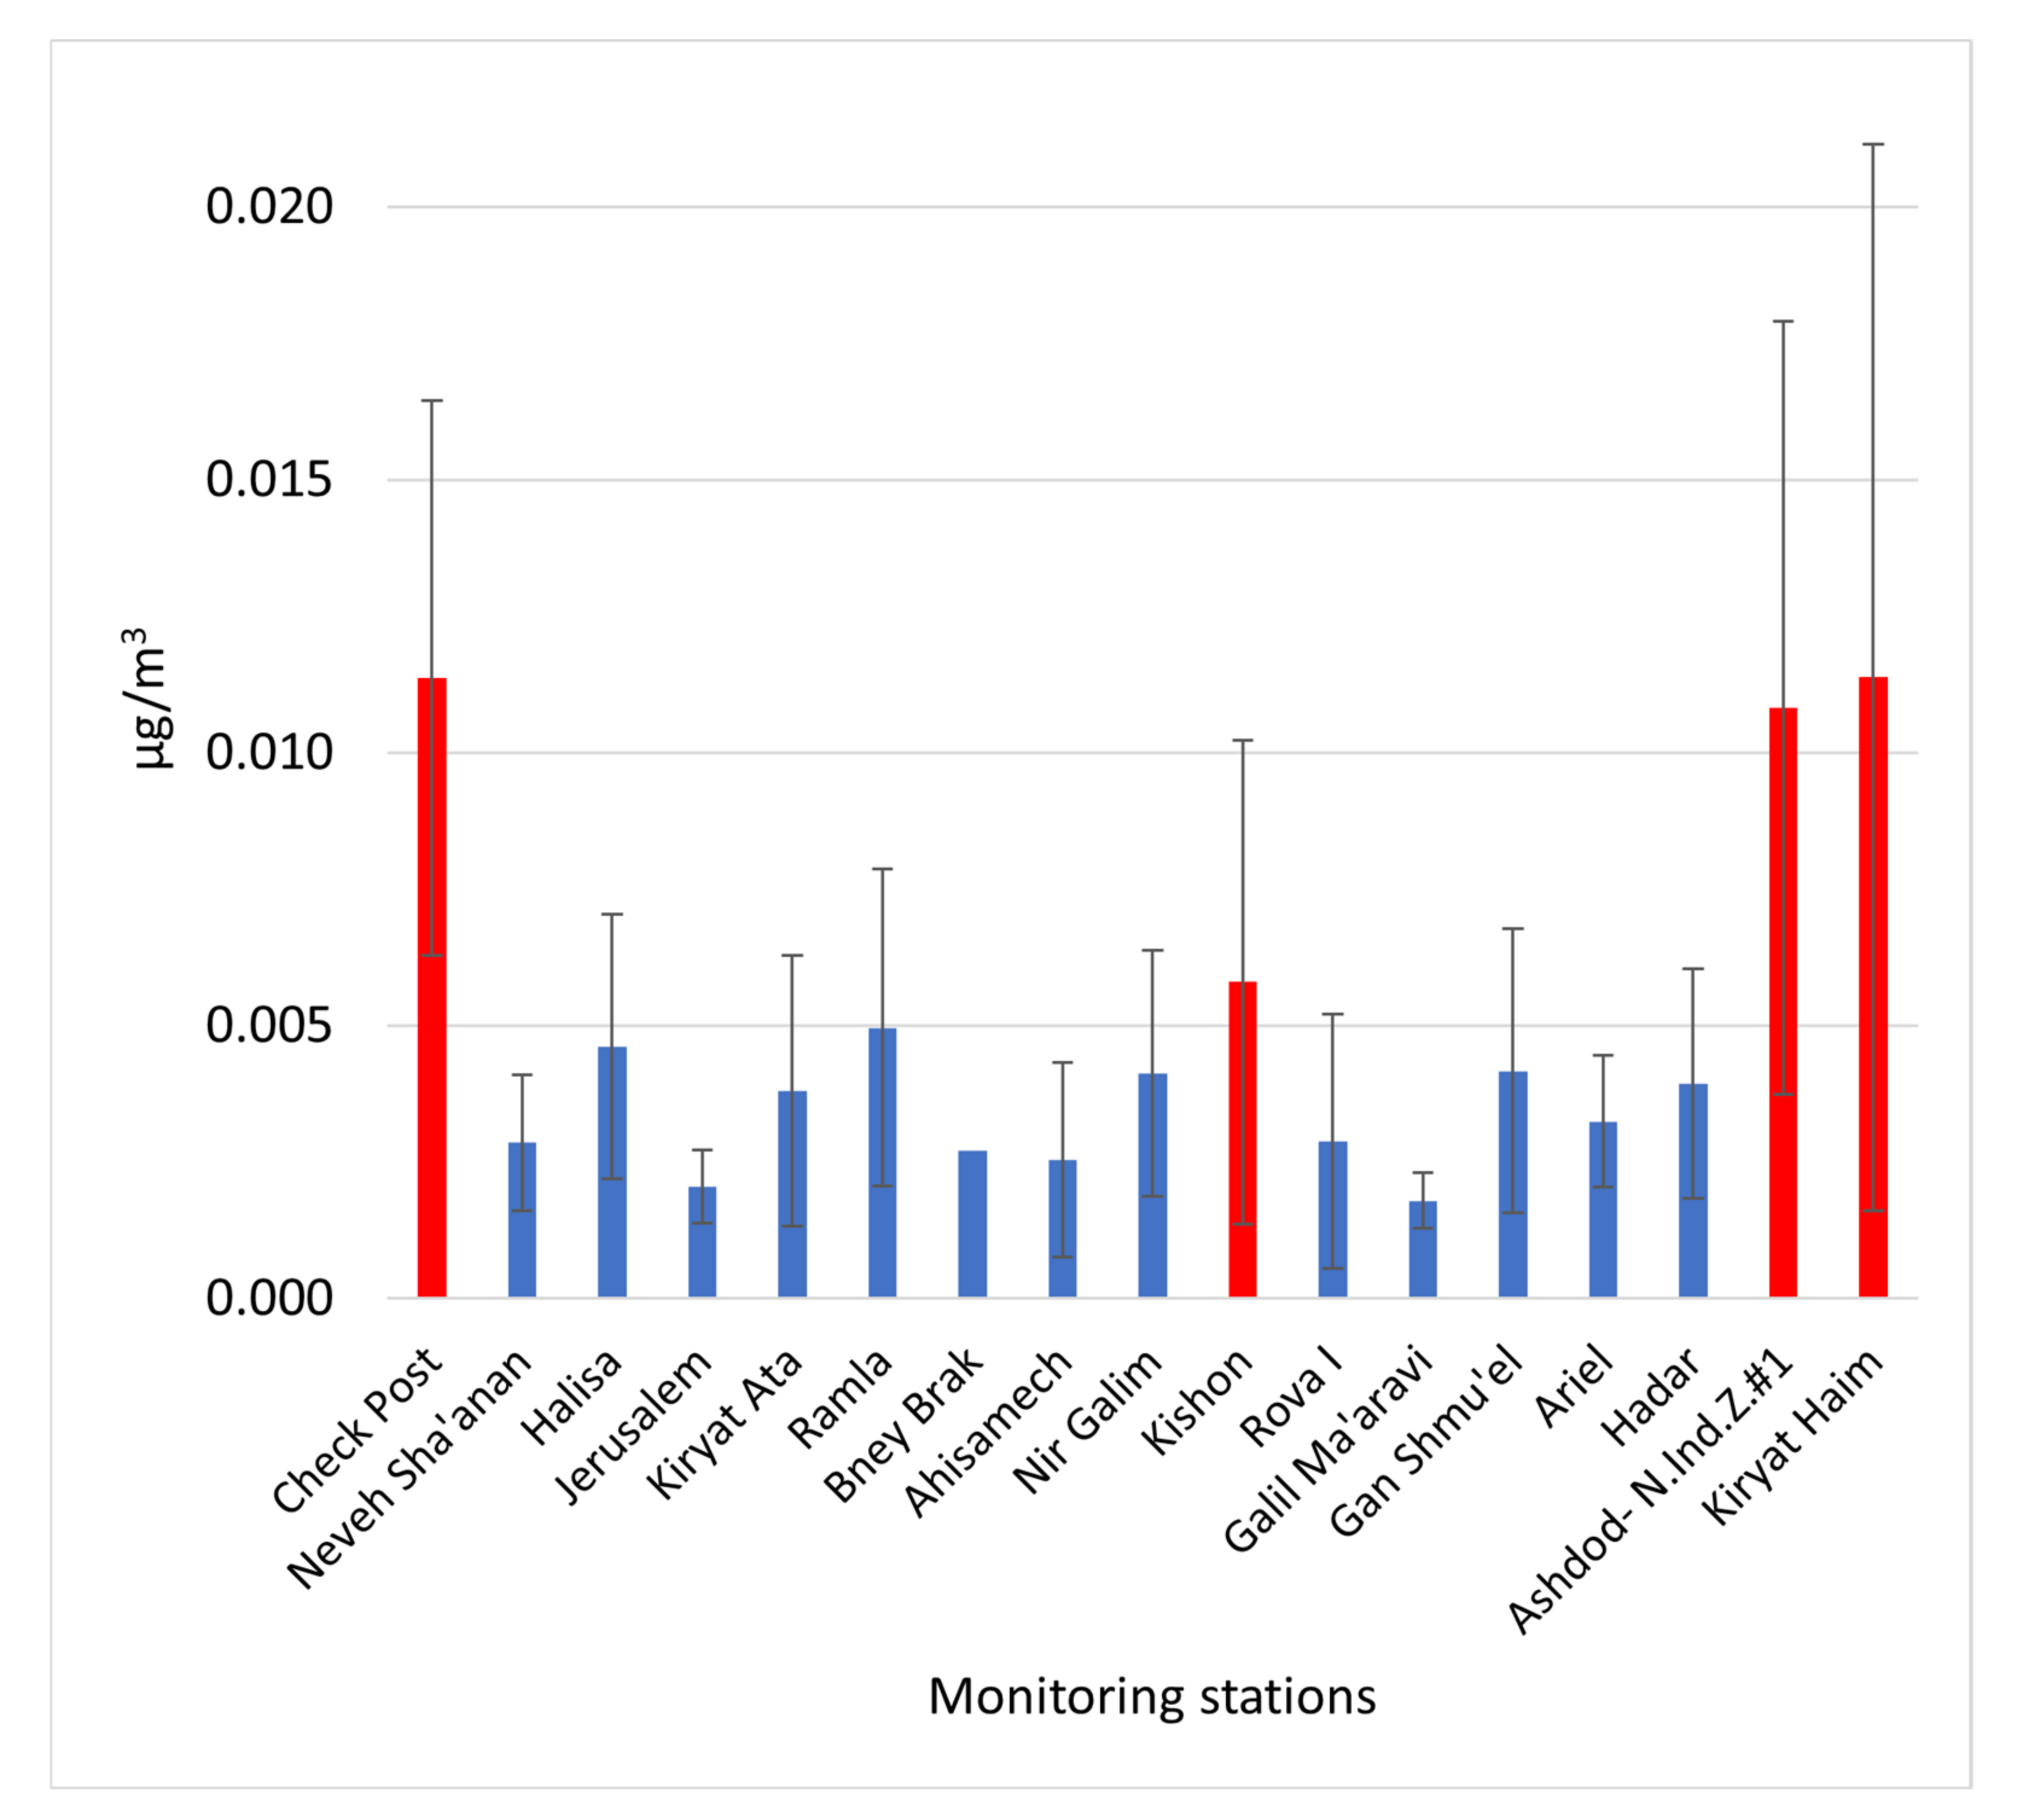
3.1.2. Relatively High Nickel Concentration in TSP (Total Suspended Particulate) was Measured Only Relatively Close to the Haifa and Ashdod Ports

While other polluting sectors, such as the industrial and land transportation sectors, are monitored in Israel, the marine sector air emissions are currently not directly monitored. There are no air quality monitoring stations in, near or around the Haifa and Ashdod ports. The closest monitoring stations are a few km away. Therefore, it is difficult to measure the actual effect of marine air pollutants that are also emitted by other sectors (SOx, NOx, PM, etc.), in these cities.
Nevertheless, it is known that marine vessels are a major source for air pollution with toxic heavy metals, such as nickel, vanadium, mercury, arsenic, led and cadmium [17,18,19,20,84,85,86,87,88,89,90,91,92]. Specifically, nickel is mainly emitted from coal, petcock and heavy fuel oil combustion. Since coal and petcock use is dwindling in Israel, and since facilities that use coal and petcock employ dust and PM emissions’ reduction techniques that significantly reduce heavy metals air emissions, heavy fuel oil combustion by marine vessels is the major contributor for nickel air pollution in Israel [88,89,90].
According to the Israeli Ministry of Environmental Protection, 89% (about 7000 tons/year) of all nickel emissions in Israel are from marine vessels (for 2018). Other nickel emission sources are electricity production and industry [88]. To confirm that marine air emissions reach the local population living around the ports, nickel concentration in TSP (total suspended particulate) was studied in air quality monitoring stations’ data.
During 2018–2019, there were 17 monitoring stations in Israel that measured nickel concentration as a fraction of TSP. In these two years, the Israeli daily nickel target value (0.025 µg/m3) was exceeded by 6 times, all of which were in Ashdod and Haifa [74]. During 2018, among these 17 monitoring stations, only 4 stations (Check Post, Kishon, Ashdod N.Ind.Z.No.1, Kiryat Haim) measured an average daily nickel concentration as a fraction of TSP higher than 0.005 µg/m3 (red bars, Figure 4). These four stations are within 3.5 km of the Ashdod and Haifa ports, and are downwind to prevailing winds from the ports and ships stand-by areas (wind data are from the Ashdod and Igud-Haifa meteorological stations in [91]). Three of the four monitoring stations had average values of 0.011 µg/m3, that are 3.3 times higher than the average of the 13 stations with low nickel concentration as a fraction of TSP [73].
Besides the ports, Haifa and Ashdod have no coal use within at least 20 km from the cities, but they both have oil refinery facilities that produce petcock that can be the source for the nickel air pollution. As there were no monitoring stations in or near the ports during 2018–2019, a more certain conclusion for the nickel air pollution source in Haifa and Ashdod could be reached if future monitoring stations will be placed in and around the ports. However, it is worth noting that low nickel concentrations as a fraction of TSP were found next to Israel’s largest petcock user, Nesher Ramla cement factory (Ramla and Ahisamech monitoring stations, Figure 4), and next to Haifa’s petroleum refinery (Kiryat Ata monitoring station, Figure 4). So, it is less likely that these facilities contribute much to high nickel air pollution, as was found closer to the Haifa and Ashdod ports.
Moreover, the current Israeli daily nickel target value (0.025 µg/m3), is higher than the value recommended by the WHO, which is 0.020 µg/m3, and that is the value in other developed countries [92]. Interestingly, the Israeli Ministry of Environmental Protection is promoting (2022) an update of the air pollutant target values, based on the WHO recommendations, and is proposing to lower the daily nickel target value to 0.020 µg/m3 [93,94]. While during 2018, the Israeli daily nickel target value (0.025 µg/m3) was exceeded by 3 times, the proposed 0.020 µg/m3 value, was exceeded by 7 times. In the Kiryat Haim monitoring station, relatively close to the Haifa port and relatively far from the Haifa Bay petroleum refinery (the other possible nickel air emission source in the area), over 15% of the measurement exceeded the 0.020 µg/m3 value.
This data support the hypothesis that marine air pollution from the Haifa and Ashdod ports affects the onshore air quality around the ports. It is suggested that new monitoring stations should be installed in, near and around the Ashdod and Haifa ports, to better monitor their effect on the urban air pollution.

3.1.3. Share of Different Marine Activities in NOx Emissions

To calculate the total emissions from marine activities in the Haifa and Ashdod ports, and also to allow calculation of mitigation scenarios, the share of different marine activities in NOx emissions was calculated (see Section 2.1.1, and the Appendix A, Appendix B, Appendix C).
The ports’ NOx emissions being the highest of all emissions, represents a special challenge compared to SOx and PM2.5. This is since, while SOx and PM2.5 can be significantly reduced by using fuel with lower sulfur content (as required by MARPOL VI and as expected to be enforced in Israel), NOx emissions can only be reduced on existing (older) ships by retrofitting them with costly technologies. Of the total emissions of NOx, 54% are emitted during the ships hoteling, while 29% and 17% are attributed to the maneuvering and stand-by and cruising activities, respectively (see Figure 5).
During hoteling, the ships are using their auxiliary engines to provide energy to their onboard systems that must also remain active during hoteling. These engines are much smaller than the engines used for cruising, yet the hoteling stage expands on extended time (of approximately 2–3 days) compared to other activities, and they use the same fuel as the main engines. This means that connecting the ships to electric shore power can eliminate more than 50% of all direct NOx emissions from ships (see Figure 5) as well as a similar portion of all the other direct air pollutants (see Appendix A, Appendix B, Appendix C, Appendix D).

3.1.4. Distribution of Visiting Ships Manufacturing Year, for the Haifa and Ashdod Ports

For calculation of both 2018 and 2030 marine vessels’ air pollution in the Haifa and Ashdod ports, ports visiting ships manufacturing year distribution was calculated. The portion of relative older ships versus newer ships entering the ports in Israel is highly dependent on their typical portion in international fleets. In principle, older ships pollute more than newer ships. Ships that were built before 2000 are referred to as having a Tier 0 standards’; ships constructed between 2000–2011 must comply with Tier I standards; ships constructed after 2011 must comply with Tier II standards; and ships built from 2016 and on and are operating within a NECA, must comply with Tier III standards. Tier II standards are 15–20% better than Tier I, and Tier III standards are 5 times better than Tier I [75,95].
Based on the typical international distribution of exiting ships by year of manufacture [47] and the typical slow replacement of ships in international fleets [46,47,48], it is estimated that by year 2030, only 16% of the current portion of the oldest ships will be replaced with ships that comply with the latest EPA NOx standards (see Figure 6).
By year 2030, all ship activities are expected to increase at both Haifa and Ashdod cities. This is because by 2022, the new Hadarom port (next to Ashdod port) and Hamifrats port in Haifa bay are planned to become operational, while the Israeli population, economic activity and consumption are expected to grow [96,97]. Therefore, it appears impossible for NOx emissions to significantly decrease at Israel’s ports, unless NOx emissions are restricted.

3.2. Marine Emission Mitigation in Israel

3.2.1. Emission Mitigation Techniques and Their Feasibility in Israel

There is an array of mature marine air pollution mitigation techniques. To calculate the possible marine emissions mitigation scenarios in Israel, the feasibility of mitigation techniques was assessed as described in Section 2.2.1. An extensive list of the mitigation techniques and their characteristics can be found in Appendix G.
Some mitigation techniques can be considered as ‘softer` management techniques, as they are not associated with retrofitting ships with costly mitigation-technologies. For example, increasing the stand-by distance of ships away from the port and controlling ship’s speed. These techniques can be applied immediately with an instant effect, at no cost, and thus with a very high cost-efficiency. However, ‘softer’ measures are usually more limited in their effectiveness, while the more sufficient measures are associated with incorporation of costly after treatment systems (such as Selective Catalytic Reduction (SCR) and scrubbers) or investing in specific engine conversions (see Appendix G).
Furthermore, some techniques can be more effective in reducing emissions on several ships’ navigation phases. For example, stand-by and maneuvering, cruising and hoteling phases as in the case of the after-treatment techniques or the use of cleaner alternative fuels. Other techniques are effective against only one navigation phase as in the case of electric shore power (ESP), which eliminates all direct emissions from hoteling, but does not mitigate emissions from stand-by and maneuvering and cruising.
In terms of costs, some techniques are more feasible for ships which are originally designed to apply them, as in the cases of connecting to ESP or using liquid natural gas (LNG) as an alternative fuel. In such cases, applying the techniques may even be economically beneficial for those ships (due to savings in operational costs), provided that related infrastructure exists in the port, such as: ESP infrastructure and LNG fueling station.
Table 1 summarizes the main different techniques that can potentially be applied. The performance, suitability and compatibility of each technique depend on various specific technical features of each ship, as well as technical-operational and strategic-management considerations by fleet owners. For certain ships, a combination of techniques might be required to comply with stricter local emission regulations.
For example, relatively older ships might need to apply an EGR or SCR system for reducing NOx and to use low-sulfur diesel to reduce SOx, while for others, only one measure can potentially be sufficient. Relatively newer ships can connect to ESP or can run on LNG, and therefore can potentially comply with most strict regulations (even beyond NECA and SECA) without any need to apply further steps.

3.2.2. Emission Mitigation Scenario for 2030

The Mitigation Plan Scenario (MPS) for the Haifa and Ashdod ports was developed and was compared to present emissions (2018) and the business as usual (BAU) scenario for 2030. This was carried out to assess the possibility of future air pollution mitigation in these ports, and to suggest a plausible path for which to achieve it. The emission mitigation scenario was developed using available technologies and regulatory tools (see Section 2.2.2 and Section 3.2.1 and Appendix D).
Regulatory bodies (such as the Israeli Ministry of Environmental Protection) normally avoid dictating to the industry regarding a specific technological solution that should be chosen for pollution reduction if it meets certain criteria such as emission standards and/or mitigation targets. In this case, it is suggested that such policy is especially important. Since ship owners operate internationally, they have to consider various technical, operational and economic aspects regarding the most feasible technique for specific ship, company and port.
Accordingly, Figure 7 represents a proposed overall emission reduction scenario for 2030 compared to BAU scenario. The BAU scenario assumes that no local NOx and SOx related mitigation plan is applied, besides enforcement of MARPOL VI. The MPS scenario considers several sub-alternative reduction scenarios, which assumed different variations in incorporation of any of the existing techniques (see Section 3.2.1, Appendix D). All these variations enable achieving similar mitigation targets, based on the four key elements described in Section 1.3 for the MPS.
If the present estimated emission levels of each type of pollutant (see absolute numbers in Appendix D) equals 1 as a relative baseline, it is predicted that by 2030 in a BAU scenario (no state local proactive mitigation plan is applied), VOCs and CO emissions will increase by 17%. This is due to an increase in ship transport in the ports, as each port is expanded in accordance with current national plans [65,66,69]. Moreover, NOx emission levels would only be reduced by 4% due to this increase in ship transport, coupled with a slow replacement of older ships with newer ships, that have a higher NOx emissions standards Tier.
However, since the BAU scenario assumes that Israel would enforce MARPOL VI in its ports, it is predicted that SOx emissions would drop by 78% even without any further local regulations. Furthermore, since SOx emissions are associated with PM2.5 emissions, it is estimated that the significant drop of SOx emissions in BAU, would also result in a 27% drop in PM2.5 emissions. A feasible NOx and SOx proactive local mitigation plan (MPS 2030, blue columns in Figure 7) can achieve a significant decrease in all emissions compared to BAU. NOx emissions can be reduced by 71% instead of 4% as in BAU, PM2.5 by 57% instead of 27%, VOCs and CO by 36% and 31%, respectively (instead of a 17% increase), and finally SOx can be cut in half compared to BAU 2030 (89% decrease compared to 2018).

3.3. Haifa and Ashdod Ports Air Polution Damage Cost and Mitigation Benefits

To monetize the environmental-health damages of the marine air pollution from each port, the 2018 air pollution emissions data and the air pollutants externalities were used (see Section 2.3, Appendix F and Figure A2).
For 2018, the combined estimated externalities of NOx, SOx and PM2.5 marine air pollution in Haifa and Ashdod is ILS 991 million (NIS 991 million or EUR 253 million) or 0.08% of Israel’s GDP [105] (see Figure 8, and Table A29 in Appendix F). This cost is similar to the 2015 annual cost attributed to air pollution from industrial, land transportation and other land sources in the Haifa Bay, calculated to be ILS 561–1352 million/year (EUR 143–345 million) [58].
When considering the environmental-health damage costs from each type of emission, it appears that strong and effective local enforcement of MARPOL VI is the first and most important step. This is since this step alone can reduce SOx and PM2.5 by 78% and 27%, respectively (BAU 2030 versus 2018 in Figure 8, and in Table A29 in Appendix F), and hence generate external benefits of approximately ILS 518 million (EUR 132 million) per year.
The second most important step as it appears from the model, is establishment and implementation of a NOx and SOx related local mitigation plan. Such a plan in accordance with the emission reduction targets presented in Figure 7 can generate additional external benefits of approximately ILS 274 million (EUR 70 million) per year. Of these costs, approximately ILS 160 million (EUR 41 million) would result from NOx reduction and approximately ILS 68 and 44 million (EUR 17 and 11 million) from further reduction in SOx and PM2.5, respectively, compared to BAU 2030. In total, realization of the MPS 2030 scenario is expected to generate external benefits of ILS 793 million (EUR 202 million) per year, or 0.06% of Israel’s 2018 GDP [105], compared to the present ports’ air pollution external cost.
It is important to note that the aim of the damage cost estimates mentioned is to provide first indications regarding the potential benefits that can be achieved by the different mitigation steps (whether local enforcement of MARPOL VI in BAU or MPS). However, due to lack of current monitoring and lab-analysis data, these estimates do not yet account for potential reduction in overall PM (including PM10), NMVOC, and particularly the specific contaminants that compose these criteria pollutants.
For example, the specific heavy metals attached to PM or the specific organic compounds that compose the NMVOC. The more there is an additional pollution of PM10 (on top of the PM2.5 calculated in this paper) and/or the share of PM with attached heavy metals (by type) is higher and/or the share of more toxic organic compounds is higher (as part of the NMVOC criteria), the higher are the damage costs from the ships’ emissions.
More specifically, it is known that marine vessels are a major source for air pollution with toxic polycyclic aromatic hydrocarbons and toxic heavy metals, such as nickel, vanadium, mercury, arsenic, led and cadmium [19,20,84,85,86,87,88]. In addition, the Israeli Ministry of Environmental Protection calculated that 89% (about 7000 tons/year) of all nickel emissions in Israel are from marine vessels (for 2018) [88]. These facts together with the findings in this study regarding higher concentrations of nickel around the Haifa and Ashdod ports, compared to the rest of Israel (Section 3.1.2), suggest that the PM2.5 criteria pollutant emitted from the ships, includes a significant share of highly toxic contaminants. If these were accounted for, the damage cost values from the emissions would have been higher.
Moreover, the external cost values (per air pollutant emitted) that were used for the mitigation benefits calculations are the formal acceptable values recommended to be used by the Israeli Ministry of Environmental Protection in case of air pollution emissions from the marine sector in Israel. However, these values are currently 2–10 times lower than similar emissions from onshore stationary facilities from stacks at height below 100 m) [76]. Hoteling ships air pollution externalities in the Haifa and Ashdod ports should be the same as for urban onshore facilities, as they are practically emitting air pollution as coastline facilities from stacks at height below 100 m. Therefore, it is expected that the real external costs could be higher than the costs presented in Figure 8.
Accordingly, it is suggested that the environmental-health benefits potential of the mitigation-steps presented in this paper, should be currently regarded as rather conservative, while acknowledging that the real values may be even higher than those indicated in this paper. Future studies which can integrate related emissions’ monitoring from the ships with lab analysis data (for example, PM size distribution and chemical composition), can assist in providing more accurate estimations.
Previous studies that analyzed the cost–benefit of establishing an ECA in the Mediterranean Sea, concluded that the benefit from realizing this plan is 3–8 times higher than the cost, and will save ~4000 premature deaths annually in the area (a few hundred in Israel) [15,16]. These studies support the hypothesis that the benefits from mitigating marine emissions outweigh the cost.
When compared to the studies conducted on the Piraeus port (Section 3.1.1), The 2018 Haifa and Ashdod ports externalities are about 5 times higher per port (EUR 253 million for both Haifa and Ashdod, and EUR 24 million for Piraeus). This is expected, as SOx and PM emissions comprise the major portion of the externalities, and those in Piraeus are minimal. Interestingly, the relatively low marine emissions externalities in the Piraeus port, stress that the significant benefit from Israeli marine emissions reduction is achievable [81].

3.4. Israeli Marine Emission Mitigation Feasibility

Besides mitigation techniques’ feasibility, it is also important to examine the feasibility of the whole proposed 2030 Israeli marine emissions mitigation plan (MPS 2030). Realizing this mitigation plan will be challenging. It not only influences local actors, but carries implications for foreign countries and companies and minor marine actors, such as Israel, do not have much leverage in this matter. Moreover, the mitigation plan involves considerable expenses that would have to be paid within 5–10 years, with the benefits materializing later. These costs will be paid by the shipping companies and/or by governmental subsidies, and eventually will be passed to the consumers and/or to the residents. Either way, the government should plan it carefully, so the burden on the costumers/residents will be bearable. This is especially true in 2022, as the COVID-19 crisis is still not over, as the world is facing global supply chain challenges, and as global inflation rates rise and affect the global economy [106,107].
Nevertheless, the MPS 2030 is feasible. First, the MARPOL Annex VI is in force, and should contribute greatly to SOx and PM2.5 emission reduction. Israel needs to complete writing it into law and to begin enforcement. Second, as mentioned above, most of Israel’s (and the world’s) marine transport sail between North America, Europe and/or China, are already (or will be in a few years) under SOx, PM2.5 and NOx marine emissions regulation (see Section 1.1). So, most of the marine vessels visiting Israel already have, or will have in the next few years, appropriate emissions mitigation techniques on board, to comply with North American, European, or Chinese regulations. Therefore, small global actors, such as Israel, can reap the benefits of these global emission mitigation programs. Third, there is a variety of mitigation techniques that can fit different types of ships. Fourth, the economic, health and environmental benefits of this mitigation plan are probably higher than the costs of this plan [15,16].
It seems that all the knowledge, technological, and international affairs barriers for implementing a marine emissions mitigation plan have been overcome. It is now up to the government to promote such a plan that will greatly improve air quality in these cities.

4. Conclusions

A number of conclusions can be drawn from this study:
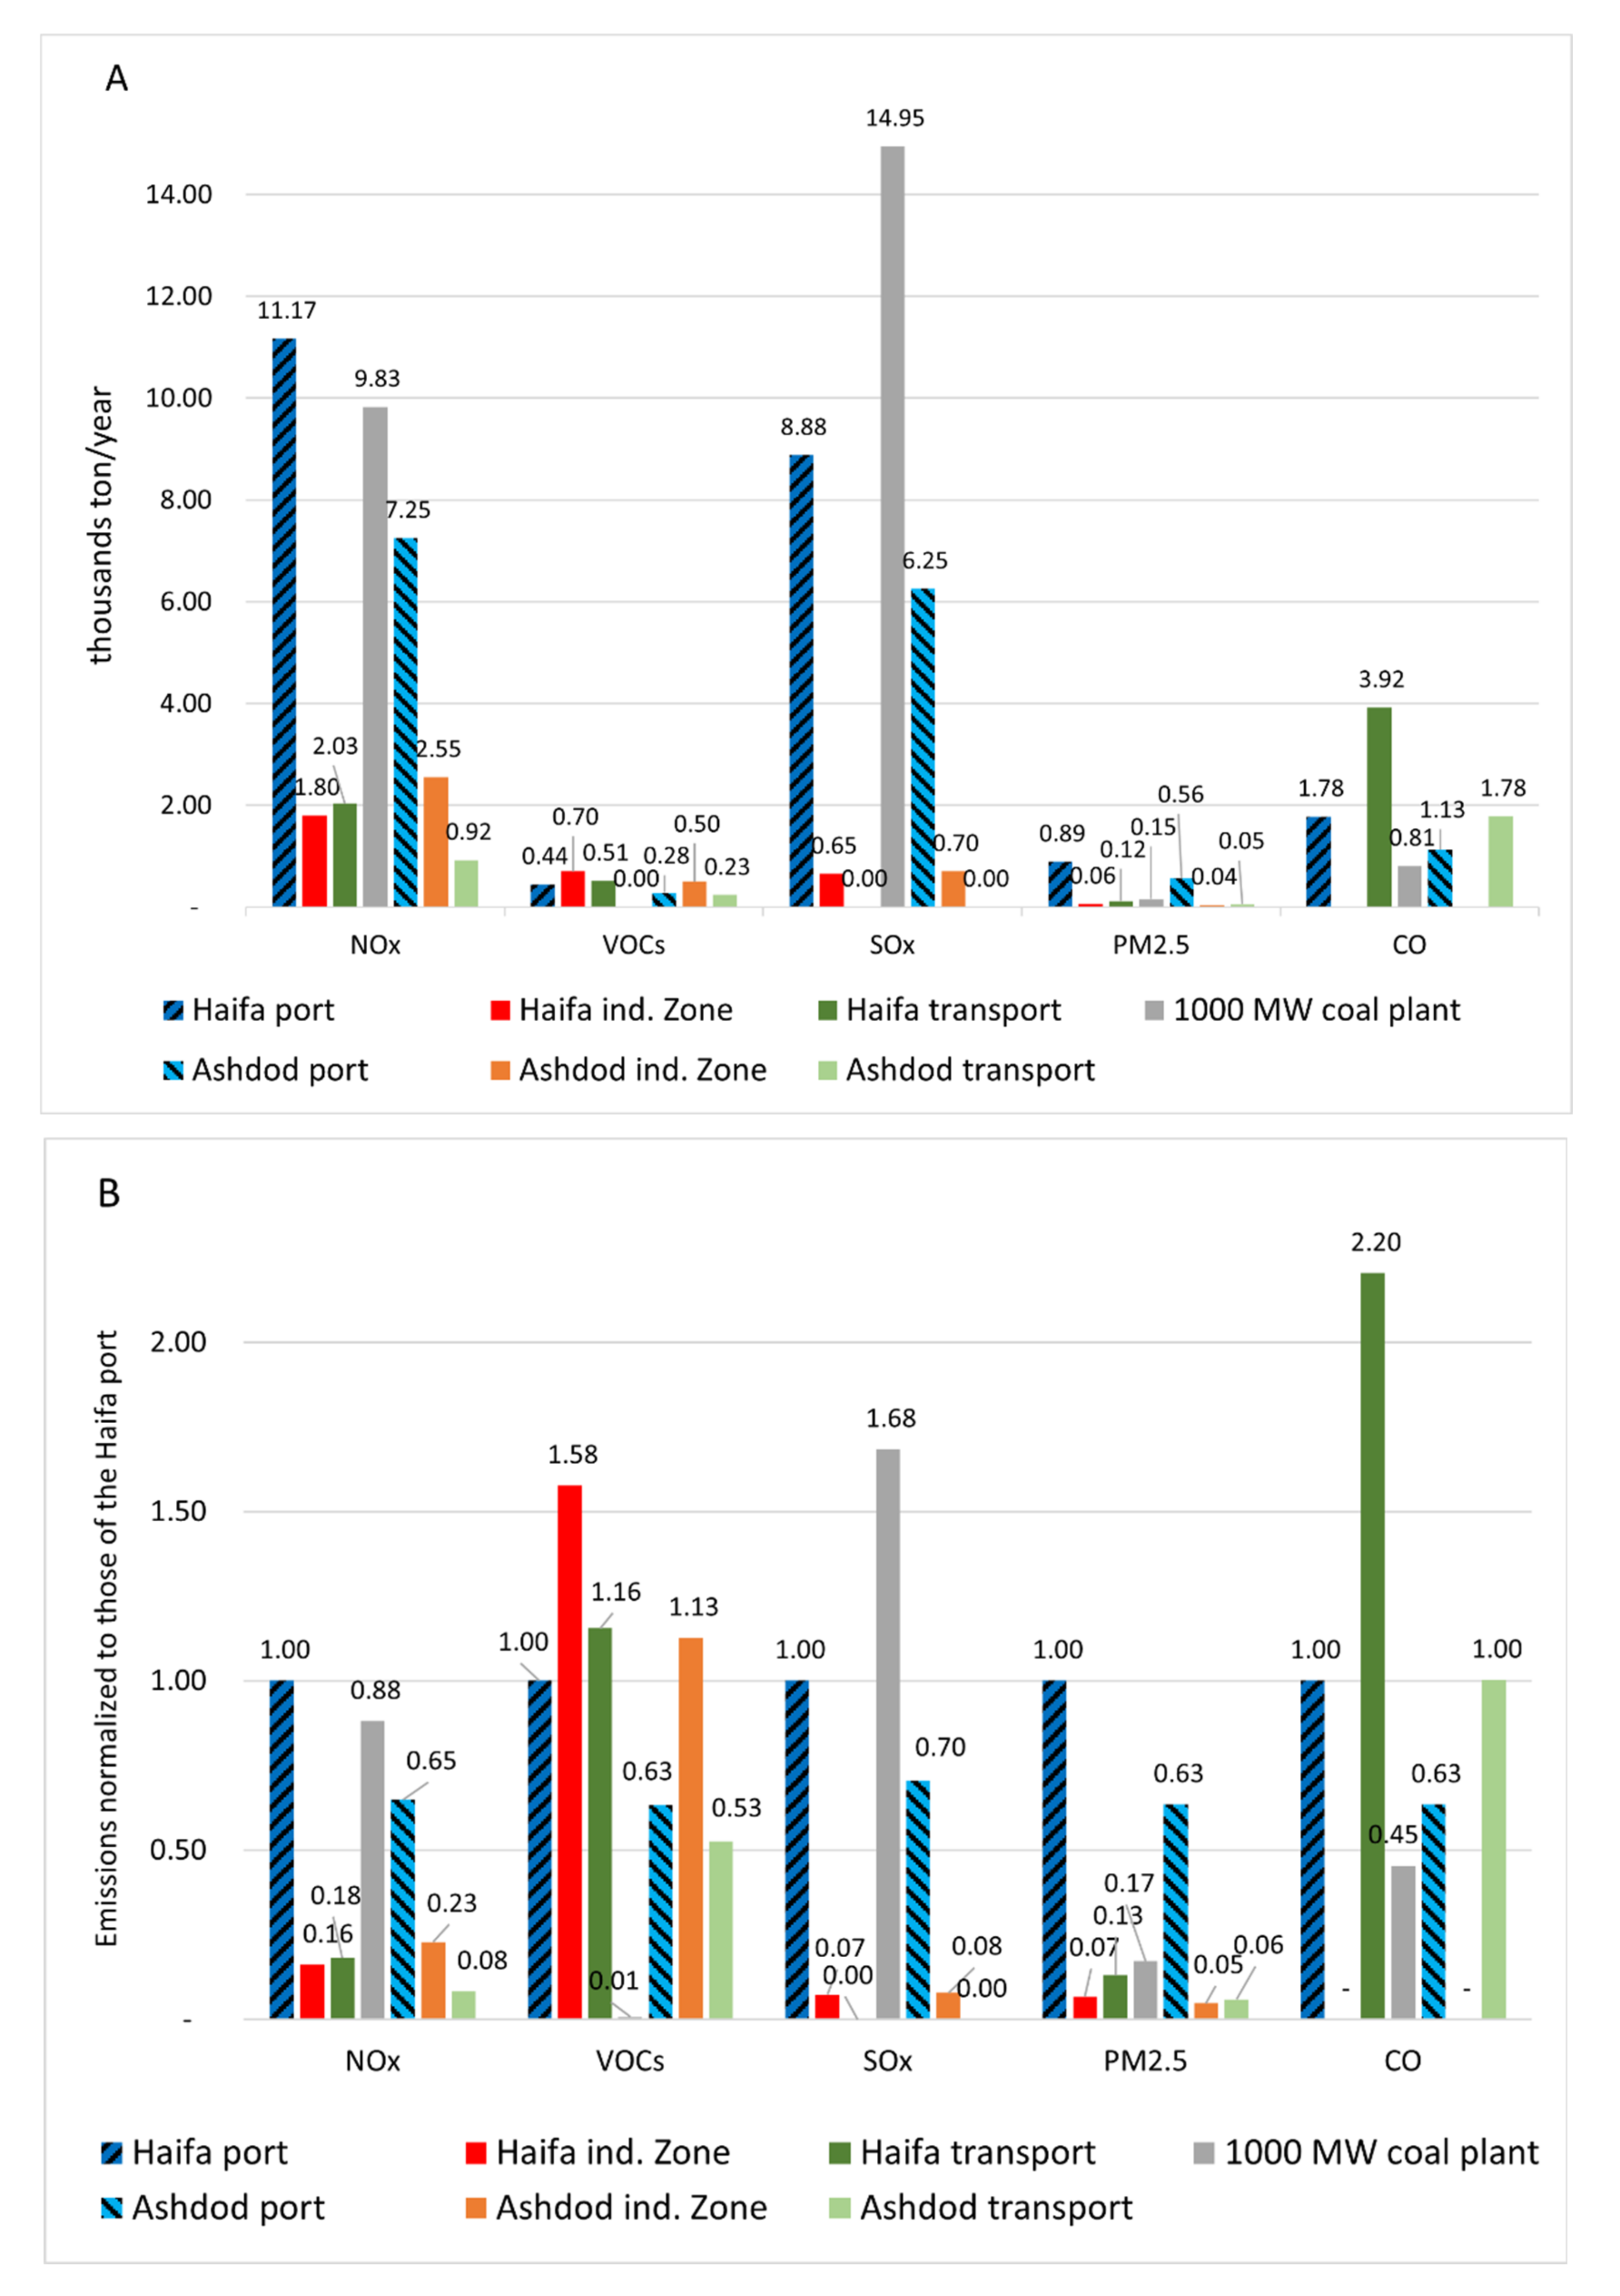
  • Compared to the industrial and land transportation sectors in these cities, the marine sectors in Haifa and Ashdod emit 3–12 times more NOx, 10 times more SOx than the industrial zones (the land transportation sectors do not emit any SOx) and 4–20 times more PM2.5.
  • Relatively high average concentrations of nickel (a signature air pollutant for marine air emissions) as a fraction of TSP were found in Israel only around the Haifa and Ashdod ports, which indicates that the marine air pollution reaches the shore and therefore poses a risk to the surrounding populations.
  • Air quality monitoring stations in, near and around the Haifa and Ashdod ports should be installed to properly understand the impact of marine air pollution in these cities.
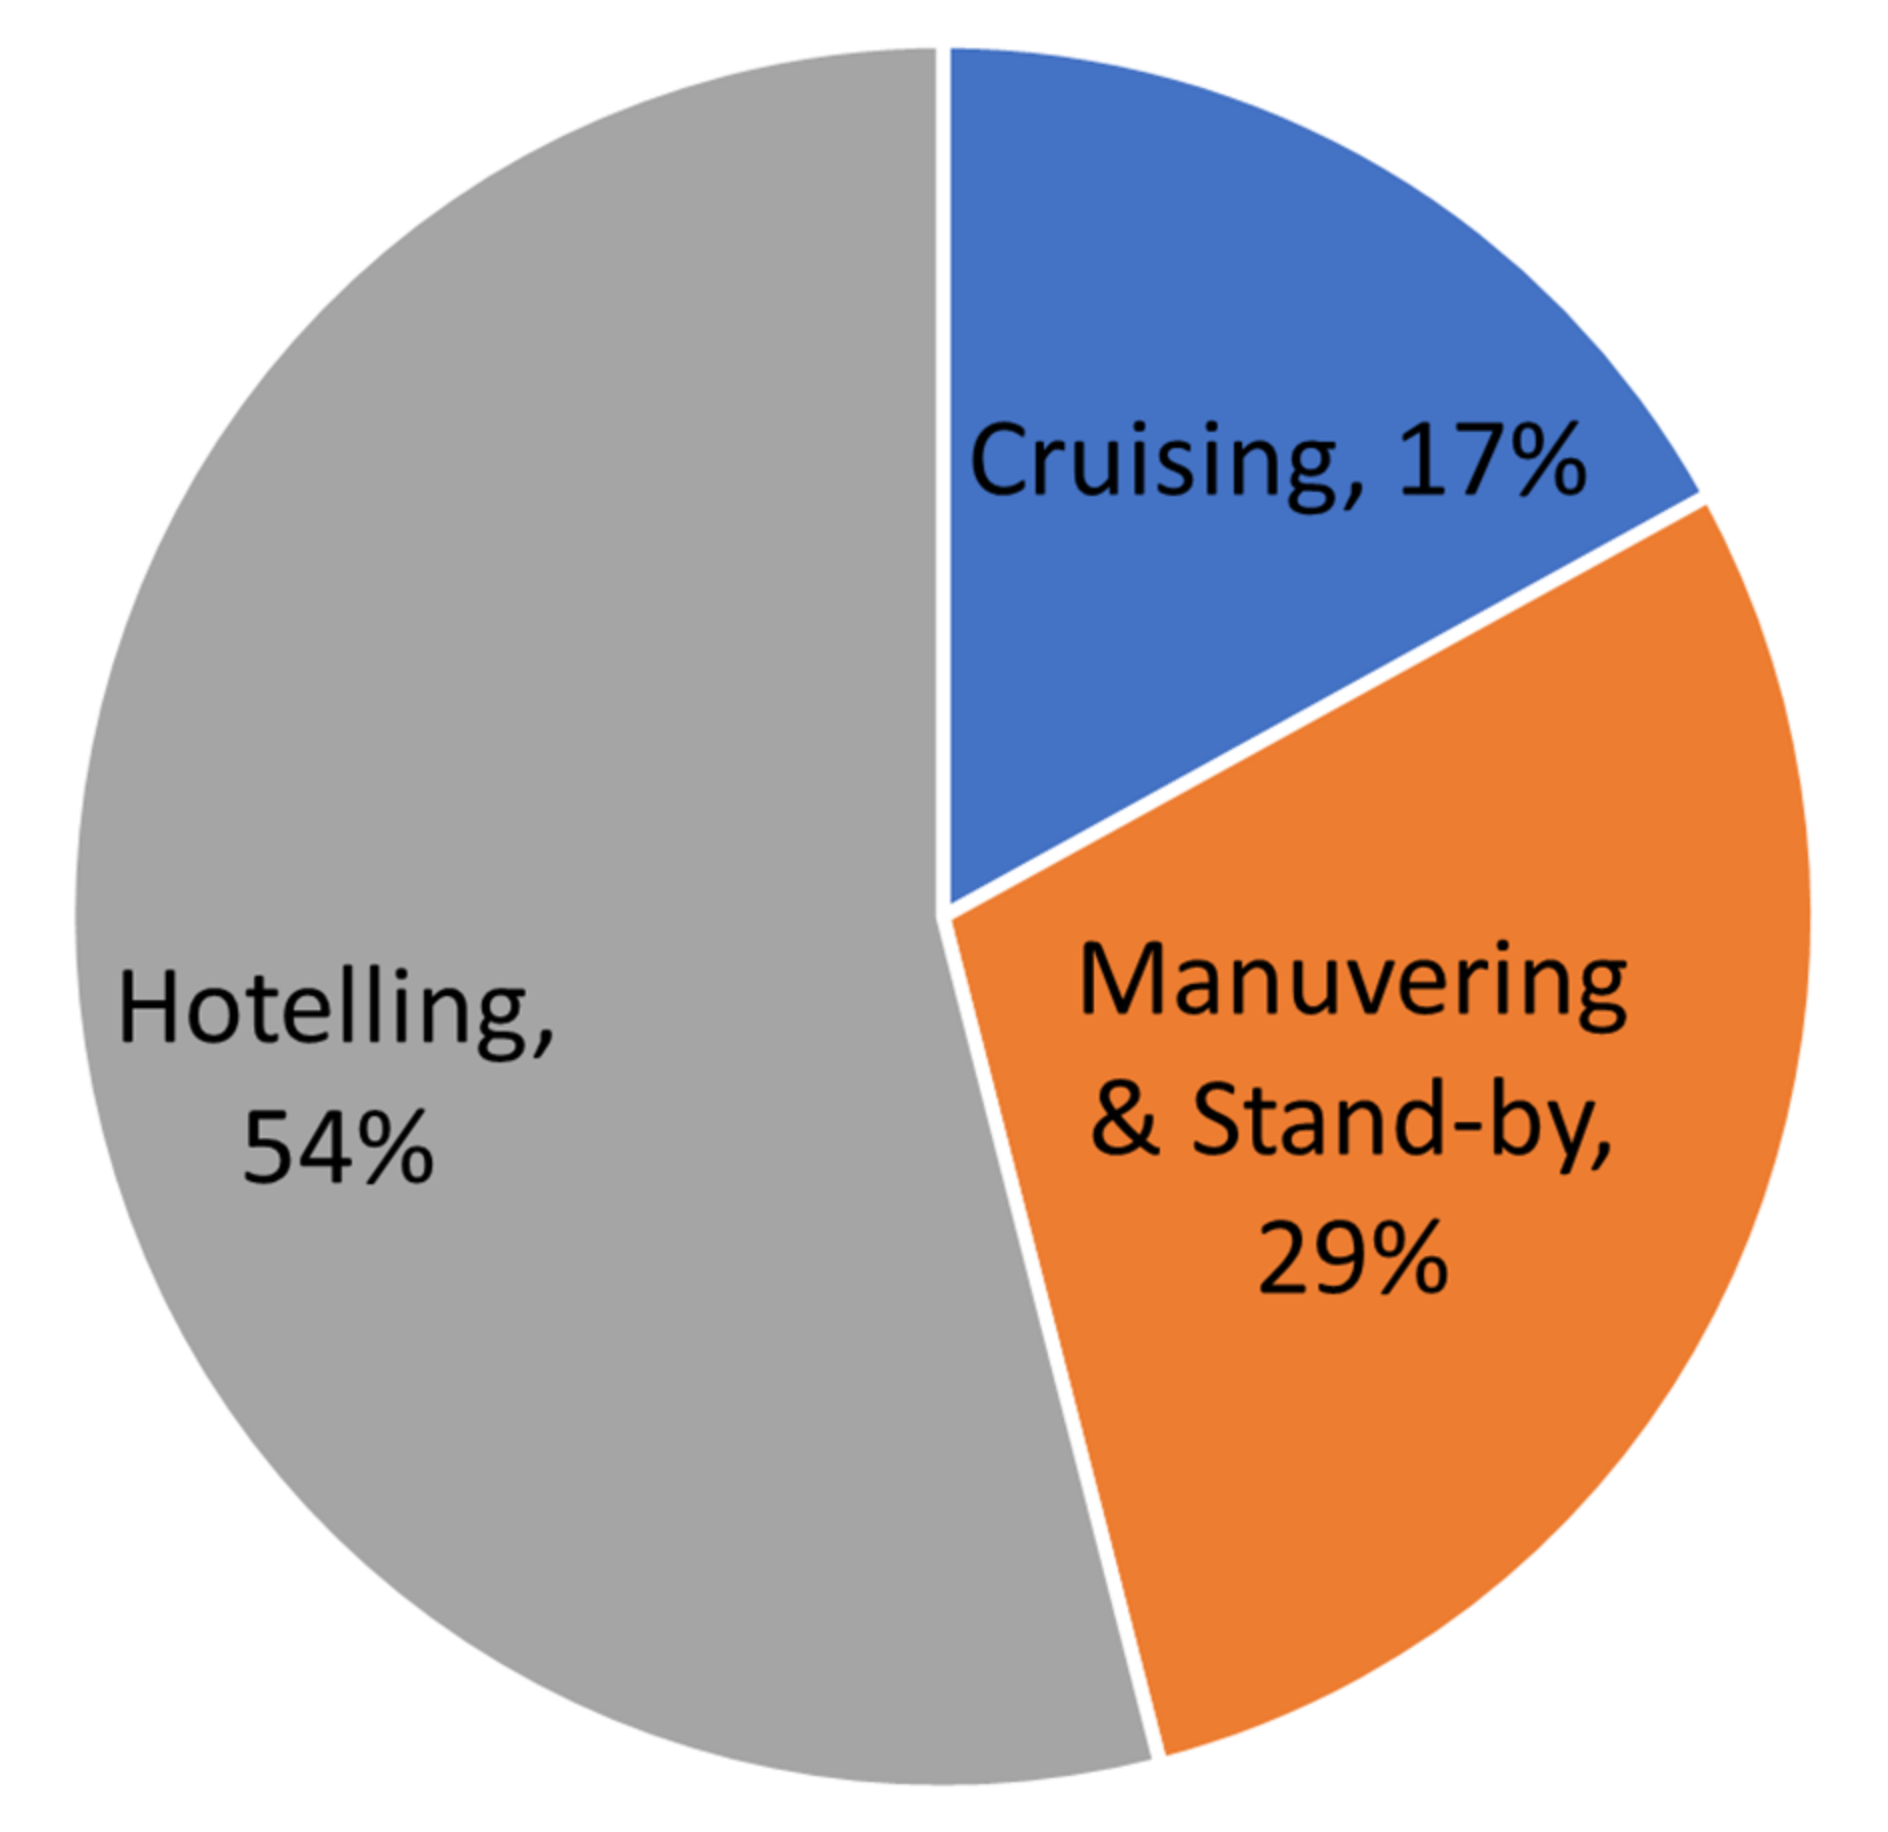
  • Of the total marine NOx emissions, 54% are emitted during the ships’ hoteling, while 29% and 17% are attributed to the maneuvering and stand-by and cruising navigation phases, respectively. The share of the maneuvering and stand-by phase is unusually high, due to the long average stand-by duration in these ports.
  • Due to the slow replacement of international fleets, reduction in marine NOx emissions is improbable in the next decade.
  • The most feasible marine emission mitigation techniques for Israel are distancing stand-by location (all emissions), SCR (selective catalytic reduction: NOx), EGR (exhaust gas recirculation: NOx), EGCS (exhaust gas cleaning systems: SOx and PM2.5), ULSD (low or ultra-lowc sulfur diesel: SOx and PM2.5) and ESP (electric shore power- all emissions).
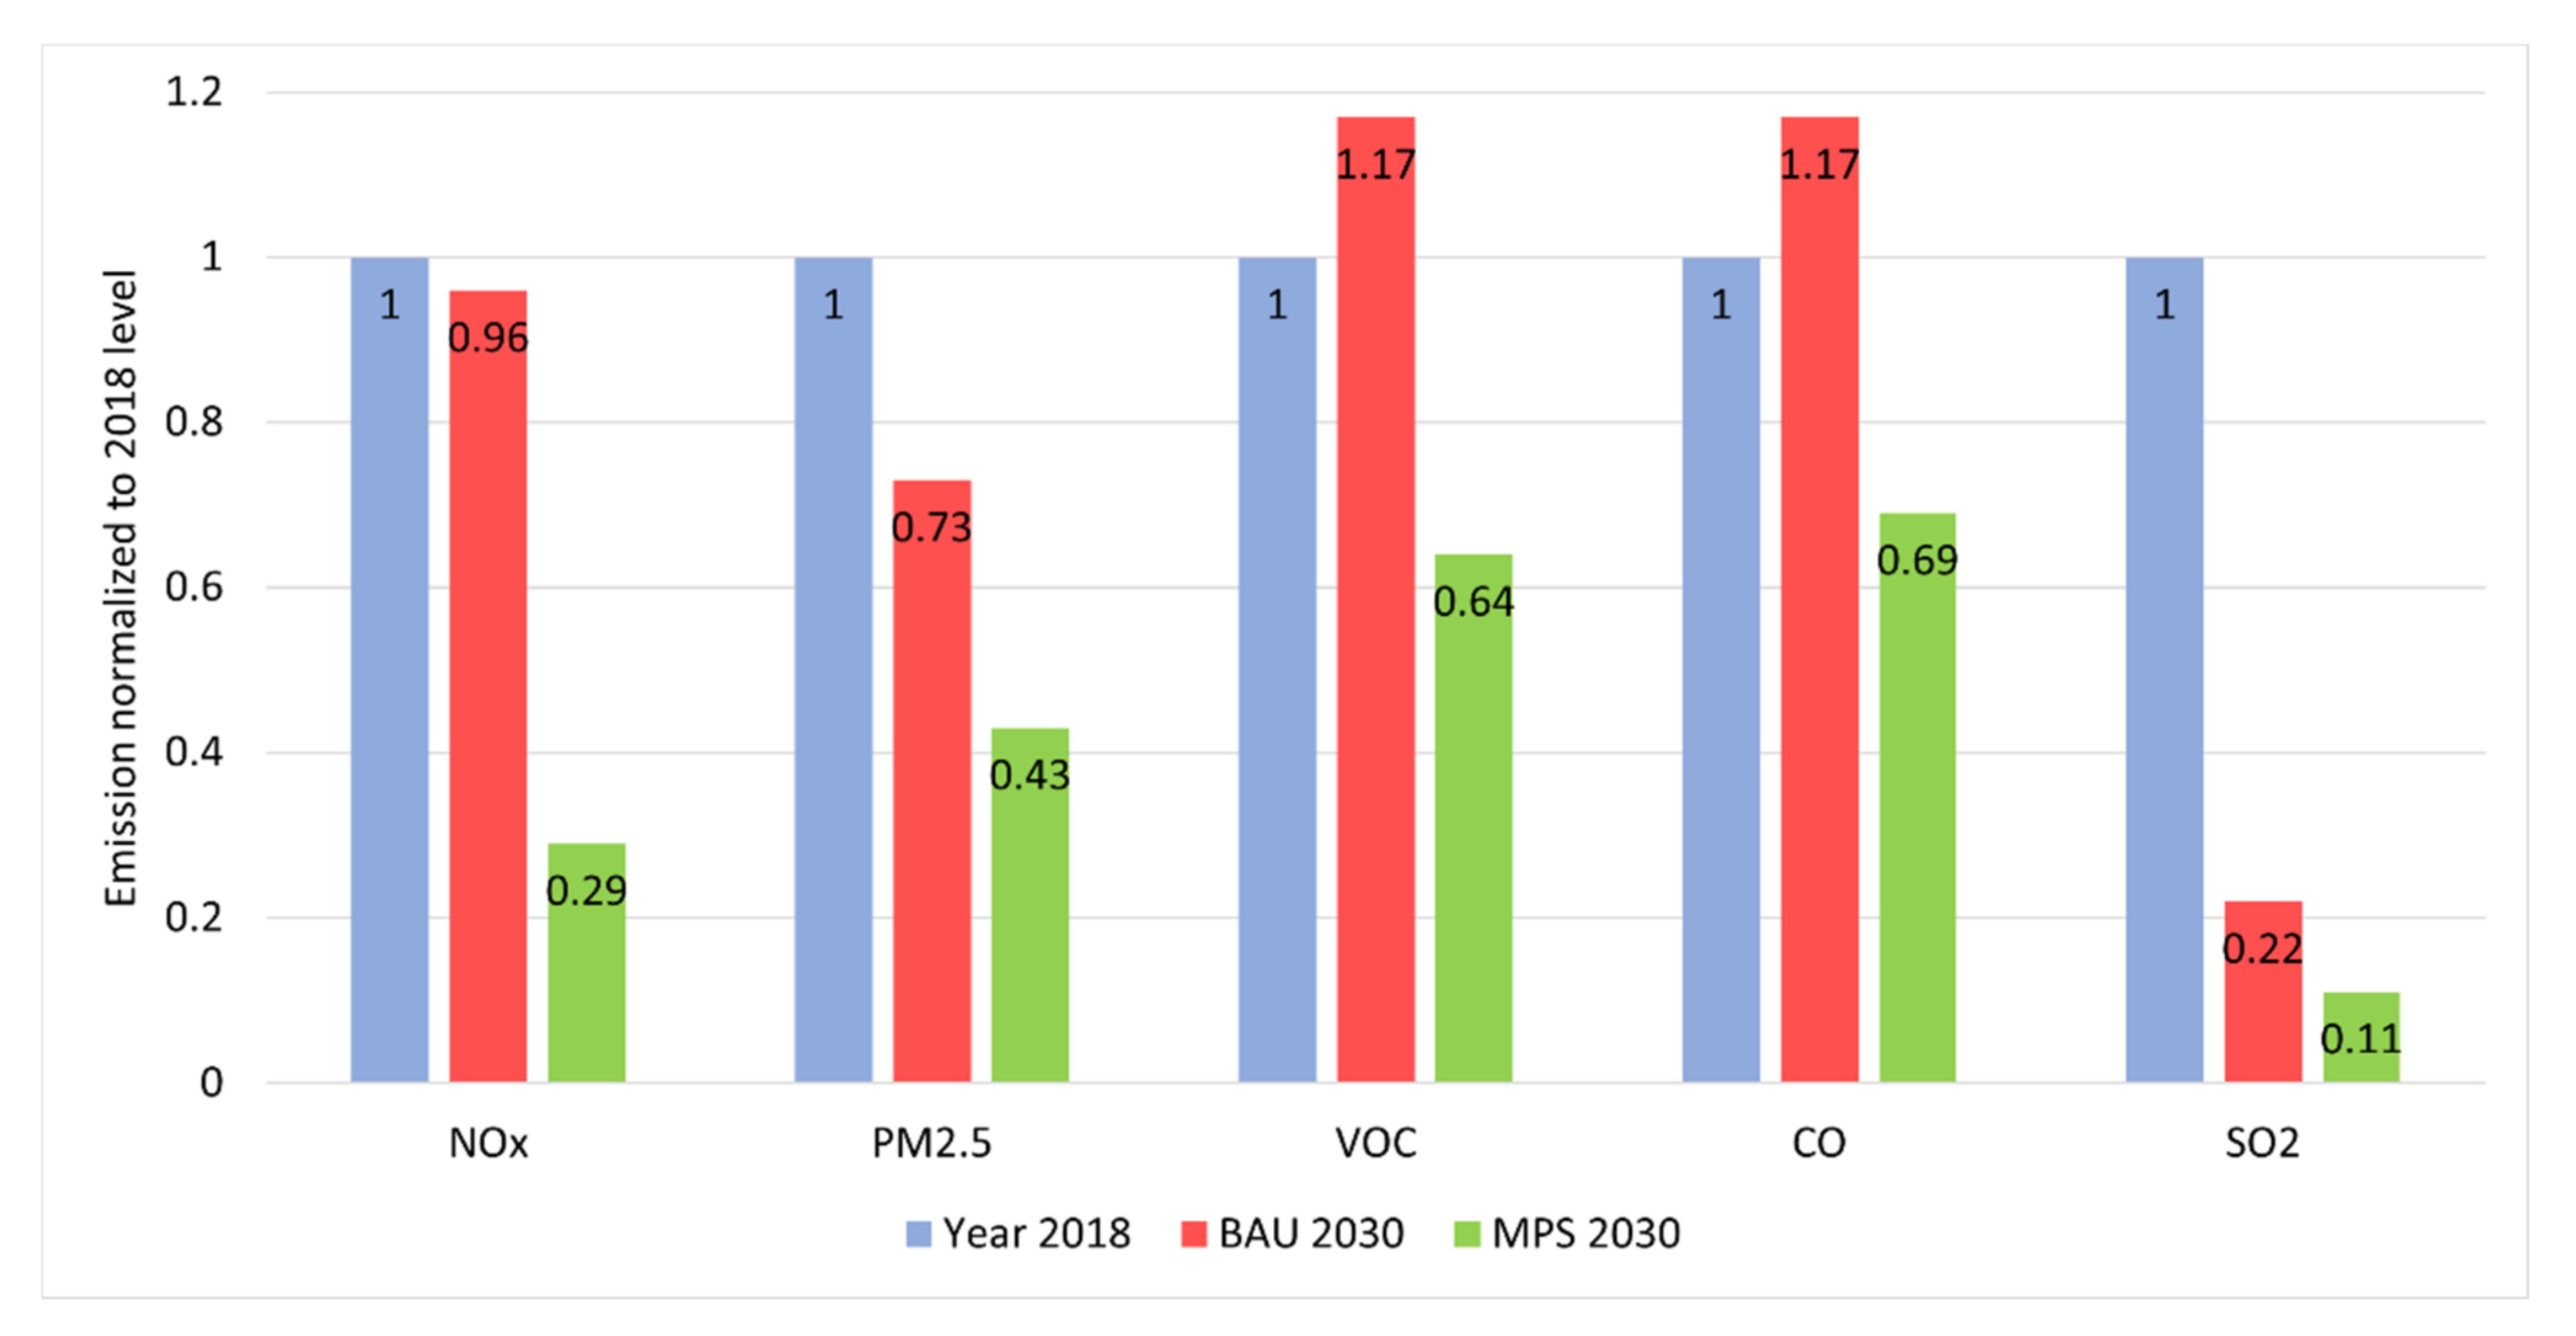
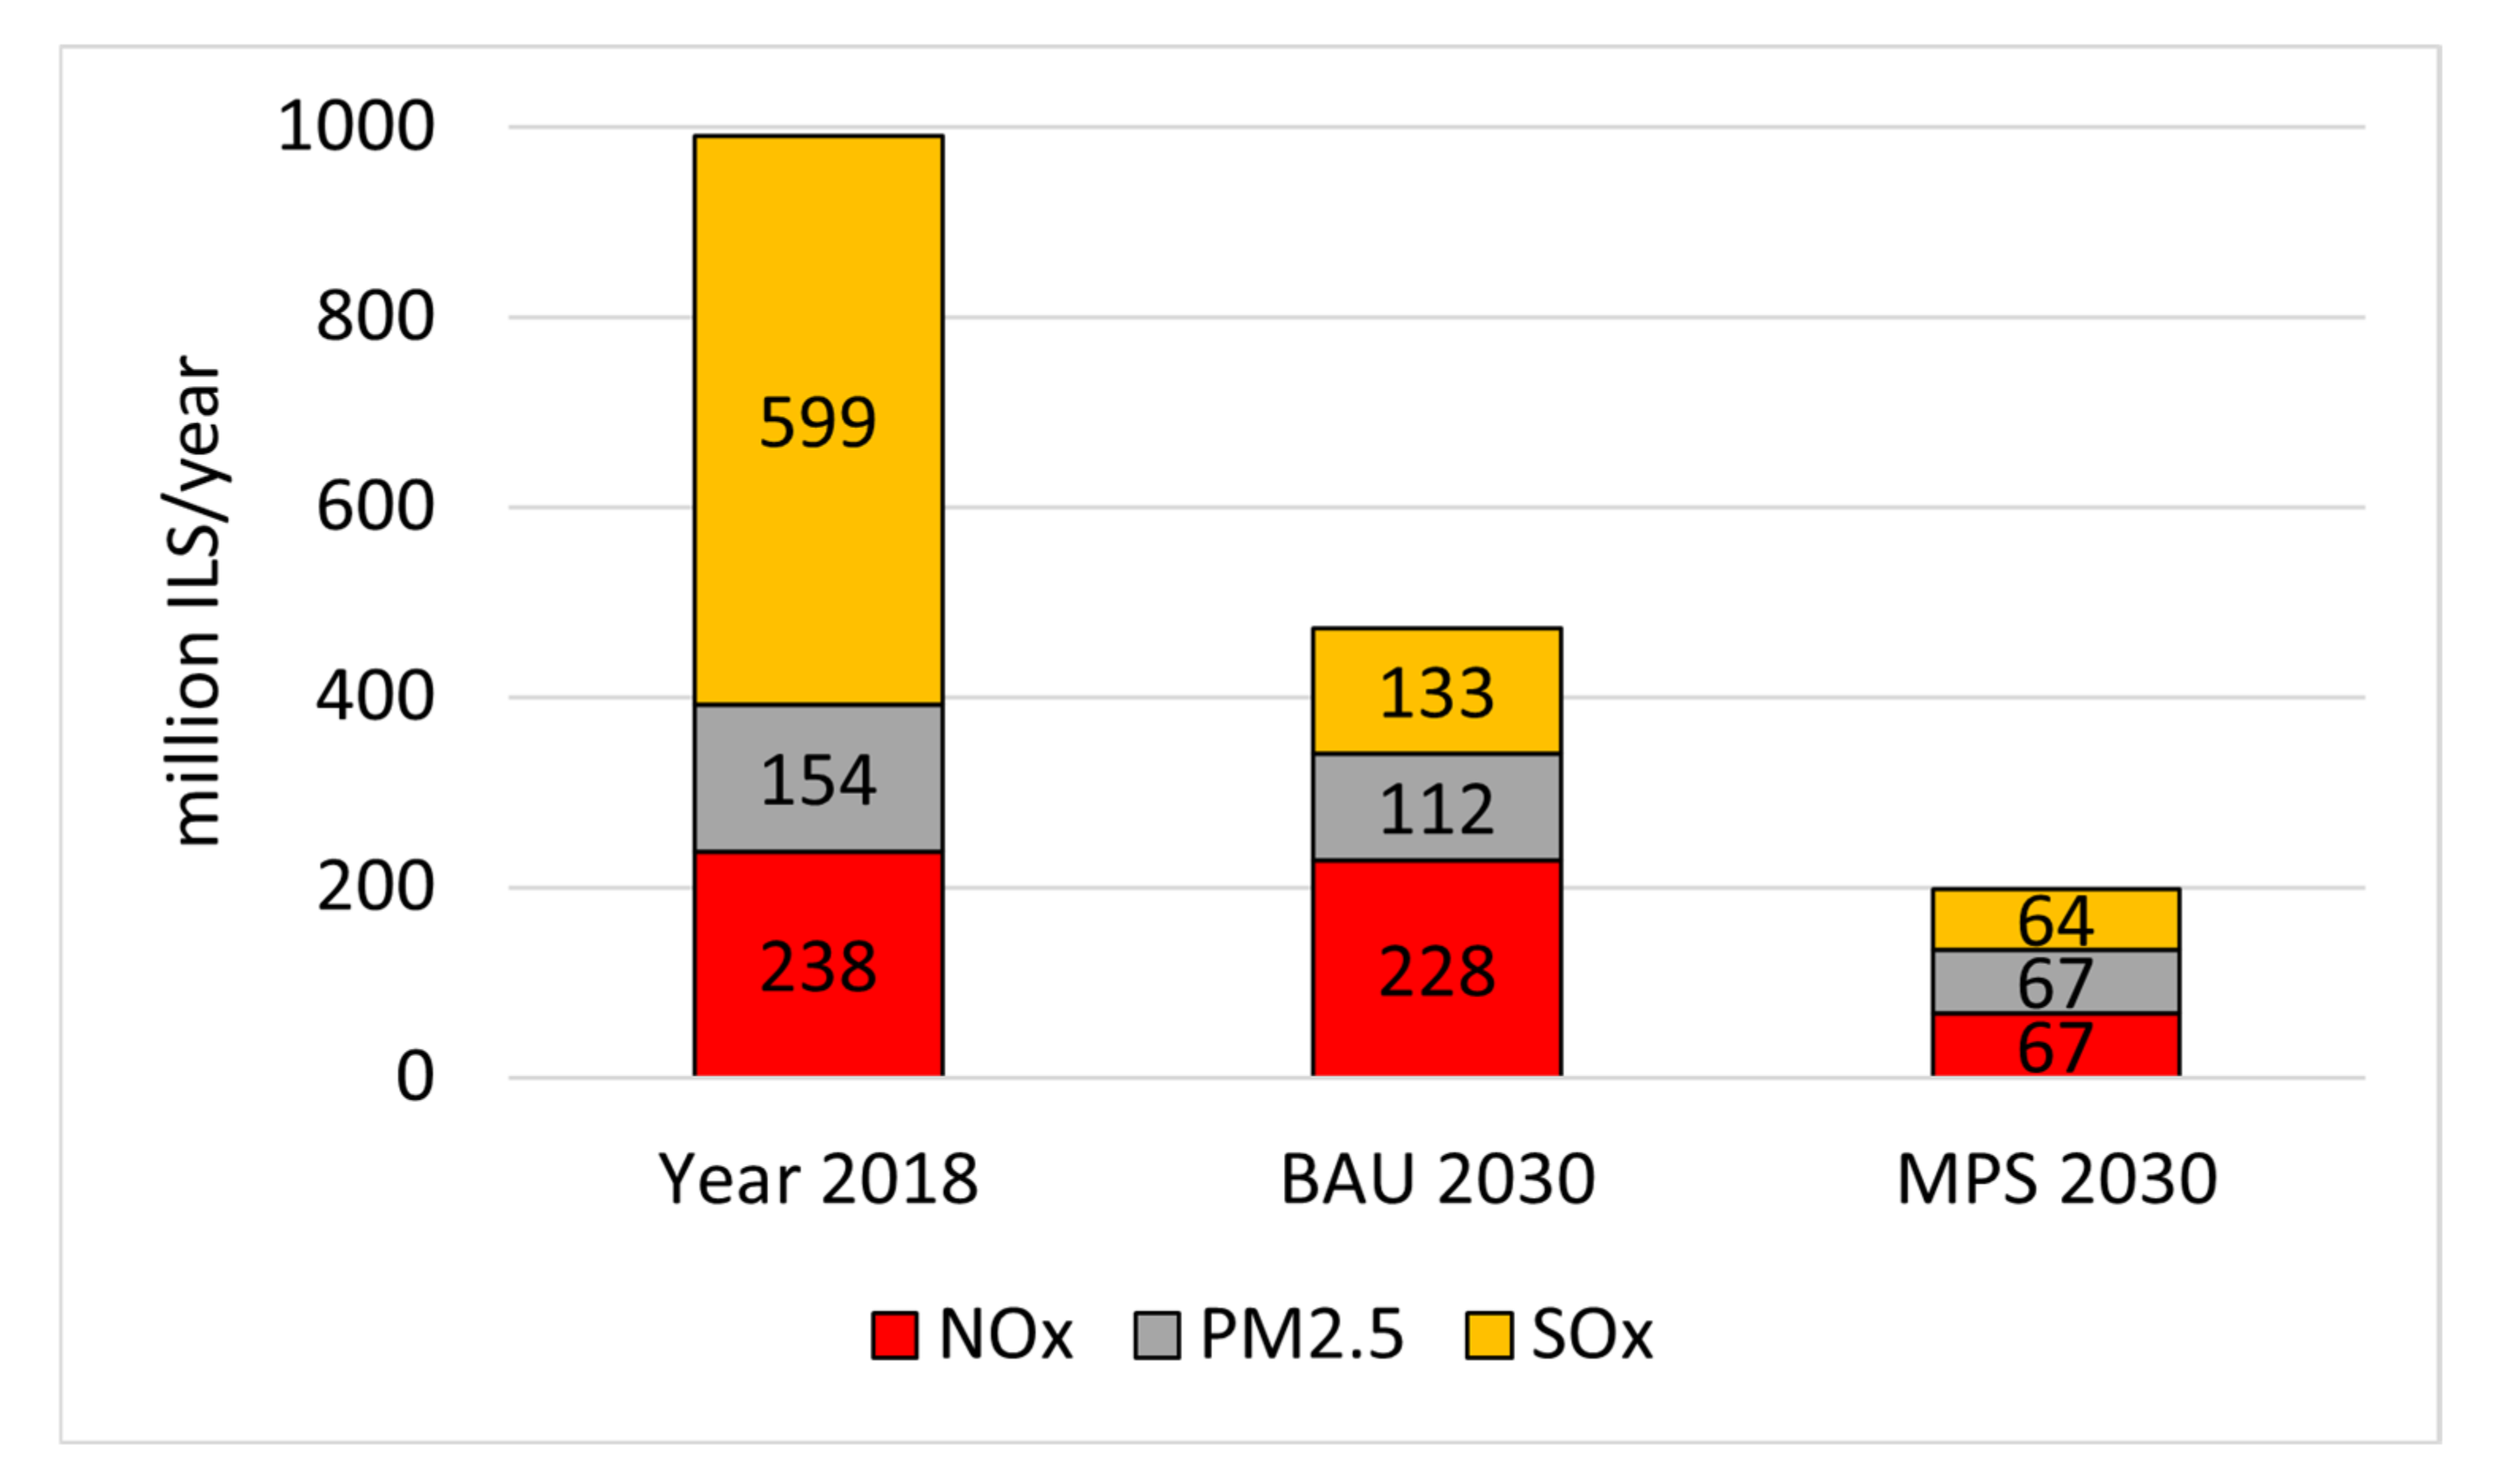
  • In the BAU 2030 (business as usual) scenario, NOx emissions will hardly change, PM2.5 will drop by 27%, VOCs and CO will rise by 17% and SOx will drop by 78% (if the MARPOL VI will be fully implemented). However, in the MPS 2030 (Mitigation Plan Scenario), NOx will drop by 71%, PM2.5 will drop by 57%, VOCs will drop by 36%, CO will drop by 31% and SOx will drop by 89%.
  • The most important and beneficial policy step to mitigate the marine emissions is first to have a strong and effective local enforcement of MARPOL VI regulation for reducing SOx and PM emissions.
  • Since it was found that current NOx emissions are the highest of all emissions examined and are unlikely to significantly decrease in the next decade, decision makers in Israel should consider establishing a local mitigation plan focused on NOx. This plan can achieve significant reduction for other air pollutants, including NMVOCs and CO as well as further reduction of SOx, PM2.5 and other pollutants
  • A preliminary calculation shows that the marine sectors in Haifa and Ashdod externalities are at least ILS 991 million (EUR 253 million) per year. The BAU 2030 scenario can lower them by ILS 518 million (EUR 132 million) and the MPS 2030 scenario can lower them by ILS 793 million (EUR 202 million) per year.
  • Israeli marine emissions mitigation is feasible from technological and regulatory aspects.
  • As of today, and increasingly more going forward, most of the large marine vessels are subjected to stricter NOx and SOx regulation at least in one of the ports in their route (North America, Europe, China); it is suggested that regulation will make it more feasible for countries to restrict their emissions, including small countries, such as Israel.
Economic motives push marine companies to send their polluting vessels to ports with low emissions standards. Furthermore, since some marine emission reduction technologies can be turned off at will, they are turned off when there is no emission reduction regulation in place, to save expenses. Therefore, even marine vessels with SOx and/or NOx emissions reduction capabilities can pollute when proper emissions standards are missing. Accordingly, it is important to include in the local mitigation plan both relevant local regulations as well as strict and efficient enforcement mechanisms.
  • It is highlighted that although implementation of a local emission mitigation plan, as suggested in this paper, is a feasible step with probably more benefits than costs, it is also associated with significant economic and regulatory challenges. As most of all imports to Israel takes place by marine shipping [108], policy makers in Israel should consider the potential economic risks of imposing new costly environmental standards. The latter should be especially considered in light of the recent trend in price increase of various goods in Israel and elsewhere [106,107], which is to some extent attributed to the increase in marine shipping costs. However, since most of the global marine traffic is already (or will be in a few years) under SOx and NOx emissions restriction (North America, Europe, China), many ships have invested or are investing in complying with emissions restrictions.
  • It is recommended to examine the expected costs and other strategic implications of an ambitious marine emissions reduction plan, including legal and financial ways for promoting it. It is also recommended to examine other potential public benefits of such plan, for example, opportunities for real estate development and increase of the land value around areas currently affected by marine air pollution in Haifa and Ashdod. The overall benefits of such a plan will probably outweigh its costs.

Author Contributions

Conceptualization, methodology, visualization, writing, review and editing, E.R.-Y. and D.M.; data collection, analysis, and investigation, E.R.-Y., Y.B., O.N. and D.M. All authors have read and agreed to the published version of the manuscript.

Funding

This research was funded by the Israeli Ministry of Environmental Protection, grant number 162-4-3.

Institutional Review Board Statement

Not applicable.

Informed Consent Statement

Not applicable.

Data Availability Statement

The data presented in this study are available in the article, in the Appendixes, and in the provided references.

Acknowledgments

We thank our reviewers and editor for their comments and Ilan Levi from the Israeli Ministry of Environmental Protection.

Conflicts of Interest

The authors declare no conflict of interest.

Appendix A. Marine Emission Sources in 2018

Air pollution sources from Haifa and Ashdod seaports include both marine and land activities. Main sources are the vessels engines, where emissions occur during cruising time (in the territorial waters), maneuvering time (in the port water area) and hoteling time (in the port terminal area). Other significant sources are the land transportation activity in the port, including operating vehicles (trucks, diesel forklifts, diesel cranes and bulldozers) and transportation vehicles (trucks and train locomotives).
Fuel type is one of the most influential factors on the emission volumes for all combustion-based sources. The common fuel types for vessels are BFO (bunker fuel oil), MDO (marine diesel oil) and MGO (marine gas oil). Fuel types for land vehicle are diesel and gasoline. Table A1 shows the marine emission sources and major mobile sources in HAIFA port.
Table A1. Marine emission sources and major mobile sources in HAIFA port.
SourceEnginePhaseEngine TypeFuel Type
Vessels:
Cruise,
Passenger shuttle,
Panamax,
Oil tanker,
Bunker,
General cargo ship,
Tugboat,
I.N.S,
ect.
maincruisegas turbineBFO
MDO/MGO
high-speed dieselBFO
MDO/MGO
medium-speed dieselBFO
MDO/MGO
slow-speed dieselBFO
MDO/MGO
steam turbineBFO
MDO/MGO
manoeuvring/hotelinggas turbineBFO
MDO/MGO
high-speed dieselBFO
MDO/MGO
medium-speed dieselBFO
MDO/MGO
slow-speed dieselBFO
MDO/MGO
steam turbineBFO
MDO/MGO
auxiliarycruise/manoeuvring/hotelinghigh-speed dieselBFO
MDO/MGO
medium-speed dieselBFO
MDO/MGO
Trucksmaintravel4-stroke gasolinegasoline
dieseldiesel
waiting4-stroke gasolinegasoline
dieseldiesel
Locomotivesmaintraveldieseldiesel
waiting
Cranes maintraveldieseldiesel
loading
Forkliftsmaintravel4-stroke gasolinegasoline
dieseldiesel
loading4-stroke gasolinegasoline
dieseldiesel
Bulldozersmaintraveldieseldiesel
loading

Appendix B. Emission Factors

Air emissions produced by vessels are a result of combustion processes occurring in the internal engines. The main pollutants emitted are NOx, CO, VOC and PM2.5. the emission rates are strongly dependent on the engine technology and fueled used.
The total emissions from a vessel can be divided into three phases: (1) cruising- sailing within 1–10 km from the port, upon arriving to the stand-by position, and after leaving the port; (2) stand-by–waiting in line within 0.5–5 km from the port before entering the port; maneuvering–sailing between stand-by and hoteling and vice versa; and (3) hoteling–docking at the port The emission volumes are controlled by the above operation regime/navigation phase, fuel type, engine type and engine duty.
For a single navigation, the emissions can be expressed as:
E v e s s e l = E c r u i s i n g + E m a n o e u v r i n g + E h o t e l i n g
Fuel types are usually either BFO (bunker fuel oil), MDO (marine diesel oil) and MGO (Marine Gas Oil). In the case where fuel consumption for each operational regime is known, the emissions of pollutant i can be calculate by the following equation:
E v e s s e l , i , e , f = p F C e , f , p × E F i , e , f , p
where: Evessel = overall emission from a vessel (ton). FC = Fuel consumption (ton). EFi = emission factor for pollutant i (kg/ton). See Table A2 and Table A3 below. i = pollutant (NOx/CO/VOC/PM2.5/SOx). f = fuel type (BFO/MDO/MGO). e = engine type (slow-/medium-/high-speed diesel or gas turbine). p = phase operational regime (cruise, maneuvering, hoteling).
The advanced calculation method is applied where fuel consumption per operational regime phase is not known. In this case, the emissions can be calculated based on the engine duty (installed power and operation time) in the different phases.
Emissions can be calculated for auxiliary engines, using load factor and total time in hours for each phase by the following equation:
E v e s s e l , i , e , f = p T × P × e c P e c × L F e c × E F i ,   e c , e , f , p
where:
  • Evessel = overall emission from a vessel (g)
  • EFi = emission factor for pollutant i (g/kWh). See Figure A1, Table A2 and Table A3.
  • LF = engine load factor (%)
  • P = engine nominal power (kW)
  • T = time (hour)
  • ec = engine category (main/auxiliary)
  • i = pollutant (NOx/CO/VOC/PM2.5/SOx)
  • f = fuel type (BFO/MDO/MGO)
  • e = engine type (slow-/medium-/high- speed diesel or gas turbine)
  • p = phase of the navigation (cruise, maneuvering, hoteling)
Figure A1. Allowed NOx emissions per Tier I, II and III standards. Y axis is NOx emissions (g/kWh), and the X axis is engine speed (rpm). Adopted from [109].
Atmosphere 13 00241 g0a1
Emission factors for pollutants NOx, VOC, PM2.5, CO and SOx, per individual engine and fuel type combinations are displayed in Table A2 and Table A3 in units of g pollutant per kWh. The emission factors are categorized according to the vessel’s manufacturer year. The emission factors were established by the ENTEC report based on a comprehensive emissions inventory for Mediterranean vessels [70]. For vessels manufactured after 2010, the emission factors are based on the EPA emissions standards for NOx and PM2.5 [71,72]. For SOx, emissions are derived from the sulfur content in fuel oil used by vessel engines in accordance with the current regulation in force (Table A4 shows the current regulation/standard in force).
Table A2. Emission factors for NOx (N = engine rpm) [70,72].
EnginePhaseEngine TypeFuel TypeNOx EF (g/kWh)
Entec 2000Entec 2005Entec 2010EPA Standard TIER I EPA Standard TIER IIEPA Standard TIER IIIEPA Standard TIER IV
Maincruisegas turbineBFO6.15.95.7 45 × N 0.20 44 × N 0.23 9 × N 0.20 1.8
MDO/MGO5.75.55.3
high-speed dieselBFO12.712.311.8
MDO/MGO1211.611.2
medium-speed dieselBFO1413.513
MDO/MGO13.212.812.3
slow-speed dieselBFO18.117.516.9
MDO/MGO1716.415.8
steam turbineBFO2.122
MDO/MGO21.91.9
manoeuvring/hotelinggas turbineBFO3.132.9
MDO/MGO2.92.82.7
high-speed dieselBFO10.29.99.5
MDO/MGO9.69.38.9
medium-speed dieselBFO11.210.810.4
MDO/MGO10.610.29.9
slow-speed dieselBFO14.51413.5
MDO/MGO13.613.112.7
steam turbineBFO1.71.61.6
MDO/MGO1.61.61.5
Auxiliarycruise/manoeuvring/hotelinghigh-speed dieselBFO11.611.210.8
MDO/MGO10.910.510.2
medium-speed dieselBFO14.714.213.7
MDO/MGO13.913.513
Table A3. Emission factors for VOC, PM2.5, CO and SOx. (P = engine power (kWh), S = percentage sulfur content in fuel (%)) [70,72].
EnginePhaseEngine TypeFuel TypeVOC EF (g/kWh)PM2.5 EF (g/kWh)CO EF (g/kWh)SOx EF (g/kWh)
Entec
2000–2010
EU Emission DirectiveEntec 2000–2010EPA StandardLloyd’s RegisterEPA StandardLloyd’s Register
Maincruisegas turbineBFO0.1 1.5 + 2 P 0.5 0.10.1–0.81.65 4.36 × S
MDO/MGO0.10
high-speed dieselBFO0.20.8
MDO/MGO0.20.3
medium-speed dieselBFO0.50.8
MDO/MGO0.50.3
slow-speed dieselBFO0.61.7
MDO/MGO0.60.3
steam turbineBFO0.10.8
MDO/MGO0.10.3
manoeuvring/
hoteling
gas turbineBFO0.51.5
MDO/MGO0.50.5
high-speed dieselBFO0.62.4
MDO/MGO0.60.9
medium-speed dieselBFO1.52.4
MDO/MGO1.50.9
slow-speed dieselBFO1.82.4
MDO/MGO1.80.9
steam turbineBFO0.32.4
MDO/MGO0.30.9
Auxiliarycruise/manoeuvring/hotelinghigh-speed dieselBFO0.40.8
MDO/MGO0.40.3
medium-speed dieselBFO0.40.8
MDO/MGO0.40.3
Table A4. Sulfur content in fuel.
RegulationIn Force from Year:Sulfur Content in
Fuel Oil (%)
Marpol Annex VISECA20101
20150.1
Global20123.5
20200.5
EU Directive 2005/33 [94]SECA20071.5
GlobalNoneNone
Based on Table A4 above, the sulfur content in vessels fuel oil determined as 3.5% for the present time (2018) and 0.5% for future time (2025).
Table A5 shows the estimated uncertainties related to the emission factors (ENTEC 2007) [70]. Additional operation parameters, which were used as the basis for emission calculations, are presented in Table A6.
Table A5. Uncertainties of emission factors.
ParameterUncertainties of Emission Factors
CruisingManoeuvringHotelling
NOx±20%±40%±30%
SOx±10%±30%±20%
VOC±25%±50%±40%
PM2.5±25%±50%±40%
Fuel Consumption±10%±30%±20%
Table A6. Calculation basis parameters for 2018.
ParameterValueUnits
Vessel velocity10Knot
18.5km/hr
Cruising distance19.2km
Cruising time1hr
Manoeuvring time1hr
Stand-by time3hr
Hoteling time84hr
Specific fuel Consumption218g/kWh
The relevant emission factors for each engine and vessel type were selected according to the specific engine power and revolutions per minute and multiplied by the operating engines number for each activity phase. The data were adjusted for average parameters of the Mediterranean fleet, based on Lloyd’s database [110].
Emission factors and emission standard tiers were adjusted to the vessels age, regarding three different years (2018, 2025 and 2030).

Appendix C. Ships Tracking of Typical Movements and Location around the Ports during 2018

Tracking ships movements and location at each port was carried out based on sampling individual days during the year 2018 as well as by extracting weekly and monthly averaged aggregated statistics (available of being downloaded) from Marine Traffic Global Ship Tracking Intelligence [67], which has daily tracking information available (based on ships connected to GIS) and a live map that allows to view the current placement of each ship and its speed and distance from each port. This task was mainly carried-out to examine the overall ship movements at each port, and particularly the potential additional effect (air pollution contribution) of the number of ships waiting in-line at a typical instantaneous moment (other than the ships porting at the port). In addition, the latter source of information was used to estimate the overall movements at each port as a measure of the average number of ships entering the port during a 24 h period of time (and hence the ship movement per hour). Table A7 is a summary of the main findings with regards to ship movements and location at each port.
Table A7. Summary of ships tracking of typical movements and location around the ports for 2018.
Haifa PortAshdod Port
Number of Ships at Hoteling PositionNumber of Ships at Waiting in-Line PositionTotal Number of Ships Positioning at Distance of 0–4 km from the PortNumber of Ships at Hoteling PositionNumber of Ships at Waiting in-Line PositionTotal Number of Ships Positioning at Distance of 0–4 km from the Port
Average value45.1822.7467.9136.2113.2649.47
Maximum value603578492865
Minimum value32145529745
Std
N = 34
(days)
5.55.26.64.75.36.3
Weekly average number of ships entering or leaving the port in 24 hMovement per hour Weekly average number of ships entering or leaving the port in 24 hMovement per hour
N = 6
(weeks)
82.7253.45 41.361.72

Appendix D. Emissions Scenarios for 2018, 2025 and 2030

Vessel’s emissions are presented in the following tables with respect to:
Haifa and Ashdod ports, two target years (2025 and 2030), business as usual (BAU) scenario and three emission mitigation scenarios (MPSA1, MPSA2 and MPS), as described below:
BAU 2025 assumes the following:
  • Passive renovation of vessels;
  • Current global regulation;
  • Increased vessels congestion;
  • Reduction of hoteling time;
  • New “HaMifratz”/”HaDarom” port.
MPS A1 2025 assumes the following (on top of BAU 2025 assumptions):
  • Electric shore power for 30% of the vessels;
  • Reduction of stand-by time by 30%.
MPS A2 2025 assumes the following (on top of BAU 2025 assumptions):
  • 50% of the old vessels are replaced with new ones, or SCR is installed in them;
  • Reduction of stand-by time by 30%.
MPS 2025 assumes the following:
  • MPS A1 2025 and MPS A2 2025 together.
BAU 2030 assumes the following:
  • Passive renovation of vessels;
  • Current global regulation;
  • Increased vessels congestion;
  • Reduction of hoteling time.
MPS A1 2030 assumes the following (on top of BAU 2030 assumptions):
  • Electric shore power for 50% of vessels;
  • Reduction of stand-by time by 60%.
MPS A2 2030 assumes the following (on top of BAU 2030 assumptions):
  • 70% of old vessels are replaced with new ones or with SCR is installed in them;
  • Reduction of stand-by time by 60%.
MPS 2030 assumes the following:
  • MPS A1 2030 and MPS A2 2030 together.
The calculated instantaneous emissions for typical vessels in 2018 are presented in Table A8 with units of gram pollutant per second (g/s). The total yearly vessel emissions calculated for the different scenarios (as described above) are shown in Table A9, Table A10, Table A11, Table A12, Table A13, Table A14, Table A15, Table A16, Table A17, Table A18, Table A19, Table A20, Table A21, Table A22, Table A23, Table A24, Table A25 and Table A26 and in Figure A2 with units of ton pollutant per year (ton/year), and also detailed in [111].
Table A8. Instantaneous emissions from vessels (2018 situation).
Vessel TypeInstantaneous Emissions (g/s)
CruisingManeuveringHoteling
NOxPM2.5VOCCOSOxNOxPM2.5VOCCOSOxNOxPM2.5VOCCOSOx
Large cruise114.36.51.640.8124.653.43.11.919.258.626.71.540.779.6029.3
Passenger vessel19.11.10.76.820.96.90.40.22.57.56.90.390.202.477.5
Panamax (containers)111.76.41.639.9121.838.12.41.514.945.54.70.280.141.755.3
Panamax (grains)32.10.70.511.535.00.00.00.00.00.02.10.050.060.772.3
Oil tanker 180 m25.30.40.49.729.70.00.00.00.00.01.80.030.050.672.0
Chemical tanker 100 m13.30.30.24.814.50.00.00.00.00.02.00.040.060.732.2
Bunker 120 m6.80.10.12.47.40.50.010.020.20.50.50.010.010.170.5
General cargo ship 120 m6.80.10.12.47.40.00.00.00.00.00.50.010.010.170.5
I.N.S18.51.10.76.820.96.70.40.22.57.56.70.390.202.477.5
Tugboat0.00.00.00.00.04.20.10.21.85.41.80.030.050.672.0
Table A9. Total emissions from vessels (Haifa, 2018).
PollutantEmissions (Ton/Year)
CruisingManeuvering + Stand-ByHotelingTotal
NOx194617%322829%599354%11,167
PM2.515618%30434%42948%889
VOC399%19043%21448%444
CO31218%60834%85748%1778
SO24605%189121%652674%8877
Table A10. Total emissions from vessels (Haifa, BAU 2025).
PollutantEmissions (Ton/Year)
CruisingManeuvering + Stand-ByHotelingTotal
NOx206919%337530%567651%11,119
PM2.512019%23336%28645%638
VOC489%23246%22945%509
CO38319%74536%91545%2042
SO21136%46324%139271%1968
Table A11. Total emissions from vessels (Haifa, MPS A1 2025).
PollutantEmissions (Ton/Year)
CruisingManeuvering + Stand-ByHotelingTotal
NOx206924%256930%401146%8648
PM2.512024%17836%20240%499
VOC4812%17746%16242%387
CO38324%56836%64740%1598
SO21138%35625%98468%1453
Table A12. Total emissions from vessels (Haifa, MPS A2 2025).
PollutantEmissions (Ton/Year)
CruisingManeuvering + Stand-ByHotelingTotal
NOx136020%168425%375755%6801
PM2.512021%17830%28649%583
VOC4811%17739%22950%454
CO38321%56830%91549%1865
SO21136%35619%139275%1861
Table A13. Total emissions from vessels (Haifa, MPS 2025).
PollutantEmissions (Ton/Year)
CruisingManeuvering + Stand-ByHotelingTotal
NOx136024%168429%269447%5738
PM2.512024%17836%20240%499
VOC4812%17746%16242%387
CO38324%56836%64740%1598
SO21138%35625%98468%1453
Table A14. Total emissions from vessels (Haifa, BAU 2030).
PollutantEmissions (Ton/Year)
CruisingManeuvering + Stand-ByHotelingTotal
NOx206619%334731%532750%10,740
PM2.512619%24538%28043%650
VOC5010%24447%22443%518
CO40219%78338%89643%2080
SO21186%48725%136369%1969
Table A15. Total emissions from vessels (Haifa, MPS A1 2030).
PollutantEmissions (Ton/Year)
CruisingManeuvering + Stand-ByHotelingTotal
NOx206633%190931%219236%6167
PM2.512633%14037%11630%382
VOC5018%14050%9233%283
CO40233%44937%37030%1221
SO211812%28429%56258%964
Table A16. Total emissions from vessels (Haifa, MPS A2 2030).
PollutantEmissions (Ton/Year)
CruisingManeuvering + Stand-ByHotelingTotal
NOx108822%98620%289258%4966
PM2.512623%14026%28051%546
VOC5012%14034%22454%414
CO40223%44926%89651%1746
SO21187%28416%136377%1766
Table A17. Total emissions from vessels (Haifa, MPS 2030).
PollutantEmissions (Ton/Year)
CruisingManeuvering + Stand-ByHotelingTotal
NOx108833%98630%119036%3263
PM2.512633%14037%11630%382
VOC5018%14050%9233%283
CO40233%44937%37030%1221
SO211812%28429%56258%964
Table A18. Total emissions from vessels (Ashdod, 2018).
PollutantEmissions (Ton/Year)
CruisingManeuvering + Stand-ByHotelingTotal
NOx97313%161422%466164%7248
PM2.57814%15227%33359%564
VOC207%9534%16759%281
CO15614%30427%66759%1127
SO22304%94615%507681%6251
Table A19. Total emissions from vessels (Ashdod, BAU 2025).
PollutantEmissions (Ton/Year)
CruisingManeuvering + Stand-ByHotelingTotal
NOx103414%168723%449362%7215
PM2.56015%11629%22656%402
VOC247%11636%18156%321
CO19115%37229%72456%1288
SO2564%23217%110279%1390
Table A20. Total emissions from vessels (Ashdod, MPS A1 2025).
PollutantEmissions (Ton/Year)
CruisingManeuvering + Stand-ByHotelingTotal
NOx103419%132524%317157%5531
PM2.56019%9229%16051%311
VOC2410%9138%12853%243
CO19119%29329%51251%996
SO2566%18318%77876%1018
Table A21. Total emissions from vessels (Ashdod, MPS A2 2025).
PollutantEmissions (Ton/Year)
CruisingManeuvering + Stand-ByHotelingTotal
NOx68015%86919%297466%4523
PM2.56016%9224%22660%378
VOC248%9131%18161%296
CO19116%29324%72460%1208
SO2564%18314%110282%1342
Table A22. Total emissions from vessels (Ashdod, MPS 2025).
PollutantEmissions (Ton/Year)
CruisingManeuvering + Stand-ByHotelingTotal
NOx68019%86924%209958%3648
PM2.56019%9229%16051%311
VOC2410%9138%12853%243
CO19119%29329%51251%996
SO2566%18318%77876%1018
Table A23. Total emissions from vessels (Ashdod, BAU 2030).
PollutantEmissions (Ton/Year)
CruisingManeuvering + Stand-ByHotelingTotal
NOx104315%169024%419461%6927
PM2.56316%12330%22054%407
VOC258%12338%17654%325
CO20316%39530%70554%1303
SO2604%24618%107378%1379
Table A24. Total emissions from vessels (Ashdod, MPS A1 2030).
PollutantEmissions (Ton/Year)
CruisingManeuvering + Stand-ByHotelingTotal
NOx104328%96426%172646%3733
PM2.56328%7131%9140%225
VOC2515%7142%7343%169
CO20328%22731%29140%721
SO2609%14322%44269%646
Table A25. Total emissions from vessels (Ashdod, MPS A2 2030).
PollutantEmissions (Ton/Year)
CruisingManeuvering + Stand-ByHotelingTotal
NOx54417%50215%220968%3255
PM2.56318%7120%22062%355
VOC259%7126%17665%272
CO20318%22720%70562%1135
SO2605%14311%107384%1276
Table A26. Total emissions from vessels (Ashdod, MPS 2030).
PollutantEmissions (Ton/Year)
CruisingManeuvering + Stand-ByHotelingTotal
NOx54428%50226%90946%1955
PM2.56328%7131%9140%225
VOC2515%7142%7343%169
CO20328%22731%29140%721
SO2609%14322%44269%646
Figure A2. Calculated present (2018) annual emissions of air pollutants from the ship sector in Haifa and Ashdod ports. Y axis is ton pollutant per year. All values are based on marine port activities data for the year 2018. See Table A9 and Table A18.
Atmosphere 13 00241 g0a2

Appendix E. Emissions from the Haifa and Ashdod Industrial Zones, Land Transportation and from a 1000 MW Coal Power Plant

To illustrate the extent of the calculated emissions from marine vessels in the Haifa and Ashdod ports for 2018, they were compared to the 2018 emissions from the Haifa Bay industrial zone, the North Ashdod industrial zone, transportation in the Haifa metropolitan, transportation in the Ashdod area, and a hypothetical 1000 MW coal power plant (see Table A27 and Table A28).
Table A27. Emissions from the 2250 MW Rotenberg coal power plant.
Pollutant (Ton/Year)YearYearly
Average
Proportional Annual Emission for a 1000 MW Coal Plant
2012201320142015
NOx25,48922,87319,47320,61022,1119827
PM10622533373766574255
PM2.5373.2319.8223.8459.6344153
NMVOC3000083
CO628611134046841816807
SO235,22234,40231,39633,50133,63014,947
Table A28. Emissions from the Haifa and Ashdod industrial zones and land transportation and a 1000 MW coal power plant.
SourcesNOxVOCsSOxPM2.5CO
HaifaPort11,16744488778891778
Industrial Zone180070065060
Transport203151341163919
1000 MW coal plant9827314,947153807
AshdodPort724828162515641127
Ind. Zone255050070042
Transport9232332531781
Haifa Bay industrial zone and North Ashdod industrial zone emissions for 2018 are from [88]. Since there is no PM2.5 data for these sources, PM2.5 data were calculated from the available PM10 emissions data for these sources, and from the average PM2.5/PM10 ratio, which is 0.6 [112,113]. Haifa metropolitan land transportation 2018 data are from [114]. Since there are no such data for the Ashdod area, the Ashdod area 2018 land transportation emissions were calculated based on the Haifa metropolitan data, and the ratio between the populations in each area (550,000 in the Haifa metropolitan, and 250,000 in the Ashdod area).
Emissions from a 1000 MW coal power plant were calculated based on the average emissions from the 2250 MW Rotenberg coal power plant between 2012–2015 [115,116,117,118]. and the ratio between 1000 MW and 2250 MW. Since there are no PM2.5 data for the Rotenberg coal power plant, PM2.5 data were calculated from the available PM10 emissions data for this source, and from the average PM2.5/PM10 ratio, which is 0.6 [112,113].

Appendix F. External Costs and Benefits from the Haifa and Ashdod Ports Air Pollution and Mitigation Scenarios

External costs and benefits from the Haifa and Ashdod ports air pollution and mitigation scenarios were calculated (see Table A29) based on the ports’ air pollution calculations for 2018, and air pollution externalities cost from the Israeli Ministry of Environmental Protection ‘green book’ (2020 edition) [76].
Table A29. External costs of emissions from the ship sector at Haifa and Ashdod ports by emission scenario.
Air PollutantPresent Costs
(ILS/Year)
BAU Costs
2030
(ILS/Year)
MPS Costs 2030
(ILS/Year)
BAU–Present Cost Difference (ILS/Year) BAU–MPS Cost Difference
(ILS/Year)
NOx237,978,819228,314,92867,435,308−9,663,891−160,879,620
PM2.5153,952,512112,018,81667,447,579−41,933,696−44,571,238
SOx599,492,589132,658,46563,815,301−466,834,124−68,843,165
Total991,423,921472,992,209198,698,187−518,431,711−274,294,022

Appendix G. Marine Air Pollution Mitigation Techniques

Appendix G.1. Holistic Mitigation Techniques

Holistic mitigation techniques reduce all air pollutant emissions: SOx, NOx, PM, VOCs, CO2 and CO. These techniques are comprised of changing the power source (shore power, natural gas), and changing vessel operation (onboard incineration, speed, hoteling time).

Appendix G.1.1. Electric Shore Power (ESP) for Marine Vessels

Technique’s Description

ESP (cold ironing) supplies ships at the port with electricity from the shore. This electricity is used by the ship’s systems instead of using its own air polluting auxiliary generator. This technique can significantly reduce air pollution in ports [29,31,38].
The technology requires dedicated infrastructure onshore: transmission cables, additional power generation capacity, high voltage berth connection point and high voltage sub-station. On the ship, transmission cable and onboard transformer is required [33]. Because many ports still do not have shore power, the vessels cannot concede their auxiliary generators.
Vessels that do not need a gantry crane to load and unload cargo (such as cruise, tanker, vehicle carriers), can be connected to shore through a berth connection point adjacent or parallel to the vessel. Cargo vessels that require a gantry crane to load and upload cargo cannot be connected to a berth connection point adjacent or parallel to the vessel. That is because it will obstruct the operation of the gantry crane. Therefore, they need to be connected first to a barge that can be at either ends of the vessel, and the barge is connected to an adjacent or parallel connection point on the berth [29]. This technique has been used by the US Navy for decades. It is also implemented commercially in the world [7,33,39,119]. In the USA in 2017, there were already 16 ports with ESP, with up to 60 MW of capacity per port. A US shore power calculator calculates the benefits of connecting a vessel for shore power. It can be found here below [120].

General Potential of Emissions Reduction

Dramatic reduction in noise, vibration, and air pollution exposure for ships’ crews, port workers, local residents and the environment. Overall improvement in working conditions [5,33]. This technology can eliminate all port air pollution originated in vessels hoteling (not including onshore transportation, dust from loading and unloading cargo and power supply).

Inputs and Costs

Table A30 and Table A31 present ESP costs of a European and an American case respectively.
Table A30. ESP costs and savings [33].
CostsPort of Göteborg, EUR09 *
Bunker price USD16/metric tonUSD 640
Ship auxiliary engineBunker/fuel277,316/year
Maintenance0
CO20
Externalities0
Sum277,316
Shore powerShipRetrofit400,000
Capital cost54,347/year
Electricity297,024/year
Maintenance0/year
Portnumber of quays2
Investment for all quays280,000
Capital cost38,043/year
Maintenance0/year
Sum shore power389,414/year
Total cost/saving−112,099/year
* Bunker USD 640/ton (Oct 2009), 4 calls/week, 16,800 kWh/call, 1 ship, electricity = 0.17 EUR09/kWh, 10 years pay-off time, 6% investment interest, calculated only for using electricity or fuel (not a life cycle analysis).
Table A31. Estimated costs of ESP (based on Table 1 in [5]).
Vessel TypeContainer and Bulk Cargo (USD)Tankers and Vehicle Carriers (USD)Cruise (USD)
CostsVessel retrofit (thousand USD/vessel/year)−41−38−59
Berth retrofit (thousand USD/berth/year)−732−219−327
Benefits (thousand USD/vessel/year)Fuel savings1321140
Total environmental benefits (NOx, SO2, PM2.5, CO2)124 (EASIUR and APEEP)67 (EASIUR)61 (APEEP)368 (EASIUR)138 (APEEP)
Net private benefit (vessel fuel savings minus retrofit cost) (thousand USD/vessel/year)−28−1781
Assuming marine fuel costs USD 680/ton. EASIUR- Estimating Air Pollution Impacts Using Regression. APEEP- Air Pollution Emission Experiments and Policy analysis.
In Israel, the electricity is cheaper (compared to Sweden) and is USD ~0.15/kWh. It does not include the proper externalities’ costs, and thus does not reflect the electricity use on environmental and health impacts. This low electricity price can reduce the shore power annual electricity cost by ~25%. Compared to the Swedish case, it can reduce the annual cost of shore power by EUR ~75,000, with a total cost of only EUR ~38,000/year (assuming all other costs are the same).
Vessel retrofit cost varies between EUR 400,000 [33], USD 500,000 [5] and USD 300,000–2,000,000 (cheaper for newly build and smaller vessels) [29,98]. Berth retrofit cost varies between EUR 300,000 [33], USD 4,000,000 [98] and USD 5,000,000 [29]. Retrofitting the electricity network outside the port cost from either almost zero investments [29] to USD 5,000,000 [98] depending on the electricity network. Operation and maintenance are calculated as 12% of the shore side investments: USD 36,000–600,000 for 15 years [29,33,98].

Cost Effectiveness

ESP is generally considered more cost-effective for vessels that spend longer times at port and/or use substantial amounts of energy for hoteling and/or frequently call the same ports [120]. Early studies and reports from the first decade of the millennium concluded that ESP is generally not cost-effective. For the 12 vessels studied, the average cost was USD 69,000/ton of pollutant reduced, while the threshold for cost-effectiveness was USD 15,000/ton of pollutant reduced. This is due to past low marine fuel prices, lacking air pollution externalities and carbon cost calculations, lighter regulation, ignored benefits at other ports and outdated calculation of air pollution health risks [5,29,31,33]. For example, all of the emissions were treated as equals, with the external cost of 1 ton of PM10 was equal to that of 1 ton of PM2.5 [29]. Today we know that 1 ton of PM2.5 is much worse for health compared to 1 ton of PM10, and therefore more costly.
However, even before, shore power was generally cost-effective with vessels that spend a long time at ports (over 1.8 million kWh of annual power consumption at port), and the added cost of the vessel’s power shore retrofitting is less than USD 15,000/ton of air pollutant/year. Shore power was found to be cost-effective for 5 out of the 12 vessels studied in the port of Long Beach. And this, even when each of these vessels received a “private” landside power shore facility at a specific berth. If more than one vessel will use each power shore facility, the technology will be even more cost-effective [29].
Since then, petroleum prices have increased (but it is volatile and can drop), marine vessels are transforming to cleaner but more expensive fuels, the effect of air pollution on health is better understood, air pollution regulation is tighter, carbon cost is taken more and more into account, and experience in shore power is increasing worldwide [5].
A newer report calculated the cost of reducing air pollutant by shore power in the ports of Los Angeles, Long Beach and Oakland, California. The cost of a ton of NOx and a ton of PM, was USD 11,000–71,000 and USD 400,000–2,500,000, respectively [38]; the ranges represent differences between the different ports and different marine vessels. A recent report on shore power in Shenzhen, China, calculated the cost to be USD 56,000, 1,400,000, 290,000 and 2300 for reducing a ton of NOx, PM, SOx and CO2, respectively [98].
Today, if 25–67% of the vessels that call at mainland US ports would use shore power, USD 70–150 million in air quality benefits (environmental and health benefits) could be achieved, plus USD 30 million in fuel savings, annually. These benefits are balanced by the cost of vessels and port retrofits, with no net cost to society. Per port, the environmental and health benefits vary between USD 1–38 million annually, depending on the proximity to inhabitants and their number, the size of the port and the types of vessels (see Table A32 and [5]).
Table A32. Estimated benefits of ESP based on various case studies (based on [5,121]).
PortTEU (Million Units/Year)Volume (Million Metric Tons/Year)EASIUR (Millions USD/Year)APEEP (Millions USD/Year)
Maximize Net Total BenefitMaximize Total BenefitMaximize Net Total BenefitMaximize Total Benefit
Oakland2.3171011911
Charleston217.31111
Ashdod1.319.6
Haifa1.224
Miami0.9-71067
Port Everglades0.919.181748
Jacksonville0.9141111
The range of environmental and health benefits in port similar in size to Haifa and Ashdod ports, for applying shore power for 25–67% of all vessels, is between USD 1–17 million/year. The average benefit is USD 5.8 million/year/port. In the Haifa port, due to the problematic topography, wind patterns, population spread and other factors, we generally estimate that the environmental and health benefits are in the upper range. At Ashdod, it might be at a lower range, yet this requires further investigation. It should be noted that the more Israel fuel mix for electricity production will rely on natural gas and renewables (as forecasted and planned), the potential benefits of ESP will increase.

Feasibility

This technique requires investments done by vessels owners and ports authorities, while the benefits are enjoyed mostly by near ports residents and workers, governmental spending on health, and the environment. As much as 80% of the vessels are expected not to compensate for their retrofitting by fuel savings. They can increase their freight cost, to include these expenses (eventually the consumers will be charged). Alternatively, policy makers could implement incentives and regulations to encourage a shore power use [5].
In 2009, there were more than 10 shipping companies with shore powered vessels. In 2015, 21 ports where already using shore power (12 in Europe, 9 in North America) and more are built in China [5,33,35,98,122,123]. So, there might already be vessels that call at Israeli ports with the proper infrastructure for shore power installed, and this transition can be less expensive for some vessels.

Appendix G.1.2. Repowering Vessels with Natural Gas or Dual-Fuel Engines

Technique’s Description

In this technique, the vessel’s regular engine is replaced (or the vessel is built in advance) with a natural gas or dual-fuel engine. Natural gas engines drastically reduce air emissions for all voyages. This is a holistic solution from the vessel’s point of view, that does not only solve air pollution in ports, such as ESP, but also during close to shore cruises and away from shore [124].
Dual-fuel engines can use either liquid fuel or natural gas. They can use cheap polluting fuel away from shore, and switch to cleaner natural gas close to shore. This way, the energy cost for this type of vessel is lower compared to natural gas only engine, and it can fuel itself in ports without natural gas fueling infrastructure. This is a mature technology [29,99].

General Potential of Emissions Reduction

Using natural gas can reduce SOx emissions by 99%, PM emissions by 94% and NOx emissions by 90%. This represents Tier IV performances [29,32,99].

Inputs and Costs

The capital cost for replacing an engine and for natural gas fueling infrastructure was estimated in 2002 to be USD 165–202/kW [32]. A 2004 report calculated the capital cost for retrofitting a vessel with a new LNG/Dual fuel engine is USD 240,000–4,625,000, or USD 184/kW on average [29].
The prices of petroleum and natural gas are fluctuating and affect the profitability of this technique. However, between 2006–2015, the prices of LNG and HFO were relatively similar, despite fluctuating fuel prices. Since 2006, the price difference was no more than 30% (USD 150), with an estimated average difference of only 10% (USD 50). In some years LNG is cheaper [99,100]. Thus, the transition is expected to be even more cost-effective. The expected increase of Israeli natural gas production might ensure relatively low marine LNG prices in Israeli ports.
The capital cost (CAPEX) of a small LNG onshore facility (shore tank to ship TPS, LNG production and bunkering station) that delivers 60 tons of LNG/day, can be USD 27,000,000 (7450/day). The OPEX of this facility is USD 4200/day. The total daily cost CAPEX + OPEX = USD 11,650/day. The added cost per ton of LNG delivered is USD 194, or an added cost of USD 3.7/mmBTU. This does not include connecting a pipeline to the port [101].
A larger LNG facility, with a 100,000 gallon (160 tons) per day production capacity, can cost USD 50,000,000 (CAPEX). Assuming a USD 4/mmBTU natural gas price, it can sell LNG for USD 10.5/mmBTU or 15.5/mmBTU, at the dock or at sea respectively There is a 15% energy penalty for producing LNG. In other words, a ton of natural gas on land is transformed to 0.85 ton of LNG on the ship [101].
The capital cost (CAPEX) of a small ship to ship (STS) system is USD 54,000,000, with a total daily cost CAPEX + OPEX = USD 20,000/day. The added cost per ton of LNG delivered is USD 333 [101]. If Israel decides to build a large LNG production facility for export, it could be used also to fuel LNG ships.

Cost Effectiveness

According to [29], this technique was cost-effective in reducing hoteling emissions for 11 out of 12 vessels examined. This, as the average added cost of replacing the engine with natural gas/dual-fuel engine was USD 9000/ton of reduced air pollutant/year.
A more recent study calculated the cost to be EUR (−2242)–(17,406)/tone of reduced NOx [99]. The negative value represents a reduction in operations cost compared to a conventional MGO powered engine (or in other words- gains) and is for building a new vessel with an LNG powered engine. This is due to the low expected cost of LNG. The high value represents retrofitting an existing MGO powered vessel with a new LNG engine.

Feasibility

Feasibility is medium to low. On one hand it is drastically improving air quality in ports, reduce health costs, and can be incentivized by the government. On the other hand, it requires large capital investments and loss of cruising time at sea while repowering is taking place.
A significant disadvantage of all natural gas engine option is the relatively low availability of natural gas fueling options in the world port. Until a large number of ports is equipped with natural gas fueling options, this solution is problematic. This option also requires costly storage of natural gas (pressurized or liquefied), in larger volumes compared to liquid fuel (as natural gas is less energy dense).
The downside of the dual-fuel engine option is that this vessel can neither store very large quantities of liquid fuel nor natural gas. It can take relatively short cruises with either of these fuels, but for long cruises it might have to store both fuel types.
As a general rule, using natural gas raises issues of operating safety, as it is considered less safe than diesel or heavy oil fuel [29]. However, the number of LNG marine vessels was increasing at a fast annual rate of over 30% between 2014–2018. A fast growth rate is expected at least until 2021. In 2018, there were 223 LNG/dual fuel marine vessels globally. Most operate in Europe, but it is already a global phenomenon [123,125,126].
LNG bunkering can be done from a truck to a ship, from a ship to a ship and from shore to ship. In 2017, there were about 60 locations (sea ports and LNG bunker vessels) with LNG bunkering, again, mostly in Europe. This number is expected to double in the next few years, with at least 139 LNG ports in Europe alone (at least one per sea shore country) [124,125,126,127,128,129]. Moreover, there are hundreds of non-bunkering LNG facilities: LNG facilities that are not designated for ship fueling. Many of these facilities could be easily and cheaply be fitted for ship fueling. Here in Israel, we have the Hadera LNG terminal, where LNG storage ships supply natural gas to the Israeli natural gas network. Also, because natural gas pipelines are present at both Ashdod and Haifa, there is no need to invest much in connecting these ports to the national natural gas network.

Appendix G.1.3. Ship Onboard Incineration (SOI)

Technique’s Description

Oceangoing vessels incinerate waste, instead of disposing it at sea or at port. A USA survey found that the average amount of waste that is incinerated per oceangoing vessel is 111 tons per year. In total, 45% of oceangoing vessels have no incinerators at all. The main types of incinerated waste are rags, paper, packing material, and plastics. In this mitigation technique, ship onboard incineration is prohibited within 3 nautical miles of the coast [37].

General Potential of Emissions Reduction

There is a potential for emission reduction of dioxins, toxic metals and PM for residents living next to the coast.

Inputs and Costs

For proper monitoring, the vessels must keep an updated waste record book, with information on incinerations dates, vessel position (latitude and longitude), and estimated amount of incinerated garbage. The vessels must either incinerate their waste away from the shore or use other approved waste disposal solutions, such as disposal at the port, recycling, disposal at sea (of feed waste, etc.). There can be no economic cost for this technique.

Cost Effectiveness

This technique is not sufficient as a stand-alone technique, yet on its own, is very cost effective—with little or no cost, and with a small health gain. The health gain was calculated to be a reduction of two cancer cases per 1 million residents.

Feasibility

High feasibility, due to the practically non-existent economical cost, yet, low sufficiency as a stand-alone technique.

Appendix G.1.4. Oceangoing Vessels Speed Reduction (VSR)

Technique’s Description

Reduction of oceangoing vessels speed from cruise speed to below 15 nautical knots can reduce air pollutants and greenhouse gases emissions. When this technique is applied within 20–40 nautical miles from shore (VSR zone), a distinct improvement in air quality can be measured onshore [34].

General Potential of Emissions Reduction

Potentially this technique can reduce CO, NOx, PM2.5 and SOx emissions by 60%, 55%, 70% and 70%, respectively, in the VSR zone. However, in the case of Haifa and Ashdod ports, the potential is estimated to me much lower as most vessels’ typical speeds within 20–40 nautical miles are already moderate (lower than 15 knots).

Inputs and Costs

This technique can reduce the energy costs for vessels as their fuel consumption per nautical mile improves.
Speed reduction in the VSR zone might mean a time penalty for the vessels, and longer cruise time. However, proper cruise planning can eliminate this time penalty.

Cost Effectiveness

This technique is not sufficient as a stand-alone technique, yet on its own, is very cost effective, as it can reduce costs for vessels, even without taking into account the benefits from an improved air quality. Moreover, it does not require any costly modifications or improvements in marine vessels or ports.

Feasibility

This technique has high feasibility, because it requires only a change in habit, no capital investment, no time consuming vessels’ or ports’ modifications. It is already implemented around the world (for example, in California).
However, based on an assessment we have performed regarding typical speeds of vessels from various distances of both Haifa and Ashdod ports, it is estimated that 80–90% of all the marine vessels within 25–30 nautical miles (~50 km) of the Haifa and Ashdod ports usually sail at less than 15 nautical knots. Therefore, this technique is not expected to significantly reduce the actual marine vessels’ emissions, at least in the near future.

Appendix G.1.5. Reduce Hotelling Time (RHT)

Technique’s Description

Reduction of hoteling time can reduce emissions in ports, in particular if implemented on relatively more polluting vessels. It can be achieved by limiting hoteling time per vessel, especially more polluting vessels. For example, to fine vessels that stay more than X hours at port. It can also be achieved by improving cargo handling and monitoring equipment and procedures that will reduce the time a vessel must stay in port to load and/or unload cargo. For example: faster liquid (crude oil, fuel, water) pumping, modern container cranes and faster passengers boarding on cruise ships.

General Potential of Emissions Reduction

Highly dependent on many factors, including the congestion at the port and how it is occupied at every moment. It is our estimation that shortening the time of hoteling and stand-by time of more polluting vessels can potentially reduce emissions in range of 10–25%. One of the more cost-effective ways of achieving such reduction is by allowing relatively more polluting vessels to stand-by at longer distances form the port (at least 5 km away from the port).

Inputs and Costs

Can start with no investment, with only applying incentives for a short hoteling period per ship (fines, hoteling cost per hour, etc.). However, a significant reduction in the hoteling period can only be achieved with installing more efficient infrastructure and might require substantial port operations change. These will cost a significant amount of money and will take years to be implemented in the ports.

Cost Effectiveness

Medium-high cost-effectiveness.

Feasibility

Highly feasible, but not necessarily in Israel. Reduction of hoteling time can reduce emissions in ports, in particular if implemented on relatively more polluting vessels. Not sufficient as a standalone technique. Might not be relevant to Israel, as usually the ports are full at all times, and there is a long queue of ships waiting to enter the ports (even prior to the COVID-19 pandemic). RHT will probably reduce the line outside of the port but will not be enough to reduce the average number of ships at each port. However, once the two new ports in Haifa and Ashdod will operate at full capacity (2022–2023), the line outside of the ports might be eliminated, and RHT might be relevant.

Appendix G.1.6. Distancing Stand-By Location

Most marine vessels in stand-by phase, wait at about 2 km from port. Distancing the stand-by location to over 5 km (or even 10 km) from the shore, can reduce the amount of air pollution that reaches the shore. Lowers all types of emissions that can reach the shore significantly. This technique is not sufficient as a standalone technique. Since there are dozens of ships at all times in stand-by outside of the Haifa and Ashdod ports, this technique can be very effective, and costs nothing. We did not find evidence that this technique is used around the world. however, Israeli port authority personnel did not raise any concerns or objections to this technique.
Feasibility: very high. Does not cost anything, can be implemented immediately and can be applied by any ship and port.

Appendix G.2. SOx Mitigation Techniques

SOx mitigation techniques reduce substantial SOx and PM emissions. Sometimes they affect other emissions, for better or worse. These techniques are comprised of fueling with low sulfur fuels (MGO, MDO, GTL, on-road diesel) or exhaust gas scrubbing.

Appendix G.2.1. Low-Sulfur Marine Gas Oil (MGO) Diesel Fuel

Technique’s Description

Many vessels use the cheap and “dirty” heavy fuel oil (HFO) diesel fuel that has a 2.8% sulfur content. This high sulfur content is responsible for high SOx and PM emissions. Replacing the use of HFO, with low-sulfur (0.1–0.2%) marine gas il (MGO) or marine distillate oil (MDO) diesel fuels, significantly reduces the mentioned emissions [29,103]. It is possible to permanently switch to a cleaner fuel, or to use the two fuel types in the same vessel: a dirty fuel away from shore and ECAs and a cleaner fuel close to shore and within ECAs. A report estimated that already in 2009 that at least 80% of all vessels have the capacity to use the two fuels without any major modifications to the vessel. Therefore, only the fuel cost is a factor for most vessels [103].

General Potential of Emissions Reduction

This technique can reduce PM and SOx emissions by 85% and 90%, respectively. However, it does not reduce any other emissions, such as as NOx, CO and VOCs [29].

Inputs and Costs

It costs about USD 50,000 to clean a vessel’s fuel tanks and fuel system and replacing fuel filters etc., before switching to MGO. This is a one-time cost. Besides that, MGO is more expensive than HFO [29,130]. It is notable that marine fuel must have a flashpoint of at least 60 °C to comply with ISO 8217 and 2719, whereas MGO can have a flash point between 57 °C and 69 °C. Therefore, only MGO with a flashpoint above 60 °C should be used [29].
Depending on the engine power and normal operational speed, a newer report calculated the costs for installing the system in a new vessel to be between USD 34,000–90,000, or USD 1.5–8 per kW. Retrofitting a vessel costs between USD 45,000–100,000 per vessel USD or 2–1$ per kW [103]. Between 2006–2015, MGO was more expensive than HFO, by an average of USD 275 per TOE (range of USD 100–350), or an average of 60% more expensive (range of 63–82%) [100]. This solution is therefore very expensive.

Cost Effectiveness

Switching from HFO to MGO fuel, was found to be cost-effective for all examined vessels even with the relatively low standard externalities calculation on 2004 [29].

Feasibility

This is one of the easiest techniques to implement. It is relatively not expensive, does not require a significant change is infrastructure and vessels, and can be carried out independently in every vessel independently of other vessels or ports. In 2015, a designated North American Emissions Control Area was fully implementing. Within it, only low sulfur marine fuels are allowed. This policy reduced PM emissions from marine vessels by 75% [122].
However, because it is so easy to implement, it is harder to find if a vessel that has switched to use MGO instead of HFO. To find out, one either needs to test the fuel onboard, or take emission measurements. In other techniques, it is much easier to recognize compliance.

Appendix G.2.2. On-Road Diesel

Technique’s Description

In this technique, HFO or MGO are replaced with cleaner on-road diesel for use in the vessels’ auxiliary engines. This fuel has only 0.3% sulfur and lower aromatic organic compounds [29].

General Potential of Emissions Reduction

Replacing HFO or MGO with on-road diesel would reduce NOx emissions by 6%, PM by 87% and SOx by 90% [29].

Inputs and Costs

Switching to on-road diesel can cause major fuel leakage and might not comply with injectors. On-road diesel, that has a flashpoint of 52 °C and 60 °C, is not compliant with ISO standards 8217 and 2719, which require that marine fuel must have a flashpoint of at least 60 °C. Therefore, on-road diesel should be modified before using for hoteling [29].

Cost Effectiveness

Not clear.

Feasibility

Not too difficult to implement from an infrastructure point of view. However, there is a need to modify engines, to modify the fuel and/or ISO standards before using this fuel on marine vessels [29].

Appendix G.2.3. Gas to Liquid (GTL) Fuel

Technique’s Description

Gas to liquid is the process of producing a synthetic diesel fuel out of syngas, a mixture of H2, CO and CO2- through the Fischer–Tropsch reaction. Syngas itself can be produced from natural gas, coal or biomass or plastic. GTL diesel has no sulfur or aromatic compounds [29].

General Potential of Emissions Reduction

Compared to HFO and MGO, PM emission reduction is 13% and 87%, respectively. There are no SOx emissions. Compared to on-road diesel, GTL emits 39% less CO and 5% less NOx and no SOx [29].

Inputs and Costs

GTL diesel will be probably more expensive compared to HFO and MGO, with comparable price to that of on-road diesel. The capital cost of a GTL facility is very high, somewhere between USD 5–20$ billion [131]. It is assumed that switching to GTL fuel will cost USD 50,000 per vessel to replace seals, pumps, lines, filters and to modify the fuel system. As with on-road diesel, there are issues with GTL diesel volatility, flammability, engine injector tolerance etc. [29].

Cost Effectiveness

Questionable. Efforts of using GTL are not negligible and yet only sufficiently reduce SOx, while NOx must also be addressed.

Feasibility

As part of the national fuel choices initiative, Israel is considering production of GTL from natural gas. However, GTL production facilities are very rare (less than a handful worldwide), extremely expensive, and with little experience. Also, reduction in emissions onboard, is offset by huge environmental impacts of the GTL facility [132,133,134]. Therefore, until a GTL plant is in operation, this solution is irrelevant.

Appendix G.2.4. Exhaust Gas Cleaning Systems (EGCS, “Scrubbers”)

Technique’s Description

This technique uses seawater or fresh water to scrub the exhaust gas from SOx. It can also remove NOx and PM to some degree. In open-system EGCS, the used water is sometimes filtered, sometimes diluted and sometimes neither, before it is discarded to the sea. This solution is an attractive and viable alternative for replacing high sulfur HFO with low sulfur MGO fuel. There are closed system EGCS that can filter the used water and store the “scrubber sludge” for discharge at port [103,135].

General Potential of Emissions Reduction

About 90–99% reduction in SOx emissions, and some NOx and PM emissions reduction [29,135]. A different study found only slight reduction of PM in one case, and even a slight increase in PM in another [109].

Inputs and Costs

Installing scrubbers might be cheaper than switching from HFO to MGO [136], but others found the opposite [130]. The decision should be case based, as there are many factors that dictate the overall cost: fuels cost, scrubbers’ technology maturation and reduction in cost over the years, number of years until decommissioning, size of vessel, vessel operation and percentage of trip spent in ECAs [137].
The cost of scrubber installation is estimated at USD 4–7 million per vessel [136], or USD 80/kW for retrofit and USD 55/kW for new build [130]. However, an earlier EPA report calculated the cost to be USD 422,000–1,720,000 per vessel, depending on the engine power and normal operational speed or USD 35–94/kW [103].
An open-system EGCS used scrubbing water discarded to sea is acidic (pH 3), has high temperature, contains contaminates, such as heavy metal, sulfuric acid and nitrate.
Closed systems must have a dedicated tank to store the “scrubber sludge”- up to 7 cubic meters (m3) for a 2700 passengers cruise ship per week [135]. Fuel consumption is expected to rise by 1–3% due to the extra effort in pumping the sea water to the scrubber [29,103].

Cost Effectiveness

The technique is cheaper than switching from HFO to MGO, but open-system EGCS reduces the environmental cost-effectiveness [135].

Feasibility

High feasibility, and already in wide use [124,135,138,139].

Appendix G.3. NOx Mitigation Techniques

NOx mitigation techniques can substantially reduce NOx emissions. Sometimes they affect other emissions, for better or worse. The techniques are based on reducing combustion temperature (EDF, DWI, Fumigation, EGR), or exhaust gas scrubbing (SCR), or engine retrofitting or replacement to Tier II–IV standards.

Appendix G.3.1. Emulsified Diesel Fuel (EDF)

Technique’s Description

In this technique, HFO or MGO are replaced in the auxiliary generator by emulsified diesel fuel. Water and stabilizing surfactants are added to diesel fuel, turning it into an emulsion. One option is to emulsify the fuel in advance, and keep it agitated in the tank. A probably more cost-effective option is to emulsify the fuel right before it enters the engine.
The water keeps the combustion temperature lower, and therefore less NOx is produced. It is theorized that reduction in PM emissions is due to fuel drops shattering when they heat up and the water in them explodes into steam [29].

General Potential of Emissions Reduction

This technique can reduce 14% NOx, 63% PM and 25% VOC of emissions [29]. A newer report stated that up to 50% of NOx reduction is possible. However, high reduction percentage is possible only during low engine load [103].

Inputs and Costs

Usually, water comprises 15% of the emulsified fuel. This reduces the energy content of the fuel. It is estimated that emulsified fuel will cost 35–50% more than regular fuel, due to the lower energy content, the fuel production and fuel agitation.
It is assumed that switching to emulsified fuel will cost $50,000 per vessel to replace seals, pumps, lines, filters and to modify the fuel system. If the emulsified fuel is produced onshore, and kept agitated in the vessel’s tanks, a capital cost of $450,000 is added to account for the service barge or for the on-shore fueling station. Therefore, the maximal total capital cost is about USD 500,000 per vessel. Sharing a service barge or an onshore fueling station between more than one vessel reduces the capital cost significantly. Even better, if emulsifying the fuel is prepared onboard only prior to its injection into the engine, the capital cost plummets even further.
Storage of emulsified fuel is difficult and expensive, due to natural separation of fuel and water. There is also uncertainty regarding engine durability and lube oil changes due to the emulsified fuel [29]. Depending on the engine power and normal operational speed, a newer report calculated the cost of installing an emulsifying system to be between USD 86,000–210,000 per vessel, or USD 4–19 per kW [103].

Cost Effectiveness

Half of the 12 vessels tested for using emulsified fuel are cost-effective with regard to externalities calculation in 2002. This number rises when more than one vessel are sharing a service barge or an on-shore fueling station, or when an on-board emulsifying system is installed [29].

Feasibility

This is one of the easiest techniques to implement. It is relatively not expensive, does not require a significant change is infrastructure and vessels, and can be carried out in every vessel independently of other vessels or ports. However, because it is so easy to implement, it is difficult to establish whether a vessel has actually switched to use emulsified fuel. In order to find out, one needs to either test the fuel onboard, or take emission measurements. In other techniques, it is much easier to recognize compliance.

Appendix G.3.2. Direct Water Injection (DWI)

Technique’s Description

A combustion modification technology for reducing NOx emissions. In this technique, fresh water is injected independently into the cylinder to cool down the combustion temperature. This technique is most efficient over a 40% engine load [103].

General Potential of Emissions Reduction

A 0.4–0.7 water/fuel ratio can reduce NOx emissions by 50–60%.

Inputs and Costs

The technique requires 20–50% rise in freshwater production from sea water, and appropriate storage facilities. It rises fuel consumption. Depending on the engine power and normal operational speed, installing DWI costs between USD 185,000 and 1,115,000 per vessel, or USD 23–41/kW [103].

Cost Effectiveness

Relatively cost-effective yet limited in its emission reduction potential.

Feasibility

This is a mature technology, with some experience in marine vessels. This technique is relatively cheap, simple, does not require a lot of space to additional facilities, and can be shut down without an impact on the running engine performances. It is easy to install, and can even be installed when the ship is in operation [103].

Appendix G.3.3. Fumigation

Technique’s Description

A combustion modification technology for reducing NOx emissions. In this technique, water is heated to create vapor/fumes that is added to the air injected to the engine. The extra fumes lower the combustion temperature and reduce NOx formation. In contrast to SCR, no warm-up time is necessary for proper operation. A variant of this technique can be used with high sulfur fuels (up to 4.5%), in contrast to SCR that can operate only with low sulfur fuels [103].

General Potential of Emissions Reduction

A 50–80% reduction in NOx emissions can be achieved, depending on the technique variant [103].

Inputs and Costs

Depending on the engine power and normal operational speed, installing fumigation costs between USD 170,000 and 1,085,000 per vessel, or USD 22–42/kW.
Because the systems use engine heat to increase the water content in the air for combustion, additional boiler capacity may be needed for other needs. The system uses a 2 to 3 water to fuel ratio. Depending on the technique, either fresh or sea water is used [103].

Cost Effectiveness

Could be more cost-effective in smaller marine vessels and other cases where 70–80% of emission reduction can be achieved while investment costs are at the lower ends (USD 200,000–400,000 per vessel)

Feasibility

There is relatively plenty of experience with this technique in small marine vessels (e.g., ferries).

Appendix G.3.4. Exhaust Gas Recirculation (EGR)

Technique’s Description

A mature combustion modification technology for reducing NOx emissions. In this technique, a part of the exhaust gas is recirculated back into the engine cylinders. The exhaust gas is poor in oxygen and richer with inert gases compared to regular air. This lowers the oxygen concentration in the cylinders, the heat produced and the NOx emissions. The penalty is in fuel consumption. The technology is confirmed by engine manufactures to reach Tier III level [99,140]. It is less efficient compared to SCR, with less experience on marine vessels [103]. Less prevalent than SCR.

General Potential of Emissions Reduction

This technique can reduce NOx emissions by 70%, reaching Tier III standards [99,103].

Inputs and Costs

Compared to SCR, EGR is usually cheaper per vessel and per kW. Indeed, a report by the EPA has calculated the cost (USD 2006) of EGR to be between USD 86,000 and 251,000 per vessel with 4.5 MW to 48 MW engine power. The cost per kW, is between USD 5–19/kW, depending on the engine size and on the normal operational speed [103].

Cost Effectiveness

A new report calculated the cost of EGR per kg of NOx removed to be EUR 0.49–5.49/kg NOx for a new vessel (similar to that of SCR), but with higher uncertainty, due to lack of experience with the technique [104]. Another report calculated the cost of implementing EGR and estimated figures between EUR 0.21–1.194/kg of reduced NOx [99]. Therefore, if one desires only to comply with Tier III requirements, one should install EGR. However, if one desires to reduce NOx emissions as much as possible, SCR is more compatible.

Feasibility

Medium to high. EGR installation requires an investment by ships. However, the installation time and cost are shorter and cheaper, respectively, compared to SCR [140].

Appendix G.3.5. Repowering with US EPA Tier II, III and IV Engines

Technique’s Description

Tier 0, I, II, III and IV standards permit a decreased limit of air pollution emissions per kWh, from marine vessels’ engines. The higher the Tier, the lower the permitted emissions. Replacing old and/or dirty engines with lower-emitting US EPA Tier II marine engines is widely used in the USA. Even better is to repower vessels with newer and cleaner Tier III and IV [29,123,141].

General Potential of Emissions Reduction

This technique reduces NOx emissions (and in some cases, also PM). Compared to Tier I, Tier II can reduce NOx emissions by 15–20%, Tier III by 75–80%, and Tier IV by 90% (see Figure A1) [29,109,141].

Inputs and Costs

Depending on the engine power and normal operational speed, retrofitting a Tier 0 engine to a Tier I standards, costs between USD 11,000 and 36,000, or USD 0.6–1.6/kW.
Minor retrofitting of a Tier I engine to a Tier II standards, costs between USD 8000 and 13,000 or USD 0.3–1.8/kW. Engines with a mechanical fuel injection must replace it with common rail fuel injection to comply with Tier II standards. This modification costs between USD 68,000–260,000, or USD 5–17/kW. Engines with an electronic fuel injection, must replace it with common rail fuel injection to comply with Tier II standards. This modification costs between USD 26,000–81,000, or USD 2–6/kW. Minor retrofitting of a Tier II engine to a Tier III standards, costs between USD 52,000 and 130,000, or USD 3–12/kW [103]. Repowering with US EPA Tier 2 costs USD 7500–310,000 (average USD 75,000) per vessel to replace an engine [29].

Cost Effectiveness

Depending on the engine power and normal operational speed, retrofitting a Tier 0 engine to a Tier I standards has a cost-effectiveness of USD 11–24 SDR/MT NOx [103].

Feasibility

This technique is suitable for small marine vessels (tugboats, barges, ferryboats), but not for long distance cargo and cruise vessels [29].

Appendix G.3.6. Selective Catalytic Reduction (SCR)

Technique’s Description

A relatively matured after treatment technique for reducing NOx emissions in marine vessels. NO2 is reduced to N2 gas over a catalyst in the exhaust system, by an added reducing agent (urea/ammonia) [99]. This technique requires a warm engine in order to operate (210–500 °C), and therefore NOx reduction does not occur upon engine restart. SCR is not suitable for use with sulfur-rich fuels (HFO), as it leads to corrosion and process malfunction [103].

General Potential of Emissions Reduction

This technique can reduce NOx levels by 70–98% compared to Tier I engines, to 2–3.5 g/kWh [99,103] (see Figure A1).

Inputs and Costs

For an average vessel with 13.4 MW engine, that uses 5000 MWh per year, the investment costs are (EUR 2010): EUR 61/kW for a SCR in a new vessel, or EUR 89/kW for retrofitting an existing vessel with SCR. The total average costs are 711,000 and EUR 1,030,000 per new and retrofit vessel respectively. The operation and maintenance costs are EUR 2.7/MWh [104]. The EPA has calculated similar costs (USD 2006), ranging between USD 390,000 and 2,080,000 per vessel with 4.5 MW to 48 MW engine power. The cost per kW, is between USD 39–87/kW, depending on the engine size and on the normal operational speed [103].

Cost Effectiveness

The total cost per kg of removed NOx is between EUR 0.49–5.49 and 1.57–7.82/kg NOx for a new and a retrofitted vessel, respectively. The low values are calculated for up to 25 years of operation and/or investment, while the high values are calculated for as low as 5 years of operation and/or investment. The longer the remainder expected life time of the vessel, the lower the cost per kg of NOx reduced [104]. Another estimation for the cost of implementing SCR is between EUR 0.151–2.025/kg of reduced NOx [99].
Applying this technique to comply with a North and Baltic Seas NECA, has a benefit-cost ratio of 0.99–11.6. Applying this technique to comply with a North and Baltic Seas NECA and a levy on NOx emissions, has a benefit–cost ratio of 0.97–5.2. Low values are for vessels with a low number of years remaining in operation, and high values are for vessels with a high number of years remaining in operation [104].

Feasibility

This technique is not easy to implement. Tier 0 vessels are too old to implement it. Tier I and II vessels will have to pay more than a million € for a retrofit, not to mention at least a few weeks of retrofitting instead of operating. Without specific limit standards, fleets are not expected to adopt this technology. Nevertheless, this is the leading NOx reduction technique in use today, with the most experience and range of vessels.

Appendix G.4. Mitigation Techniques Summary

Table A33, Table A34 and Table A35 summarize holistic, SOx and NOx emissions mitigation techniques, respectively.
Table A33. Holistic mitigation techniques.
Technique NameEmission Mitigation Potential Cost (USD)Sufficiency and Relative Cost Effectiveness
(NIS/Ton Reduced Pollutant)
Remarks
SOxPMVOCNOx
ESP—Electric Shore power100%100%100%100%300,000–200,000 per vessel
400,000–5,000,000 per berth
0–5,000,000 per electric net.
0–600,000 for O and M [29,33,98]
Highly sufficient.
Medium to high cost-efficiency [38,98].
Eliminate all pollutants during hoteling time (the biggest operation-regime contributor to air pollution from the Haifa and Ashdod ports).
Natural gas/dual fuel99%94%90%90%240,000–4,625,000$ per vessel (184/kW) [29]. LNG price is usually within 15% of HFO price [99,100] 50,000,000 per LNG facility [101].Highly sufficient.
Medium to high cost-efficiency [99].
Emission mitigation applies for all operational regimes (natural gas), or when close to shore (dual fuel).
LNG fuel is still not widely available.
SOI—Ship onboard incineration-Some - Highly cost-effective, but not sufficient as a standalone techniqueDoes not affect the main emission source (the engine).
VSR—Vessel Speed reduction70%70% 55% Highly cost effective, but not sufficient as a standalone techniqueMitigation is only for sailing. 80–90% of vessels within 25 nautical miles of Israeli ports, usually sail at low speed.
RHT—Reduced Hoteling Time Highly cost effective, but not sufficient as a standalone techniqueMitigation is only for hoteling phase.
Distancing stand-by location~90%~90%~90%~90%No costNot sufficient as a stand-alone technique, but very high cost-effectiveness.Mitigation is only for the stand-by and maneuvering phase. Very relevant for Israel, as dozens of ships always wait in-line outside the ports.
Table A34. SOx mitigation techniques.
Technique NameEmission Mitigation PotentialCost (USD)Sufficiency and
And Relative Cost- Effectiveness
(NIS/Ton Reduced Pollutant)
Remarks
SOxPMNOx
MGO90%85% New build 34,000–90,000 (1.5–8/kW)
Retrofitting 45,000–100,000 (2–10/kW) [103]
MGO price is usually 60% more expensive than HFO [100]
Highly sufficient.
Medium to high cost-efficiency [29]
On-road diesel90%87%6%Vessel modifications 50,000 [29]
More expensive than MGO.
Highly sufficient.
Medium to high cost-efficiency
GTL100%87%13%Vessel modifications 50,000 [29]
GTL facility CAPEX is very high: 5–20 billion [131]
GTL is more expensive than MGO.
Highly sufficient.
low cost-efficiency
The substantial environmental impact of a GTL plant should also be considered [142]
EGCS80–99% 400,000–7,000,000 or 35–94/kW (more expensive for retrofitting) [103,136]Highly sufficient.
Can be more cost-effective than switching to MGO
Open systems can cause SOx and heavy metals sea pollution [135]
Table A35. NOx mitigation techniques.
Technique NameNOx Emissions MitigationCost (USD) Per Vessel (or Per kW)Cost-Effectiveness ($/Ton of Reduced NOx)Remarks
EDF10–50%86,000–210,000 (4–19/kW) [103]Low to medium sufficiency.
Low to medium cost-efficiency
Compatible with Tier II.
DWI50–60%185,000–1115,000 (23–41/kW) [103]Medium sufficiency.
Low to medium cost-efficiency
Compatible with Tier II.
Fumigation50–70%170,000–1085,000 (22–42/kW) [103]Medium sufficiency.
Low to medium cost-efficiency
Compatible with Tier II–III.
EGR70%86,000–251,000 (5–19/kW) [103]Medium to high sufficiency.
High cost-efficiency [99,140]
Compatible with Tier III. Some experience in marine vessels.
SCR70–98%500,000–1300,000 retrofit (112/kW) [104]
390,000–2080,000 new (39–87/kW) [103]
Highly sufficient.
Medium to high cost-efficiency [99]
Compatible with Tier III–IV.
Plenty of experience in marine vessels.
Engine retrofitting from Tier I to II,
III.
Tier II 20%
Tier III 80%
Tier IV 90% [29,109,141]
Retrofitting to Tier II: 8000–260,000$
(0.3–17/kW) [103]
Replacing to Tier II: 7500–310,000 [29]
Retrofitting to Tier III: 52,000–130,000
(3–12/kW) (not including adding SCR or EGR) [103]
Low to high sufficiency.
Medium to high cost-efficiency
Full replacement to Tier III engine is more expensive. New Tier III engines include SCR, EGR or LNG technologies.

References

  1. Merk, O. Shipping Emissions in Ports; OECD: Paris, France, 2011. [Google Scholar]
  2. Rodrigue, J.-P. The Geography of Transport Systems, 5th ed.; Routledge: New York, NY, USA, 2020; ISBN 9780367364625. [Google Scholar]
  3. International Maritime Organization. Third IMO GHG Study 2014 Executive Summary and Final Report; International Maritime Organization: London, UK, 2015. [Google Scholar]
  4. Concawe. Marine Fuel Facts; Concawe: Brussels, Belgium, 2017. [Google Scholar]
  5. Vaishnav, P.; Fischbeck, P.S.; Morgan, M.G.; Corbett, J.J. Shore Power for Vessels Calling at U.S. Ports: Benefits and Costs. Environ. Sci. Technol. 2016, 50, 1102–1110. [Google Scholar] [CrossRef] [PubMed]
  6. Van Erp, J.; Spapens, T.; Van Wingerde, K. Legal and extralegal enforcement of pollution by seagoing vessels. In Hazardous Waste and Pollution; Wyatt, T., Ed.; Springer International Publishing: Berlin/Heidelberg, Germany; New York, NY, USA; Dordrecht, The Netherlands; London, UK, 2016; pp. 163–176. ISBN1 978-3-319-18080-9. ISBN2 978-3-319-18081-6. [Google Scholar]
  7. Winkel, R.; Weddige, U.; Johnsen, D.; Hoen, V.; Papaefthimiou, S. Shore Side Electricity in Europe: Potential and environmental benefits. Energy Policy 2016, 88, 584–593. [Google Scholar] [CrossRef]
  8. Jasper, F.; Shinichi, H.; Zhang, S.; Paula, P.; Comer, B.; Hauerhof, E.; van der Loeff, W.S.; Smith, T.; Zhang, Y.; Kosaka, H.; et al. Fourth Greenhouse Gas Study 2020; International Maritime Organization: London, UK, 2021. [Google Scholar]
  9. McDuffie, E.E.; Smith, S.J.; O’Rourke, P.; Tibrewal, K.; Venkataraman, C.; Marais, E.A.; Zheng, B.; Crippa, M.; Brauer, M.; Martin, R.V. A global anthropogenic emission inventory of atmospheric pollutants from sector- And fuel-specific sources (1970–2017): An application of the Community Emissions Data System (CEDS). Earth Syst. Sci. Data 2020, 12, 3413–3442. [Google Scholar] [CrossRef]
  10. Olmer, N.; Comer, B.; Roy, B.; Mao, X.; Rutherford, D. Greenhouse Gas Emissions from Global Shipping, 2013–2015; International Council on Clean Transportation: Washington, DC, USA, 2015. [Google Scholar]
  11. Viana, M.; Hammingh, P.; Colette, A.; Querol, X.; Degraeuwe, B.; de Vlieger, I.; van Aardenne, J. Impact of maritime transport emissions on coastal air quality in Europe. Atmos. Environ. 2014, 90, 96–105. [Google Scholar] [CrossRef]
  12. Endresen, Ø. Emission from international sea transportation and environmental impact. J. Geophys. Res. 2003, 108, 4560. [Google Scholar] [CrossRef]
  13. Neumann, B.; Vafeidis, A.T.; Zimmermann, J.; Nicholls, R.J. Future Coastal Population Growth and Exposure to Sea-Level Rise and Coastal Flooding—A Global Assessment. PLoS ONE 2015, 10, e0118571. [Google Scholar] [CrossRef] [Green Version]
  14. NASA Gridded Population of the World (GPW), v4. Available online: https://sedac.ciesin.columbia.edu/data/collection/gpw-v4# (accessed on 8 March 2021).
  15. Rouïl, L.; Ratsivalaka, C.; André, J.; Allemand, N. ECAMED—Conclusions of the Technical Feasibility Study on Implementing an Emissions Control Area (ECA) for Ships in the Mediterranean; INERIS: Verneuil-en-Halatte, France, 2019. [Google Scholar]
  16. Cofala, J.; Amann, M.; Borken-Kleefeld, J.; Gomez Sanabria, A.; Heyes, C.; Kiesewetter, G.; Sander, R.; Schöpp, W.; Holland, M.; Fagerli, H.; et al. The Potential for Cost-Effective Air Emission Reductions from International Shipping through Designation of Further Emission Control Areas in EU Waters with Focus on the Mediterranean Sea; IIASA: Laxenburg, Austria, 2018. [Google Scholar]
  17. Corbett, J.J.; Winebrake, J.J.; Green, E.H.; Kasibhatla, P.; Eyring, V.; Lauer, A. Mortality from Ship Emissions: A Global Assessment. Environ. Sci. Technol. 2007, 41, 8512–8518. [Google Scholar] [CrossRef]
  18. Anenberg, S.; Miller, J.; Henze, D.; Minjares, R. A Global Snapshot of the Air Pollution-Related Health Impacts of Transportation Sector Emissions in 2010 and 2015; International Council on Clean Transportation: Washington, DC, USA, 2019. [Google Scholar]
  19. Caumette, G.; Lienemann, C.-P.; Merdrignac, I.; Bouyssiere, B.; Lobinski, R. Element speciation analysis of petroleum and related materials. J. Anal. At. Spectrom. 2009, 24, 263–276. [Google Scholar] [CrossRef]
  20. Corbin, J.C.; Mensah, A.A.; Pieber, S.M.; Orasche, J.; Michalke, B.; Zanatta, M.; Czech, H.; Massabò, D.; de Mongeot, F.B.; Mennucci, C.; et al. Trace Metals in Soot and PM2.5 from Heavy-Fuel-Oil Combustion in a Marine Engine. Environ. Sci. Technol. 2018, 52, 6714–6722. [Google Scholar] [CrossRef] [Green Version]
  21. Burgess, J.; Foulkes, L.; Jones, P.; Merighi, M.; Murray, S.; Whitacre, J. Law of the Sea; A Policy Primer: Medford, MA, USA, 2017. [Google Scholar]
  22. United Nations United Nations Convention on the Law of the Sea; UNCLOS: Montego Bay, Jamaica, 1982.
  23. International Maritime Organization Emission Control Areas (ECAs). Designated under MARPOL Annex VI. Available online: https://www.imo.org/en/OurWork/Environment/Pages/Emission-Control-Areas-(ECAs)-designated-under-regulation-13-of-MARPOL-Annex-VI-(NOx-emission-control).aspx (accessed on 10 February 2021).
  24. Chang, C.-C.; Wang, C.-M. Evaluating the effects of green port policy: Case study of Kaohsiung harbor in Taiwan. Transp. Res. Part D Transp. Environ. 2012, 17, 185–189. [Google Scholar] [CrossRef]
  25. International Maritime Organization. International Convention for the Prevention of Pollution from Ships (MARPOL). Available online: http://www.imo.org/en/About/Conventions/ListOfConventions/Pages/International-Convention-for-the-Prevention-of-Pollution-from-Ships-(MARPOL).aspx (accessed on 13 September 2018).
  26. Matthias, V.; Bewersdorff, I.; Aulinger, A.; Quante, M. The contribution of ship emissions to air pollution in the North Sea regions. Environ. Pollut. 2010, 158, 2241–2250. [Google Scholar] [CrossRef] [PubMed] [Green Version]
  27. Seyler, A.; Wittrock, F.; Kattner, L.; Mathieu-Üffing, B.; Peters, E.; Richter, A.; Schmolke, S.; Burrows, J.P. Monitoring shipping emissions in the German Bight using MAX-DOAS measurements. Atmos. Chem. Phys. 2017, 17, 10997–11023. [Google Scholar] [CrossRef] [Green Version]
  28. International Maritime Organization. Prevention of Air Pollution from Ships. Available online: https://www.imo.org/en/OurWork/Environment/Pages/Air-Pollution.aspx (accessed on 10 February 2021).
  29. Environ. Cold Ironing Cost Effectiveness Study Volume I—Report; Environ: Los Angeles, CA, USA, 2004. [Google Scholar]
  30. EMSA. Legislative Texts—Directive 2012/33/EU—EMSA—European Maritime Safety Agency; EMSA: Lisbon, Portugal, 2012; p. 13. [Google Scholar]
  31. Doves, S. Alternative Maritime Power in the Port of Rotterdam; Port of Rotterdam Authority: Rotterdam, Netherlands, 2006. [Google Scholar]
  32. CALSTART. Passenger Ferries, Air Quality, and Greenhouse Gases: Can System Expansion Result in Fewer Emissions in the San Francisco Bay Area? CALSTART: Pasadena, CA, USA, 2002. [Google Scholar]
  33. Wilske, Å. Examining the Commercial Viability of Cold Ironing; Port of Göteborg: Göteborg, Sweden, 2009. [Google Scholar]
  34. Khan, M.Y.; Agrawal, H.; Ranganathan, S.; Welch, W.A.; Miller, J.W.; Cocker, D.R. Greenhouse Gas and Criteria Emission Benefits through Reduction of Vessel Speed at Sea; California Air Resources Board: Sacramento, CA, USA, 2012. [Google Scholar]
  35. CARB. Regulatory Advisory: Ships-at-Berth Regulation; California Air Resources Board: Sacramento, CA, USA, 2013. [Google Scholar]
  36. CARB. Almanac Emission Projection Data. Available online: https://www.arb.ca.gov/app/emsinv/2013/emssumcat_query.php?F_DIV=-4&F_DD=Y&F_YR=2012&F_SEASON=A&SP=2013&F_AREA=CO&F_CO=19 (accessed on 29 May 2018).
  37. California Air Resources Board. Oceangoing Ship Onboard Incineration. Available online: https://www.arb.ca.gov/ports/shipincin/shipincin.htm (accessed on 22 August 2018).
  38. Board, C.A.R. Technical Support Document: Initial Statement of Reasons for the Proposed Rulemaking; California Air Resources Board: Sacramento, CA, USA, 2007. [Google Scholar]
  39. Uno, V.; Gordon, M.; Batarse, A.A.; Calloway, P.; Head, J.W.; Katzoff, K.S.; Mcclure, M.; Benjamin, O.R.; Waring, D.; Wong, J.K.; et al. Maritime Air Quality Improvement Plan (MAQIP)—Port of Oakland; Port of Oakland: Oakland, CA, USA, 2009. [Google Scholar]
  40. EMSA. Air Emissions—Air Pollution—Sulphur Directive—EMSA—European Maritime Safety Agency; EMSA: Lisbon, Portugal, 2012. [Google Scholar]
  41. Chen, J.; Wan, Z.; Zhang, H.; Liu, X.; Zhu, Y.; Zheng, A. Governance of Shipping Emission of SOx in China’s Coastal Waters: The SECA Policy, Challenges, and Directions. Coast. Manag. 2018, 46, 191–209. [Google Scholar] [CrossRef]
  42. DieselNet China Designates Emission Control Areas Near Major Ports; ECOpoint Inc.: Mississauga, ON, Canada, 2015.
  43. Khasawneh, R. China’s Stricter Rules on Shipping Emissions a Boon for IMO 2020 Compliance: Woodmac; Reuters: London, UK, 2018. [Google Scholar]
  44. Liu, H.; Jin, X.; Wu, L.; Wang, X.; Fu, M.; Lv, Z.; Morawska, L.; Huang, F.; He, K. The impact of marine shipping and its DECA control on air quality in the Pearl River Delta, China. Sci. Total Environ. 2018, 625, 1476–1485. [Google Scholar] [CrossRef] [PubMed]
  45. Zhang, X.; Zhang, Y.; Liu, Y.; Zhao, J.; Zhou, Y.; Wang, X.; Yang, X.; Zou, Z.; Zhang, C.; Fu, Q.; et al. Changes in the SO2 Level and PM2.5 Components in Shanghai Driven by Implementing the Ship Emission Control Policy. Environ. Sci. Technol. 2019, 53, 11580–11587. [Google Scholar] [CrossRef] [PubMed]
  46. United Nations Conference On Trade And Development (UNCTAD). Reflecting on the Past, Exploring the Future Transport and Trade Facilitation; Series No.11; UNCTAD: Geneva, Switzerland, 2018. [Google Scholar]
  47. Asariotis, R.; Assaf, M.; Benamara, H.; Hoffmann, J.; Premti, A.; Rodríguez, L.; Weller, M.; Youssef, F.; Bradford, G.; Crowe, T.; et al. Review of Maritime Transport 2018; UNCTAD: Geneva, Switzerland, 2018; p. 116. [Google Scholar]
  48. Dinu, O.; Ilie, A.M. Maritime vessel obsolescence, life cycle cost and design service life. In Proceedings of the Modern Technologies in Industrial Engineering (ModTech2015), Mamaia, Romania, 17–20 June 2015; Volume 95, p. 012067. [Google Scholar]
  49. Maluch, H.; Hibner, V. Estimation of Emission from Air and Sea Traffic and Ways for Reduction of Air Pollution; Meteo-tech: Bnei Brak, Israel, 2010. (In Hebrew) [Google Scholar]
  50. Israeli Central Bureau of Statistics (CBS). Local Municipalities in Israel—2018; Publication #1797; CBS: Jerusalem, Israel, 2020. (In Hebrew) [Google Scholar]
  51. Ashdod-Yavneh Region Environmental Union. Ashdod-Yavneh Region Environmental Union. Available online: https://www.env.org.il/he/אודות/רשויות-החברות-באיגוד/ (accessed on 24 July 2021). (In Hebrew).
  52. Haifa Bay Cities Environmental Union. Haifa Bay Cities Environmental Union. Available online: http://www.envihaifa.org.il/רשויות-מקומיות (accessed on 24 July 2021). (In Hebrew).
  53. Svechkina, A.; Portnov, B.A. Spatial identification of environmental health hazards potentially associated with adverse birth outcomes. Environ. Sci. Pollut. Res. 2018, 26, 3578–3592. [Google Scholar] [CrossRef]
  54. Davarashvili, S.; Zusman, M.; Keinan-Boker, L.; Rybnikova, N.; Kaufman, Z.; Silverman, B.G.; Dubnov, J.; Linn, S.; Portnov, B.A. Application of the double kernel density approach to the analysis of cancer incidence in a major metropolitan area. Environ. Res. 2016, 150, 269–281. [Google Scholar] [CrossRef]
  55. Zusman, M.; Dubnov, J.; Barchana, M.; Portnov, B.A. Residential proximity to petroleum storage tanks and associated cancer risks: Double Kernel Density approach vs. zonal estimates. Sci. Total Environ. 2012, 441, 265–276. [Google Scholar] [CrossRef]
  56. Negev, M. Air Pollution Policy in Israel. Atmosphere 2020, 11, 1065. [Google Scholar] [CrossRef]
  57. Israeli Ministry of Environmental Protection. Annual 2019 Pollutant Release and Transfer Register (PRTR) Report; Israeli Ministry of Environmental Protection: Jerusalem, Israel, 2020. (In Hebrew) [Google Scholar]
  58. Becker, N.; Agai-Shai, K.; Erel, Y.; Schaffer, G.; Greenfeld, A. Economic Cost of the Health Burden Caused by Selected Pollutants in the Haifa Bay Area; Tel-Hai College: Tel-Hai, Israel, 2020. [Google Scholar]
  59. International Maritime Organization. Ships Face Lower Sulphur Fuel Requirements in Emission Control Areas from 1 January 2015. Available online: https://www.imo.org/en/MediaCentre/PressBriefings/Pages/44-ECA-sulphur.aspx (accessed on 10 February 2021).
  60. Regional Marine Pollution Emergency Response Centre for the Mediterranean Sea (REMPEC). Med SOx ECA. Available online: https://www.rempec.org/en/our-work/pollution-prevention/hop-topics/med-eca/med-sox-eca-introduction (accessed on 10 February 2021).
  61. Viana, M.; Fann, N.; Tobías, A.; Querol, X.; Rojas-Rueda, D.; Plaza, A.; Aynos, G.; Conde, J.A.; Fernández, L.; Fernández, C. Environmental and Health Benefits from Designating the Marmara Sea and the Turkish Straits as an Emission Control Area (ECA). Environ. Sci. Technol. 2015, 49, 3304–3313. [Google Scholar] [CrossRef]
  62. Ministry Of Transport—Administration of Shipping & Ports. Total Traffic Cargo in Israeli Ports 2018; Israeli Ministry of Transport: Jerusalem, Israel, 2019. [Google Scholar]
  63. Israeli Ministry of Transport Report on Shipment Activity in Israel’s Ports for 2020. Available online: http://asp.mot.gov.il/he/chargers/2245-cargo-2020 (accessed on 10 March 2021).
  64. Israel Port Company (IPC). Israel Port Company (IPC)—Annual Report for Year 2019; IPC: Tel Aviv-Yafo, Israel, 2020. (In Hebrew) [Google Scholar]
  65. Israel Planning Administration (IPA). Israel National Outline Plan 13/b/1/1 for Building Port Hamifrats. Available online: https://mavat.iplan.gov.il/SV4/1/99008403/310 (accessed on 13 March 2021). (In Hebrew)
  66. Israel Planning Administration (IPA). Israel National Outline Plan 13/b/2/1 for Building the Hadarom Container Terminal. Available online: https://mavat.iplan.gov.il/SV4/1/99006968/310 (accessed on 13 March 2021). (In Hebrew)
  67. MarineTraffic.com MarineTraffic: Global Ship Tracking Intelligence|AIS Marine Traffic. Available online: https://www.marinetraffic.com/en/ais/home/centerx:34.5/centery:32.4/zoom:8 (accessed on 8 March 2021).
  68. OpenStreetMap OpenStreetMap. Available online: https://www.openstreetmap.org/copyright (accessed on 24 July 2021).
  69. Israel Ports Company. HaMifratz Port Environmental Impact Assessments; Israel Ports Company: Haifa, Israel, 2018. (In Hebrew) [Google Scholar]
  70. Whall, C.; Stavrakaki, A.; Ritchie, A.; Green, C.; Shialis, T.; Minchin, W.; Cohen, A.; Stokes, R. Ship Emissions Inventory—Mediterranean Sea, Final Report for Concawe; Entec UK Limited: London, UK, 2007. [Google Scholar]
  71. US EPA. Compilation of Air Pollutant Emission Factors: Volume II: Mobile Sources—Vessels AP-42, 4th ed.; US EPA, Ed.; US EPA: Washington, DC, USA, 1985. [Google Scholar]
  72. US EPA. Compilation of Air Pollutant Emission Factors: Mobile Sources—Vessels AP-42, 5th ed.; EPA, Ed.; US EPA: Washington, DC, USA, 2011. [Google Scholar]
  73. The Israeli Ministry of Environmental Protection. The Israeli Air Quality Monitoring Portal. Available online: https://www.svivaaqm.net/ (accessed on 3 November 2021). (In Hebrew).
  74. Israeli Ministry of Environmental Protection. Air Quality in Israel Report—2018–2019; Israeli Ministry of Environmental Protection: Jerusalem, Israel, 2020. (In Hebrew) [Google Scholar]
  75. US EPA, OARO. International Standards to Reduce Emissions from Marine Diesel Engines and Their Fuels. Available online: https://www.epa.gov/regulations-emissions-vehicles-and-engines/international-standards-reduce-emissions-marine-diesel (accessed on 13 September 2018).
  76. Beker, N.; Grossman, M.; Barak, Y.; Charuvi, N. Green Book: Estimating and Measuring External Costs of Air Pollution and Greenhouse Gas Emissions; Ministry of Environmental Protection: Jerusalem, Israel, 2020. [Google Scholar]
  77. European Central Bank Israeli Shekel (ILS) to Euro Exchange Reference Rate 2020. Available online: https://www.ecb.europa.eu/stats/policy_and_exchange_rates/euro_reference_exchange_rates/html/eurofxref-graph-ils.en.html (accessed on 3 August 2021).
  78. Sherlock, R.H.; Lesher, E.J. Role of Chimney Design in dispersion of Waste Gases. J. Air Waste Manage. Assoc. 1954, 4, 13–23. [Google Scholar] [CrossRef]
  79. Nelson, F.; Shenfeld, L. Economics, Engineering and Air Pollution in the Design of Large Chimneys. J. Air Waste Manage. Assoc. 1965, 15, 355–361. [Google Scholar] [CrossRef]
  80. The Israeli Ministry of Transport—Administration of Shipping & Ports. Containers in Israeli Ports for 2018; Israeli Ministry of Transport: Jerusalem, Israel, 2019. [Google Scholar]
  81. Progiou, A.G.; Bakeas, E.; Evangelidou, E.; Kontogiorgi, C.; Lagkadinou, E.; Sebos, I. Air pollutant emissions from Piraeus port: External costs and air quality levels. Transp. Res. Part D Transp. Environ. 2021, 91, 102586. [Google Scholar] [CrossRef]
  82. Tzannatos, E. Ship emissions and their externalities for the port of Piraeus—Greece. Atmos. Environ. 2010, 44, 400–407. [Google Scholar] [CrossRef]
  83. Israel Shipping and Ports Authority. Shipping and Sea Ports—2018 Statistical Report; Israel Shipping and Ports Authority: Haifa, Israel, 2019. (In Hebrew) [Google Scholar]
  84. Kotchenruther, R.A. The effects of marine vessel fuel sulfur regulations on ambient PM2.5 along the west coast of the U.S. Atmos. Environ. 2015, 103, 121–128. [Google Scholar] [CrossRef]
  85. Kotchenruther, R.A. The effects of marine vessel fuel sulfur regulations on ambient PM2.5 at coastal and near coastal monitoring sites in the U.S. Atmos. Environ. 2017, 151, 52–61. [Google Scholar] [CrossRef]
  86. Moreno, T.; Querol, X.; Alastuey, A.; de la Rosa, J.; Sánchez de la Campa, A.M.; Minguillón, M.C.; Pandolfi, M.; González-Castanedo, Y.; Monfort, E.; Gibbons, W. Variations in vanadium, nickel and lanthanoid element concentrations in urban air. Sci. Total Environ. 2010, 408, 4569–4579. [Google Scholar] [CrossRef] [PubMed]
  87. UK Department for Environment, Food & Rural Affairs. UK Report on Measures for 2014 Exceedance of the Target Value for Nickel; UK Department for Environment: London, UK, 2016. [Google Scholar]
  88. Israeli Ministry of Environmental Protection. Pollutant Release and Transfer Register (PRTR) Report—2018; Israeli Ministry of Environmental Protection: Jerusalem, Israel, 2019. (In Hebrew) [Google Scholar]
  89. Nesher Israel Cement Enterprises. Nesher Israel Cement Enterprises—2016 Corporate Social Responsibility (CSR) Report; Nesher Israel Cement Enterprises: Ramla, Israel, 2017. (In Hebrew) [Google Scholar]
  90. Israeli Ministry of Environmental Protection Industrial Pollution Reduction by Technological Means. Available online: https://www.gov.il/he/departments/general/using_technological_means_to_reduce_pollution (accessed on 19 November 2021). (In Hebrew)
  91. Israeli Ministry of Agriculture AgriMeteo—PllutantRose. Available online: https://www.meteo.co.il/Report/PollutantRose (accessed on 3 November 2021).
  92. European Parliament and European Council. Directive 2004/107/EC of the European Parliament and of the Council of 15 December 2004 Relating to Arsenic, Cadmium, Mercury, Nickel and Polycyclic Aromatic Hydrocarbons in Ambient Air—EUR-Lex—32004L0107—EN—EUR-Lex; European Parliament and European Council: Brussels, Belgium, 2015. [Google Scholar]
  93. The Israeli Ministry of Environmental Protection. A Draft for the Updated Air Pollutants Environmental Values, Accourding to the new WHO Guidelines 2021; The Israeli Ministry of Environmental Protection: Jerusalem, Israel, 2021. (In Hebrew) [Google Scholar]
  94. World Health Organization (WHO). WHO Global Air Quality Guidelines—Particulate Matter (PM2.5 and PM10), Ozone, Nitrogen Dioxide, Sulfur Dioxide and Carbon Monoxide; World Health Organization (WHO): Geneva, Switzerland, 2021. [Google Scholar]
  95. International Marine Organization (IMO). Nitrogen Oxides (NOx)—Regulation 13; International Maritime Organization (IMO): London, UK, 2010. [Google Scholar]
  96. Paltiel, A.; Sepulchre, M.; Kornilenko, I.; Maldonado, M. Long-Range Population Projections for Israel: 2009–2059; Israeli Central Bureau of Statistics (CBS): Jerusalem, Israel, 2012. (In Hebrew) [Google Scholar]
  97. Data Commons Israel—Place Explorer—Data Commons. Available online: https://datacommons.org/place/country/ISR?utm_medium=explore&mprop=count&popt=Person&hl=en (accessed on 15 June 2021).
  98. Wang, H.; Mao, X.; Rutherford, D. Costs and Benefits of Shore Power at the Port of Shenzhen; ICCT: Washington, DC, USA, 2015. [Google Scholar]
  99. Winnes, H.; Fridell, E.; Yaramenka, K.; Nelissen, D.; Faber, J.; Ahdour, S. NOx Controls for Shipping in EU Seas; IVL Swedish Environmental Research Institute: Stockholm, Sweden, 2016. [Google Scholar]
  100. Lindstad, H.E.; Eskeland, G.S. Environmental regulations in shipping: Policies leaning towards globalization of scrubbers deserve scrutiny. Transp. Res. Part D Transp. Environ. 2016, 47, 67–76. [Google Scholar] [CrossRef] [Green Version]
  101. International Maritime Organization. Studies on the Feasibility and Use of LNG as a Fuel for Shipping; International Maritime Organization: London, UK, 2016. [Google Scholar]
  102. Merk, O.; Dang, T. Efficiency of World Ports in Container and Bulk Cargo (Oil, Coal, Ores and Grain); OECD: Paris, France, 2012. [Google Scholar]
  103. EPA, I.I. Costs of Emission Reduction Technologies for Category 3 Marine Engines; US EPA: Washington, DC, USA, 2009. [Google Scholar]
  104. Yaramenka, K.; Winnes, H.; Åström, S.; Fridell, E. Cost-Benefit Analysis of NOx Control for Ships in the Baltic Sea and the North Sea; IVL Swedish Environmental Research Institute: Stockholm, Sweden, 2017. [Google Scholar]
  105. World Bank Group. GDP (current US$)—Israel|Data. Available online: https://data.worldbank.org/indicator/NY.GDP.MKTP.CD?locations=IL (accessed on 28 April 2021).
  106. International Monetary Fund (IMF). World Economic Outlook, October 2021; International Monetary Fund (IMF): Washington, DC, USA, 2021. [Google Scholar]
  107. Global-rates.com Inflation 2021, International Inflation Figures from 2021. Available online: https://www.global-rates.com/en/economic-indicators/inflation/2021.aspx (accessed on 19 November 2021).
  108. Israel Ports Company The Israeli Marine Ports Sector. Available online: https://israports.co.il/he/PortIsrael/Pages/default.aspx (accessed on 19 November 2021). (In Hebrew).
  109. Yang, J.; Johnson, K.C.; Miller, J.W.; Durbin, D.T.; Jiang, Y.; Karavalakis, G.; Cocker, D.R.I. Marine Scrubber Efficiency and NOx Emission from Large Ocean Going Vessels. In Proceedings of the 2017 International Emissions Inventory Conference, Baltimore, MD, USA, 14–18 August 2017; p. 29. [Google Scholar]
  110. Trozzi, C. Update of Emission Estimate Methodology for Maritime Navigation—Techne Consulting Report ETC.EF.10 DD; Techne Consulting: Rome, Italy, 2010. [Google Scholar]
  111. Barak, Y.; Razi-Yanuv, E.; Madar, D.; Na’im, O. Feasibility Study for Reducing Marine Vessels’ Air Pollution at Haifa and Ashdod Ports; AVIV AMCG Ltd.: Rosh Haayin, Israel, 2019. [Google Scholar]
  112. European Environment Agency (EEA). Air Pollution in Europe 1990–2004—European Environment Agency; European Environment Agency (EEA): Copenhagen, Denmark, 2007. [Google Scholar]
  113. Zha, H.; Wang, R.; Feng, X.; An, C.; Qian, J. Spatial characteristics of the PM 2.5/PM 10 ratio and its indicative significance regarding air pollution in Hebei Province, China. Environ. Monit. Assess. 2021, 193, 486. [Google Scholar] [CrossRef]
  114. Haifa Bay Cities Environmental Union. 2018 Annual Report; Haifa Bay Cities Environmental Union: Haifa, Israel, 2019. (In Hebrew) [Google Scholar]
  115. Israeli Ministry of Environmental Protection. Rotenberg Coal Power Plant PRTR 2012. Available online: https://www.gov.il/apps/sviva/airq/atar_svivati_emission_details?layer=divuchim2012&atarsvivati=52258 (accessed on 3 August 2021). (In Hebrew)
  116. Israeli Ministry of Environmental Protection. Rotenberg Coal Power Plant PRTR 2013. Available online: https://www.gov.il/apps/sviva/airq/atar_svivati_emission_details?layer=divuchim2013&atarsvivati=52258 (accessed on 3 August 2021). (In Hebrew)
  117. Israeli Ministry of Environmental Protection. Rotenberg Coal Power Plant PRTR 2014. Available online: https://www.gov.il/apps/sviva/airq/atar_svivati_emission_details?layer=divuchim2014&atarsvivati=52258 (accessed on 3 August 2021). (In Hebrew)
  118. Israeli Ministry of Environmental Protection. Rotenberg Coal Power Plant PRTR 2015. Available online: https://www.gov.il/apps/sviva/airq/atar_svivati_emission_details?layer=divuchim2015&atarsvivati=52258 (accessed on 3 August 2021). (In Hebrew)
  119. US EPA, OAR, OTAQ. Northwest Ports Achievements in Reducing Emissions and Improving Performance; US EPA, OAR, OTAQ: Washington, DC, USA, 2017. [Google Scholar]
  120. US EPA, OAR, OTAQ. Shore Power Technology Assessment at U.S. Ports; US EPA, OAR, OTAQ: Washington, DC, USA, 2017. [Google Scholar]
  121. The American Association of Port Authorities. World Port Rankings—Top 100 Ports in the World in 2015; The American Association of Port Authorities: Washington, DC, USA, 2015. [Google Scholar]
  122. Port of Portland Port of Portland Air Quality Improvement and Emission Reduction Strategies. Available online: https://www.oregonlegislature.gov/dembrow/workgroupitems/7-19PortofPortlandEmissionReductions.pdf (accessed on 19 November 2021).
  123. US EPA, OAR, OTAQ. EPA and Port Everglades Partnership: Emission Inventories and Reduction Strategies; US EPA, OAR, OTAQ: Washington, DC, USA, 2018. [Google Scholar]
  124. Shell Global IMO 2020: What’s Next?—Shell Global. Available online: https://propertibazar.com/article/imo-2020-whats-next-shell-global_5a5533c2d64ab2962ffa6b4b.html (accessed on 16 September 2018).
  125. DNV GL. Alternative Fuels Insight—LNG. Available online: https://afi.dnvgl.com/Statistics?repId=1 (accessed on 6 January 2019).
  126. Ship and Bunker. CMA CGM’s New 22,000 TEU Mega-Box Ships to Use LNG Bunkers; Ship and Bunker: Vancouver, BC, Canada, 2017. [Google Scholar]
  127. Sea LNG. Bunkering Infrastructure—Sea LNG. Available online: https://sea-lng.org/lng-as-a-marine-fuel/bunkering-infrastructure/ (accessed on 6 January 2019).
  128. LNG Bunkering World Map|WPCI—LNG Bunkering. Available online: http://lngbunkering.org/lng/map/node (accessed on 6 January 2019).
  129. EPCM Holdings LNG as Marine Bunkering Fuel—EPCM Holdings. Available online: https://www.epcmholdings.com/lng-as-marine-bunkering-fuel/#Infrastructure_required (accessed on 6 January 2019).
  130. Carr, E.W.; Corbett, J.J. Ship Compliance in Emission Control Areas: Technology Costs and Policy Instruments. Environ. Sci. Technol. 2015, 49, 9584–9591. [Google Scholar] [CrossRef]
  131. Shell Pearl GTL—Overview|Shell Global. Available online: https://www.shell.com/about-us/major-projects/pearl-gtl/pearl-gtl-an-overview.html (accessed on 25 June 2018).
  132. Ou, X.; Zhang, X.X.; Zhang, X.X.; Zhang, Q. Life Cycle GHG of NG-Based Fuel and Electric Vehicle in China. Energies 2013, 6, 2644–2662. [Google Scholar] [CrossRef] [Green Version]
  133. Jaramillo, P.; Griffin, W.M.; Matthews, H.S. Comparative Analysis of the Production Costs and Life-Cycle GHG Emissions of FT Liquid Fuels from Coal and Natural Gas. Environ. Sci. Technol. 2008, 42, 7559–7565. [Google Scholar] [CrossRef] [PubMed] [Green Version]
  134. Van Vliet, O.P.R. Feasibility of Alternatives to Driving on Diesel and Petrol; Utrecht University: Utrecht, Netherlands, 2010. [Google Scholar]
  135. Endres, S.; Maes, F.; Hopkins, F.; Houghton, K.; Mårtensson, E.M.; Oeffner, J.; Quack, B.; Singh, P.; Turner, D. A New Perspective at the Ship-Air-Sea-Interface: The Environmental Impacts of Exhaust Gas Scrubber Discharge. Front. Mar. Sci. 2018, 5, 139. [Google Scholar] [CrossRef] [Green Version]
  136. Grimmer, R.J. IMO 2020: A Sea Change is Coming; Stillwater Associates LLC: Irvine, CA, USA, 2018; p. 38. [Google Scholar]
  137. Abadie, L.M.; Goicoechea, N.; Galarraga, I. Adapting the shipping sector to stricter emissions regulations: Fuel switching or installing a scrubber? Transp. Res. Part D Transp. Environ. 2017, 57, 237–250. [Google Scholar] [CrossRef]
  138. World Maritime News. Wärtsilä Cashes in on 2020 Sulphur Cap Countdown; Navingo BV: Schiedam, The Netherlands, 2018. [Google Scholar]
  139. Sahu, S. Compliance to the IMO 2020 Rule to Be “Quite High” Post-2020 Despite Concerns: MECL MD|S& P Global Platts. Available online: https://www.spglobal.com/platts/en/market-insights/latest-news/shipping/041018-compliance-to-the-imo-2020-rule-to-be-quite-high-post-2020-despite-concerns-mecl-md (accessed on 16 September 2018).
  140. Alfa Laval. Reducing NOx Emissions from Ship Exhaust; Alfa Laval: Lund, Sweden, 2020. [Google Scholar]
  141. International Agency for Research on Cancer. Annex: Emission standards for light- and heavy-duty vehicles. In Diesel and Gasoline Engine Exhausts and Some Nitroarenes; International Agency for Research on Cancer: Lyon, France, 2014; p. 702. ISBN 9789283213284. [Google Scholar]
  142. Ayalon, O.; Lev-On, M.; Madar, D.; Lev-On, P.; Shapira, N. A Comparative Study of the Carbon Capture Alternatives in the Production of Natural Gas-based Transportation Fuels; Samuel Neaman Institute: Haifa, Israel, 2018. [Google Scholar]
Figure 1. Global annual anthropogenic air pollution emissions by sector for 2017. (A) SOx emissions (in million-ton SO2/year). (B) NOx emissions (in million-ton NO2/year) [9].
Atmosphere 13 00241 g001
Figure 2. Differentiation between three marine navigation phases: cruising, stand-by and maneuvering, and hoteling. (A) Haifa port. (B) Ashdod port. Round icons represent stationary ships, arrow shaped icons represent sailing ships. Navigation phases: Stationary ships inside the port are hoteling ships; stationary ships outside of the port are stand-by ships; sailing ships between stand-by and the port are maneuvering ships (0.5–5 km from port); and sailing ships arriving to the stand-by position or leaving the port within 1–10 km from the port, are cruising ships. Port coordinates are in the top right of every panel. Data are from 24 July 2021, represents normal ports activity and is presented with permission from MarineTraffic [67]. The maps are by [68].
Atmosphere 13 00241 g002
Figure 3. Calculated 2018 emissions from the Haifa and Ashdod ports, compared to other emission sources. The horizontal axis shows different air emissions: NOx, VOCs, SOx, PM2.5 and CO; and their sources. Calculation uncertainties are provided in Appendix B. Dark blue stripes: Haifa port, red- Haifa Bay industrial zone, dark green: Haifa metropolitan land transportation, grey: a typical 1000 MW coal power plant, light blue stripes: Ashdod port, orange- North Ashdod industrial zone, light green- Ashdod land transportation. (A) Absolute emission values. Y axis is air pollutant emission in thousands ton/year. (B) Normalized emissions to the Haifa port emissions. Y axis is air pollutant emission normalized to that of the Haifa port.
Atmosphere 13 00241 g003
Figure 4. Average 2018 nickel concentration as a fraction of TSP (total suspended particulate) in Israeli air quality monitoring stations. The Y axis is an average concentration of nickel as a fraction of TSP in µg/m3 of air. Red: monitoring stations with an average nickel concentration over 0.005 µg/m3; blue: monitoring stations with an average nickel concentration under 0.005 µg/m3. Error bars represent standard deviations.
Atmosphere 13 00241 g004
Figure 5. Share of different marine activities in NOx emissions.
Atmosphere 13 00241 g005
Figure 6. Distribution of ships, by year of manufacture, visiting the Haifa and Ashdod ports.
Atmosphere 13 00241 g006
Figure 7. Combined relative emission levels for Haifa and Ashdod for the year 2018, BAU 2030 and MPS 2030 scenarios. Y axis is the emission level of the pollutants, relative to 2018 levels. Shown are emissions for NOx, PM2.5, VOC, CO and SO2. Blue: the baseline level of annual 2018 calculated emissions; red: the level of yearly emissions in BAU (business as usual) for the year 2030 scenario; green: the level of yearly emissions in MPS (Mitigation Plan Scenario) for the year 2030. See absolute numbers in Appendix D.
Atmosphere 13 00241 g007
Figure 8. Combined Haifa and Ashdod ports’ air pollution annual damage cost from ships in different scenarios. Scenarios: year 2018 Haifa and Ashdod ports air pollution cost, cost in a business as usual (BAU) scenario for 2030, and cost in the Mitigation Plan Scenario (MPS) scenario for 2030. Y axis values are millions of ILS/year. See Appendix F.
Atmosphere 13 00241 g008
Table 1. Marine air pollution mitigation techniques and their feasibility in Israel.
Technique NameCompared to Tier I, Emission Mitigation by:CostMaturityInstallation TimePrevalenceCost-EfficiencyFeasibility in Israel
SOxPMNOx
Engine retrofitting from Tier I to
Tier III/IV
Tier III 70%
Tier IV 90%
++++++++++++
Selective catalytic reduction (SCR) 70–98%+++++++++++++++++++++
Exhaust gas recirculation (EGR) 70%+++++++++++++++++++++++
Exhaust gas cleaning systems (EGCS) (“scrubbers”)90–99%0–20% +++++++++++++++++++++
Low or ultra-low sulfur diesel (ULSD)70–90%25–60% +++++++++++++++++++++++
Electric shore power (ESP)100% during hoteling
50–70% over the 3 phases of navigation
+++++++++++++++++
Liquid natural gas (LNG)/dual fuel99%94%90%++++++++++
Distancing stand-by location70–90% of emissions during stand-by phase. 15%–25% over all phases of navigation++++++++++++++++++++++++++
Legend: + bad … +++++ very good. Based on the present study, Appendix G and [29,33,38,98,99,100,101,102,103,104].
Publisher’s Note: MDPI stays neutral with regard to jurisdictional claims in published maps and institutional affiliations.

