Abstract
Wind power is known as a major renewable and eco-friendly power generation source. As a clean and cost-effective energy source, wind power utilization has grown rapidly worldwide. A roof-mounted wind turbine is a wind power system that lowers energy transmission costs and benefits from wind power potential in urban areas. However, predicting wind power potential is a complex problem because of unpredictable wind patterns, particularly in urban areas. In this study, by using computational fluid dynamics (CFD) and the concept of nondimensionality, with the help of machine learning techniques, we demonstrate a new method for predicting the wind power potential of a cluster of roof-mounted wind turbines over an actual urban area in Montreal, Canada. CFD simulations are achieved using city fast fluid dynamics (CityFFD), developed for urban microclimate simulations. The random forest model trains data generated by CityFFD for wind prediction. The accuracy of CityFFD is investigated by modeling an actual urban area and comparing the numerical data with measured data from a local weather station. The proposed technique is demonstrated by estimating the wind power potential in the downtown area with more than 250 buildings for a long-term period (2020–2049).
1. Introduction
Pollutants, environmental problems, fossil fuel reserves reduction, and rising energy production costs have led the world to turn to clean and renewable energy resources. As one of the renewable energies with a long history, wind power has significantly grown worldwide in the past decade. Despite the high installation cost of the wind power systems, its low operational cost and eco-friendly nature have contributed to this fast growth [1]. For instance, wind power in North America was around 5 GW in 2002 but increased to 136 GW in 2020 [2,3]. Thus, in order to capture renewable wind power to the greatest extent, besides the classic wind turbines inside the wind farm [4,5,6], various other types of wind turbines have been developed for urban applications, such as building-mounted wind turbines [7], ducted wind turbines [4], and roof-mounted wind turbines [8,9]. Small wind turbines, as microgeneration technology, have been receiving more interest during the last decade, especially in urban areas. A roof-mounted wind turbine is a small wind turbine that can be installed on the roof of buildings in urban areas [8,9]. Wind farms are primarily located outside the cities, so using roof-mounted wind turbines can significantly reduce energy transmission and distribution costs [10]. Considering building configurations, such as roof shapes, neighborhood effects, and urban morphologies, the rooftop wind turbine potential could be enhanced up to 3–8 times in an urban area compared to a rural area [8,11]. The enhancement is primarily due to the clustered effects of buildings and higher urban buildings than the rural areas under given conditions. Thus, roof-mounted wind turbines in urban areas can play an essential role in contributing to sustainable and eco-friendly cities.
Roof-mounted wind turbine performance is directly determined by its surrounding wind speed [12], which is influenced by many environmental and terrain factors [13,14,15]. These factors could lead to highly unsteady and turbulent wind and change the local wind condition from one site to another. Therefore, it remains a challenge to find their mounting locations and estimate the wind power potentials in the urban context. A conventional way to find an appropriate mounting location for installing wind turbines is using wind maps or wind atlases. Wind maps can provide wind speed data at a specified height. These maps are generated using the last decade of simulated data by mesoscale models [16,17]. Prediction of wind speed and direction in wind maps are based on the impact of terrains. Thus, they are valuable sources for utilizing wind power potential, especially for wind farms [10,18]. However, wind farms are mostly located outside of urban areas where wind speed is mostly affected by terrain, and the typical mesoscale spatial resolution for generating a wind map is 2.5 km to 3 km [10]. It is challenging to predict the local microscale variations of wind flows at this resolution. Moreover, these wind maps cannot provide high resolution and reliable information in complex terrains or urban regions [17]. Therefore, to capture accurate local urban wind conditions, a high-resolution wind map is needed to capture terrain forcing and surrounding building effects and analyze the rooftop wind power potential instead of low-resolution wind maps.
There are two common ways to capture accurate wind speed data for the roof of each building in an urban area to estimate rooftop-mounted wind power potential. The first one uses measured data obtained by local weather stations on the building roofs. Another approach is based on numerical simulations to provide detailed information, once the simulations are validated, within a selected urban area for estimating the potential of rooftop wind turbine power. The latter is more often applied because of its low costs, especially for a large region [19].
Computational fluid dynamics (CFD) is the most common method of wind aerodynamics simulation around buildings [11,14,19,20,21,22]. Additionally, providing comprehensive information about the rooftop wind power potential needs to consider the impact of urban morphology and the neighborhood on each building during a long simulation period, such as monthly or even yearly. Unfortunately, current CFD tools are not suitable for modeling these problems, given the limited computing resources [20,23,24].
The main purpose of this research is to propose a novel idea to calculate roof-mounted wind turbine potential in an actual urban area by using a fast and accurate CFD model and a machine learning approach. We recently developed CityFFD (city fast fluid dynamics), an in-house code written by the C++ CUDA language, to model urban microclimate [23,25,26]. CityFFD [27] is based on fast fluid dynamics (FFD) and high-order backward and forward interpolation schemes [28] for large-scale problems. Using CityFFD and the concept of dimensionless simulation, we provide local wind information in an actual urban area. Then, based on machine learning and numerical data, we estimate rooftop wind power potential. In the current work, we model a region in the downtown area of Montreal with more than 250 buildings. In the following sections, the methodology is discussed first, followed by the validation study of CityFFD and the machine learning model. Then, the wind potential of cluster roof-mounted wind turbines is predicted over the future 30 years (2020–2049). Finally, the proposed approach can be applied to other urban areas, and the data obtained are beneficial for building owners, city planners, and policymakers.
2. Methodology
This section includes three subsections: CityFFD introduction, dimensionless simulation, and machine learning approach.
2.1. CityFFD
In this work, we have three main steps to calculate wind power. The first step is using computational fluid dynamics to calculate local wind speed at the roof of buildings in an actual urban area by CityFFD, which solves the following conservation equations for the mass and momentum:
Here, first, Equations (3) and (4) are solved, and an intermediate velocity is estimated. Then, solving the Poisson equation (Equation (6)) updates the pressure domain using the intermediate velocity.
In the end, velocity is updated by using the new pressure in the domain and Equation (5). The most complex term in Equation (2) is the advection term (Equation (3)). This term is nonlinear and can cause numerical constraint and stability problems [28]. Thus, CityFFD converts Equation (3) from its Eulerian coordinate to the Lagrangian perspective and overcomes stability issues, especially for large time steps. The advection equation in the Lagrangian form is as follows:
where is the characteristic curve of the flow particles inside the computational domain. Details of this method are revealed in our previous works [28].
One of the main features of CityFFD is a high-order interpolation scheme for solving advection terms. This model can significantly reduce dissipation and dispersion errors and provide accurate results on a coarse grid. We refer our readers to our previous work [28]. Another feature of CityFFD is using the GPU CUDA language, which enables excessive computing speedups and running large cases on personal computers [23,25]. The next feature is the large eddy simulation (LES) to model the urban microclimate turbulence behavior. This model has been comprehensively validated against different CFD benchmarks and represents acceptable accuracy [23].
2.2. Dimensionless Simulation
According to the Reynolds independence theory, the flow pattern is independent of the Reynolds number when the Reynolds number is greater than the critical value [29,30]. Critical Reynolds number () is case-dependent and can vary based on the wind direction and building configuration [31]. For urban microclimate, can be around 14,000 to 87,000 [30,32]. Reynolds independence theory is instrumental in both experimental and numerical modeling. The study of full-scale building prototypes, either experimentally or numerically, often involves high costs, so using reduced-scale models can be a way to overcome the cost of full-scale studies. Reduced-scale models must meet geometrical, dynamic, and kinematic similarities [33]. For isothermal problems, the dynamic similarity is maintained by the Reynolds number similarity. Reynolds number is defined as , where and are the reference velocity and length, respectively. This relation represents an opposite impact of length and velocity values on the Reynolds number. For example, the typical reduced-scale model for urban microclimate simulation is 1:1000 [33], so if Reynolds similarity is satisfied for the same fluid medium, for the same kinematic viscosity, the velocity for the reduced-scale model must be 1000:1, which is not realistic. In this situation, the Reynolds independence theory ensures the similarity of wind fields at low wind speeds.
On the other hand, the Reynolds independence theory also helps reduce the number of simulations for isothermal problems. When the Reynolds independence is satisfied, the dimensional velocities and the flow patterns for a group of wind speeds with the same direction over an urban region can be similar. Thus, we can predict wind flow fields for different reference velocities by using a reference velocity and one dimensionless simulation for that direction. This research uses this concept to reduce the total number of simulations and lower the computational cost. To use this beneficial situation, we need to solve dimensionless equations.
Please note that the thermal effects in the present simulations are ignored. The neglect of thermal effects follows the previous studies, which estimated the urban wind power potentials during early design stages. Al-Quraan et al. [34] investigated the validity of using isothermal wind tunnel data to estimate urban wind energy potentials in the field. It was found that homogenous upstream terrains showed an accuracy of more than 95%. For non-homogeneous terrain conditions, the difference of the estimated wind energy potentials in the wind tunnel and the calculated field measurements could be up to 20%, which was, however, considered still within the acceptable range as an initial evaluation of wind power potentials during the early design stage. Higgins and Stathopoulos [35] further developed the idea of using isothermal wind measurement data for the estimation of real-world wind power potentials by a novel artificial intelligence system supported by a big isothermal wind dataset. It shows that the proposed system could be used for the early exploration of urban wind speeds and wind power production. Meanwhile, the thermal effects can be taken into account by more studies on nonisothermal cases supported by more in-depth studies on other similitudes for the nonisothermal wind tunnel data and the field measurements, which can be a focus of future study.
CityFFD has been developed based on dimensionless equations [23,25]. In this work, we select an urban region and consider velocity with different directions () around the area (Figure 1). Then, air velocities at different locations on the roofs of selected buildings are extracted, and a database is created as the input for the machine learning analysis later to predict wind speeds at the top of selected buildings.
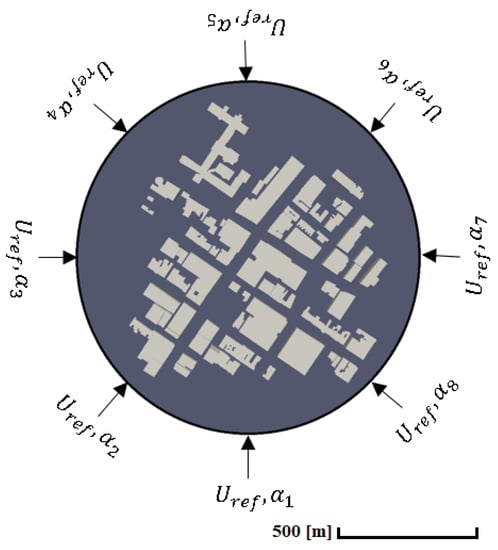
Figure 1.
Setup of CityFFD boundary conditions for different wind directions.
2.3. Processing Future Wind Speed Data Using Machine Learning
This study aims to model and calculate the hourly wind power at the top of multiple urban buildings under two climate change scenarios. Thus, hourly wind speed data under climate change is required. Global and regional climate models (GCMs and RCMs) are two models that mathematically simulate the atmospheric, oceanic, and biotic interactions under various radiative forcing scenarios. The outputs of these models are climate data, including temperature, solar irradiance, and wind speed, which are spatially based on latitude and longitudinal divisions at a temporal resolution of the daily average. Although these models can provide information about climate change, the output data of the models cannot be directly used as inputs for wind turbine models. The data require further processing to address challenges such as bias in modeling and spatial and temporal resolutions. We refer the readers to a previous study [36] explaining the challenges and the methods to address them in detail. A similar method is used in this study and is briefly explained and updated to fit the objective of this study.
2.4. Bias Correction
A Canadian regional climate model (RCM), called CanRCM4, has a horizontal resolution of about 25 km. RCM does not include the effect of local features. This might make the historical data incomparable to observed local station data over the same period, which is known as bias in the climate data. In other words, to be used for any application, the climate model output data need calibration. In this case, quantile–quantile statistical bias correction is conducted to remove the existing bias. In this method, the difference between the corresponding cumulative distribution functions (CDF) for historical model data and the observed data are applied to the CDF of the future model data quantile by quantile [36,37]. The bias corrections are conducted for daily-averaged, and also maximum daily wind speeds. The base calibration period for comparing the historical model data and observed data is selected between 1976 and 2005. The statistical difference is applied to the future model data to remove the bias between 2020 and 2049. The bias-corrected data also need further processing of downscaling to convert to hourly data from daily-averaged values [36].
There are available hourly weather data for Montreal in the Canadian Weather Energy and Engineering Datasets (CWEEDS) dataset for 1953–2014. The dataset provides the opportunity to find, and use, observed hourly data as representative hourly data for the future based on statistical analogy to future bias-corrected daily-averaged climate model data. The K-nearest-neighbour classification algorithm is used to find the most similar class of datasets (neighbors) from the observed dataset. This algorithm is well-suited for non-normal data, such as wind data. The following equation is used for decision-making in finding similar weather data from the past.
where wi is the weather parameter (feature) weighting factor, and is the difference in CDF of the future daily-averaged model data and candidate month daily-averaged observed data for a weather parameter. As two features of the average and maximum wind speeds in a day are selected, each of the two features is given 0.5 weight in decision-making to find the most similar month in the past using the weighted-sum index (WS). The candidate month with the minimum value is selected as the most statistically similar trend. Once the most similar dataset at daily-averaged resolution is found, its calendar month is recorded, and the corresponding hourly dataset is selected as a representative month for the future.
An example of applying the KNN algorithm using the criteria is shown in Figure 2. The goal is to downscale the daily average wind data for September 2023. The cumulative distribution function (CDF) of the future daily-averaged data is blue. In contrast, the CDF of all the candidate observed historical wind speeds are shown with other colors. September 2005 shows the most statistical similarity to September 2023 using the FS index (shown in red). However, considering the similarity for both the average wind speed and the maximum wind speed using the WS index, September 2012 shows the most statistical pattern similarity to September 2023, shown in green for maximum wind speed and purple for average wind speed. It should be noted that September 2012 also shows the most statistical similarity when the sole average wind speed is considered using the FS index. Therefore, the hourly data of September 2012 are used as the representative hourly data for September 2023. All the future months are processed one by one from 2020 to 2049 to convert all the daily-averaged data to hourly data. For more details, the reader is referred to our recent work [36]. Note that the RCM model output data we used were only available in daily-averaged temporal resolution, so the bias correction was performed on daily-averaged resolution. This paper applied the downscaling approach and did not try to develop a new approach, as the focus is the combined ML and dimensionless analysis for the estimations of wind speeds and wind power potential. The proposed approach will be applicable when the hourly data are available.
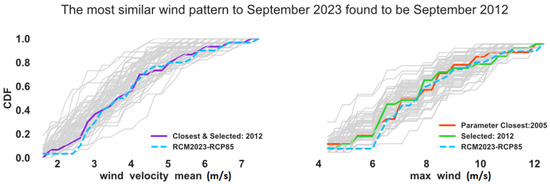
Figure 2.
Downscaling a future month wind data using KNN.
The future data are extracted for the Montreal Trudeau Airport geographical location, and the observed historical wind speed data are taken from weather stations from the same location. However, the airport is relatively far from the urban downtown area, and the wind speeds at multiple locations downtown are desired. Hence, further processing is conducted for this purpose in the following section.
2.5. Predicting Wind Speed at Multiple Locations
The wind speeds are required to predict wind power potential at the top of multiple buildings downtown. However, it will be impractical to run the simulations for every single hourly dataset over a long period (2020–2049). A more efficient approach is to run the simulations for selected wind angles and use the corresponding inputs and outputs as a training dataset to train a surrogate machine learning algorithm. A well-trained model can predict the wind speed at multiple locations, given a boundary condition for all the wind directions.
One of the machine learning algorithms capable of modeling multiple outputs is the random forest regression model, and therefore it is used in this study. Random forest is an ensemble model averaging the results of multiple regression trees that are recursively developed based on finding the values of features that reduce the output variance in subsets of the original dataset by an optimization algorithm. The algorithm is further developed to model multiple targets by introducing covariance weightings to the objective of its optimization algorithm at splitting nodes. Readers are referred to previous studies for more details on regular and multitarget random forest algorithms [36,38,39,40,41].
In this study, the input data in the regression model are the wind speed boundary conditions, e.g., from the airport weather station, whereas the output consists of 25 values representing the wind speed at the top of the 25 downtown buildings. This way, the algorithm learns the relationship between the weather station data as inputs and the 25 values at the top of the buildings. Once the model is trained adequately to acceptable accuracy, new input data are introduced to the model to predict the hourly wind speed at the top of the 25 buildings for the next thirty years; in this case, input data are the hourly climate change data that are downscaled from 2020 to 2049 at the weather station location. The predicted hourly values are then used as inputs into the wind turbine model to predict wind power.
3. Validation
In this section, CityFFD is applied to investigate urban microclimate simulation performance during a summer day (15 July 2013) by comparing its numerical results with the measurement data. Figure 3a shows the aerial image of the case study (downtown Montreal, Canada), and the highlighted point represents the location of the local weather station for the validation study. The building cluster with the size of 1.5 km × 1.5 km is modeled in the whole domain size of 4 km × 4 km. The distance of the cluster to the domain boundary is chosen as ten times the maximum building height [42].
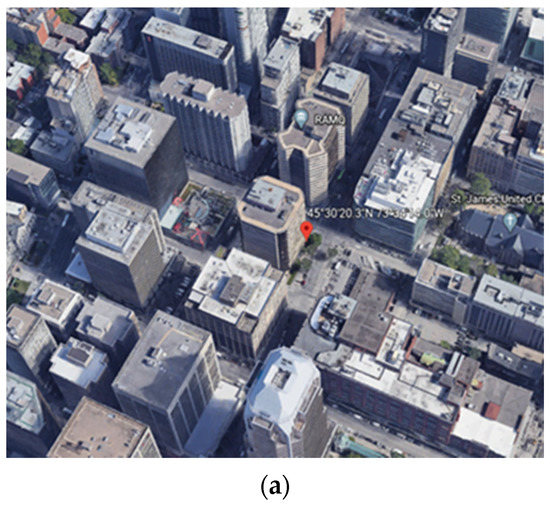
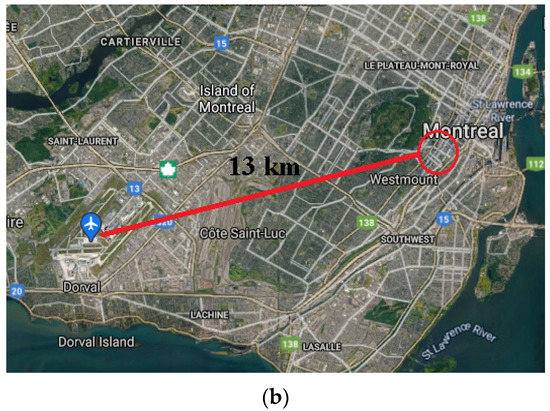
Figure 3.
Urban image of the case study. (a) Case study: downtown Montreal, Canada with the local weather station indicated. (b) Airport position relative to downtown Montreal with the selected downtown region circled.
Light detection and ranging (LiDAR) data collected in 2015 provided by the city of Montreal are used to create the city building geometries. The LiDAR dataset includes the coordination of several points inside a particular region. Here, we developed a numerical model to convert the scanned point cloud to a 3D geometry of the city. In this model, every point will be connected to its neighbors, and by creating several triangles, we can create an STL file and construct the geometry of the buildings. Figure 4 shows the procedure to convert the LiDAR data to the STL file.
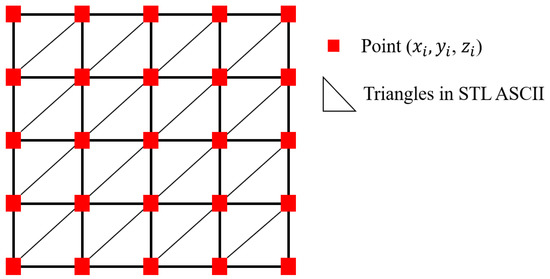
Figure 4.
LiDAR data conversion to STL ASCII format.
Figure 5 shows the inlet/outlet boundary conditions. Each vertical boundary represents an inlet or outlet depending on the incoming wind direction. The CFD inlet boundary conditions are provided by the weather station located at the airport, which is about 13 km away from downtown Montreal (Figure 3b). Based on the wind direction, two vertical boundaries will act as an inlet at any time step, and the other two boundaries will be the outlets. The floor boundary condition was considered a wall, and the top boundary condition was symmetry. The total mesh number is 54 million, and the minimum mesh size near the building is 1 m. The time interval for data outputs is one hour and, consequently, 24 different simulations for a whole day.
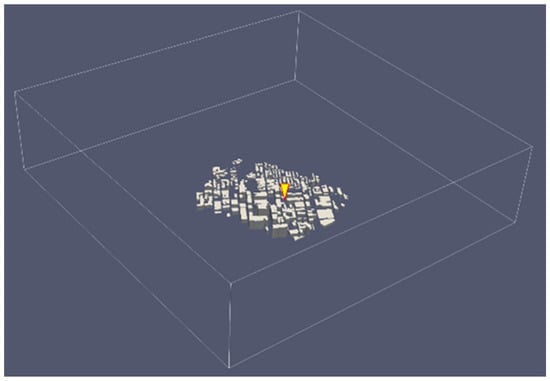
Figure 5.
Schematic of the computational domain and boundary conditions (four vertical boundary openings represent inflows or outflows depending on the incoming wind direction with the location of the weather station indicated by the yellow triangle.
Based on the literature, because of urban morphology, building configuration, and terrain impacts, the microclimate properties recorded at the airport are different from the local microclimate near the downtown. We may estimate the variation of wind speed at Montreal downtown empirically by using the airport weather station data. However, it cannot accurately estimate the wind flow at the street canyon. Using CityFFD, we could accurately estimate the wind conditions in the urban area by using the weather station data about 13 km away from the case study region. The input boundary wind speed distribution is the power-law wind profile based on the wind speed at the airport weather station (10 m height from the ground). The 2013 summertime period is selected in this study: from 00:00 to 23:00 EST 15 July 2013 (Figure 6).
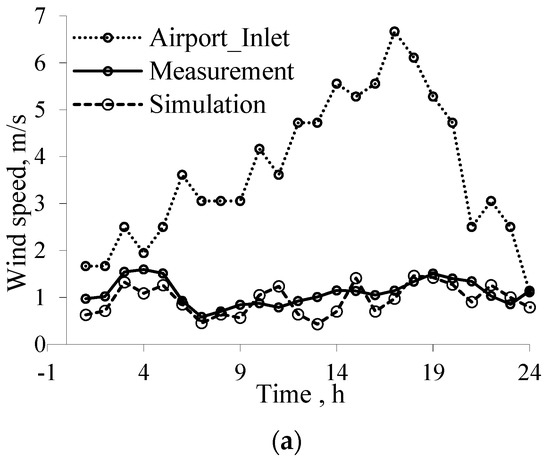
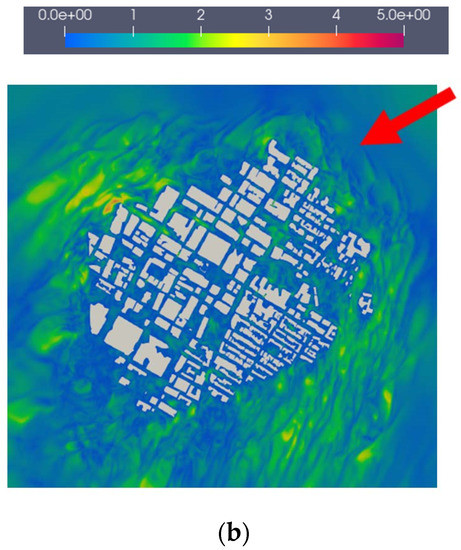
Figure 6.
Numerical results of the case study, downtown Montreal, Canada (15 July 2013). (a) Daily velocity variation at the center of the case study. (b) Velocity distribution (m/s) at the pedestrian level height (2 m), 12:00 p.m. with the arrow showing the incoming wind direction.
The validation results in Figure 6 show that the wind speed is reduced significantly near the urban building cluster. Therefore, CityFFD could accurately estimate the wind magnitude in the urban area. The RMSE for wind velocity is 0.265 m/s, and the mean bias error (MBE) is −0.14 m/s. As mentioned before, CityFFD is equipped with the fourth-order interpolation scheme to reduce numerical dissipation errors and capture wind speed reasonably well near the buildings. The validation results show that CityFFD can predict accurate results for the large-scale simulation with 3D high-resolution results at a low computational cost (6 h computing time with NVIDIA P100 GPU card for each case).
4. Estimation of Wind Speeds by Random Forest
To demonstrate the estimation of wind speeds by the random forest, we calculate wind speeds at the roof of selected buildings (the data was collected at 2 m height from the rooftop) in an urban area. For this purpose, we select another region in downtown Montreal with 255 buildings in a domain size of and the grid number of 13 million with 1 m resolution near the buildings. The simulation takes 4 h for each case with a different wind direction (on NVIDIA GTX 1070 GPU). Note that we use a different region from the validation case because the random forest study was conducted before the validation study, and we only have the measured data for the building cluster in the validation case.
First, we study the impact of angle steps on the accuracy of the training model. Then, we use the trained machine learning model to predict new data (see Figure 7b). Finally, we predict the wind power potential over the urban area for the future. Here, 25 buildings are selected, and the wind speeds at the roof of these buildings are obtained for the study.
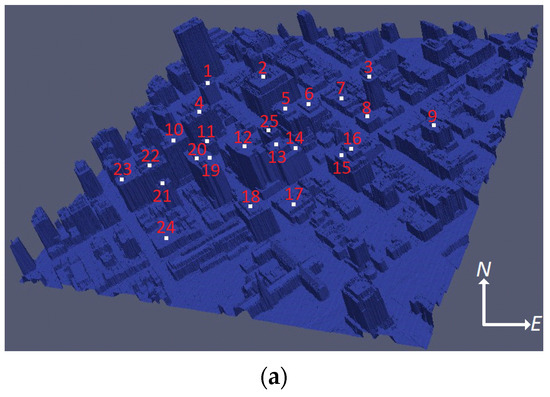
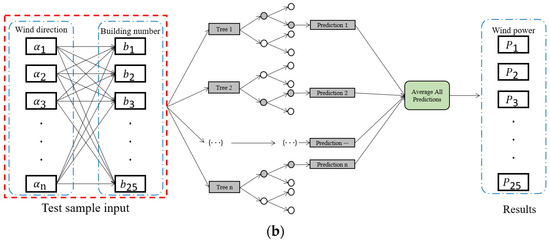
Figure 7.
The 25 selected buildings for wind speed calculation. (a) Selected buildings for wind power potential calculation with their building numbers. (b) Architecture of random forest.
The airflow around the urban area is simulated by four different angle steps (see Figure 1), 2.5°, 5°, 10°, and 20°. A larger angle step can lower computational cost but lower the accuracy of wind prediction, so we need to determine an angle step that can provide enough wind speed predictions in an urban area at a reasonable computational cost. Figure 8 shows the comparison between the predicted values from the machine learning model and the numerical results from CityFFD considering five different incoming wind directions (5°, 10°, 12.5°, 15°, and 20°). It shows that the difference between CityFFD and the machine learning results decreases with a smaller wind angle step. Note that 80% of the data are used for training purposes and 20% for testing.
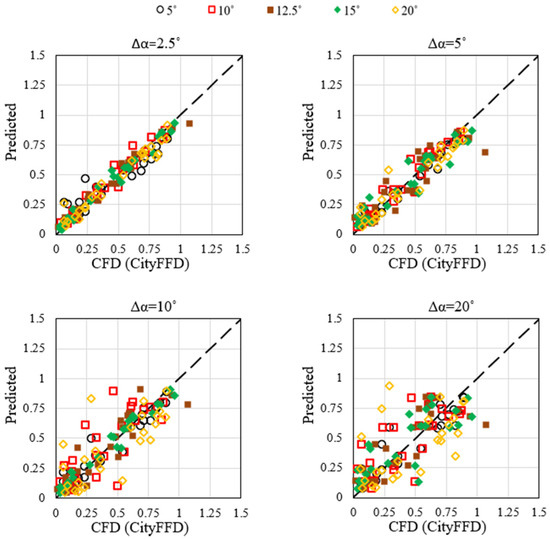
Figure 8.
Wind speed predictions for different angle steps and the accuracy of ML prediction.
Figure 9 shows the RMSE value for different angle steps. The figure shows that for and , the values of RMSE are around 6.4%, 8.7%, 12.5%, and 18%, respectively. However, the computational cost increases notably for small steps. For example, providing the dataset with by CFD simulation is twice the cost of the dataset with . Thus, it is acceptable to have a small increase in value of RMSE (2.3%) while maintaining a low computing cost (24 h) by choosing as our baseline for training the machine learning model.
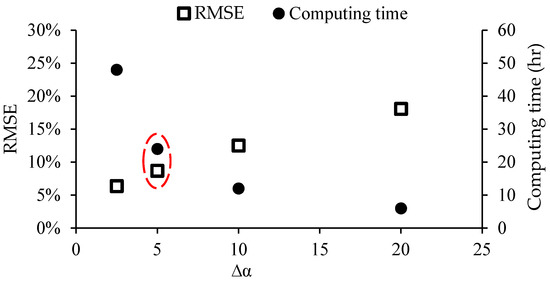
Figure 9.
RMSE values and computing costs for different angle steps.
5. Wind Power Potential Discussion
The wind power potential is calculated by the hourly wind speed captured at the rooftop of each building through the following equation:
where is the wind power potential (W/m2), ρ is the density of the air (kg/m3), and is the wind speed (m/s).
Figure 10 shows the daily wind power potential of the 25 selected buildings for 2020~2049 (which will be a total of 10,950 days). The box chart in Figure 10 represents the minimum, first quartile (25th percentile), median (50th percentile), third quartile (75th percentile), and maximum values. The highest daily wind power potential is located at Building 18, and the lowest is found at Building 17. In general, a similar distribution of daily wind power potential among 25 buildings is found between different angle steps (5 and 10 degrees) and two climate change scenarios of representative concentration pathways (RCP 8.5 W/m2 and 4.5 W/m2), which is obtaining a high wind power potential at Building 18 and Building 16, while obtaining a low wind power potential at Building 6, 11, 13, and 17. Furthermore, considering a long time period of 30 years, a large uncertainty of daily wind power potential could be found in Figure 10. The maximum daily wind power potential of some buildings could be an order of magnitude larger than the average value.
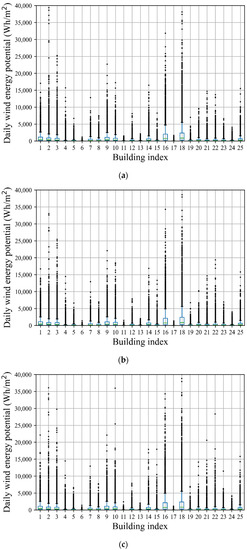
Figure 10.
Daily wind power potential boxplot of 25 buildings under RCP8.5 and RCP4.5 from 2020 to 2049. (a) ∆α = 5° and RCP4.5. (b) ∆α = 10° and RCP4.5. (c) ∆α = 5° and RCP8.5.
Figure 11 reports the building heights for the buildings selected. Building 18 has the highest wind power potential, but it is not the highest (55 m). Building 17 has the lowest potential and low height (20 m). Building 10 is the highest (82 m), but its potential is not significant. When plotting the wind power potential versus building height, Figure 12 shows no strong correlation between the building height and wind power potential. The maximum wind power potentials are found at Building 18, with a height of 55 m, and at Building 16, with a height of 57 m. The wind potential is generally low for low buildings, e.g., Building 7, 8, and 24. Buildings with a reasonable height located at the outskirt of the building cluster, e.g., Building 1, 2, 3, and 9, generally have higher potentials. Tall buildings with many surrounding buildings, e.g., Buildings 10, 12, and 20, do not necessarily show high potential. Therefore, the comparison shows that the impacts of urban configurations and neighborhoods on wind distributions are considerable. Using physics-based simulations or measurement data is necessary to provide accurate wind power potential prediction, as the wind power potential is positively correlated with the local wind speed (refer to Equation (9)).
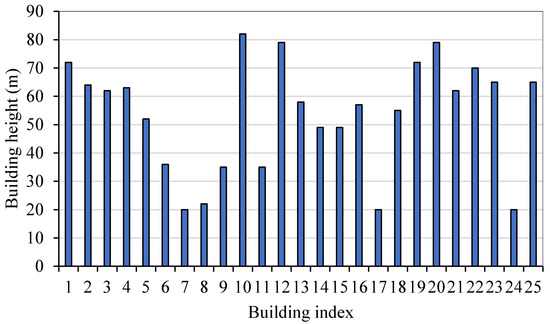
Figure 11.
Heights of the selected buildings.
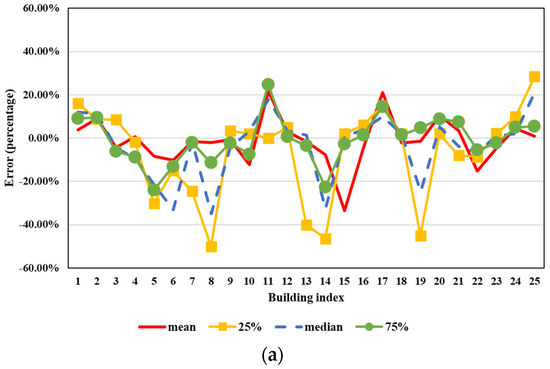
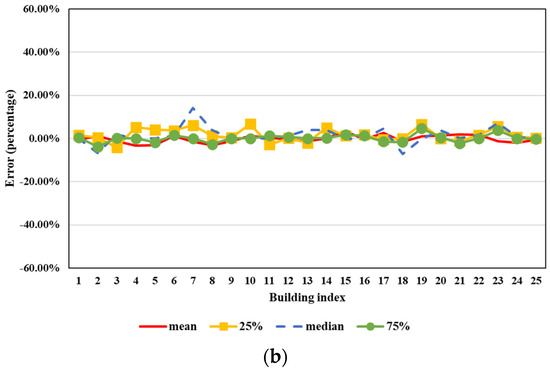
Figure 12.
Relative differences of different wind angle steps and RCP scenarios. (a) Relative difference of wind power potentials between wind angle steps of 5° (baseline) and 10° (RCP4.5). (b) Relative difference of wind power potentials between RCP4.5 (baseline) and RCP8.5 (∆α = 5°).
In summary, when conducting the urban wind power study, it is still of great significance to find an efficient way to predict the wind conditions of each building inside the selected urban area.
Figure 12 plots the wind power potential prediction differences between different wind angle steps (5° and 10°) and two RCP scenarios (RCP 8.5 and 4.5). Four different curves are presented in each figure, representing the mean, first quartile (25% in the figure), median, and third quartile (75% in the figure) wind power potential data for each building. It shows that the difference between the two wind steps could be up to 20% or more for buildings 8, 13, 14, and 19. The average relative difference of the mean value is around 8%, while the difference between the two RCP scenarios is comparably lower (the average difference of the mean value is around 1.5%). Thus, to ensure the reliability and accuracy of the final results, it is essential to test the machine learning method with = 5°. RCP4.5 and RCP8.5 seem to contribute to similar results, showing that the future wind power potential is not very sensitive to the two climate change scenarios.
6. Conclusions
This study introduces a new approach to estimate the wind potential for a long-term period (2020–2049) by integrating a fast and accurate urban scale CFD model (CityFFD) and machine learning (random forest). CityFFD is an in-house CUDA-C++-based urban microclimate model. The accuracy and performance of the model to predict wind distribution in an actual urban area are investigated. The RMSE for wind velocity compared with the weather station data is 0.265 m/s. A novel approach based on different wind directions and dimensionless simulations was applied to an actual urban area to provide a dataset for training a machine learning model. Nondimensionality can reduce the number of simulations and consequently reduce the computational costs for providing independent data for training the model. A sensitivity analysis was applied to represent an optimized angle step for wind direction. In this section, accuracy and computational costs were considered. We found that the training data with a wind step size of 5° can be sufficient for training the model and generating an acceptable accuracy with reasonable computational cost. Then, the proposed method was used to estimate the wind potential at the roof of 25 buildings. The estimated wind potentials for two different climate scenarios, RCP4.5 and RCP8.5, are similar, showing a minor dependence of wind potential on climate change. On the other hand, the results show no clear correlation between the building heights and wind power potential. Therefore, the impacts of urban configurations and neighborhoods on wind potential are considerably higher than building heights. More studies in the future considering different urban morphologies can help us determine the impacts of neighborhoods on wind potential. Meanwhile, the neglect of thermal effects may be applicable for the early design stages as the initial estimations of wind speeds and wind power potentials, but this may not be the case for more accurate engineering analysis. Future work should be conducted to evaluate the validity of the proposed approach when applied to the non-neutral stability cases.
Author Contributions
Data curation, M.H. and S.Y.; Formal analysis, M.M., J.Z., M.H. and S.Y.; Funding acquisition, L.W.; Investigation, M.M., M.H. and S.Y.; Methodology, M.M. and M.H.; Project administration, L.W.; Resources, J.Z. and L.W.; Software, M.M. and M.H.; Supervision, L.W.; Visualization, J.Z. and S.Y.; Writing—original draft, M.M., M.H. and L.W.; Writing—review & editing, J.Z., S.Y. and L.W. All authors have read and agreed to the published version of the manuscript.
Funding
The research was supported by the Natural Sciences and Engineering Research Council (NSERC) of Canada through the Discovery Grants Program [#RGPIN-2018-06734] and the Advancing Climate Change Science in Canada Program [#ACCPJ 535986-18]. The APC was funded by [#RGPIN-2018-06734].
Institutional Review Board Statement
Not applicable.
Informed Consent Statement
Not applicable.
Data Availability Statement
Not applicable.
Conflicts of Interest
The authors declare no conflict of interest.
References
- Dawn, S.; Tiwari, P.K.; Goswami, A.K.; Singh, A.K.; Panda, R. Wind power: Existing status, achievements and government’s initiative towards renewable power dominating India. Energy Strategy Rev. 2019, 23, 178–199. [Google Scholar] [CrossRef]
- Goudarzi, N.; Zhu, W.D. A Review of the Development of Wind Turbine Generators Across the World. In ASME International Mechanical Engineering Congress and Exposition; American Society of Mechanical Engineers: New York, NY, USA, 2012; Volume 45202, pp. 1257–1265. [Google Scholar] [CrossRef]
- WINDExchange, N.R.E.L. US Installed and Potential Wind Power Capacity and Generation. Office of Energy Efficiency & Renewable Energy, 2020. Available online: https://windexchange.energy.gov/maps-data/321 (accessed on 26 December 2021).
- Grant, A.; Johnstone, C.; Kelly, N. Urban wind energy conversion: The potential of ducted turbines. Renew. Energy 2008, 33, 1157–1163. [Google Scholar] [CrossRef] [Green Version]
- Poozesh, P.; Baqersad, J.; Niezrecki, C.; Avitabile, P.; Harvey, E.; Yarala, R. Large-area photogrammetry based testing of wind turbine blades. Mech. Syst. Signal Process. 2017, 86, 98–115. [Google Scholar] [CrossRef] [Green Version]
- Post, B.K.; Richardson, B.; Lind, R.; Love, L.J.; Lloyd, P.; Kunc, V.; Rhyne, B.J.; Roschli, A.; Hannan, J.; Nolet, S.; et al. Big area additive manufacturing application in wind turbine molds. Solid Free. Fabr. 2017. [Google Scholar] [CrossRef]
- Walker, S.L. Building mounted wind turbines and their suitability for the urban scale—A review of methods of estimating urban wind resource. Energy Build. 2011, 43, 1852–1862. [Google Scholar] [CrossRef]
- Abohela, I.; Hamza, N.; Dudek, S. Effect of roof shape, wind direction, building height and urban configuration on the energy yield and positioning of roof mounted wind turbines. Renew. Energy 2013, 50, 1106–1118. [Google Scholar] [CrossRef]
- Mertens, S. The Energy Yield of Roof Mounted Wind Turbines. Wind. Eng. 2003, 27, 507–518. [Google Scholar] [CrossRef]
- McQueen, J.T.; Draxler, R.R.; Rolph, G.D. Influence of Grid Size and Terrain Resolution on Wind Field Predictions from an Operational Mesoscale Model. J. Appl. Meteorol. 1995, 34, 2166–2181. [Google Scholar] [CrossRef] [Green Version]
- Ayhan, D.; Sağlam, A. technical review of building-mounted wind power systems and a sample simulation model. Renew. Sustain. Energy Rev. 2012, 16, 1040–1049. [Google Scholar] [CrossRef]
- Celik, A.N. Energy output estimation for small-scale wind power generators using Weibull-representative wind data. J. Wind. Eng. Ind. Aerodyn. 2003, 91, 693–707. [Google Scholar] [CrossRef]
- Carpentieri, M.; Robins, A.G. Influence of urban morphology on air flow over building arrays. J. Wind Eng. Ind. Aerodyn. 2015, 145, 61–74. [Google Scholar] [CrossRef] [Green Version]
- Rezaeiha, A.; Montazeri, H.; Blocken, B. A framework for preliminary large-scale urban wind energy potential assessment: Roof-mounted wind turbines. Energy Convers. Manag. 2020, 214, 112770. [Google Scholar] [CrossRef]
- Zou, J.; Yu, Y.; Liu, J.; Niu, J.; Chauhan, K.; Lei, C. Field measurement of the urban pedestrian level wind turbulence. Build. Environ. 2021, 194, 107713. [Google Scholar] [CrossRef]
- Khan, M.J.; Iqbal, M.T.; Mahboob, S. A wind map of Bangladesh. Renew. Energy 2004, 29, 643–660. [Google Scholar] [CrossRef]
- Landberg, L.; Myllerup, L.; Rathmann, O.; Petersen, E.L.; Jørgensen, B.H.; Badger, J.; Mortensen, N.G. Wind resource estimation—an overview. Wind. Energy Int. J. Prog. Appl. Wind. Power Convers. Technol. 2003, 6, 261–271. [Google Scholar] [CrossRef]
- Carrasco-Díaz, M.; Rivas, D.; Orozco-Contreras, M.; Sánchez-Montante, O. An assessment of wind power potential along the coast of Tamaulipas, northeastern Mexico. Renew. Energy 2015, 78, 295–305. [Google Scholar] [CrossRef]
- Tabrizi, A.B.; Whale, J.; Lyons, T.; Urmee, T. Performance and safety of rooftop wind turbines: Use of CFD to gain insight into inflow conditions. Renew. Energy 2014, 67, 242–251. [Google Scholar] [CrossRef] [Green Version]
- Liu, J.; Niu, J. CFD simulation of the wind environment around an isolated high-rise building: An evaluation of SRANS, LES and DES models. Build. Environ. 2016, 96, 91–106. [Google Scholar] [CrossRef]
- Liu, X.; Niu, J.; Kwok, K.C.S. Evaluation of RANS turbulence models for simulating wind-induced mean pressures and dispersions around a complex-shaped high-rise building. Build. Simul. 2012, 6, 151–164. [Google Scholar] [CrossRef]
- Toparlar, Y.; Blocken, B.; Maiheu, B.; van Heijst, G. A review on the CFD analysis of urban microclimate. Renew. Sustain. Energy Rev. 2017, 80, 1613–1640. [Google Scholar] [CrossRef]
- Mortezazadeh, M.; Wang, L. Solving city and building microclimates by fast fluid dynamics with large timesteps and coarse meshes. Build. Environ. 2020, 179, 106955. [Google Scholar] [CrossRef]
- Aliabadi, A.; Moradi, M.; McLeod, R.; Calder, D.; Dernovsek, R. How Much Building Renewable Energy Is Enough? The Vertical City Weather Generator (VCWG v1.4.4). Atmosphere 2021, 12, 882. [Google Scholar] [CrossRef]
- Katal, A.; Mortezazadeh, M.; Wang, L. Modeling building resilience against extreme weather by integrated CityFFD and CityBEM simulations. Appl. Energy 2019, 250, 1402–1417. [Google Scholar] [CrossRef]
- Mortezazadeh, M.; Jandaghian, Z.; Wang, L.L. Integrating CityFFD and WRF for modeling urban microclimate under heatwaves. Sustain. Cities Soc. 2021, 66, 102670. [Google Scholar] [CrossRef]
- Mortezazadeh, M.; Wang, L.L.; Albettar, M.; Yang, S. CityFFD–City fast fluid dynamics for urban microclimate simulations on graphics processing units. Urban Clim. 2022, 41, 101063. [Google Scholar] [CrossRef]
- Mortezazadeh, M.; Wang, L.L. A high-order backward forward sweep interpolating algorithm for semi-Lagrangian method. Int. J. Numer. Methods Fluids 2017, 84, 584–597. [Google Scholar] [CrossRef]
- Townsend, A. The Structure of Turbulent Shear Flow; Cambridge University Press: New York, NY, USA, 1980. [Google Scholar]
- Shu, C.; Wang, L.; Mortezazadeh, M. Dimensional analysis of Reynolds independence and regional critical Reynolds numbers for urban aerodynamics. J. Wind. Eng. Ind. Aerodyn. 2020, 203, 104232. [Google Scholar] [CrossRef]
- Defraeye, T.; Blocken, B.; Carmeliet, J. Convective heat transfer coefficients for exterior building surfaces: Existing correlations and CFD modelling. Energy Convers. Manag. 2011, 52, 512–522. [Google Scholar] [CrossRef] [Green Version]
- Chew, L.W.; Aliabadi, A.A.; Norford, L.K. Flows across high aspect ratio street canyons: Reynolds number independence revisited. Environ. Fluid Mech. 2018, 18, 1275–1291. [Google Scholar] [CrossRef]
- Snyder, W.H. Guideline for Fluid Modeling of Atmospheric Diffusion; Environmental Sciences Research Laboratory, Office of Research and Development, US Environmental Protection Agency: New York, NY, USA, 1981; Volume 81.
- Al-Quraan, A.; Stathopoulos, T.; Pillay, P. Comparison of wind tunnel and on site measurements for urban wind energy estimation of potential yield. J. Wind Eng. Ind. Aerodyn. 2016, 158, 1–10. [Google Scholar] [CrossRef] [Green Version]
- Higgins, S.; Stathopoulos, T. Application of artificial intelligence to urban wind energy. Build. Environ. 2021, 197, 107848. [Google Scholar] [CrossRef]
- Hosseini, M.; Bigtashi, A.; Lee, B. Generating future weather files under climate change scenarios to support building energy simulation—A machine learning approach. Energy Build. 2021, 230, 110543. [Google Scholar] [CrossRef]
- Amengual, A.; Homar, V.; Romero, R.; Alonso, S.; Ramis, C. A Statistical Adjustment of Regional Climate Model Outputs to Local Scales: Application to Platja de Palma, Spain. J. Clim. 2012, 25, 939–957. [Google Scholar] [CrossRef] [Green Version]
- Breiman, L. Random forests. Mach. Learn. 2001, 45, 5–32. [Google Scholar] [CrossRef] [Green Version]
- Hosseini, M.; Bigtashi, A.; Lee, B. A systematic approach in constructing typical meteorological year weather files using machine learning. Energy Build. 2020, 226, 110375. [Google Scholar] [CrossRef]
- Segal, M.; Xiao, Y. Multivariate random forests. Wiley Interdiscip. Rev. Data Min. Knowl. Discov. 2011, 1, 80–87. [Google Scholar] [CrossRef]
- Segal, M.R. Tree-structured methods for longitudinal data. J. Am. Stat. Assoc. 1992, 87, 407–418. [Google Scholar] [CrossRef]
- Tominaga, Y.; Mochida, A.; Yoshie, R.; Kataoka, H.; Nozu, T.; Yoshikawa, M.; Shirasawa, T. AIJ guidelines for practical applications of CFD to pedestrian wind environment around buildings. J. Wind Eng. Ind. Aerodyn. 2008, 96, 1749–1761. [Google Scholar] [CrossRef]
Publisher’s Note: MDPI stays neutral with regard to jurisdictional claims in published maps and institutional affiliations. |
© 2022 by the authors. Licensee MDPI, Basel, Switzerland. This article is an open access article distributed under the terms and conditions of the Creative Commons Attribution (CC BY) license (https://creativecommons.org/licenses/by/4.0/).