Abstract
Black carbon (BC) is one of the particulate matter (PM) components that both affects human health and contributes to climate change. In this study, we present the preliminary results of the investigation of BC concentrations in PM2.5 for two Bulgarian cites—Sofia and Burgas. The parallel PM2.5 samplings were organized in October 2020 and January 2021. The Multi-Wavelength Absorption Black carbon Instrument (MABI) was used for the evaluation of light-absorbing carbon. In addition, we compared the observed BC and PM2.5 values to modelled ones and analyzed the spatial distribution over the country, using data from advanced operational chemical transport models (CTM)—the European (regional) air quality system established at the Copernicus Atmosphere Monitoring Service (CAMS). Generally, the observed BC and PM2.5 values were higher in January than in October for both cities. In October, the model underestimated the observed BC concentrations (Sofia—2.44 μg.m−3, Burgas—1.63 μg.m−3) by 17% and 51%. In January 2021, the observed monthly BC concentrations were higher (Sofia—3.62 μg.m−3, Burgas—1.75 μg.m−3), and the bias of the model was less than that in October, with an overestimation of 22% for Sofia. The relative bias for PM2.5 in October (17% for Sofia and −6% for Burgas) was less than the relative bias in January when the model underestimated PM2.5 monthly mean concentrations by 20% (Sofia) and 42% (Burgas). In addition, we also elaborate on two episodes with high observed BC concentrations in view of the meteorological conditions.
1. Introduction
Air pollution with particulate matter (PM) is still a big problem in the large urban agglomerations in the world as well as in most of the cities of Bulgaria [1]. The urban air quality is determined by many factors: air masses, characteristic local flow and meteorology, low dispersion ability in built-up environments, the concentration of emission sources of different types, and various chemical processes. The PM chemical composition, thus, reflects site-specific complex processes. In the last decade, the studies on the chemical composition of PM in urban areas were widely developed and were associated mainly with the investigation of its effects on human health and understanding of its sources [2,3,4,5].
Studies on the chemical composition of PM in Bulgaria are extremely important. On one side, regular air quality stations of the national monitoring network often report high PM concentrations, whereas, on the other side, there is a lack of highly specialized monitoring sites like the ones of the EMEP (European Monitoring and Evaluation Programme) network [6]. Studies on PM speciation were conducted during field campaigns in the past years for Sofia only [7,8,9], however, without analysis for a significant class of pollutants such as carbon and carbonaceous compounds [10].
The carbonaceous fraction (elemental carbon (EC) and organic carbon (OC)) is a prime constituent of atmospheric aerosol. It generally contributes 20–45% of PM2.5 (fine particles with an aerodynamic diameter of ≤2.5 µm) and 20–30% of PM10 (particles with an aerodynamic diameter of ≤10 µm) across Europe [5,11]. The examination of carbon particles in urban areas is a matter of great importance for determining the contribution of transportation and domestic heating to air pollution, and thus providing a basis for mitigation measures towards air quality improvement.
There is no universally accepted definition of the term “black carbon” (BC) [12]. The difference between BC and EC is in the measuring method used—BC concentrations are obtained via the optical method, whereas EC—via the thermo-optical method. Not only the shape but also the chemical and physical properties of BC particles can affect the measurements of the optical instruments. Despite that, the average values of BC and EC in urban conditions obtained with different methods appear to be similar [13,14]. Therefore, as we go through the text, we will refer to them using the term BC.
Black carbon, a component of particulate matter, has significant effects on climate and human health [11,12,13,14,15,16,17,18]. BC is typically formed through the incomplete combustion of fossil fuels, biofuel, and biomass and is emitted by anthropogenic and natural sources. It consists of pure carbon in several forms, and the relevant particle size fraction can include known carcinogens and other toxic species [19]. BC stays in the atmosphere for periods varying from days to weeks [11]. Sources of BC can differ widely across regions. The main sources are on-road diesel vehicles, non-road transport, and residential combustion [14,15,16,17,18,19,20,21,22,23,24,25,26,27]. In general, higher concentrations of BC are reported during winter, likely due to higher energy consumption, unfavourable meteorological conditions, and the occasional but significant influence of fires at specific locations during the spring and the summer [21,22,23,24,25,26,27].
Countries around the world have not yet defined an air quality standard for black carbon concentrations and mandatory monitoring. This might explain the relatively low number of urban observational sites, despite some environmental agencies and institutions that monitor BC concentration levels [20]. In Europe, BC measurements were carried out during intensive measurement campaigns at rural sites of the EMEP network [6]. Such observational data represent snapshot information from a set number of locations and for limited periods, but they provide valuable information for evaluating modelling results.
Numerical models that represent the atmospheric dynamics and the chemical transformation of air pollutants are powerful tools to complement sparse data from air quality monitoring networks. The models allow one to analyze the spatial and temporal distribution of pollutants and estimate the effects of different mitigation scenarios for air quality improvement. Chemical transport models (CTM) simulating BC concentrations were applied both at a global scale [28,29] and at a regional scale (over Europe) [30,31]. The uncertainties in modelling results are mainly associated with those in BC emissions, estimated to be a factor of two to five on a regional scale [32]. Another important source of uncertainty is linked to parameterizations of chemical mechanisms describing the black carbon ageing process [33]. The performance of models for BC concentrations in Europe was studied in model intercomparison exercises, comparing results from several CTMs to observations at background sites of the EMEP network [34,35]. The underestimation of EC in PM2.5 was approximately 20–60% for 2005 [34] and a maximum of 60% for the intensive measurement campaigns in different seasons in the years 2006–2009 [35]. Modelling studies for other parts of the world also showed underestimation of BC by CTMs, for example, in South Africa, mean monthly BC concentrations were underestimated by approximately 50% [36]; in Japan, seasonal BC concentrations observed at urban sites were underestimated by a factor from 0.3 to 0.6; and in South Asia, daily BC concentrations were underestimated by CTM on average by a factor of 4 at urban sites [37,38]
Studies on BC concentration in Bulgaria are limited in number and are not executed regularly. Only a few studies on monitoring BC concentration in PM2.5 in Bulgaria are available, conducted within the framework of the project “CARBOAEROSOL” [39,40], with an application of methods for estimation of BC from different sources.
In this study, we present and discuss preliminary results on BC concentrations in fine particulate matter. They were observed for months in two main Bulgarian cities: Sofia, found in a valley, and Burgas, located on the Black Sea coast. Furthermore, we compare the observed BC and PM2.5 values to modelled ones and analyze the spatial distribution over the country, using data from an advanced operational CTM, which is the European (regional) air quality system established at the Copernicus Atmosphere Monitoring Service (CAMS) [41]. Two episodes with high observed BC concentrations are discussed in view of the meteorological conditions.
2. Materials and Methods
2.1. Sampling Sites Description
The PM2.5 sampling field campaigns were organized in two large cities—Sofia and Burgas (Figure 1)—in the framework of the project “CARBOAEROSOL”. Sofia, located in the western part of the country, is the capital and the largest city in Bulgaria, with a population of 1.3 million inhabitants [42]. It is located in the semi-closed Sofia valley at approximately 550 m a.s.l., surrounded by different mountains, where the topography prevents the dispersion of pollutants and determines unfavourable air quality conditions [10]. The climate is continental with a mean temperature of −0.6 °C in January and a maximum of 21.1 °C in July.
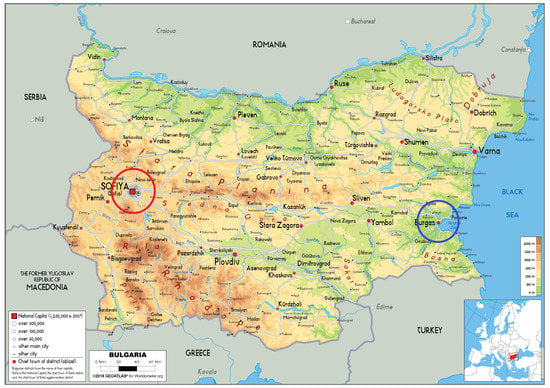
Figure 1.
Topographic map of Bulgaria with locations of the sampling sites (Sofia—red, Burgas—blue), adapted from https://www.worldometers.info/maps/bulgaria-map/ (accessed on 29 September 2021).
Burgas, located on the Black Sea coast in eastern Bulgaria, is a regional and municipal center. It is the fourth largest town in Bulgaria, housing 277,922 inhabitants [42]. The climate is moderately continental with a clearly expressed sea influence and frequent sea breeze, most notable during the warm period of the year. Mean monthly temperatures are positive all over the year; the mean wind speed is ≥4.0 ms−1 with a maximum of 4.8 ms−1 in March. The city is surrounded by four large water bodies with different salinity, which determines the high relative humidity throughout the year. The winter is mild, usually without any snow. During the winter season, the average air temperature is 4.6 °C, and that of the sea water is 7.4 °C. Due to the influence of the sea, autumn at this site is long and significantly warmer than in inland regions, whereas spring tends to be cold and arrives a month later. These more dynamic atmospheric conditions affect the processes of atmospheric chemistry. The fewer residential, transport, and industrial sources are expected to lead to lower PM2.5, BC, and nitrogen dioxide (NO2) concentrations [43,44].
2.2. PM2.5 and BC Emissions
Annual emissions of PM2.5 and BC in Bulgaria reported to the Convention on Long-Range Transboundary Air Pollution (CLRTAP) [45] allow the analysis of the trend both of national totals and the contribution by different sectors (Figure 2). The PM2.5 emissions in 2019 were 30 kt, which is slightly lower than in the previous few years. The main contributors were the sectors “other stationary combustion” (residential heating), with a share of 77%, road transportation, with a share of 7%, and industry (8%). The BC emissions in 2019 were 3.63 kt, representing 12% of the annual PM2.5 emissions. The annual BC emissions in the period 2008–2019 exhibited little variation, with a maximum of 4.13 kt in 2012. In 2019, 63% of the BC emissions were attributed to residential heating, 33% to road transport. The emissions are unevenly distributed throughout the year. Although the residential sources prevail during winter months (November to February), the transport emissions are almost constant.
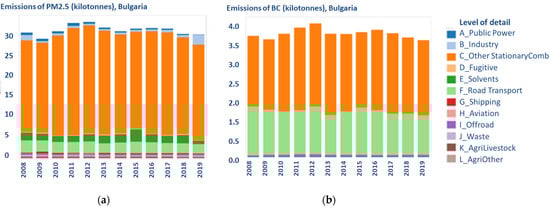
Figure 2.
Annual emissions (kilotons) of PM2.5 (a) and BC (b) in Bulgaria; national totals and the contribution by different sectors, adapted from https://www.ceip.at/data-viewer (accessed on 3 October 2021).
There have been no reliable estimations of emissions of particulate matter at city levels so far. Some estimates were made at the two municipalities concerning dispersion modelling for air quality planning. For example, the contribution from residential heating to PM2.5 emissions in the Sofia region (about 20 km) in 2018 was estimated to be 73% [46]. For Burgas, the share of residential emissions to PM2.5 in 2014 was estimated to be 68% [47].
A recent study for Sofia, based on the Positive Matrix Factorization (PMF) receptor model for source contribution of different groups of emission sources to PM10 concentrations [10], indicated 23% for biomass burning and 9% for transport on an annual basis for 2019. Another recent study on the determination of the local pollution of PM and PAH in the Sofia municipality by the Gaussian dispersion-based ADMS-Urban model showed that domestic heating contributed 59% of the PM2.5 concentrations [48].
2.3. Sampling Procedure, Equipment, and Black Carbon Analysis
The parallel 24 h PM2.5 sampling was performed at the Central Meteorological Observatory, Sofia (42.655 N, 23.384 E, at 586 m a.s.l.) and at “Prof. Dr Assen Zlatarov” University, Burgas (42.314 N, 27.264 E, at 30 m a.s.l.) during autumn (October 2020) and winter (January 2021). Both sampling sites can be classified as ‘urban background’. A total of 69 daily PM2.5 samples on polytetrafluoroethylene membrane filters (PTFE) Whatman® (47 mm) were collected with low volume air samplers following the EN-12341 standard (38.3 l min−1). Although the PTFE filters are optically thinner and less homogeneous than the fiber media, they avoid interference from adsorbed organic gases that is associated with quartz and glass fiber media. This provides flexibility to perform subsequent analysis of the same filters using other techniques such as X-ray fluorescence, ICP, IC, etc. The samplers were installed on a grass field, and the sampling heads were at 2 m. a.g.l. Before and after sampling, the filters were weighed by analytical balances (in Sofia with Mettler Toledo, AG135 and in Burgas with KERN & Sohn GmbH, ABT 100-5M). PM2.5 mass concentrations were determined from the weight differences and sampled air volume.
All collected PM2.5 samples were analyzed for light-absorbing carbon (LAC) with the Multi-Wavelength Absorption Black carbon Instrument (MABI) at the National Institute of Meteorology and Hydrology (NIMH). This instrument consists of an optical module with a multi-wavelength light source (7 LEDs), a sampling holder, and a photodetector. Moreover, opaque glass is used in the MABI units to scatter the scattered light back through the filter to the detector. The MABI instrument measures light absorption at seven wavelengths, spanning from ultraviolet to infrared (405 nm, 465 nm, 525 nm, 639 nm, 870 nm, 940 nm, and 1050 nm). This allows the differentiation of the contributions from biomass burning (BCbb) and fossil fuels combustion (BCff) based on different light absorption from different type particles at different wavelengths. The values obtained by subtracting the BC (1050 nm) data from BC (450 nm) data represent mainly BC from biomass burning [49,50].
The MABI is a research instrument developed at the Australian Nuclear Science and Technology Organisation that does not perform LAC or BC calculation [49,50]. This is done by the user, which ensures full control, understanding, and interpretation of the obtained BC values. MABI scans are initially performed on unexposed “blank filters” to determine the absorption at each wavelength from the filter substrate. These data for blank filters are referred to as Io. The MABI scans are then repeated on the same filters after exposure and the collection of particulate matter, i.e., “exposed filters”, which represent the absorption at each wavelength from both the collected particles and the filter substrate. This transmission data are referred to as I [49,50]. Both of these values along with the filter area (10.75 cm2) and sampled air volume (~55 m3) are used to determine the black carbon light absorption coefficient (babs) in (Mm−1]) at each wavelength (Equation (1)):
where
A—filter collection area in cm2;
V—volume of air sampled through the filter in m3;
Io—measured light transmission through blank (unexposed) filter;
I—measured light transmission through an exposed filter.
The obtained values for babs (λ = 639 nm) in this study are in the range 6.74–45.10 Mm−1 for Sofia and 1.19–24.3 Mm−1 for Burgas.
The LAC mass concentration in [ng.m−3] is determined using a mass absorption coefficient (ε) in (m2.g−1) at each wavelength (Equation (2)):
The mass absorption coefficient (ε) is a function of wavelength (λ): ε = a*λ−b and was obtained following the procedure presented by [49,50]. A plot of the log of all wavelength data against the log of all λ = 639 nm data is made to determinate the values of ε for each wavelength (example in Figure S1, Supplementary). According to authors [49], the mass absorption coefficient ε at λ = 639 is standard baseline data with a known value—6.6 m2.g−1. The received values of ε as a function of λ for Sofia and Burgas are presented in Figure S2 in the Supplementary. These values are in the range of 4.9–8.4 m2.g−1, which is in correspondence with literature for fine particulate size fraction PM2.5 [49,50].
The light source calibration was made automatically in two calibration cycles. During measurements, the calibration was checked at regular intervals.
Filter-based optical methods for estimation of BC concentration suffer from two major artifacts—the filter loading (or shadowing) effect and the multiple scattering effect [51,52,53,54,55,56,57,58,59]. The filter loading effect (FLE) is a bias that affects the apparent concentrations relative to the ambient ones. The multiple scattering from aerosols on the filter and from the filter material leads also to attenuation, which might be misinterpreted as due to absorption.
Different approaches have been developed over time for compensating for these effects, proposing various empirically estimated correction procedures [53,54,55,56,57,58,59,60,61,62]. The correction algorithms depend on the wavelength and make use of parameters that account for instrument details. As there is no worldwide consensus on the most representative correction procedure [60], inter-comparison workshops and studies applying different laboratory and field instruments propose algorithms for widely used instruments (e.g., for AE-31, PSAP).
Most of the correction algorithms were developed specifically for quartz or glass fiber filters. Correcting for loading effect is treated as quite straightforward [57], and it has already been implemented in an aethalometer using a dual-spot technology [58].
In our study we used a relatively new research type instrument (MABI) with a PTFE filter. There are still a limited number of published studies with this device [49,50], and, to our knowledge, they do not have details as to whether it is necessary to apply a filter loading correction.
In a recent work on MABI measurements [49], comparison of data from MABI with data from a MAGEE AE-33 aethalometer (instrument with automatic dual-spot ‘loading compensation’) for almost one year was addressed. The correlation coefficient of R2 = 0.96 was reasonable for these two quite different instruments measuring the fine PM2.5 black carbon concentrations at the same site. On average, the AE_33 aethalometer estimates were 12% higher than the MABI estimates. Furthermore, they quoted each MABI LAC measurement as having an error of ±14% at 639 nm.
The precision of the measurements in our study was verified by conducting repeated measurements on 20 samples. The results showed the difference between measurements on the same filter was <0.1% for all readings of Io and I. The minimum detection limit of LAC ranges from 60 to 70 ng.m−3. Considering the presented information in [49] and the [60] approach, the raw data could be further modified if researchers agree upon a correction method that could be used in combination with the MABI instrument. Therefore, in the next sections we will present and discuss raw BC (uncorrected) data.
2.4. Modelling Systems
We analysed data provided by the European (regional) air quality system established at the Copernicus Atmosphere Monitoring Service [63]. The system, further denoted as CAMS-ENS, is based on an ensemble approach, including results from nine state-of-the-art chemistry transport models [63]. All models use common data regarding meteorology, emissions, and boundary conditions. The meteorological driver is the Integrated Forecast system of the European Centre for Medium-range Weather Forecasts (ECMWF-IFS), [64]. The individual models use common anthropogenic emission input, the CAMS-REG-AP emission inventory, developed under the Copernicus Global and Regional emissions service [65]. The reference emission input (CAMS-REG-v.4.2) is for the year 2017, with upgrades in version 4.2 for 2018 and 2019 [66]. There are ongoing activities on including emissions of EC in the PM2.5 fraction, still facing difficulties due to differences in reporting wood-burning emissions by several countries [67]. All models use common wildfire emission input, provided by the Global Fire Assimilation System at CAMS. The individual models use various chemistry algorithms and parameterizations and assimilation of in situ observations; further details can be found in [67]. The CAMS-ENS results (analysis and 4-day forecast hourly values) are available on a grid of 0.1° × 0.1° at eight vertical levels (from the surface to 5000 m) and refer to more than 20 species. For this study, we downloaded and assessed 1-h analysis data for PM10, PM2.5, and total elementary carbon from the CAMS atmosphere data store [68].
To investigate the effects of long-range transport, we considered back-trajectories from the Hybrid Single-Particle Lagrangian Integrated Trajectories (HYSPLIT) trajectory model [69,70]. For analysis of selected episodes, back-trajectories arriving at the sampling sites at 500 m, 1500 m, and 3000 m a.g.l. were calculated for three days, using GFS0p25 meteorological input with resolution 0.25° × 0.25°.
2.5. Data Analyses
We analyzed data for PM2.5 and BC concentrations for October 2020 and January 2021 in Sofia and Burgas. We selected these months to investigate the variability of concentrations from the two cities under different thermal and dynamic conditions. Moreover, October is the month before the start of the heating season, whereas January is in the middle of it. The data for observed black carbon concentrations presented in our study are a sum of fossil fuels (BCff) and biomass burning (BCbb) and are marked as BC.
Furthermore, the obtained data for PM2.5 and BC concentrations, together with basic meteorological parameters provided by NIMH for both cities, were processed with statistical software R and StatSoft v.6.0.
The observed BC and PM2.5 mean concentrations were compared with modelled ones for October 2020 and January 2021. Additionally, they were compared for two selected episodes with elevated BC concentrations. For briefly commenting on the synoptic situation during the two selected episodes, we analysed the spatial distribution of some meteorological variables from the global reanalysis dataset of the National Centers for Environmental Prediction/National Center for Atmospheric Research (NCEP/NCAR) [71]. NCEP/NCAR reanalysis products have been widely used to investigate large-scale meteorological conditions and transport paths linked to air pollution episodes. This reanalysis dataset was selected as it provides a possibility for fast visualisation of composite maps. The composite (mean) maps can be produced for selected dates and hours, facilitating evidence of large scale differences in the meteorological fields for low and high pollution days, or for periods in different seasons. We produced composite maps of the geopotential height and the wind at 700 hPa for each of the two selected episodes using the web tool at the National Oceanic and Atmospheric Administration, Earth System Research Laboratories (NOAA/ESRL) [72].
3. Results
3.1. Observed PM2.5 and BC Concentrations in Sofia and Burgas
The comparison of daily PM2.5 mass concentrations in Sofia and Burgas for October 2020 and January 2021 is presented in Figure 3. The number of the PM2.5 samples in Burgas (10) is fewer than that in Sofia (19) for January due to technical problems during the experimental campaign. The PM2.5 concentrations in Sofia were in the range 4.9–25.5 µg.m−3 in October and from 5.1 to 46.9 µg.m−3 in January. For Burgas, the PM2.5 concentrations varied from 3.3 to 27.1 µg.m−3 in October and from 2.2 to 30.4 µg.m−3 in January.
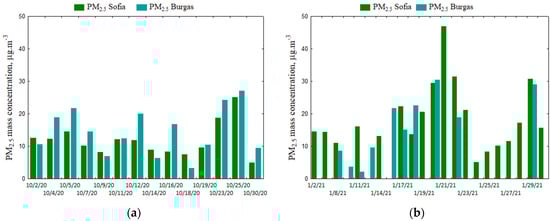
Figure 3.
Daily PM2.5 mass concentration (µg.m−3) in Sofia and Burgas for October 2020 (a) and January 2021 (b).
The analysis showed that 30% of the measured daily PM2.5 concentrations in Sofia and 43% in Burgas exceeded the most recent WHO air quality guideline level (15 µg.m−3) [19]. In October, a higher mean PM2.5 concentration (14.5 µg.m−3) was observed in Burgas than in Sofia (11.8 µg.m−3). This is probably due to the fewer rainy days and monthly accumulated precipitation in Burgas (12 mm) in comparison to Sofia (46.7 mm). In January, a higher mean PM2.5 concentration (18.6 µg.m−3) was observed in Sofia than in Burgas (16.2 µg.m−3). Although some daily PM2.5 concentrations in Sofia were higher than the WHO guideline value, the monthly mean PM2.5 concentration (18.6 µg.m−3) was lower than the mean value for January 2019 (22.8 µg.m−3), the period before the COVID-19 pandemic [27]. The highest daily PM2.5 concentrations in Sofia were observed on 21 and 22 January, when the air temperature was around zero and the wind speed was very low (0.2–0.5 ms−1). The highest PM2.5 concentration in Burgas was measured on 20 January, when the air temperature was 1.9 °C, and the wind speed was 2.9 ms−1.
Figure 4 presents the variation in BC concentrations obtained in October and in January, as well as the BC/PM2.5 ratio.
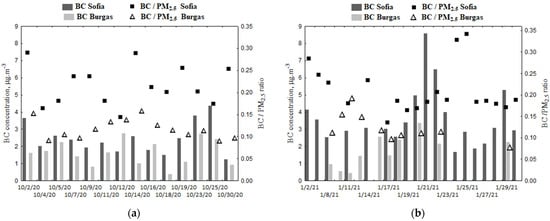
Figure 4.
Daily BC concentrations (μg.m−3) (bars) and BC/PM2.5 ratio (symbols) for October 2020 (a) and January 2021 (b).
Generally, the derived BC values are higher for January than those for October. The BC concentrations in Sofia samples varied from 1.25 to 4.36 µg.m−3 for October and from 1.67 to 8.58 µg.m−3 for January. The BC concentrations in Burgas samples ranged from 0.37 to 2.76 µg.m−3 in October and from 0.42 to 3.36 µg.m−3 in January. Based on the measured PM2.5 and BC concentrations, the derived BC/PM2.5 ratio for Sofia varies from 17% to 29% and for Burgas, from 1% to 17% in October. This ratio in January covers a wider range in Sofia (14–34%), reflecting the increased impact of combustion sources on the mass concentration of PM and more variable meteorological/synoptic situations. For Burgas the ratio is limited to a narrower range (9–11%) in January, probably because of the similar meteorological conditions in terms of dynamical mixing (high mean diurnal wind speed) for measurement days.
The monthly mean BC concentration for Sofia was lower in October (2.4 µg.m−3) than in January (3.6 µg.m−3). During the latter, the number of days with inversion was high, and there was an influence from biomass burning for heating. There was no significant difference between the mean BC concentration in Burgas in October (1.63 µg.m−3) and January (1.75 µg.m−3). This is most likely due to the more intense dispersion of air pollutants and the higher wind speed in Burgas during winter. Moreover, October 2020 was characterized by lower wind speed than the multi-annual (1981–2010) value (norm): in Burgas, it was 3.3 ms−1 (compared to the norm of 4.6 ms−1); and in Sofia, it was 1.0 ms−1 (compared to the norm of 1.2 ms−1). The monthly sum of precipitation was 30.2 mm in Burgas (less than the norm of 57 mm), whereas in Sofia monthly amount of rainfall was slightly higher—60.4 mm with a standard amount of 50 mm. The air temperatures in October 2020 in Burgas and Sofia were above the norm with 3.3 °C and 1.4 °C, respectively. In addition, January 2021 was warmer than usual: 2.8 °C above the norm in Burgas and 2 °C above the norm in Sofia. It was more humid, which is depicted by the precipitation sum—above the norm by 432% in Burgas and 335% in Sofia. The mean wind speed was near the norm for both cities. These specific meteorological conditions led to smaller than expected variations in daily and mean concentrations.
Because the BC and PM2.5 concentrations depend on the meteorological conditions, a statistical analysis involving main meteorological parameters (temperature, wind speed, relative humidity) was carried out. The correlations between black carbon concentration from fossil fuel (BCff) and biomass burning (BCbb), PM2.5 mass concentration, and the noted meteorological parameters for both sites are illustrated in Figure 5. A high correlation between BCff and PM2.5 in Sofia was observed, with a statistically significant correlation coefficient equal to 0.9. A moderately high correlation (0.7) between BCff and PM2.5 was observed in Burgas. There were significant negative correlations (−0.5) between BC and the temperature (T) and between BCff and wind speed (WS) in Sofia, as expected as high concentrations of pollutants are observed in cold and calm conditions. There is a significant negative correlation between BCbb concentration and temperature in Sofia (−0.5) and Burgas (−0.6) due to enhanced biomass burning during colder days.
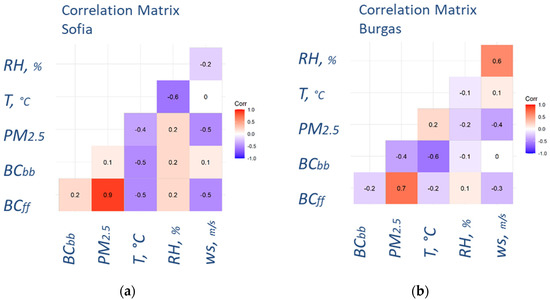
Figure 5.
Correlation coefficients between PM2.5, BCff, and BCbb concentrations and some meteorological parameters (T—temperature, RH—relative humidity, ws—wind speed) for (a) Sofia and (b) Burgas; data for October 2020 and January 2021; p-value < 0.01.
The comparison between the obtained values for BC in Sofia and Burgas and those reported for other European countries is presented in Table 1. It was found that the obtained values for BC in Sofia were close to those measured in Madrid and Athens (January 2020) and lower than those obtained in Zabrze, Poland. The mean BC concentrations in Burgas were generally lower compared to the values recorded at most urban or urban background stations. In contrast, they were closer to those for Helsinki and Athens (October 2020). It should be noted that the applied method and instrument for estimation of BC concentrations in our study are relatively new. According to the authors who created this device, there is a possible underestimation of BC concentration by approximately 12% [49]. The possible underestimation of BC concentration might lead to a higher BC/PM2.5 ratio in some particular days with high PM2.5 concentrations in January in Sofia, not more than 5–6% of what was presented originally in Figure 4. New research and results from comparative measurements with different instruments are required for more accuracy in these estimates.

Table 1.
Mean BC values for different European sities.
3.2. PM2.5 and BC Concentrations: Observed vs. Model
In this section, we present the results from a comparison of observed and modelled BC and PM2.5 concentrations for October 2020 and January 2021. Moreover, we elaborate on selected episodes with elevated values of observed BC concentration. As we noted in Section 2.5, the designation “BC” refers to observed BC and modelled total EC by CAMS-ENS. We must keep in mind that there is some uncertainty in the measurement of BC, estimated at ±14%, which we assume will have a lower effect in averaging the data, compared to single values.
3.2.1. Monthly Mean PM2.5 and BC Concentrations: Observed vs. Model
The comparison for monthly mean BC and PM2.5 concentrations at the two sampling sites for October 2020 and January 2021 is presented in Figure 6. The observed BC concentrations in October (Sofia—2.44 μg.m−3, Burgas—1.63 μg.m−3) are underestimated by the model, respectively, by 17% and 51%. In January 2021, the observed monthly BC concentrations are higher (Sofia—3.62 μg.m−3, Burgas—1.75 μg.m−3), and the bias of the model is less than in the autumn month. An overestimation of 22% for Sofia modelled BC in January compared to the observed might be partly a result of the higher PM2.5 concentration and bias in measured BC concentrations because of the filter loading effect.
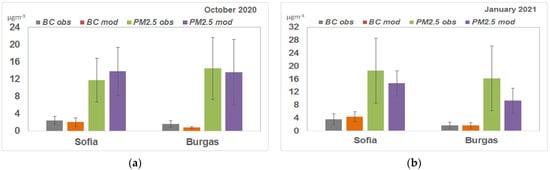
Figure 6.
Monthly mean BC and PM2.5 concentrations (µg.m−3) at Sofia and Burgas observed and modelled by CAMS-ENS; for October 2020 (a), for January 2021 (b); the whiskers represent the standard deviations.
It has to be noted that model values are representative of the computational grid (about 10 × 10 km) and background concentrations in urban environments located in regions with complex topography, whereas monitored concentrations reflect local emission sources and meteorological and dispersion conditions. The relative bias for PM2.5 in October (17% for Sofia and −6% for Burgas) was less than the relative bias in January when the model underestimated PM2.5 monthly mean concentrations by 20% (Sofia) and 42% (Burgas). The PM2.5 underestimation and, at the same time, BC overestimation in the winter month at the Sofia sampling site suggest that model BC emissions from residential combustion around the capital are high. The underestimation of BC at both locations during autumn, with biases higher than for PM2.5 values, suggest that BC emitted from all types of transportation might be underestimated. The observations and the model results show that BC and PM2.5 concentrations were higher in Sofia than in Burgas.
The spatial distribution of monthly mean BC and PM2.5 concentrations based on CAMS-ENS data is shown over part of the Balkans in Figure 7 for October 2020 and Figure 8 for January 2021.
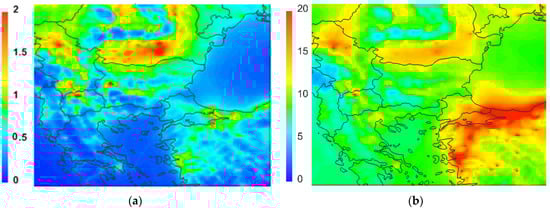
Figure 7.
CAMS-ENS monthly mean concentrations (μg.m−3) in October 2020: BC (a), PM2.5 (b).
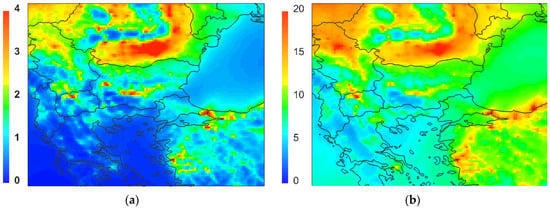
Figure 8.
CAMS-ENS monthly mean concentrations (μg.m−3) in January 2021; BC (a), PM2.5 (b).
The regions with higher BC concentrations in both months were mainly outside of the country. The hot spots in the country were around Sofia and in the lowlands of southern Bulgaria, especially in the winter month. Elevated BC concentrations were also noted in the northern part of the country, in the Lower Danube plain, covering wider areas in October. The PM2.5 pattern was similar to the one for BC, although some new features were noted. The model simulated higher PM2.5 concentrations in October than in January in the region south-east of Bulgaria. This area includes the megalopolis of Istanbul and the industrialized area of Turkey along the northern Aegean coast. The higher PM2.5 concentrations were most likely linked to the influence of emission sources in the region and the atmospheric dynamics, more easily noticed in October than under winter conditions.
Model concentrations depend on many factors—emission sources, chemistry mechanisms, and meteorological processes. The black carbon in atmospheric particulates is inert and directly linked to emission sources. The spatial distribution of PM2.5 emissions used by CASM-ENS is shown in Figure 9. The emission data are available in the Emissions of Atmospheric Compounds and Compilation of Ancillary Data (ECCAD) at [73]. The maps in Figure 9, produced by the ECCAD data tools, refer to the 2019 and CAMS-REG-AP-v4.2 emission inventory on a 0.05° × 0.1° grid. The annual total emissions of PM2.5 were mainly due to residential combustion, especially in the lowland regions in the northern and southern parts of the country.
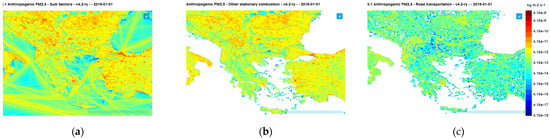
Figure 9.
PM2.5 anthropogenic emissions in 2019 by CAMS-REG-AP inventory: sum of all sectors (a), from other stationary combustion (residential) (b), from road transportation (c).
3.2.2. Daily Mean PM2.5 and BC Concentrations: Observed vs. Model
Further, we discuss the comparison between daily BC and PM2.5 concentrations at the two sites. Figure 10 shows the daily variability of BC and PM2.5 in October, whereas Table 2 and Table 3 present some main statistical parameters.
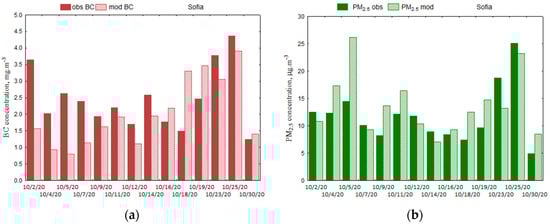
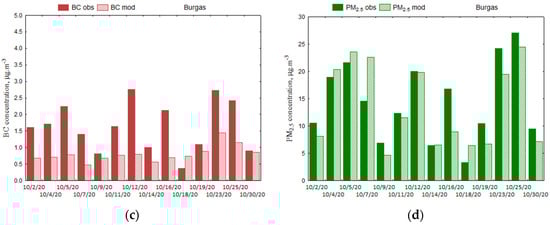
Figure 10.
Five daily mean concentrations (µg.m−3) observed (solid fill) and modelled (hatched) for October 2020 in Sofia (a,b) and in Burgas (c,d).
Table 2.
Statistical parameters for BC and PM2.5 in October 2020.
Table 3.
Statistical parameters for BC and PM2.5 in January 2021.
In Sofia, the observed BC daily concentrations ranged from 1.3 to 4.4 μg.m−3, whereas the simulated BC ranged from 0.8 to 3.9 μg.m−3, with a correlation coefficient equal to 0.42. For PM2.5, the observed values were between 4.9 and 25.1 μg.m−3; the modelled ones between 7.1 and 26.2 μg.m−3, with a correlation coefficient equal to 0.65. In comparison, the correlation coefficients in Burgas were higher—0.51 for BC and 0.87 for PM2.5.
The daily values in January (Figure 11) were, in general, higher at both sites. In Sofia, the observed BC and PM2.5 were in the interval 1.7–8.6 μg.m−3 and 5.1–46.9 μg.m−3, whereas the model ones were in the range 2.6–6.7 for BC and 7.5–21 μg.m−3 for PM2.5. BC was overestimated for almost all days in Sofia and half of the days in Burgas. It is interesting to note that on the days with the highest observed concentration of BC and PM2.5, the modelled values are lower. The correlation coefficients in Sofia were almost the same as in October: −0.46 for BC and 0.65 for PM2.5. The correlation coefficients in Burgas were higher (0.78 for BC and 0.7 for PM2.5). However, one must interpret the numbers for Burgas with caution due to the limited number of daily values.
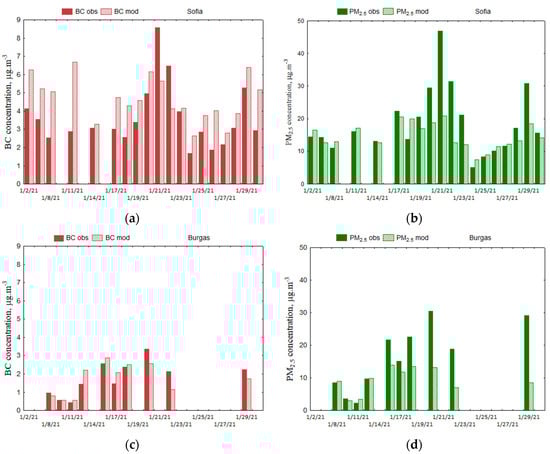
Figure 11.
BC and PM2.5 daily mean concentrations (µg.m−3) observed (solid fill) and modelled (hatched) for January 2021 in Sofia (a,b) and in Burgas (c,d).
3.2.3. Daily Mean PM2.5 and BC Concentrations: Observed vs. Model for Selected Episodes
Episode 1: 23–25 October 2020
Relatively high concentrations of PM2.5 and BC were observed at both sites on 23 and 25 October 2020 and captured in the model in Figure 12. The CAMS-ENS model simulated an increase in the concentrations on 25 October, especially for PM2.5 in Sofia.
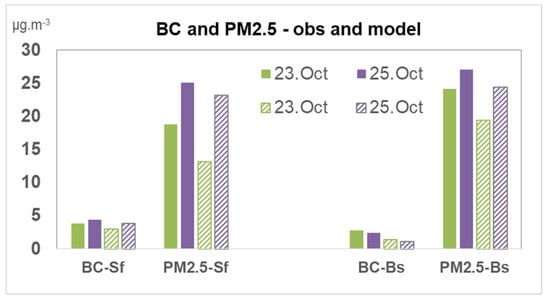
Figure 12.
BC and PM2.5 daily mean concentrations (µg.m−3) observed (solid fill) and modelled (hatched) on 23 October 2020 (green) and 25 October 2020 (purple).
The synoptic situation in the period 19–24 October 2020 was characterized by high pressure over southern and eastern Europe, favouring the accumulation of pollutants [74].
On 25 October, a perturbation, associated with the passage of a low-pressure center from the region of central Europe towards the Balkans, led to an upper air flow from the south-west to Bulgaria, as shown on the reanalysis maps for the geopotential height and wind at 700 hPa (Figure 13).
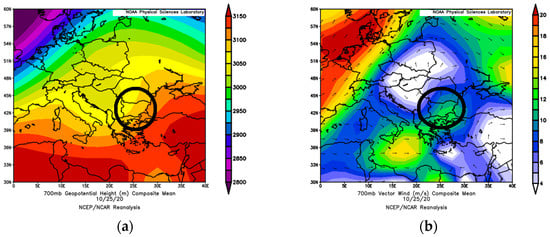
Figure 13.
NCEP/NCAR Reanalysis for 25 October 2020: (a) geopotential height (m) at 700 hPa, (b) wind vectors and speed (ms−1) at 700 hPa. Image provided by the NOAA/ESRL Physical Sciences Laboratory, Boulder Colorado from their Web site at http://psl.noaa.gov/ (accessed on 15 October 2021). Bulgaria is marked with a circle.
HYSPLIT back trajectories (Figure 14) indicated that the upper airflow (3000 m a.g.l.) was from the southern direction at both sites. However, at lower altitudes, due to the persistent high-pressure conditions, the winds were low, and temperature inversions on the surface and aloft were observed in Sofia in the morning and dissolved by midday.
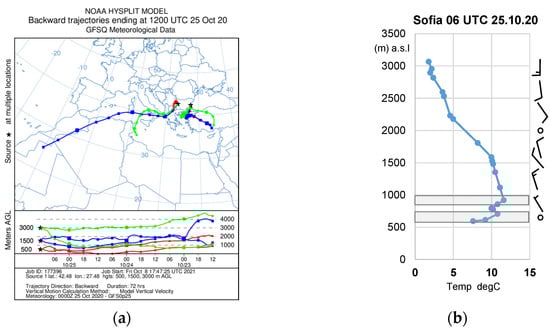
Figure 14.
HYSPLIT back-trajectories on 25 October 2010 (a); vertical profile of temperature at 06 UTC at NIMH-Sofia (b). Barbs indicate wind speed and direction; grey shaded rectangles are highlight inversion layers.
PM2.5 concentrations simulated by CAMS-ENS in the morning of 25 October 2020 (at 06UTC) were evident at a height of about 1000 m a.g.l (Figure 15a). Along with the plain areas, high PM2.5 values were noted south-west and south-east (Black Sea) of the country.
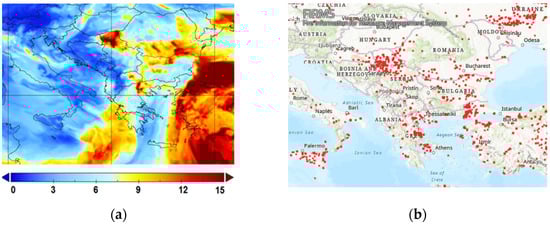
Figure 15.
PM2.5 (µg.m−3) from CAMS-ENS on 25 October 2020 06UTC, at height 1000 m a.g.l. (a); fires in the period 23–25 October 2020 as detected by satellites, NASA-FIRMS service- created from https://earthdata.nasa.gov/firms (accessed on 30 September 2021) (b).
Wildfires in the period 23–25 October 2020 were located south and west of Bulgaria, as detected by satellites and mapped by the NASA FIRMS (Fire Information for Resource Management System) service [73] (Figure 15b).
The analyses above suggest that the increased concentrations on 25 October 2010 were most likely due local emission sources in anti-cyclone atmospheric conditions over the country and an approaching perturbation from the west and the south-west, which led to a flow from regions affected by wildfires.
Episode 2: 20–21 January 2021
This episode was characterized by high observed BC and PM2.5 concentrations in Sofia, with a maximum for the month recorded on 21 January 2021. The observations in Burgas showed the highest values on 20 January 2021 (Figure 16). Contrary to the previous case, the modelled PM2.5 concentrations were much lower than the observed ones. The observed daily mean BC and PM2.5 concentrations in Sofia on 21 January 2021 reached values by more than 50% higher than on 20 January 2021, whereas the model indicated less than 10% change for these two days.
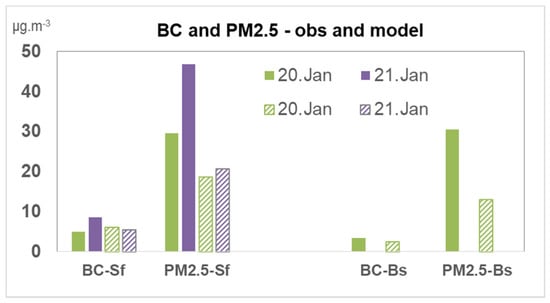
Figure 16.
BC and PM2.5 daily mean concentrations (µg.m−3) observed (solid fill) and modelled (hatched) on 20 January 2021 (green) and 21 January 2021 (purple).
The synoptic situation in the period 15–19 January 2021 was characterised by a deep upper trough, intensifying over northern and eastern Europe and leading to a deep surface cyclone with a centre north-east of Bulgaria (southern Ukraine) [75]. The cold spell led to daily mean temperatures in Sofia during this period between −2 °C and −7 °C. On 20 January 2021 and 21 January 2021, a ridge of high pressure from northern Africa extended towards the country; the upper air winds (3000 m a.g.l) were from the west and the north-west (Figure 17). This led to milder conditions and an increase in the daily temperatures of about 1 °C in Sofia. It also resulted in temperature inversions, affecting the air quality in the Sofia valley.
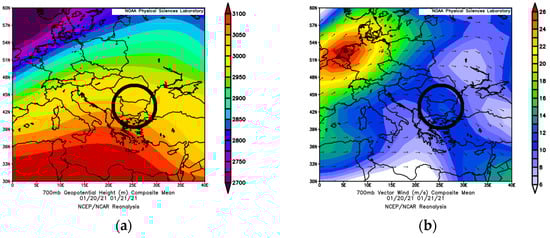
Figure 17.
NCEP/NCAR reanalysis composite map for 20–21 January 2021: (a) geopotential height (m) at 700 hPa, (b) wind vectors and speed (ms−1) at 700 hPa. Image provided by the NOAA/ESRL Physical Sciences Laboratory, Boulder Colorado from their Web site at http://psl.noaa.gov/ (accessed on 15 October 2021). Bulgaria is marked with a circle.
The sounding data for 21 January 2021 in Sofia indicate an inversion on 06 UTC, not only on the surface but also aloft (Figure 18). This elevated inversion layer remained through noon-time.
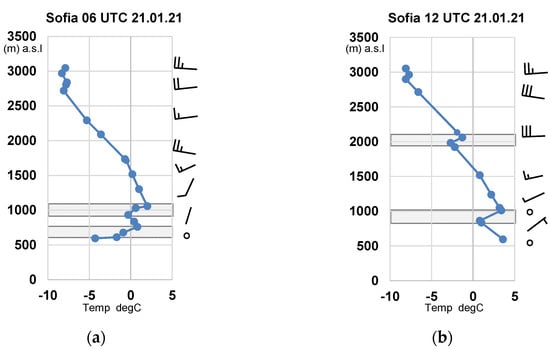
Figure 18.
Vertical profile of temperature at NIMH Sofia on 21 January 2021: (a) 06 UTC, (b) 12UTC. Barbs indicate wind speed and direction; grey shaded rectangles highlight inversion layers.
The bias between model and observed PM2.5 concentrations is approximately −55% at both sites, indicating that the model has difficulties in capturing the increase in concentrations under low wind conditions.
Modelled PM2.5 concentrations at 06 UTC on 21 January 2021 (Figure 19) showed higher values in Sofia and over the lower plains of central Bulgaria at approximately 50 m a.g.l. At a height of about 100 m, the accumulation of pollutants around Sofia was not evident.
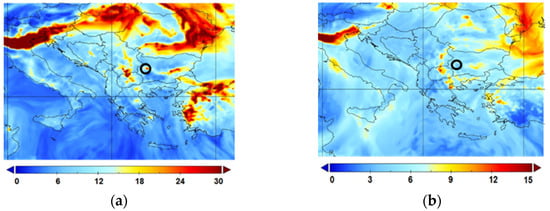
Figure 19.
PM2.5 (μg.m−3) from CAMS-ENS on 21.02.2021 at 06 UTC: (a) at 50 m a.g.l, (b) at 500 m a.g.l. Sofia is marked with a circle.
4. Discussion and Conclusions
For the first time in Bulgaria, fine particles (PM2.5) were analyzed for BC content. The reported results refer to data from field campaigns (October 2020 and January 2021) carried out in the cities of Sofia and Burgas. The mean contribution of BC to PM2.5 was estimated to be about 20% in Sofia and 11% in Burgas. However, on some days, BC concentrations might have contributed up to 34% of PM2.5 in Sofia and up to 19% of PM2.5 in Burgas. The mean BC concentrations for the two months were 3.03 μg.m−3 in Sofia and 1.69 μg.m−3 in Burgas. The higher concentrations in Sofia, the largest city in the country, are linked both to more emissions (predominantly from road transport and biomass burning for heating) and to the particular topographic and meteorological conditions in the two cities. In general, wind speeds in Sofia are lower than at seaside Burgas. This affected the dispersion, especially in winter. At the same time, during the winter, the lower temperatures in Sofia, compared to Burgas, led to more emissions from household heating. The effects of the local and regional meteorological conditions on BC and PM2.5 concentrations were investigated for two episodes with high daily mean BC concentrations (approximately 4.4–8.6 μg.m−3 in Sofia). The analysis showed that whereas the episode in October might have been influenced by regional airflow from areas with wildfires, the one in January was associated with temperature inversions.
The comparison of the obtained BC results in Sofia and those reported for other European cites shows values close to those measured in urban background stations in Madrid [25], in a suburban station of Athens [22], and in Ostrava [27]. These values are lower than those obtained in urban background stations in Zabrze, Poland [21]. The mean BC concentrations in Burgas were generally lower compared to the values recorded at most urban or urban background stations and closer to those for Helsinki [23] and Athens [22].
The maps for the spatial distribution of BC and PM2.5 over the country, constructed using model data by CAMS-ENS [41], revealed common features for the two months in the areas with elevated concentrations around Sofia, the Thracian lowlands of Southern Bulgaria, and the Danube plain in Northern Bulgaria. These areas correspond to the emissions zones where combustion from stationary sources is a prevailing contributor to anthropogenic PM2.5 emissions. It must be noted that the vast areas with elevated concentrations are outside of the country.
The comparison between observed and modelled concentrations showed a mean bias of approximately 21% (in absolute value) for PM2.5, with the highest underestimation by—42%—occurring in Burgas during January. In general, BC was underestimated by the model, especially in autumn, by approximately—34%. Other studies on evaluation of model performance for carbonaceous aerosol in Europe [35] have revealed an underestimation of seasonally averaged BC concentrations in the PM2.5 mass fraction by a maximum of 60%. The observations in [35] had a mean value of 1.5 μg.m−3 in the 2007 winter campaign and approximately 1.4 μg.m−3 in the 2008 autumn campaign. These values are lower than in our study, but they are representative of background conditions as obtained at sites of the EMEP network.
The reported results and analysis can be considered as the first step Bulgaria is taking towards gaining a better understanding of BC concentration in PM2.5 in the urban areas of the country. We have applied a variety of tools, analyzing observational data, modelling results, and meteorological parameters. They proved to be helpful in the investigation of elevated BC and PM concentrations during particular episodes.
However, more observational data for different seasons and further studies are needed to draw firm conclusions. A comparative measurement for BC concentration with MABI and AE33 on the territory of Sofia is planned.
We believe that the presented data contribute to filling in the gaps relevant to BC observations in Southeastern Europe.
Supplementary Materials
The following are available online at https://www.mdpi.com/article/10.3390/atmos13020213/s1, Figure S1. Example of log plot of wavelength data against log of all λ = 639 nm data; Figure S2. Mass absorption coefficients vs. wavelength (a) Sofia and (b) Burgas.
Author Contributions
Conceptualization, E.H. and E.G.; methodology, E.H., E.G. and B.V.; formal analysis, E.H., E.G., B.V., N.N., L.G.-M. and S.N.; writing—original draft preparation, E.H., E.G. and B.V.; visualization, E.H., E.G., N.N., R.N. and A.P.; project administration, E.H. All authors have read and agreed to the published version of the manuscript.
Funding
The research work was funded by Bulgarian National Science Fund through contract № KП-06-H 34/9, 19 December 2019.
Institutional Review Board Statement
Not applicable.
Informed Consent Statement
Not applicable.
Data Availability Statement
The data are available on request from the corresponding author.
Acknowledgments
We acknowledge the use of data and/or imagery from NASA’s Fire Information for Resource Management System (FIRMS), part of NASA’s Earth Observing System Data and Information System (EOSDIS). We also acknowledge the Global Emission InitiAtive data portal (ECCAD) for the archiving and distribution of the emissions data. We are grateful to Maria Hristova, a student at the American College in Sofia, for her help with the English language editing.
Conflicts of Interest
The authors declare no conflict of interest.
References
- European Environment Agency. Air Quality in Europe—2020 Report; Publications Office of the European Union: Luxembourg, 2020; ISBN 978-92-9480-292-7. [Google Scholar] [CrossRef]
- Samek, L.; Stegowski, Z.; Furman, L.; Fiedor, J. Chemical content and estimated sources of fine fraction of particulate matter collected in Krakow. Air Qual. Atmos. Health 2017, 10, 47–52. [Google Scholar] [CrossRef] [PubMed] [Green Version]
- Manousakas, M.; Diapouli, E.; Papaefthymiou, H.; Migliori, A.; Karydas, A.G.; Padilla-Alvarez, R.; Bogovac, M.; Kaiser, R.B.; Jaksic, M.; Bogdanovic-Radovic, I.; et al. Source apportionment by PMF on elemental concentrations obtained by PIXE analysis of PM10 samples collected at the vicinity of lignite power plants and mines in Megalopolis, Greece. Nucl. Instrum. Methods Phys. Res. 2015, 349, 114–124. [Google Scholar] [CrossRef]
- Almeida, S.M.; Manousakas, M.; Diapouli, E.; Kertesz, Z.; Samek, L.; Hristova, E.; Šega, K.; Padilla Alvarez, R.; Belis, C.A.; Eleftheriadis, K. The Iaea European Region Study GROUP, Ambient particulate matter source apportionment using receptor modelling in European and Central Asia urban areas. Environ. Pollut. 2020, 266, 115–199. [Google Scholar] [CrossRef] [PubMed]
- Putaud, J.-P.; Van Dingenen, R.; Alastuey, A.; Bauer, H.; Birmili, W.; Cyrys, J.; Flentje, H.; Fuzzi, S.; Gehrig, R.; Hansson, H.C.; et al. A European aerosol phenomenology 3: Physical and chemical characteristics of particulate matter from 60 rural, urban, and kerbside sites across. Eur. Atmos. Environ. 2010, 44, 1308–1320. [Google Scholar] [CrossRef]
- Meteorological Synthesizing Centre-West of EMEP (MSC-W); Chemical Co-ordinating Centre (CCC); Centre on Emission Inventories and Projections (CEIP). Transboundary Particulate Matter, Photo-Oxidants, Acidifying and Eutrophying Components; EMEP Status Report 1/2021; Norwegian Meteorological Institute: Oslo, Norway, 2021; ISSN 1504-6109 (print). [Google Scholar]
- Hristova, E.; Veleva, B. Variation of air particulate concentration in Sofia, 2005–2012. Bulg. J. Meteorol. Hydrol. 2013, 18, 47–56. [Google Scholar]
- Veleva, B.; Hristova, E.; Nikolova, E.; Kolarova, M.; Valcheva, R. Statistical evaluation of elemental composition data of PM10 air particulate in Sofia. Int. J. Environ. Pollut. 2015, 57, 175–188. [Google Scholar] [CrossRef]
- Hristova, E.; Veleva, B.; Georgieva, E.; Branzov, H. Application of Positive Matrix Factorization Receptor Model for Source Identification of PM10 in the City of Sofia, Bulgaria. Atmosphere 2020, 11, 890. [Google Scholar] [CrossRef]
- Sandradewi, J.; Prévôt, A.S.H.; Szidat, S.; Perron, N.; Alfarra, M.R.; Lanz, V.A.; Weingartner, E.; Baltensperger, U. Using aerosol light absorption measurements for the quantitative determination of wood burning and traffic emission contributions to particulate matter. Environ. Sci. Technol. 2008, 42, 3316–3323. [Google Scholar] [CrossRef] [PubMed]
- Gerlos-Nijland, M.; Lanki, T.; Salonen, R.; Cassee, F. Health Effects of Black Carbon; WHO Regional Office for Europe, The WHO European Centre for Environment and Health: Bonn, Germany, 2012. [Google Scholar]
- Petzold, A.; Ogren, J.A.; Fiebig, M.; Laj, P.; Li, S.-M.; Baltensperger, U.; Holzer-Popp, T.; Kinne, S.; Pappalardo, G.; Sugimoto, N.; et al. Recommendations for reporting “black carbon” measurements. Atmos. Chem. Phys. 2013, 13, 8365–8379. [Google Scholar] [CrossRef] [Green Version]
- Hitzenberger, R.; Petzold, A.; Bauer, H.; Ctyroky, P.; Pouresmaeil, P.; Laskus, L.; Puxbaum, H. Intercomparison of Thermal and Optical Measurement Methods for Elemental Carbon and Black Carbon at an Urban Location Environ. Sci. Technol. 2006, 40, 6377–6383. [Google Scholar] [CrossRef] [Green Version]
- Peralta, O.; Ortínez-Alvarez, A.; Basaldud, R.; Santiago, N.; Alvarez-Ospina, H.; de la Cruz, K.; Barrera, V.; de la Luz Espinosa, M.; Saavedra, I.; Castro, T.; et al. Atmospheric black carbon concentrations in Mexico. Atmos. Res. 2019, 230, 104–626. [Google Scholar] [CrossRef]
- Mousavi, A.; Sowlat, M.; Lovett, C.; Rauber, M.; Szidat, S.; Boffi, R.; Borgini, A.; De Marco, C.; Ruprecht, A.; Sioutas, C. Source apportionment of black carbon (BC) from fossil fuel and biomass burning in metropolitan Milan, Italy. Atmos. Environ. 2019, 203, 252–261. [Google Scholar] [CrossRef]
- Bond, T.C.; Doherty, S.J.; Fahey, D.W.; Forster, P.M.; Berntsen, T.; DeAngelo, B.J.; Flanner, M.G.; Ghan, S.; Kärcher, B.; Koch, D.; et al. Bounding the role of black carbon in the climate system: A scientific assessment. JGA Atmos. 2013, 118, 5380–5552. [Google Scholar] [CrossRef]
- World Health Organization (WHO). WHO Global Air Quality Guidelines: Particulate Matter (PM2.5 and PM10), Ozone, Nitrogen Dioxide, Sulfur Dioxide and Carbon Monoxide; World Health Organization: Geneva, Switzerland, 2021. [Google Scholar]
- Manoj, M.; Satheesh, S.; Moorthy, K.; Gogoi, M.; Babu, S. Decreasing trend in black carbon aerosols over the Indian region. Geophys. Res. Lett. 2019, 46, 2903–2910. [Google Scholar] [CrossRef]
- Bessagnet, B.; Allemand, N. Review on Black Carbon (BC) and Polycyclic Aromatic Hydrocarbons (PAHs) Emission Reductions Induced by PM Emission Abatement Techniques; TFTEI Techno-Scientific Secretariat: Paris, France, 2020; p. 156. [Google Scholar]
- Kunder, R.D.; Schneidemesser, E.; Kuik, F.; Quedenau, J.; Weatherhead, E.C.; Schmale, J. Long-term monitoring of black carbon across Germany. Atmos. Environ. 2018, 185, 41–52. [Google Scholar]
- Zioła, N.; Błaszczak, B.; Klejnowski, K. Long-Term eBC Measurements with the Use of MAAP in the Polluted Urban Atmosphere (Poland). Atmosphere 2021, 12, 808. [Google Scholar] [CrossRef]
- Diapouli, E.; Kalogridis, A.-C.; Markantonaki, C.; Vratolis, S.; Fetfatzis, P.; Colombi, C.; Eleftheriadis, K. Annual Variability of Black Carbon Concentrations Originating from Biomass and Fossil Fuel Combustion for the Suburban Aerosol in Athens, Greece. Atmosphere 2017, 8, 234. [Google Scholar] [CrossRef] [Green Version]
- Helin, A.; Niemi, J.V.; Virkkula, A.; Pirjola, L.; Teinilä, K.; Backman, J.; Aurela, M.; Saarikoski, S.; Rönkkö, T.; Asmi, E.; et al. Characteristics and source apportionment of black carbon in the Helsinki metropolitan area, Finland. Atmos. Environ. 2018, 190, 87–98. [Google Scholar] [CrossRef]
- Beekmann, M.; Prévôt, A.S.H.; Drewnick, F.; Sciare, J.; Pandis, S.N.; Denier van der Gon, H.A.C.; Crippa, M.; Freutel, F.; Poulain, L.; Ghersi, V.; et al. In Situ, satellite measurement and model evidence on the dominant regional contribution to fine particulate matter levels in the Paris megacity. Atmos. Chem. Phys. 2015, 15, 9577–9591. [Google Scholar] [CrossRef] [Green Version]
- Becerril-Valle, M.; Coz, E.; Prévôt, A.S.H.; Mocnik, G.; Pandis, S.N.; Sánchez de la Campa, A.M.; Alastuey, A.; Díaz, E.; Pérez, R.M.; Artíñano, B. Characterization of atmospheric black carbon and co-pollutants in urban and rural areas of Spain. Atmos. Environ. 2017, 169, 36–53. [Google Scholar] [CrossRef]
- Kucbel, M.; Corsaro, A.; Švédová, B.; Raclavská, H.; Raclavský, K.; Juchelková, D. Temporal and seasonal variations of black carbon in a highly polluted European city: Apportionment of potential sources and the effect of meteorological conditions. J. Environ. Manag. 2017, 203, 1178–1189. [Google Scholar] [CrossRef] [PubMed]
- Bernardoni, V.; Ferrero, L.; Bolzacchini, E.; Forello, A.C.; Gregorič, A.; Massabò, D.; Močnik, G.; Prati, P.; Rigler, M.; Santagostini, L.; et al. Determination of Aethalometer multiple-scattering enhancement parameters and impact on source apportionment during the winter 2017/18 EMEP/ACTRIS/COLOSSAL campaign in Milan. Atmos. Meas. Tech. 2021, 14, 2919–2940. [Google Scholar] [CrossRef]
- Krol, M.; Houweling, S.; Bregman, B.; van den Broek, M.; Segers, A.; van Velthoven, P.; Peters, W.; Dentener, F.; Bergamaschi, P. The two-way nested global chemistry-transport zoom model TM5: Algorithm and applications. Atmos. Chem. Phys. 2005, 5, 417–432. [Google Scholar] [CrossRef] [Green Version]
- Gelaro, R.; McCarty, W.; Suárez, M.J.; Todling, R.; Molod, A.; Takacs, L.; Randles, C.; Darmenov, A.; Bosilovich, M.G.; Reichle, R.; et al. The Modern-Era Retrospective Analysis for Research and Applications, Version 2 (MERRA-2). J. Clim. 2017, 30, 5419–5454. [Google Scholar] [CrossRef]
- Schaap, M.; Van Der Gon, H.A.C.D.; Dentener, F.J.; Visschedijk, A.J.H.; Van Loon, M.; ten Brink, H.M.; Putaud, J.P.; Guillaume, B.; Liousse, C.; Builtjes, P.J.H. Anthropogenic black carbon and fine aerosol distribution over Europe. J. Geophys. Res. 2004, 109, D18207. [Google Scholar] [CrossRef] [Green Version]
- Tsyro, S.; Simpson, D.; Tarrason, L.; Klimont, Z.; Kupiainen, K.; Pio, C.; Yttri, K. Modeling of elemental carbon over Europe. J. Geophys. Res. 2007, 112, D23S19. [Google Scholar] [CrossRef] [Green Version]
- Ramanathan, V.; Carmichael, G. Global and regional climate changes due to black carbon. Nat. Geosci. 2008, 1, 221–227. [Google Scholar] [CrossRef]
- Vignati, E.; Karl, M.; Krol, M.; Wilson, J.; Stier, P.; Cavalli, F. Sources of uncertainties in modelling black carbon at the global scale. Atmos. Chem. Phys. 2010, 10, 2595–2611. [Google Scholar] [CrossRef] [Green Version]
- Prank, M.; Sofiev, M.; Tsyro, S.; Hendriks, C.; Semeena, V.; Vazhappilly Francis, X.; Butler, T.; Denier van der Gon, H.; Friedrich, R.; Hendricks, J.; et al. Evaluation of the performance of four chemical transport models in predicting the aerosol chemical composition in Europe in 2005. Atmos. Chem. Phys. 2016, 16, 6041–6070. [Google Scholar] [CrossRef] [Green Version]
- Mircea, M.; Bessagnet, B.; D’Isidoro, M.; Pirovano, G.; Aksoyoglu, S.; Ciarelli, G.; Tsyro, S.; Manders, A.; Bieser, J.; Stern, R. EURODELTA III exercise: An evaluation of air quality models’ capacity to reproduce the carbonaceous aerosol. Atmos. Environ. X 2019, 2, 100018. [Google Scholar] [CrossRef]
- Kuik, F.; Lauer, A.; Beukes, J.P.; Van Zyl, P.G.; Josipovic, M.; Vakkari, V.; Laakso, L.; Feig, G.T. The anthropogenic contribution to atmospheric black carbon concentrations in southern Africa: A WRF-Chem modeling study. Atmos. Chem. Phys. 2015, 15, 8809–8830. [Google Scholar] [CrossRef] [Green Version]
- Morino, Y.; Nagashima, T.; Sugata, S.; Sato, K.; Tanabe, K.; Noguchi, T.; Takami, A.; Tanimoto, H.; Ohara, T. Verification of Chemical Transport Models for PM2.5 Chemical Composition Using Simultaneous Measurement Data over Japan. Aerosol Air Qual. Res. 2015, 15, 2009–2023. [Google Scholar] [CrossRef] [Green Version]
- Permadi, D.A.; Kim Oanh, N.T.; Vautard, R. Integrated emission inventory and modeling to assess distribution of particulate matter mass and black carbon composition in Southeast Asia. Atmos. Chem. Phys. 2018, 18, 2725–2747. [Google Scholar] [CrossRef] [Green Version]
- Hristova, E.; Veleva, B. Estimation of black carbon concentration in fine particulate matter in urban area. In Proceedings of the 20th International Multidisciplinary Scientific GeoConference SGEM 2020, Albena, Bulgaria, 16–25 August 2020; Volume 20, pp. 415–422. [Google Scholar]
- Hristova, E.; Veleva, B.; Naydenova, S.; Gonsalvesh-Musakova, L. Air particulate matter and black carbon concentrations during winter time at two Bulgarian urban sites. In Proceedings of the 21st International Multidisciplinary Scientific GeoConference SGEM 2021, Albena, Bulgaria, 14–22 August 2021. in press. [Google Scholar]
- Copernicus Atmosphere Monitoring Service. Available online: https://atmosphere.copernicus.eu/ (accessed on 18 October 2021).
- National Statistical Institute. Available online: https://www.nsi.bg/en/content/6710/population-towns-and-sex (accessed on 1 June 2021).
- Hak, C.; Sivertsen, B. Mission Report. Burgas, 1–12 March 2010—Screening Study; NILU OR, Scientific Reports—OR 39/2010; Norwegian Institute for Air Research: Kjeller, Norway, 2010; ISBN 978-82-425-2238-2. [Google Scholar]
- National State of the Environment Report. Available online: http://eea.government.bg/en/output/soe-report/index.html (accessed on 10 October 2021).
- EMEP Centre on Emission Inventories and Projections. Data Viewer—Reported Emissions Data. Available online: https://www.ceip.at/data-viewer (accessed on 10 October 2021).
- Program for Improving the Quality of the Atmospheric Air on the Territory of Sofia Municipality for the Period 2021–2026. Available online: https://www.sofia.bg/en/programa-kav (accessed on 5 October 2021).
- Program for Improving the Quality of the Atmospheric Air on the Territory of Burgas Municipality for the Period 2021–2026. Available online: https://www.burgas.bg/bg/programi/ (accessed on 5 October 2021).
- Dimitrova, R.; Velizarova, M. Assessment of the Contribution of Different Particulate Matter Sources on Pollution in Sofia City. Atmosphere 2021, 12, 423. [Google Scholar] [CrossRef]
- Manohar, M.; Atanacio, A.; Button, D.; Cohen, D. MABI—A multi-wavelength absorption black carbon instrument for the measurement of fine light absorbing carbon particles. Atmos. Pollut. Res. 2021, 12, 133–140. [Google Scholar] [CrossRef]
- Cohen, D.D. Summary of Light Absorbing Carbon and Visibility Measurements and Terms; ANSTO/External Report ER-790; Australian Nuclear Science and Technology Organisation: Sydney, Australia, 2020; ISBN 1-921268-32-8. [Google Scholar]
- Leskinen, A.; Ruuskanen, A.; Kolmonen, P.; Zhao, Y.; Fang, D.; Wang, Q.; Gu, C.; Jokiniemi, J.; Hirvonen, M.R.; Lehtinen, K.E.; et al. The Contribution of Black Carbon and Non-BC Absorbers to the Aerosol Absorption Coefficient in Nanjing, China. Aerosol Air Qual. Res. 2020, 20, 590–605. [Google Scholar] [CrossRef]
- Alas, H.D.C.; Müller, T.; Weinhold, K.; Pfeifer, S.; Glojek, K.; Gregorič, A.; Močnik, G.; Drinovec, L.; Costabile, F.; Ristorini, M.; et al. Performance of microAethalometers: Real-world Field Intercomparisons from Multiple Mobile Measurement Campaigns in Different Atmospheric Environments. Aerosol Air Qual. Res. 2020, 20, 2640–2653. [Google Scholar] [CrossRef]
- Bond, T.C.; Anderson, T.L.; Campbell, D. Calibration and intercomparison of filter-based measurements of visible light absorption by aerosols. Aerosol Sci. Technol. 1999, 30, 582–600. [Google Scholar] [CrossRef]
- Ogren, J.A.; Wendell, J.; Andrews, E.; Sheridan, P.J. Continuous light absorption photometer for long-term studies. Atmos. Meas. Tech. 2017, 10, 4805–4818. [Google Scholar] [CrossRef] [Green Version]
- Weingartnera, E.; Saatho, H.; Schnaiter, M.; Streit, N.; Bitnar, B.; Baltensperger, U. Absorption of light by soot particles: Determination of the absorption coeffcient by means of aethalometers. Aerosol Sci. 2003, 34, 1445–1463. [Google Scholar] [CrossRef]
- Virkkula, A.; Ahlquist, N.; Covert, D.; Arnott, W.; Sheridan, P.J.; Quinn, P.; Coffman, D. Modification, Calibration and a Field Test of an Instrument for Measuring Light Absorption by Particles. Aerosol Sci. Technol. 2005, 39, 68–83. [Google Scholar] [CrossRef]
- Virkkula, A.; Mäkelä, T.; Hillamo, R.; Yli-Tuomi, T.; Hirsikko, A.; Hämeri, K.; Koponen, I. A Simple Procedure for Correcting Loading Effects of Aethalometer Data. J. Air Waste Manag. Assoc. 2007, 57, 1214–1222. [Google Scholar] [CrossRef] [PubMed]
- Drinovec, L.; Močnik, G.; Zotter, P.; Prévôt, A.S.H.; Ruckstuhl, C.; Coz, E.; Rupakheti, M.; Sciare, J.; Müller, T.; Wiedensohler, A.; et al. The “dual-spot” Aethalometer: An improved measurement of aerosol black carbon with real-time loading compensation. Atmos. Meas. Tech. 2015, 8, 1965–1979. [Google Scholar] [CrossRef] [Green Version]
- Drinovec, L.; Gregorič, A.; Zotter, P.; Wolf, R.; Bruns, E.; Prévôt, A.S.H.; Petit, J.-E.; Favez, O.; Sciare, J.; Arnold, I.J.; et al. The filter-loading effect by ambient aerosols in filter absorption photometers depends on the coating of the sampled particles. Atmos. Meas. Tech. 2017, 10, 1043–1059. [Google Scholar] [CrossRef] [Green Version]
- World Meteorological Organization (WMO); Global Atmosphere Watch (GAW). WMO/GAW Aerosol Measurement Procedures, Guidelines and Recommendations, 2nd ed.; GAW Report No. 227; World Meteorological Organization: Geneva, Switzerland, 2016; ISBN 978-92-63-11177-7. [Google Scholar]
- Arnott, W.; Hamasha, K.; Moosmüller, H.; Sheridan, P.; Ogren, J. Towards Aerosol Light-Absorption Measurements with a 7-Wavelength Nethalometer: Evaluation with a Photoacoustic Instrument and 3-Wavelength Nephelometer. Aerosol Sci. Technol. 2005, 39, 17–29. [Google Scholar] [CrossRef]
- Segura, S.; Estellés, V.; Titos, G.; Lyamani, H.; Utrillas, M.P.; Zotter, P.; Prévôt, A.S.H.; Močnik, G.; Alados-Arboledas, L.; Martínez-Lozano, J.A. Determination and analysis of in situ spectral aerosol optical properties by a multi-instrumental approach. Atmos. Meas. Tech. 2014, 7, 2373–2387. [Google Scholar] [CrossRef] [Green Version]
- Marécal, V.; Peuch, V.-H.; Andersson, C.; Andersson, S.; Arteta, J.; Beekmann, M.; Benedictow, A.; Bergström, R.; Bessagnet, B.; Cansado, A.; et al. A regional air quality forecasting system over Europe: The MACC-II daily ensemble production. Geosci. Model Dev. 2015, 8, 2777–2813. [Google Scholar] [CrossRef] [Green Version]
- Rémy, S.; Kipling, Z.; Flemming, J.; Boucher, O.; Nabat, P.; Michou, M.; Bozzo, A.; Ades, M.; Huijnen, V.; Benedetti, A.; et al. Description and evaluation of the tropospheric aerosol scheme in the European Centre for Medium-Range Weather Forecasts (ECMWF) Integrated Forecasting System (IFS-AER, cycle 45R1). Geosci. Model Dev. 2019, 12, 4627–4659. [Google Scholar] [CrossRef] [Green Version]
- Granier, C.; Darras, S.; Denier van der Gon, H.A.C.; Doubalova, J.; Elguindi, N.; Galle, B.; Gauss, M.; Guevara, M.; Jalkanen, J.-P.; Kuenen, J.; et al. The Copernicus Atmosphere Monitoring Service Global and Regional Emissions (April 2019 Version); Copernicus Atmosphere Monitoring Service (CAMS) Report, 2019; Copernicus Atmosphere Monitoring Service: Reading, UK, 2019. [Google Scholar] [CrossRef]
- Kuenen, J.; Dellaert, S.; Visschedijk, A.; Jalkanen, J.-P.; Super, I.; Denier van der Gon, H. Copernicus Atmosphere Monitoring Service regional Emissions Version 4.2 (CAMS-REG-v4.2); Copernicus Atmosphere Monitoring Service: Reading, UK, 2021. [Google Scholar] [CrossRef]
- Copernicus Atmosphere Monitoring Service (CAMS). Regional Production, Updated Documentation Covering All Regional Operational Systems and the ENSEMBLE: Following U2 Upgrade, February 2020; CAMS—ECMWF Report, Isuued by METEO-FRANCE/G. Collin, CAMS50_2018SC2_D2.0.2-U2_Models_documentation_202003_v2; Copernicus Atmosphere Monitoring Service: Reading, UK, 2020. [Google Scholar]
- CAMS European Air Quality Forecasts, ENSEMBLE Data; Copernicus Atmosphere Monitoring Service (CAMS), Atmosphere Data Store (ADS). Available online: https://ads.atmosphere.copernicus.eu/cdsapp#!/dataset/cams-europe-air-quality-forecasts?tab=overview (accessed on 11 October 2021).
- Stein, A.F.; Draxler, R.R.; Rolph, G.D.; Stunder, B.J.B.; Cohen, M.D.; Ngan, F. NOAA’s HYSPLIT atmospheric transport and dispersion modeling system. Bull. Am. Meteor. Soc. 2015, 96, 2059–2077. [Google Scholar] [CrossRef]
- Rolph, G.; Stein, A.; Stunder, B. Real-time Environmental Applications and Display sYstem: READY. Environ. Model. Softw. 2017, 95, 210–228. [Google Scholar] [CrossRef]
- Kalnay, E.; Kanamitsu, M.; Kistler, R.; Collins, W.; Deaven, D.; Gandin, L.; Iredell, M.; Saha, S.; White, G.; Woollen, J.; et al. The NCEP/NCAR 40-Year Reanalysis Project. Bull. Am. Meteorol. Soc. 1996, 77, 437–472. [Google Scholar] [CrossRef] [Green Version]
- National Oceanic and Atmospheric Administration, Earth System Research Laboratories (NOAA/ESRL). Available online: https://psl.noaa.gov/data/composites/day/ (accessed on 15 October 2021).
- Emissions of Atmospheric Compounds and Compilation of Ancillary Data (ECCAD). Available online: https://eccad3.sedoo.fr/#CAMS-REG-AP (accessed on 15 October 2021).
- National Institute of Meteorology and Hydrology of Bulgaria. Monthly Hydrometeorological Bulletin; National Institute of Meteorology and Hydrology of Bulgaria: Sofia, Bulgaria, 2021; ISSN 1314-894X. Available online: http://www.meteo.bg/ (accessed on 15 October 2021).
- Fire Information for Resource Management System Service. Available online: https://firms.modaps.eosdis.nasa.gov (accessed on 5 October 2021).
Publisher’s Note: MDPI stays neutral with regard to jurisdictional claims in published maps and institutional affiliations. |
© 2022 by the authors. Licensee MDPI, Basel, Switzerland. This article is an open access article distributed under the terms and conditions of the Creative Commons Attribution (CC BY) license (https://creativecommons.org/licenses/by/4.0/).