Abstract
Stationary models are usually applied for wind characteristics analysis. However, nonstationarity has been found in the field measurements of typhoons in recent studies; therefore, using traditional models with stationary assumptions to conduct wind characteristics is inadequate. In this research, data acquisition of typhoon wind speeds and monsoon are conducted based on the wind field measurements. Wind speeds of typhoon “Maria” passing through Pintan, Fujian Province, China and the monsoon from 2017.10–2018.10 were obtained to investigate wind characteristics. The run test method is utilized to show that non-stationarity exists in both typhoon and monsoon wind speed, and the percent of non-stationary increases with the increase in time interval. Additionally, results show that stronger non-stationarity exists in typhoon wind speed compared with monsoons. Based on a self-adaptive procedure to extract time varying mean wind speed, a non-stationary model is established to compare with the non-stationary model, which has been applied in the traditional wind characteristic analysis. The fluctuating wind characteristics such as turbulence intensity, gust factor, turbulence integral scale, and wind speed spectrum are analyzed to compare the two models. Results show that the difference of such characteristics between the two models increases with the time interval, indicating the necessity of consideration of non-stationary models, especially for design specifications with larger time intervals. Influences of time intervals are investigated, and relevant recommendations are provided for wind resistance specifications. Our conclusions may provide reference for wind resistance design in engineering applications.
1. Introduction
Wind characteristics, especially fluctuating wind characteristics, play an important role in the civil engineering design of high buildings and large-span bridges. Extreme weather, such as typhoons or hurricanes, can cause severe damage to structures. Numerous studies have been conducted on the wind characteristics of typhoons. However, typhoon winds are often assumed to be a stationary random process when considering the wind effect on structures [1,2,3,4].
For a stationary process, the statistical characteristics and autocorrelation function will not change with time; however, they are time varying for non-stationary processes [5,6]. Stationary assumptions are normally used to simulate and analyze wind characteristics. Wind characteristics are calculated with the assumption that the fluctuating component of wind speed in a considered time interval is a zero-mean stationary Gaussian random process, and this has been adopted in specifications in many countries. However, the recorded wind speed of wind field measurements shows strong non-stationarity in considered time intervals [6,7,8]. In engineering applications, considering different time intervals, the wind speed is usually decomposed as a sum of the mean wind speed of wind samples and a fluctuating component that is considered a Gaussian stationary random process [9]. For a non-stationary model, a slowly varying mean and a fluctuating component are usually adopted. The most important step in non-stationary analysis is to extract the slow time-varying mean wind speed in a considered window.
Numerous techniques have been used to obtain the time-varying mean wind speed, such as the moving average technique [10,11,12,13], discrete wavelet transform (DWT) [14], and empirical mode decomposition (EMD) [15]. Their results have shown that wind characteristic parameters calculated by stationary and non-stationary models have large differences. Tao compared two models by investigating wind characteristics from typhoon wind measurements at Sutong Bridge [16]. Their results showed that the turbulence intensity and gust factor from the non-stationary model are smaller than those from the non-stationary model. Although numerous studies have been carried out on non-stationary models, there are still some issues to be solved in the existing methods. For example, the selection of the weighting function has a significant influence on the analysis of results for the moving average technique.
Non-stationary models are also applied for simulations [17] or wind tunnel tests in recent research [18,19]. Li [20] conducted a simulation of a non-stationary wind field on bridges combing the fast Fourier transformation, Cholesky decomposition and Taylor series expansion. The simulation of non-stationary wind speed will directly induce non-stationary wind load on structures. Therefore, by considering wind as a non-stationary excitation, the responses of the structures are investigated by Orlando [21] and Ke [22]. The comparison between stationary and non-stationary models is fully investigated by Tao’s research group. The wind characteristics of different typhoons calculated based on both stationary and non-stationary models are investigated by Tao and Wang, such as typhoon Damrey [23] and typhoon Fung-Wong [16]. Results show that the wind characteristics such as gust factor are smaller in non-stationary models. Moreover, Tao [16,24,25] conducted the evolutionary power spectrum density (EPSD) analysis to show the time-varying properties of turbulence.
Although non-stationarity has been recognized in typhoon processes, few studies on the non-stationarity of monsoon wind speed have been conducted. Additionally, the influence of considered time interval is not very clear. In this research, we obtained recorded wind speed of both monsoons and typhoon by field measurements. Non-stationary tests are conducted for both typhoon wind speed and monsoon wind samples. Wind characteristics, such as the wind profile, turbulence intensity, integral scale, and power spectrum density, are compared from stationary and non-stationary models with different time intervals. The influence of time intervals on the wind characteristics by these two models are investigated as well.
2. Data Description
The wind speed data used in this research were derived from wind field measurements on Yutou Island in Pingtan County in Fujian Province, China, with latitude 25°37′56″ N and longitude 119°34′45″ E. A 100 m tower was built in 2017 with three sonic anemometers and six vane-type anemometers installed. The figures of the wind tower and anemometers and the surroundings of the wind tower can be seen in Figure 1a; the location of the measurement site can be seen in Figure 1b. Sonic anemometers were installed at the 10 m, 80 m, and 100 m heights of the tower, and the vane type anemometers were installed at 10 m, 30 m, 50 m, 80 m, 90 m, and 100 m heights of the tower. The sonic anemometers applied were high-performance Wind Master Pro produced by UK Gill Company, which can record wind speeds 0–65 m/s with sampling frequency 10 Hz, and 1 Hz wind speed data could be recorded by vane type anemometers. It should be mentioned that it is a long-term wind speed capture system. The wind speed data from 5 November 2017 to 5 November 2018 were recorded. A typhoon process in 2018 was captured. On 11 July 2018, Typhoon “Maria” in the west Pacific Ocean landed in Lianjiang, Huangqi Peninsula, Fujian Province, China, with a maximum wind speed of 42 m/s and a central minimum pressure of 960 hPa and moved toward the northwest at a speed of 15 km/h [26]. The measurement site is approximately 83.61 km away from the typhoon landing center. The landing path and measurement site are shown in Figure 2 [26]. The track of typhoon ‘Maria’ in Figure 2 is from the real-time system of typhoons issued by Zhejiang Provincial Department of Water Resources and the Zhejiang Provincial Water Resources Information Management Center in China [27].
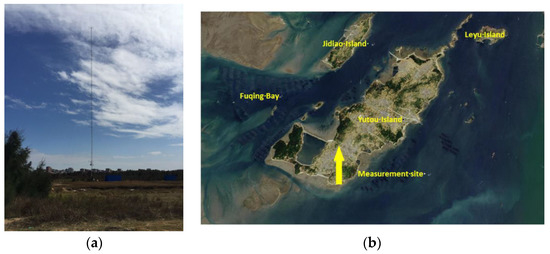
Figure 1.
(a) Measurement site, (b) location the measurement site. Meteorological tower and location of the measurement site.
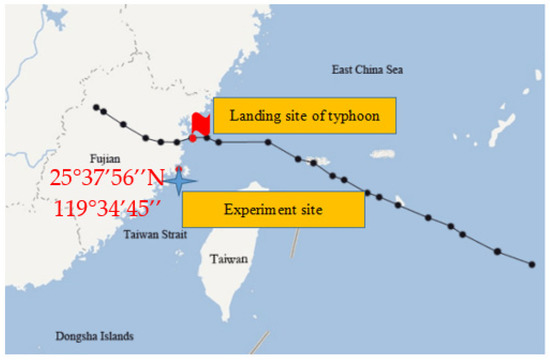
Figure 2.
The path of Typhoon “Maria” [26].
The sonic anemometers can record wind speed in three dimensions, as x, y, and z directions, which are referred to as longitudinal, lateral, and vertical, respectively, in the following description. The directions of three dimensions can be seen in Figure 3, in which the direction of ux is the same as the north direction. The mean wind speed and wind angle of the recorded wind speed at a considered time interval (10 min in Chinese code) can be calculated as Equation (1).
in which is the mean wind speed at a considered time interval; , , are the recorded there dimensional wind speed at x, y, z directions, respectively; and , , are the corresponding mean wind speed within a time interval in the three directions. is the wind angle. The fluctuating wind speeds can be expressed as:
where u(t), v(t), and w(t) are fluctuating wind speeds in longitudinal, lateral, and vertical directions, respectively, which can be used for wind characteristics analysis.
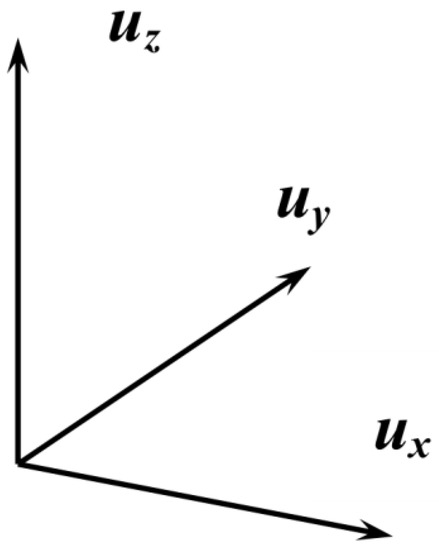
Figure 3.
Coordinate of the recorded wind directions.
3. Non-Stationary Test
Both monsoon and typhoon processes are recorded in the wind field measurements. Figure 4 and Figure 5 show the time series of wind samples for Typhoon “Maria” (from 0:00 to 24:00, 11 July 2018) and 24 h monsoon winds (from 0:00 to 24:00, 3 January 2018), respectively. It should be mentioned that the field measurement site may be influenced by typhoon in summer; therefore, to distinguish typhoon from monsoon wind speed, the wind speed data from 0:00 to 24:00, 3 January 2018 is selected to represent monsoon wind speed for future analysis. As shown in Figure 4, typhoon wind speed varies significantly with time, suggesting that a time-varying mean wind speed may exist in the typhoon wind speed. We used two non-stationary test methods, autocorrelation and hypothesis testing, to verify the stationary characteristics of the time series. The autocorrelation method is a qualitative test based on the display characteristics of the time sequence diagram and autocorrelation diagram.
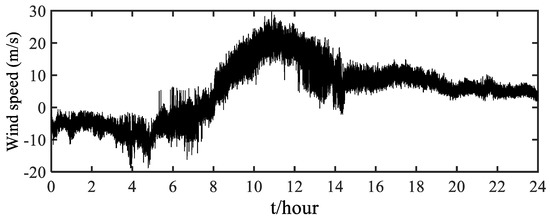
Figure 4.
Wind speed in the x-direction at 80 m height.
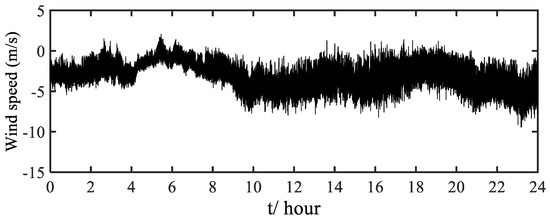
Figure 5.
Monsoon wind speed in the x-direction at 80 m height.
Figure 6 shows the autocorrelation and partial autocorrelation of the 10 min wind speed sample of Typhoon “Maria”. The sample autocorrelation decreases slowly with increasing time lag, indicating that the correlation of the wind speed point cannot be neglected, which can be qualitatively determined as a non-stationary process. A hypothesis test method called the runs test method, which has been widely used for non-stationary tests [28] and developed for two sample tests [29], is applied in this research. The procedure of the method can be expressed as follows.
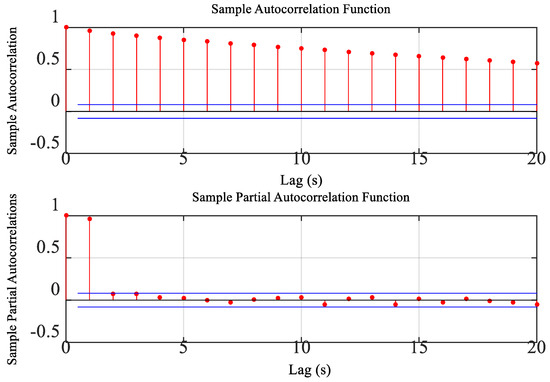
Figure 6.
Autocorrelation and partial autocorrelation for wind speed of Typhoon “Maria”.
Consider the hypothesis that the time series are stationary.
- (1)
- Divide the data to be tested into N segments and calculate the covariance for each segment as , .
- (2)
- When , the segment will be recorded as +, and when , the segment will be recorded as −; define a continuous sequence with the same sign as the run.
- (3)
- Record the run number with + as N1 and − as N2; when N1 + N2 > 30, the statistics can be regarded as large statistics, the number of runs r approximately obeys the normal distribution, and the test statistic is
To conduct the run test method, the number of segment N is set as 200, indicating that, for a 10 min time interval, there are 30 data points for each segment. The non-stationary test results can be seen in Table 1 and Figure 7, with the percent of non-stationary tests of wind speed data considering sample windows of 10 min, 20 min, 30 min, and 60 min. The results show that non-stationary time series exist in the wind speed data. When considering a time window of 60 min, the non-stationary ratio can reach 100%. In general, the percentage of non-stationary data for tropical cyclones is larger than that for monsoon data.

Table 1.
Percentage of non-stationary samples at different sample windows.
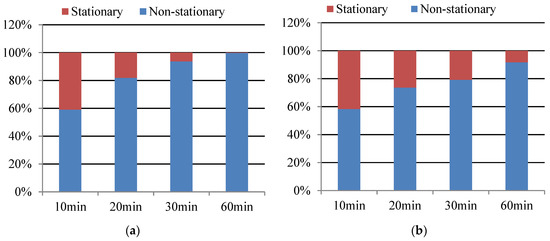
Figure 7.
Percent of non-stationary samples at different sample windows: (a) typhoon and (b) monsoon.
4. Wind Characteristics from Stationary and Non-Stationary Models
In the traditional analysis of wind characteristics, the wind speed is assumed to be a stationary random process with a constant mean. For a non-stationary process, the mean value is time varying, and the corresponding fluctuating component will be changed as a consequence. Table 2 lists the calculation models for both stationary and non-stationary analyses. In this table, U(t) and are the recorded and constant mean wind speed, respectively, is the turbulence intensity, and σi (i = u, v, w) are the standard deviations at longitudinal, lateral, and vertical direction, respectively. is the gust factor with duration tg at time interval T, and , and (i = u, v, w) are the turbulence integral scales and autocorrelation functions, respectively. The symbols with stars in non-stationary model indicate time varying components.

Table 2.
Comparison of wind characteristic parameters between non-stationary and stationary wind models.
In non-stationary models, the first and most important part is to estimate the time varying mean wind speed. Research has been conducted to obtain the slow trend of non-stationary wind speed through different methods, such as the empirical mode decomposition (EMD) method and the wavelet decomposition (WD) method. The wavelet decomposition method is applied by Chen [15] and Wang [14] to obtain time-varying mean speed at different decomposition levels. Tao [16] presented a self-adaptive method to obtain the time-varying method in comparing stationary and non-stationary models by using wavelet decompositions. In this study, the EMD method is applied to derive a self-adaptive method to get the time varying mean constant with these steps. Firstly, the procedure starts with the recorded wind speed by decomposing the wind speed with application of the EMD method. Then, the wind speed can be determined as, and ci(t) is the wind speed components. By the implantation of EMD method, the wind speed can be decomposed at N levels, and the low frequency components can be obtained. When we reconstruct the low-frequency component at Nth level as L(t), low-frequency components from the original data can be separated as u(t), which can be regarded as turbulent components. Then, a stationary test of the turbulent components can be conducted, namely u(t) with the run test method; if the component is stationary, then time-varying mean can be obtained as L(t); if the component is non-stationary, N can be set as N − 1, and the previous steps should be repeated. To make the procedure more clearly, a flow chart of calculating time-varying mean wind speed in non-stationary analysis can be seen in Figure 8.
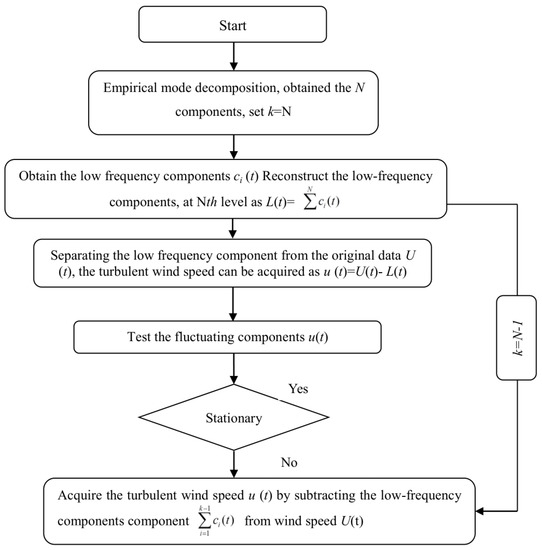
Figure 8.
Flow chart of calculating the time-varying mean wind speed in non-stationary analysis.
Figure 8 shows the flow chart of obtaining the time-varying wind mean speed and corresponding stationary fluctuating component. Based on the procedure, the time-varying wind speed can be obtained.
Figure 9 shows a comparison of the time-varying mean wind speed and constant mean wind speed in the longitudinal, lateral, and vertical directions. The time-varying mean values from stationary records are more concentrated around the constant values in both directions, while for the non-stationary records, the generated time-varying mean values show a large difference from the constant value, indicating that the assumption of a stationary model is not valid for these records. Moreover, the vertical direction shows the fewest non-stationary records among the three directions. With the acquired time varying mean wind speed and stationary components, the wind characteristics of Typhoon “Maria” and the monsoon can be analyzed.

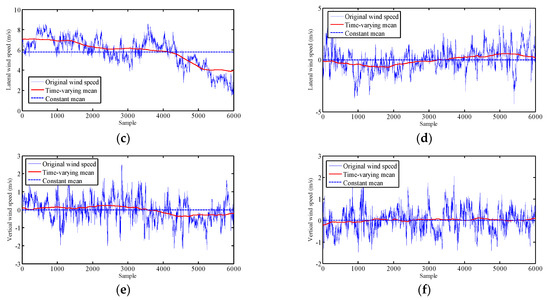
Figure 9.
Comparison of time-varying mean wind speed and constant mean wind speed from both non-stationary (a–c) and stationary records (d–f).
4.1. Turbulence Intensity
The turbulence intensity indicates the ratio of turbulence in natural winds, with the detailed expression shown in Table 2.
Figure 10 shows the comparison of turbulence intensities based on stationary and non-stationary models and 10 min time intervals in the longitudinal, lateral, and vertical directions. It can be concluded that the difference between stationary and non-stationary models is significant in the longitudinal and lateral directions. The same phenomenon is also found in Figure 11 for monsoon wind speed. It should be mentioned that the comparisons in both Figure 10 and Figure 11 are based on 10 min time intervals. However, in the wind load code in different countries, the analysis time intervals may be different. For example, it is set as 3600 s in Canada [30]. Table 3 lists the time intervals in different codes, including China [31], Canada [30], the USA [32], and Japan [33]. To comprehensively analyze the influence of different models on wind characteristics such as turbulence intensities, different time intervals are set, and the corresponding results can be seen in Figure 12 and Figure 13.
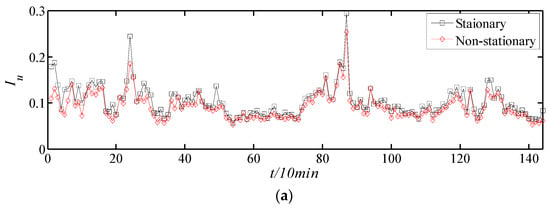
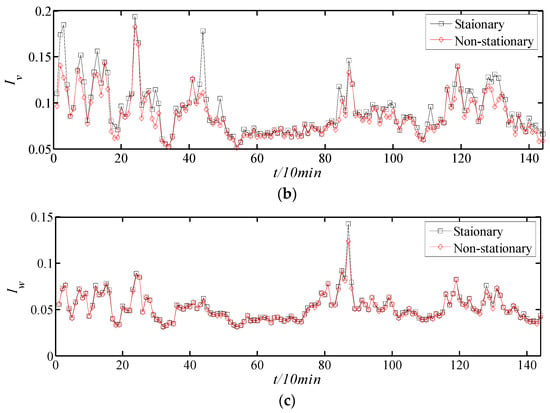
Figure 10.
Comparison of turbulence intensities of typhoons based on stationary and non-stationary models by 10 min time intervals: (a) longitudinal, (b) lateral, and (c) vertical.
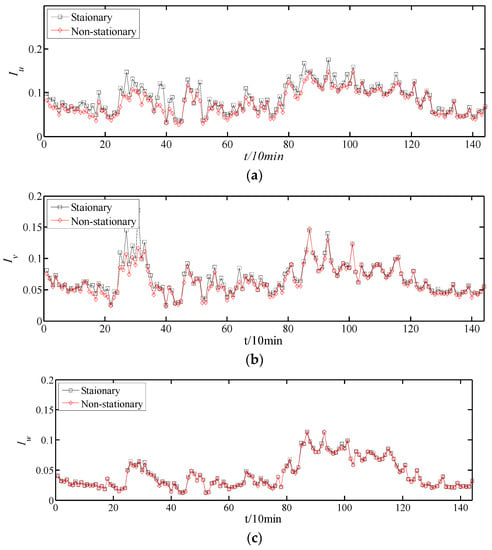
Figure 11.
Comparison of turbulence intensities of monsoon wind based on stationary and non-stationary models by 10 min time intervals: (a) longitudinal, (b) lateral, and (c) vertical.

Table 3.
Time intervals in different codes (units).
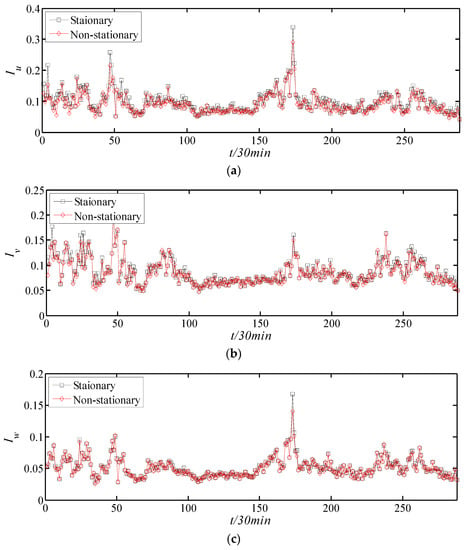
Figure 12.
Comparison of turbulence intensity based on stationary and non-stationary models by 30 min time intervals: (a) longitudinal, (b) lateral, and (c) vertical.
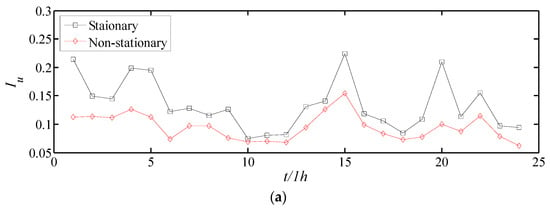
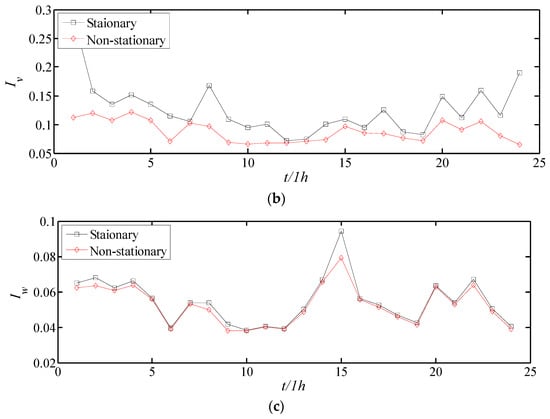
Figure 13.
Comparison of turbulence intensity based on stationary and non-stationary models by 60 min time intervals: (a) longitudinal, (b) lateral, and (c) vertical.
Figure 12 and Figure 13 show the comparison results based on 300 s and 3600 s time intervals. As shown in the figures, with increasing time interval, the difference in results between the stationary and non-stationary models increases. Additionally, the difference can be easily shown in Table 4, which indicates the RMSE of the two models in different time intervals. Furthermore, a comparison of the monsoon wind sample and typhoon wind sample can be found in Table 4.

Table 4.
RMSE of turbulence intensities based on stationary and non-stationary models at different time intervals.
Figure 14 and Figure 15 directly show the RMSE between the stationary and non-stationary models at different time intervals for monsoon wind speed samples and typhoon wind speed samples, respectively. Generally, the tendencies of typhoon and monsoon samples are similar. The RMSEs of the longitudinal and lateral turbulence intensities are larger than those of the vertical turbulence intensities. With an increase in the time interval, the RMSE for longitudinal and later turbulence intensities significantly increase, especially for the typhoon samples for which the RMSE increases to 0.05 when the time intervals are 60 min (3600 s). The model applied has a significant influence on the calculated results, especially for large time intervals, such as Code NBC (Canada code) and AS1170.2 (USA code).
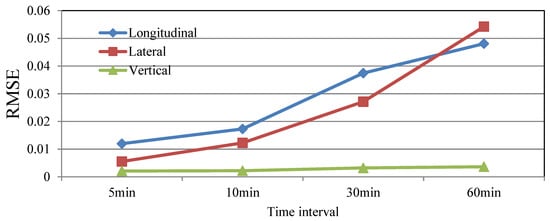
Figure 14.
RMSE between stationary and non-stationary models based on different time intervals for typhoon wind speed samples.
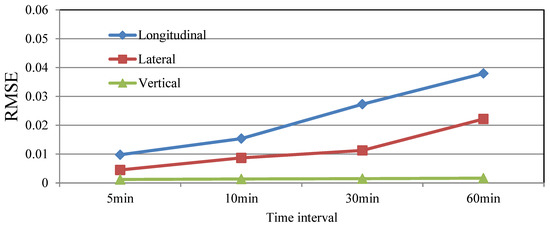
Figure 15.
RMSE between stationary and non-stationary models based on different time intervals for monsoon wind speed samples.
Figure 16 provides a comparison of the turbulence intensity profiles in different models. The red dashed line and green dashed line indicate the fitted turbulence intensity profiles from stationary and non-stationary conditions, respectively. Compared with the Chinese code (GB50009-2012), the fitted result from the non-stationary model is closer than that from the stationary model.
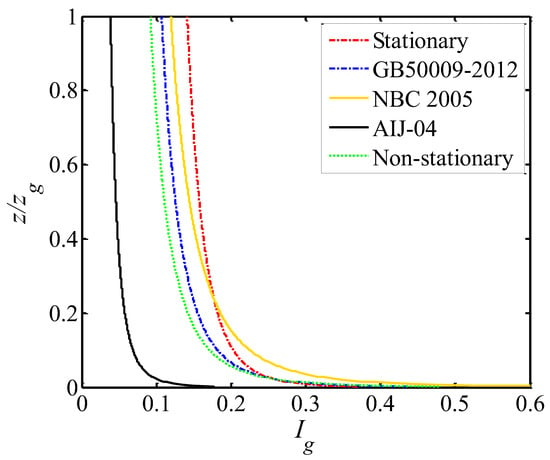
Figure 16.
Comparison of turbulence intensity profiles in different models.
4.2. Gust Factor
In wind-resistant engineering design, the gust factor is another important factor affecting the wind load on structures that needs to be considered. With utilization of the different equations of the two models in Table 2, the gust factors based on the stationary and non-stationary models are shown in Figure 17. Similar to turbulence intensities, the difference between the two models can be obviously seen in longitudinal and lateral directions. Figure 18 shows the gust factors from stationary and non-stationary models for different time durations in different directions. For the same time intervals, the time durations to obtain the maximum gust factor have a significant effect on the results, which has been presented in [26]. However, as shown in Figure 18, from the non-stationary model, the slopes of the relationship between time durations and the calculated gust factor are smaller than those from the stationary model, indicating that the influence of time duration is smaller. Therefore, the non-stationarity of wind speed should be considered in calculating the gust factor, since the selection of time duration is different in the specifications.
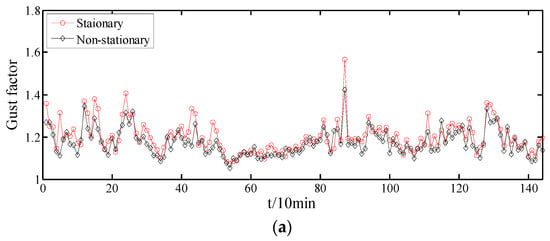
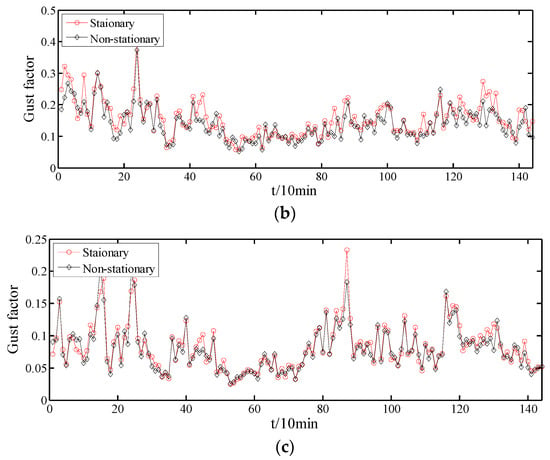
Figure 17.
Gust factors from stationary and non-stationary models in different directions: (a) longitudinal, (b) lateral, and (c) vertical.
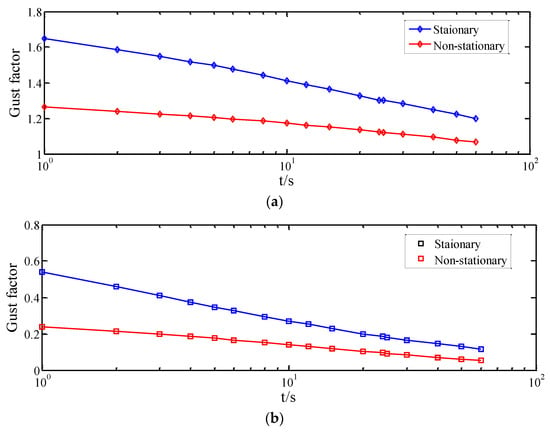
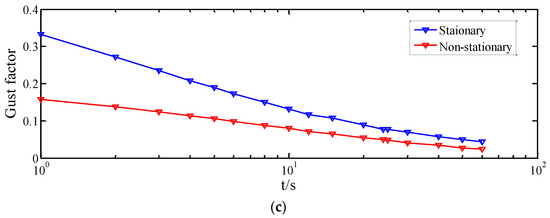
Figure 18.
Gust factors from stationary and non-stationary models for different time durations in different directions: (a) longitudinal, (b) lateral, and (c) vertical.
Figure 19 compares the gust factors of typhoons and monsoons in three directions. As indicated, gust factors in the longitude direction are larger than those in the vertical and later directions for both typhoon and monsoon processes. Moreover, the gust factors from the typhoon process are generally larger than those from the monsoon process, indicating a more significant gust effect in the typhoon process, which should be given more attention in engineering design.
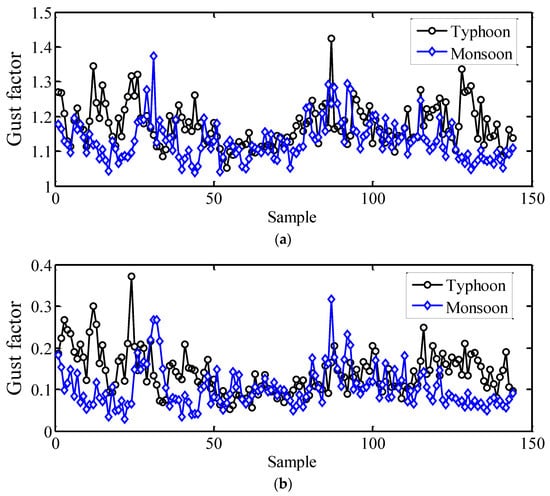
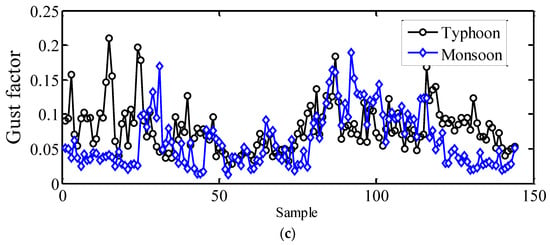
Figure 19.
Comparison of gust factors based on typhoon and monsoon wind speeds: (a) longitudinal, (b) lateral, and (c) vertical.
Similar to the turbulence intensity, Table 5 summarizes the difference between the typhoon process and monsoon wind speed. As indicated in Table 5, the RMSE of gust factors between the two models increases with the time interval as well, even though the change is not as significant as that for turbulence intensity.

Table 5.
RMSEs of the gust factor from stationary and non-stationary models at different time intervals.
4.3. Turbulence Integral Scales
The turbulence integral scale represents the average size of the turbulent eddies of flows, which describe the influence of fluctuating wind on structures. The turbulence integral scales at a height of 10 m are calculated with the formulas in Table 2 in the longitudinal, lateral, and vertical directions and are presented in Figure 20. Generally, the non-stationary turbulence integral scales are much smaller than the stationary turbulence integral scales, especially for the longitudinal and lateral directions. In the vertical direction, they are very close.
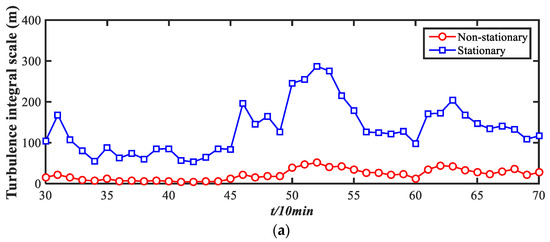
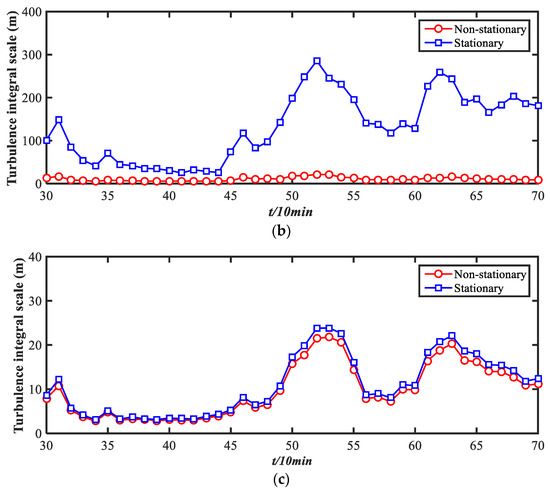
Figure 20.
Turbulence integral scale of typhoons from stationary and non-stationary models: (a) longitudinal, (b) lateral, and (c) vertical.
The ratio of turbulence integral scales in the three directions of the considered typhoon has been discussed in references as 1:0.72:0.59, and the average longitudinal length has been calculated as 93.89 m at a height of 10 m. When considering a non-stationary model, the average longitudinal length is calculated as 41.38 m, with a ratio of the three directions of 1:0.78:0.65; the length is much smaller than the stationary model, but the ratio is similar. This may provide evidence that strong non-stationarity exists in both longitudinal and lateral directions, inducing differences in turbulence integral scales. The fact that the ratios between the models are close suggests that the relative average sizes of turbulence in the three directions are similar in both models.
Figure 21 indicates the turbulence integral scale of the monsoon from stationary and non-stationary models. Generally, the turbulence integral scales for monsoons are much larger than those for typhoons, indicating a larger turbulence size than the typhoon wind speed. Compared with Figure 20, the differences between the stationary model and stationary models are smaller, which may prove that smaller non-stationarity exists in monsoon wind speed. Moreover, comparing the three directions, in the longitudinal direction, the turbulence integral scale significantly decreases in non-stationary models, meaning that strong non-stationarity mainly exists in the longitudinal direction, which is different from the case for typhoon wind speed.
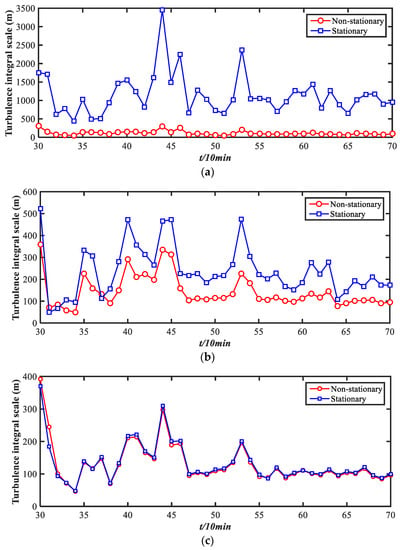
Figure 21.
Turbulence integral scale of monsoons based on stationary and non-stationary models: (a) longitudinal, (b) lateral, and (c) vertical.
4.4. Power Spectra Density (PSD)
Power spectra density (PSD) represents the distribution of the fluctuating wind energy with respect to frequency. According to the Kolmogorov theory, the power spectra density can be described in the general form:
where f is the Monin coordinate and can be written as ; α and β are coefficients that can be determined by curve fitting. With numerous studies on wind spectra, some specific empirical models have been established to fit the fluctuations, such as the widely used von Karman model [34], with the following expression:
where z is the considered height, is the PSD at height z, n is the natural frequency of turbulence, and u* is the friction wind speed. It should be mentioned that the above expression is established with a stationary assumption; however, if considered non-stationary, the expression can be as follows:
where is the non-stationary PSD at height z, f is the reduced frequency with , and is the non-stationary friction model. The Davenport spectrum [35] has been widely investigated. Considering the non-stationary model, it can be expressed as:
in which . Based on stationary and non-stationary expressions, the PSD can be generated for different wind speed samples. Figure 22 shows the 10 min wind speed sample of Typhoon “Maria” with a constant mean value and time-varying value. Figure 23 shows the corresponding spectrum from both the stationary model and non-stationary model.

Figure 22.
A 10 min wind speed sample of typhoon with (a) constant and (b) time-varying mean speed.
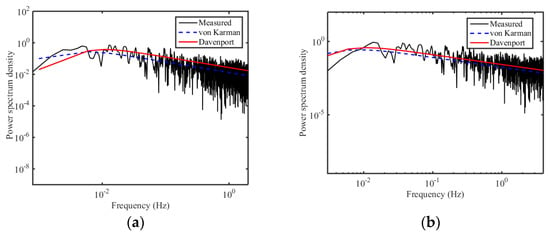
Figure 23.
PSDs of typhoon wind sample in Figure 20 based on (a) stationary and (b) non-stationary model.
As indicated, the von Karman spectrum provides a better fit than the Davenport spectrum for both models. However, compared with the two figures in Figure 23, the PSD from the non-stationary model shows less fluctuation in the high-frequency region than that from the stationary model, even though the difference is small. Another 10 min wind speed sample is shown in Figure 24, in which a significant time-varying mean speed can be found, and the corresponding PSDs are presented in Figure 25. For this wind speed sample, the PSDs from stationary and non-stationary models are significantly different at both the high-frequency and low-frequency regions. This indicates that a higher non-stationarity in wind speed can induce more differences in power spectrum density. With utilization of a non-stationary model, the spectral amplitudes at low frequency and the fluctuation of high frequency regions can be reduced. Such a phenomenon can be further studied in wind-induced vibration for engineering structures. In general, the von Karman spectrum fits the measured spectrum better than the Davenport spectrum, especially for the non-stationary model at the high-frequency region.

Figure 24.
A 10 min wind speed sample of typhoon with (a) constant and (b) time-varying mean speed.
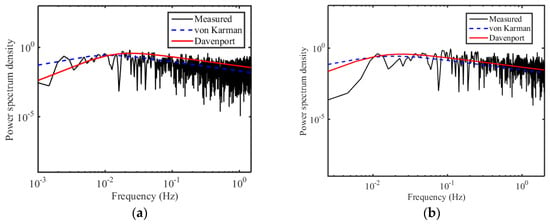
Figure 25.
PSDs of typhoon wind sample in Figure 20 based on (a) stationary and (b) non-stationary model.
Even though Figure 23 and Figure 25 are described based on a non-stationary model with time-varying mean wind speed; however, it cannot show the time varying property of turbulence. Therefore, evolutionary power spectrum density (EPSD) has been fully investigated by Tao and Hu [16,23,24,25,36] to show the contribution of different frequencies with time. Figure 26 shows the EPSD of measured typhoon wind speed and monsoon wind speed. It can be seen that the fluctuating wind speeds are mainly dominated by low frequency. The general EPSD values of typhoons are larger than those of monsoon wind speed. From Figure 26, the PSD significantly varies with time for both wind speeds, especially for typhoons, indicating that stronger non-stationarity exists in typhoon wind speed.
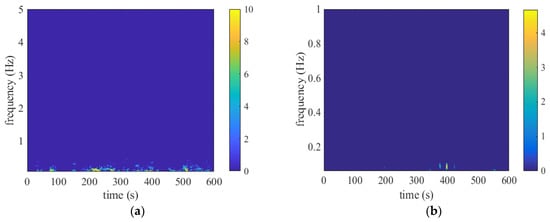
Figure 26.
Measured EPSDs of (a) typhoon wind speed; (b) monsoon wind speed.
5. Conclusions
In the design of wind-sensitive structures, such as long-span bridges and high-rise buildings, wind load is always an important factor by affecting the safety of the structures. The wind load should be estimated in designing of the structures. In a general case, the coefficients, or wind characteristic parameters, in calculating wind load are recommended in specifications, in which different values are recommended in different areas. However, the coefficients are usually calculated with the assumption that the wind speed at a considered time interval (10 min in China) is stationary. However, non-stationarity has been recognized in typhoon wind speed by recent research. In this paper, the non-stationarity of both typhoon and monsoon wind speeds is tested by run test method and wind characteristics from stationary and non-stationary models are analyzed and conducted with the following conclusions:
- (1)
- Based on the run test, non-stationarity exists in both typhoon and monsoon wind speed samples. The percent of non-stationary samples increases with sample time interval, and the percent of non-stationary samples in typhoon wind are larger than that in monsoon wind speed, indicating that the typhoon sample has stronger non-stationarity. In engineering applications, when calculating fluctuating wind load, the non-stationarity of wind speed is recommended to be considered.
- (2)
- Based on the comparison of results from non-stationary analysis and stationary analysis, the influence of analysis time interval on turbulence intensity is smaller for non-stationary models than that for stationary models; it can be concluded that the application of a non-stationary model is of great significance in reducing the influence of time interval selection.
- (3)
- Based on the turbulence intensity profile, the fitted result of typhoon wind speed samples based on a non-stationary model is closer than that based on a stationary model.
- (4)
- The non-stationary gust factor is smaller than the stationary gust factor. The slope of gust factor and time duration is smaller in the non-stationary model, indicating that the chosen of time duration has smaller influence on calculation results if considering a non-stationary model.
- (5)
- For typhoon wind speed, both longitudinal and lateral turbulence integral scales have a large difference between stationary and non-stationary models; however, for the monsoon wind speed, non-stationarity mainly exists in the longitudinal direction.
- (6)
- The PSDs for measured wind speeds can fit a von Karman spectrum better than the Davenport spectrum. Higher non-stationarity may induce a reduction in spectral amplitudes at low-frequency regions and fluctuation at high-frequency regions.
- (7)
- Stationary models are usually applied for wind characteristic analysis in design specifications. However, in this research, the comparisons of wind characteristics based on the stationary and non-stationary model provide a suggestion of non-stationary analysis for design specification, especially when considering large time intervals or typhoon wind speed.
From the conclusions in this paper, it can be seen that the difference between non-stationary models and stationary models cannot be ignored. Even though it is difficult to obtain universality of non-stationarity from a single typhoon case, and only one case for typhoon (24 h) and one case for monsoon (24 h) may not be enough for a very robust comparison, this research does present the necessity of consideration of non-stationary model. This may provide some evidence or support for the non-stationary assumption in the further modifications of specifications, especially for typhoon-prone areas, for which typhoon wind speeds have stronger non-stationarity, as shown in this paper. In these areas, the consideration of a non-stationary model may have a better estimation of wind load on structures.
Author Contributions
Conceptualization, Z.Q., D.X.; methodology, D.X., L.D.; software, D.X., L.L. and Q.Z.; validation, Z.Q., D.X.; data curation, Z.Q., D.X. and L.L.; writing-original draft, Z.Q., D.X. and L.D. All authors have read and agreed to the published version of the manuscript.
Funding
This research was funded by the Fujian Provincial Project of Transportation Science and Technology (201903, 202022), the Wind Engineering Service Platform of Xiamen (No. 3502Z20161016), the Natural Sciences and Engineering Research Council of Canada (NSERC), the Industry-University Cooperation Project of Fujian Province (2020H6022), the Natural Sciences Foundation of Fujian Province (2020J01275, 2021Y0045), and the Chinese Scholarship Council (CSC).
Institutional Review Board Statement
Not applicable.
Informed Consent Statement
Not applicable.
Data Availability Statement
All data presented in this study are available within the manuscript.
Acknowledgments
This research was funded by the Fujian Provincial Project of Transportation Science and Technology (201903, 202022), the Wind Engineering Service Platform of Xiamen (No. 3502Z20161016), the Natural Sciences and Engineering Research Council of Canada (NSERC), the Industry-University Cooperation Project of Fujian Province (2020H6022), the Natural Sciences Foundation of Fujian Province (2020J01275, 2021Y0045), and the financial support of the Chinese Scholarship Council (CSC).
Conflicts of Interest
The authors declare no conflict of interest.
References
- Song, L.; Li, Q.S.; Chen, W.; Qin, P.; Huang, H.; He, Y.C. Wind characteristics of a strong typhoon in marine surface boundary layer. Wind. Struct. 2012, 15, 1–15. [Google Scholar] [CrossRef] [Green Version]
- Choi, E.C.C. Wind characteristics of tropical thunderstorms. J. Wind. Eng. Ind. Aerodyn. 2000, 84, 215–226. [Google Scholar] [CrossRef]
- Wang, Z.; Zhao, Y.; Li, F.; Jiang, J. Extreme Dynamic Responses of MW-Level Wind Turbine Tower in the Strong Typhoon Considering Wind-Rain Loads. Math. Probl. Eng. 2013, 2013, 133–174. [Google Scholar] [CrossRef]
- Lin, L.; Chen, K.; Xia, D.; Wang, H.; Hu, H.; He, F. Analysis on the wind characteristics under typhoon climate at the southeast coast of China. J. Wind. Eng. Ind. Aerodyn. 2018, 182, 37–48. [Google Scholar] [CrossRef]
- Su, Y.W.; Huang, G.Q.; Xu, Y.L. Derivation of time-varying mean for non-stationary downburst winds. J. Wind Eng. Ind. Aerodyn. 2015, 141, 39–48. [Google Scholar] [CrossRef]
- Tao, T.Y.; Wang, H.; Wu, T. Stationary and non-stationary analysis on the wind characteristics of a tropical storm. Smart Struct. Syst. 2016, 17, 1067–1085. [Google Scholar] [CrossRef]
- He, X.; Qin, H.; Tao, T.; Liu, W.; Wang, H. Measurement of Non-Stationary Characteristics of a Landfall Typhoon at the Jiangyin Bridge Site. Sensors 2017, 17, 2186. [Google Scholar] [CrossRef] [Green Version]
- Mccullough, M.; Kwon, D.K.; Kareem, A.; Wang, L. Efficacy of averaging interval for non-stationary winds. In Proceedings of the Joint Conference of the Engineering Mechanics Institute & Asce Joint Specialty Conference on Probabilistic Mechanics & Structural Reliability, Notre Dame, IN, USA, 17–20 June 2012. [Google Scholar]
- Federica, T.; Giovanni, S. Time varying mean extraction for stationary and non-stationary winds. J. Wind. Eng. Ind. Aerodyn. 2020, 203, 104187. [Google Scholar]
- Choi, E.C.C.; Hidayat, F.A. Gust factors for thunderstorm and non-thunderstorm wind. J. Wind Eng. Ind. Aerodyn. 2002, 90, 1683–1696. [Google Scholar] [CrossRef]
- Lombardo, F.T.; Smith, D.A.; Schroeder, J.L.; Metha, K.C. Thunderstorm characteristics of importance to wind engineering. J. Wind Eng. Ind. Aerodyn. 2014, 125, 121–132. [Google Scholar] [CrossRef]
- Solari, G.; De Gaetano, P. Dynamic response of structures to thunderstorm outflows: Response spectrum technique vs time-domain analysis. Eng. Struct. 2018, 176, 188–207. [Google Scholar] [CrossRef]
- Junayed, C.; Jubayer, C.; Parvu, D.; Romanic, D.; Hangan, H. Flow field dynamics of large-scale experimentally produced downburst flows. J. Wind Eng. Ind. Aerodyn. 2019, 188, 61–79. [Google Scholar] [CrossRef]
- Wang, Y.S. Sound quality estimation for nonstationary vehicle noises based on discrete wavelet transform. J. Sound Vib. 2009, 43529, 1124–1140. [Google Scholar] [CrossRef]
- Chen, J.H. An improved EMD method and its application in nonstationary signals analysis. Adv. Mater. Res. 2012, 429, 313–317. [Google Scholar] [CrossRef]
- Tao, T.; Wang, H.; Wu, T. Comparative Study of the Wind Characteristics of a Strong Wind Event Based on Stationary and Non-stationary Models. J. Struct. Eng. 2016, 04016230. [Google Scholar] [CrossRef]
- Ouarda, T.B.M.J.; Charron, C. Non-stationary statistical modelling of wind speed: A case study in eastern Canada. Energy Convers. Manag. 2021, 236, 114028. [Google Scholar] [CrossRef]
- Nguyen, C.H.; Nguyen, D.T.; Owen, J.S.; Hargreaves, D.M. Wind tunnel measurements of the aerodynamic characteristics of a 3:2 rectangular cylinder including non-Gaussian and non-stationary features. J. Wind. Eng. Ind. Aerodyn. 2022, 220, 04826. [Google Scholar] [CrossRef]
- Tao, T.; Wang, H.; Zhao, K. Efficient simulation of fully non-stationary random wind field based on reduced 2D hermite interpolation. Mech. Syst. Signal Process. 2021, 150, 107265. [Google Scholar] [CrossRef]
- Li, Y.; Togbenou, K.; Xiang, H.; Chen, N. Simulation of non-stationary wind velocity field on bridges based on Taylor series. J. Wind. Eng. Ind. Aerodyn. 2017, 169, 117–127. [Google Scholar] [CrossRef]
- Orlando, A.; Pagnini, L.; Repetto, M.P. Structural response and fatigue assessment of a small vertical axis wind turbine under stationary and non-stationary excitation. Renew. Energy 2021, 170, 251–266. [Google Scholar] [CrossRef]
- Ke, S.; Wang, H.; Ge, Y. Comparison of stationary and non-stationary wind-induced responses of a super-large cooling tower based on field measurements. Thin-Walled Struct. 2019, 137, 331–346. [Google Scholar] [CrossRef]
- Wang, H.; Wu, T.; Tao, T.; Li, A.; Kareem, A. Measurements and analysis of non-stationary wind characteristics at Sutong Bridge in Typhoon Damrey. J. Wind. Eng. Ind. Aerodyn. 2016, 151, 100–106. [Google Scholar] [CrossRef] [Green Version]
- Tao, T.; Wang, H. Modelling of longitudinal evolutionary power spectral density of typhoon winds considering high-frequency subrange. J. Wind. Eng. Ind. Aerodyn. 2019, 193, 103957. [Google Scholar] [CrossRef]
- Tao, T.; Shi, P.; Wang, H. Spectral modeling of typhoon winds considering nexus between longitudinal and lateral components. Renew. Energy 2020, 162, 2019–2030. [Google Scholar] [CrossRef]
- Xia, D.; Dai, L.; Lin, L.; Wang, H.; Hu, H. A Field Measurement based Wind Characteristics Analysis of a Typhoon in Near-ground Boundary Layer. Atmosphere 2021, 12, 873. [Google Scholar] [CrossRef]
- Typhoon Real Time Paths. Available online: http://typhoon.zjwater.gov.cn/default.aspx (accessed on 5 January 2022).
- Ma, X.-F.; Xia, J. Run Probability and Statistics Principles and Applications; Science Press: Beijing, China, 2011. [Google Scholar]
- Biswas, M.; Mukhopadhyay, M.; Ghosh, A.K. A distribution-free two-sample run test applicable to high-dimensional data. Biomerika 2014, 101, 913–926. [Google Scholar] [CrossRef]
- National Research Council of Canada. National Building Code; NRCC: Ottawa, ON, Canada, 1990.
- JTG/T 3360-01-2018; Design Code for Wind Resistance of Highway Bridges. China Transportation Press: Beijing, China, 2018.
- ASCE 7–93; Minimum Design Loads for Buildings and Other Structures. ASCE Standard: New York, NY, USA, 1993.
- Architecture Institute of Japan. Guidance of Building Code; Architecture Institute of Japan: Tokyo, Japan, 2002. [Google Scholar]
- Von, K.T. Progress in the statistical theory of turbulence. Proc. Natl. Acad. Sci. USA 1948, 34, 530–539. [Google Scholar]
- Davenport, A.G. Note on the Distribution of the Largest Value of a Random Function with Application to Gust Loading. Proc. Inst. Civ. Eng. 1964, 28, 187–196. [Google Scholar] [CrossRef]
- Hu, L.; Xu, Y.L.; Huang, W.F. Typhoon-induced non-stationary buffeting response oflong-span bridges in complex terrain. Eng. Struct. 2013, 57, 406–415. [Google Scholar] [CrossRef]
Publisher’s Note: MDPI stays neutral with regard to jurisdictional claims in published maps and institutional affiliations. |
© 2022 by the authors. Licensee MDPI, Basel, Switzerland. This article is an open access article distributed under the terms and conditions of the Creative Commons Attribution (CC BY) license (https://creativecommons.org/licenses/by/4.0/).