Article

Characterisation of Thunderstorms with Multiple Lightning Jumps

Meteorological Service of Catalonia 1, C/Berlin, 38-46, CP 08029 Barcelona, Spain
*
Author to whom correspondence should be addressed.
These authors contributed equally to this work.
Atmosphere 2022, 13(2), 171; https://doi.org/10.3390/atmos13020171
Submission received: 17 December 2021 / Revised: 13 January 2022 / Accepted: 16 January 2022 / Published: 21 January 2022
(This article belongs to the Special Issue Drought and Precipitation Extremes)

Abstract

:
Several works have shown that lightning jumps are precursors of severe weather in deep-convective thunderstorms. Since 2017, the Meteorological Service of Catalonia has operationally run an algorithm that identifies lightning jumps (LJs) in real time. It has resulted in being an effective tool for nowcasting severe weather with a lead time between 15 min and 120 min in advance. This time can be of high value for managing emergencies caused by severe phenomena or heavy rains. The present research focused on the events’ analysis in which more than one lightning jump occurred, searching for those elements that differentiate single warning cases. Thunderstorms producing LJs were divided into two main categories, depending on the number of jumps triggered during the life cycle. Besides, both classes were split into two main sub-types, based on the level of the LJ that occurred. Multiple LJ thunderstorms produce more Level 2—related to severe weather—jumps than Level 1—small hail or intense precipitation—while in the case of a single LJ, the opposite behaviour occurs. In general, multiple LJ thunderstorms with at least one Level 2 jump are the more intense and have a higher vertical development. Finally, lineal and well-organised thunderstorms are the more common modes in those intenser cases.

1. Introduction

Lightning jumps (LJs) are defined as a sudden increase of the total lightning (TL) activity in a thunderstorm [1,2,3]. This electrical activity arises commonly as a precursor of severe weather phenomena (tornadoes, straight-winds exceeding 25 m/s, or large hail over 2 cm in diameter) at the ground or short and very intense rain events [4,5,6]. An algorithm has shown good efficiency for nowcasting both types of phenomena (severe weather and intense precipitation) in convective or deep-convective events, with probabilities of detection of 80% and a false alarm ratio under the 20%. However, at this time, the tool has not resulted in being efficient for discriminating the expected hail size [7]. In any case, analysing the time series of LJ can provide a new way of understanding the processes associated with extreme precipitation, including large hail phenomena.
A crucial point in the favourable functioning of the algorithms detecting LJs is the capability of detection of the Lightning Location System (LLS) network, especially of the intra-cloud (IC) flashes [8,9,10]. The most common way of identifying LJs [1,2,8,11] is detecting an increase of the TL activity exceeding 2σ (this being double the standard deviation of the rate in a previous period of between 10 min and 15 min). Although this algorithm was developed for the terrain LLS, it has recently been applied to satellite imagery, taking advantage of the spatial coverage and the capability of detecting a high percentage of the ICs occurring in thunderstorms [12,13]. However, the results have not been as good as expected, probably because of the worse time and spatial resolutions, with respect to the terrestrial systems.
Some researches have focused on the physics of those thunderstorms producing LJs, combining electrical data with radar information [3,7,9,11,14,15,16,17]. The previous works considered different radar variables and searched for some key signatures. In this way, Reference [11] detected a good correlation between thunderstorms producing LJs and the vertical integrated liquid (VIL) radar parameter, in concordance with the results of [15], who used the graupel mass estimation at high levels. Reference [9] also observed the same behaviour with the VIL, but the VIL density outperformed in most cases. References [3,7] detected that the size of the thunderstorm has a significant role in the triggering of the warning because it affects the number of lightning flashes. Similar results were found by [16,17], who considered the regions exceeding 46 dBZ and 55 dBZ (in the first case) and 40 dBZ (n the second case) in hail- and non-hail-producing thunderstorms. Finally, Reference [14] detected a large number of false alarms in non-severe thunderstorms using the algorithm of [3] and a lightning mapping array (LMA) system (more than 50%).
The studies of [11,15] (among others) showed that some thunderstorms produce multiple LJs, which can be different in the sense of the type of total lightning increase (more or less abrupt) and the number of flashes registered in the thunderstorm. However, the number of analysed cases was in all cases relatively low. In 2017, the Meteorological Service of Catalonia put in operation the algorithm of [1], with the preliminary work of testing and tuning the parameters according to the Catalan Lightning Location System (LLS), the necessities of the Surveillance and Forecasting Team, and the characteristics of the terrain and the meteorology of the region. Then, a large set of cases has become available for the area of interest since 2006 [4]. This is the basis of the current research, presented in the following sections.
The present research aimed to identify principal signatures in radar data detected mainly in thunderstorms with multi-LJ warnings in front of those single-warning cases (MLJst and SLJst, respectively). Besides, the analysis included other time and spatial patterns, such as the relationship with the Mediterranean Sea and the topography.

2. Materials and Methods

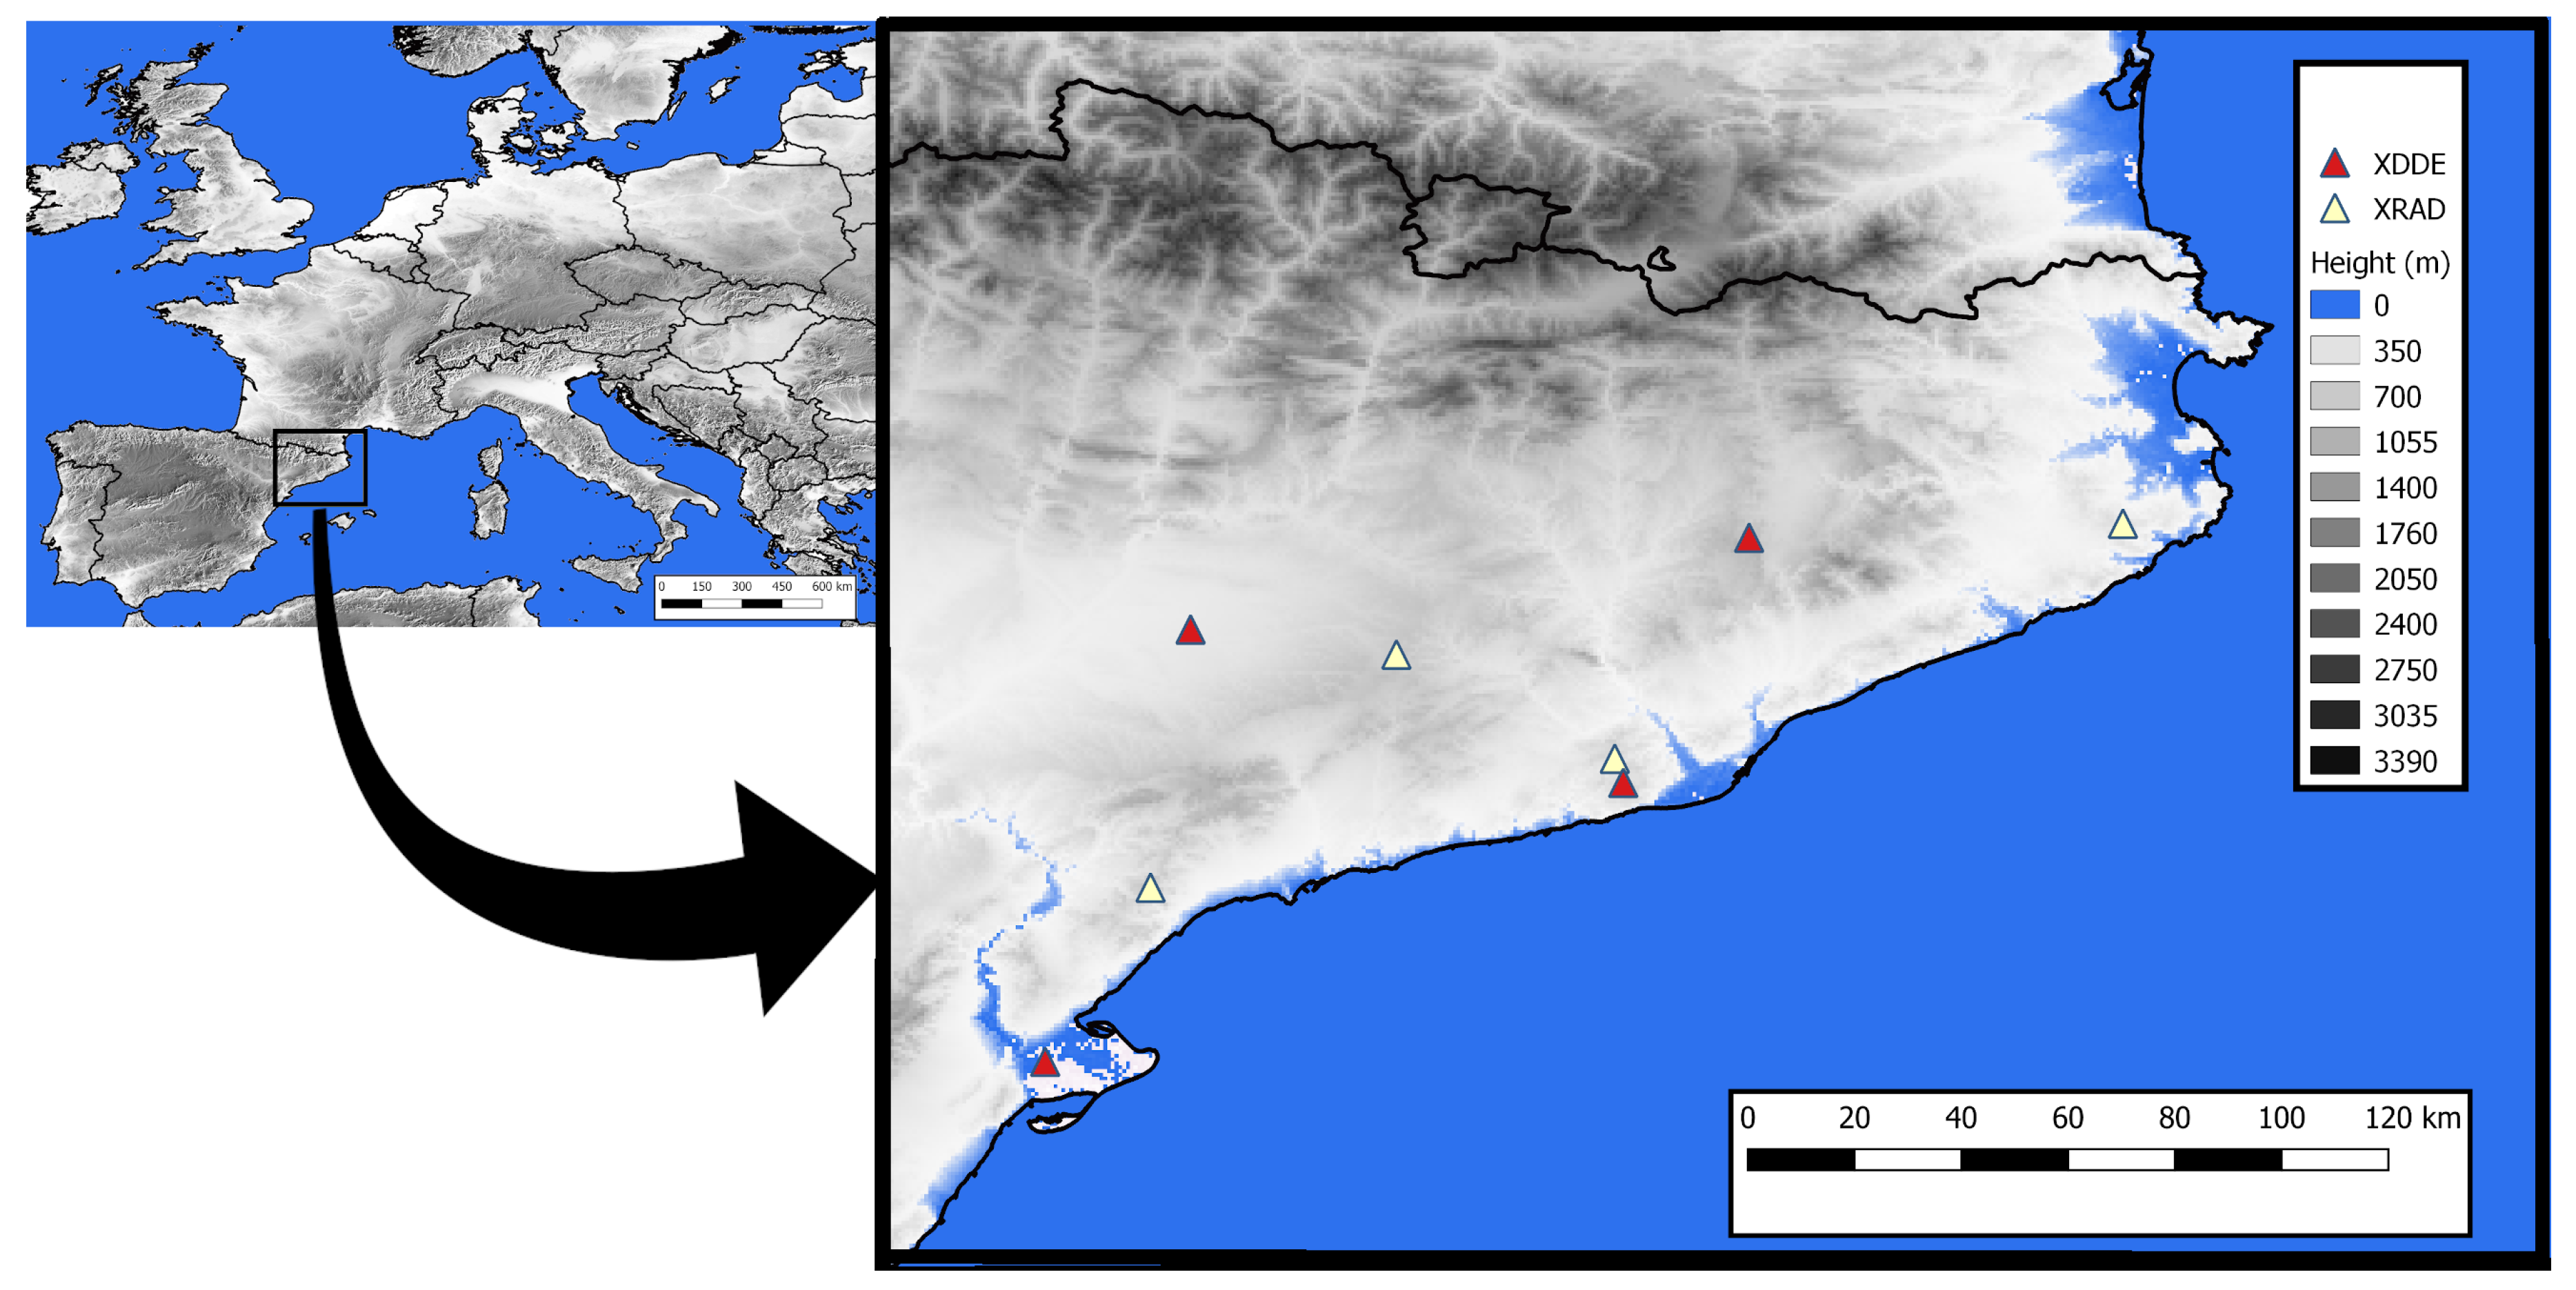
2.1. Area of Study and the Data Used

Two main data sources were used in the analysis of the MLJst. The first was lightning data, used for the triggering of the LJs themselves and also for the determination of the area considered associated with the same storm. The second type of data was weather radar information. In this case, these were used for identifying the convective cells included in the LJ-producing storm. Besides, this allowed determining some parameters that could discriminate between the SLJst and MLJst. Figure 1 shows the location of both networks of data sources (radar and lightning detectors) in the region of study, Catalonia. This region is located in the NW of the Mediterranean Basin. The principal mountain ranges reach between 2000 m and 3000 m and are distributed from west to east. Other minor mountainous structures are between 500 m and 1500 m, running quasi-parallel to the coastline.

2.1.1. Lightning Data

The LLS (known as XDDE, from the Catalan “Network of Electrical Discharges Detection”) of the Meteorological Service of Catalonia (SMC) is composed of four low-frequency (LF) and very-high-frequency (VHF) sensors (each sensor has two antennas, detecting both frequencies). This configuration allows a good detection of both cloud-to-ground (CG) and intra-cloud (IC) flashes (the detection efficiency moves between 80% and 95%, and 65% and 85%, respectively, according to the manufacturer’s software and the experimental campaigns cited in [1]). IC lightning (Figure 2) comprises those cloud discharges that occur totally inside a single convective cell and are the most common of all the forms of lightning, while CG lightning comprises those that overpass the hole between the cloud charge and the Earth’ surface [18,19,20]. Positive CGs usually present a unique return stroke after the stepped leader, in front of the multiple-return strokes observed in negative CGs. The LLS of the SMC can detect multiple return strokes in CGs. Besides, it can register many sources in ICs. In this sense, flashes are integrated into a database considering multiple locations (defined here as Level 1) or a unique position (Level 2). The ability to detect more or less IC sources or return strokes is dependant on the distance of the thunderstorm to the LLS sensors. Then, one thunderstorm occurring in the region inside the polygon closed by the position of the sensors will have a higher rate between the number of sources at the two levels. In this sense, the median value of the rate for the year 2021 was 5.83 (for 103,145 cases of at least one minute of lightning activity over Catalonia).

2.1.2. Radar Data

The SMC manages a radar network (XRAD) composed of 4 C-Band single-polarisations, with two operational ranges: the longest one, for surveillance tasks and reaching 250 km from each radar, is generated using only a unique elevation at 0.6 deg. The volumetric range is only 130 km from the radar. However, it consists of 13 elevation angles (from 0.6–30 deg), allowing generating quantitative precipitation estimation and other products with a good performance over the Catalan territory and the neighbouring areas. Radar volumes are generated every 6 min, and the composition of all the elements is performed on a computer in the central offices, considering maximum reflectivity values.

2.2. Methodology

This section presents the different steps in the research, starting from the thunderstorm identification to the identification of thunderstorms with lightning jumps.

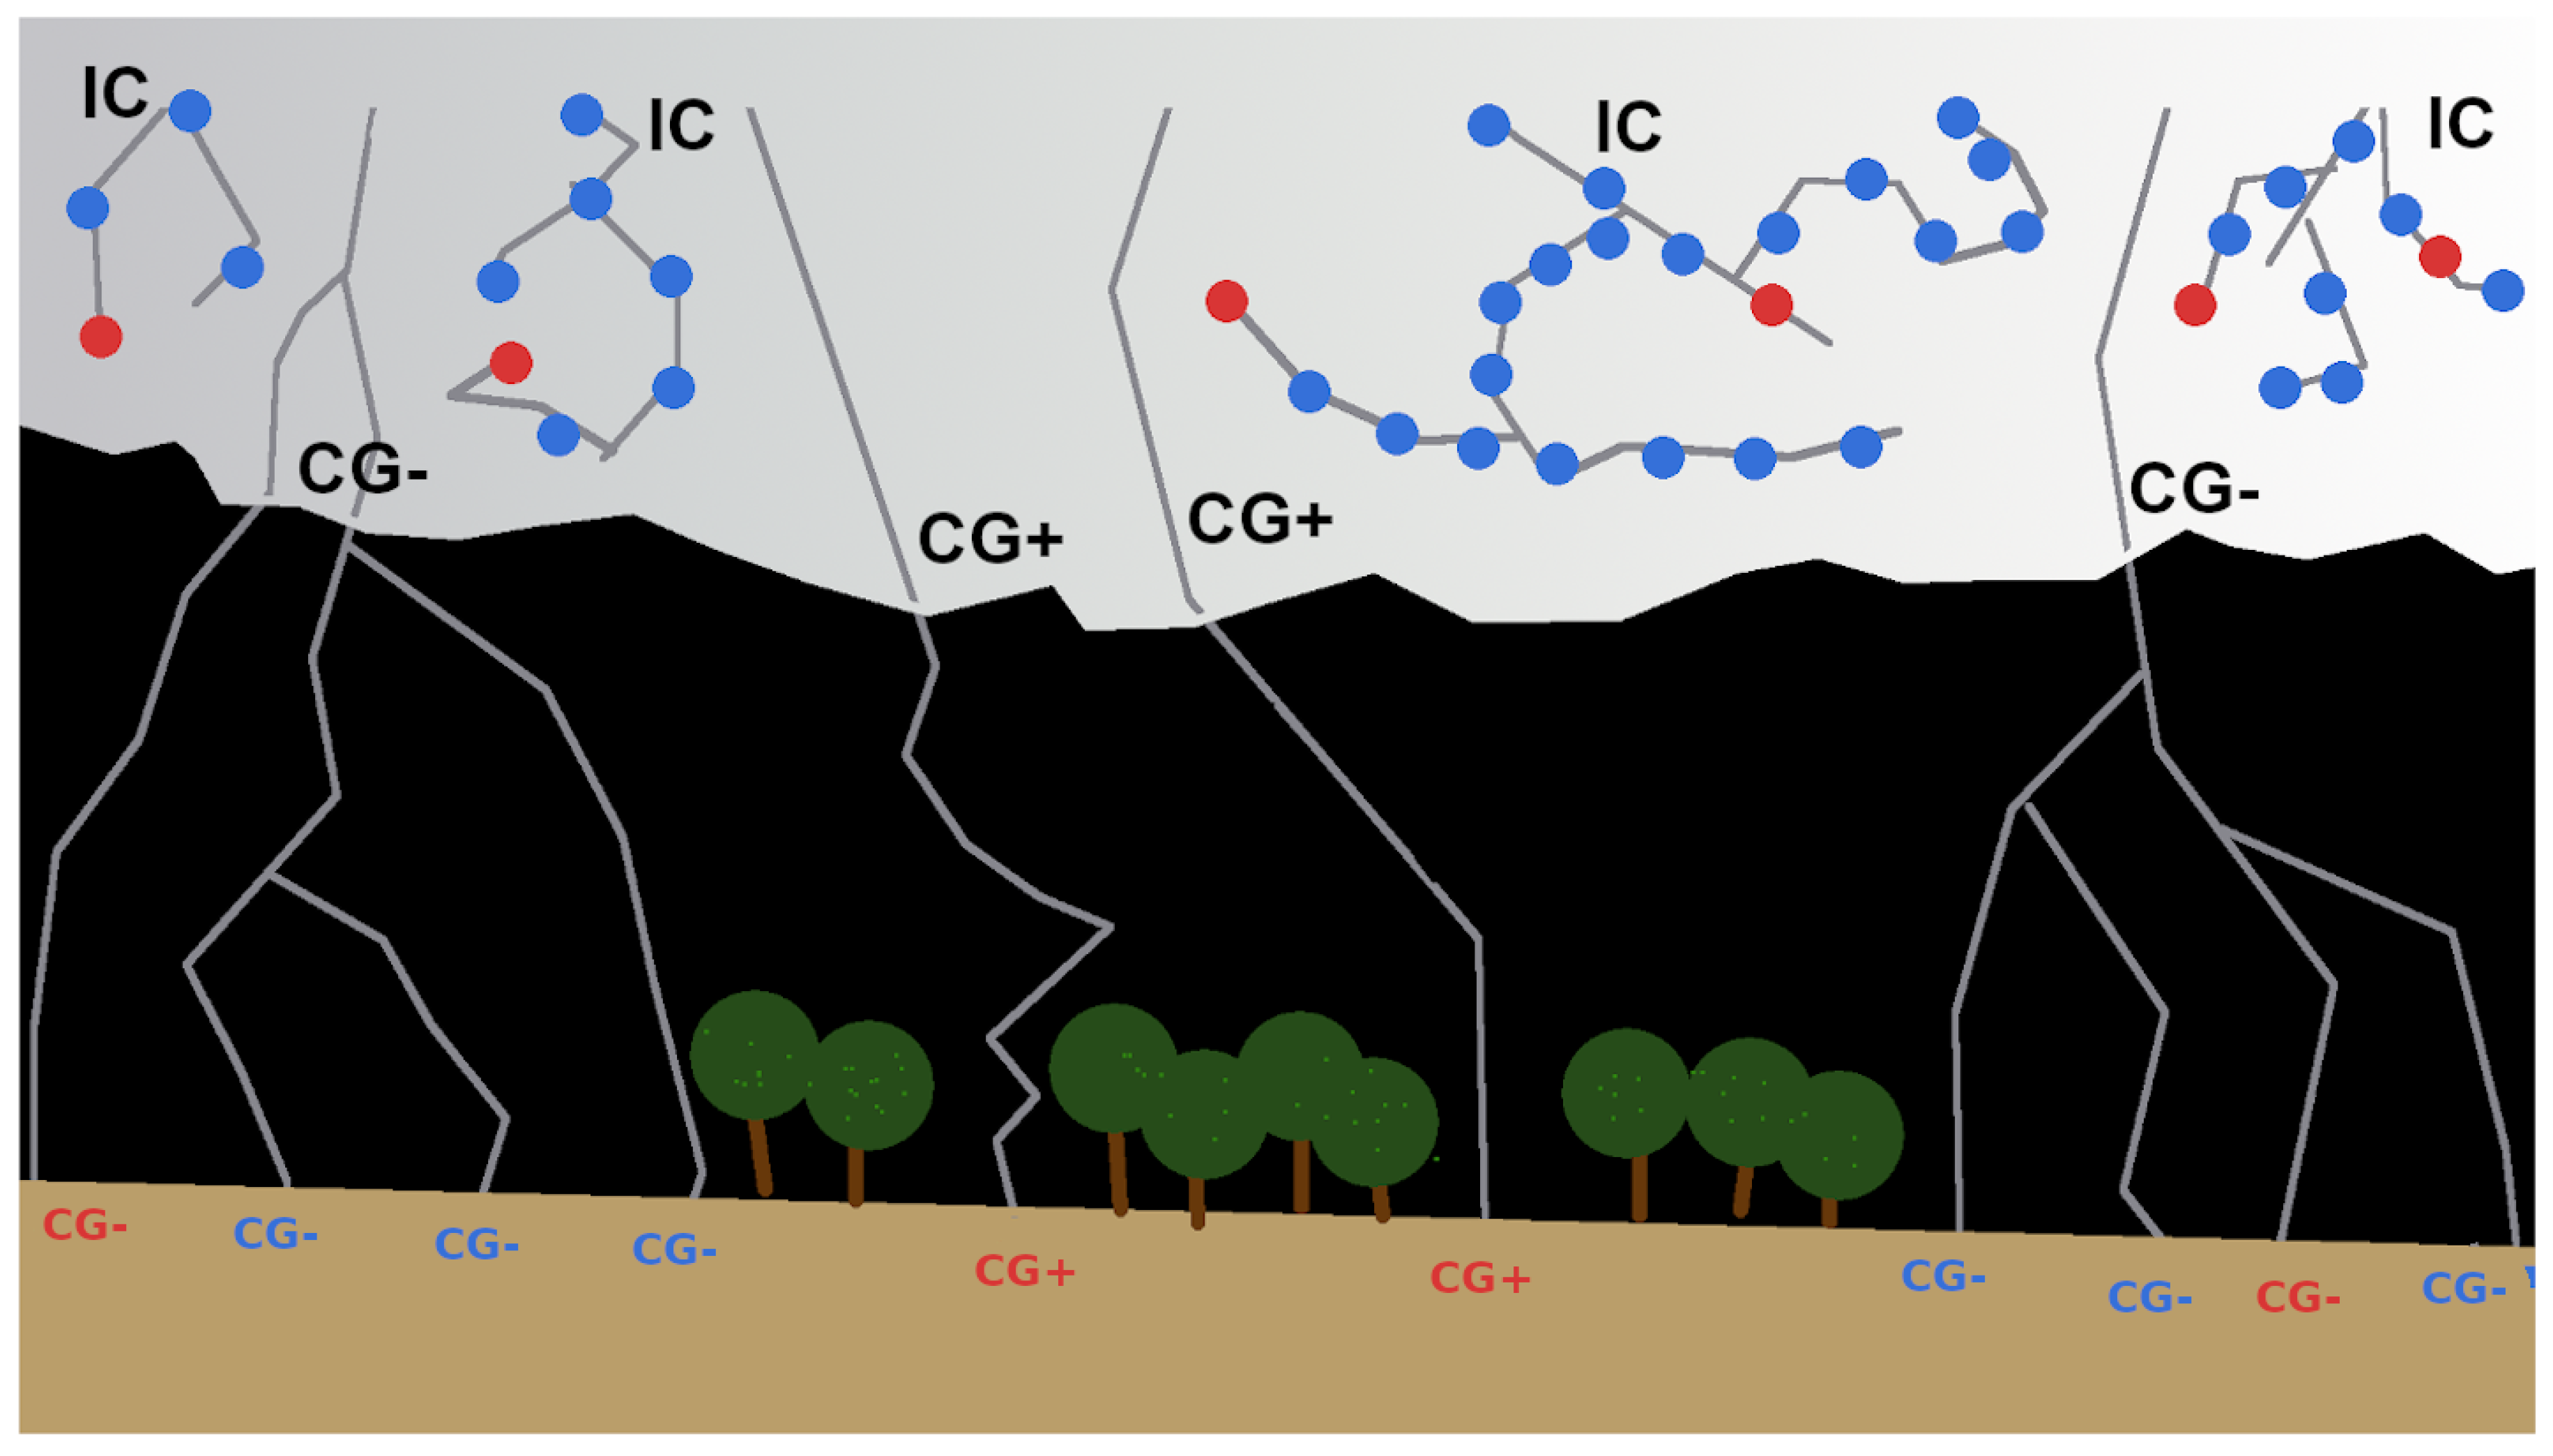
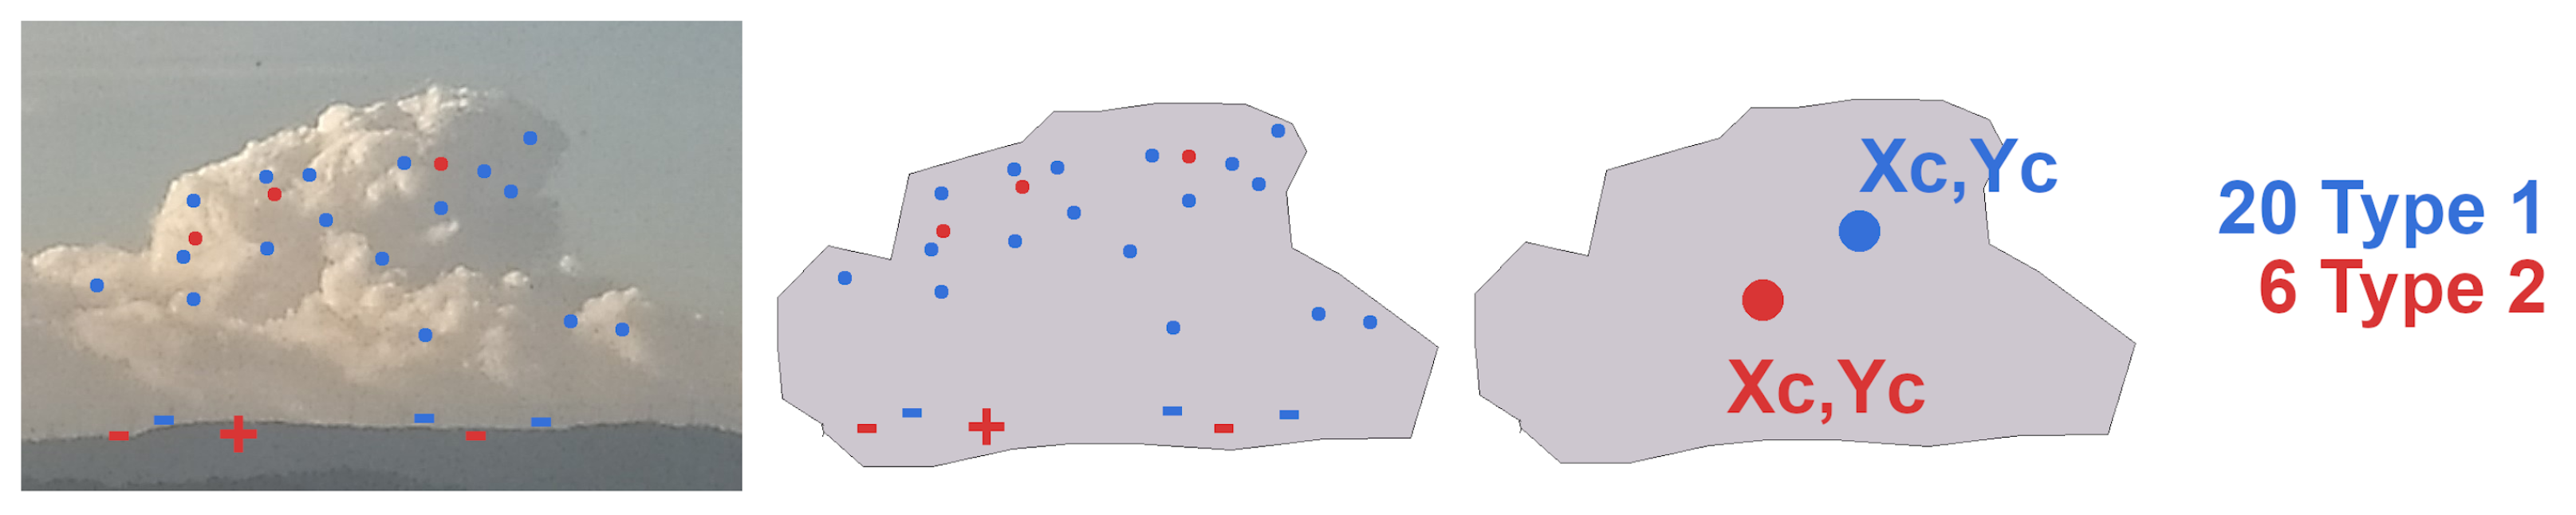
2.2.1. Identification and Tracking of Thunderstorms Using Lightning Data: Lightning Jumps

Figure 3 shows schematically the way a thunderstorm is identified using lightning data. Red dots correspond to the main source of each IC and CG lightning, while the blue ones indicate the position of secondary sources of the flashes of a thunderstorm. All those sources are integrated in 2 × 2 km2 pixels of a matrix [1], to indicate regions with or without lightning activity. Each minute, two matrices are generated (with—red and blue dots—and without—only red dots—multiplicity), for a region coinciding with the XRAD coverage. All those pixels with at least two sources and with also other pixels in the surroundings verifying the same condition are considered as candidate elements of the matrix. These candidate elements are merged into unique structures that correspond to the thunderstorm structure. Then, all thunderstorms are characterised every minute considering the location of the centroid (xc, yc), the time, the total area (or number of pixels), and the number of sources. The most relevant point of the differences between the structures identified using single or multiple sources per lightning is that in the second case, it is easier to perform the identification and tracking in time of the thunderstorm (because the footprint is clearer in the matrix), but a thunderstorm with a clear signal in time in the case of single sources reveals a major relationship with a strong updraught (which is the main cause of the increase of the lightning activity in a thunderstorm). This point will be explained more in depth in the next section, when these tracking results are compared with the radar ones.
The tracking of a thunderstorm is performed each minute considering the total lightning (in both single- and multiple-source ways). The TL is the magnitude used for estimating the LJ’s occurrence, considering that at a certain time, the increase of its value should exceed the 2*σ threshold, for the previous 14 min. Figure 4 shows an example of the tracking and the TL evolution of the same thunderstorm, from the single- and multiple-source approaches. It can be observed how in both cases, an LJ occurred, but the time of triggering was different. Besides, the path and the TL evolution were different, as happened in practically all thunderstorms analysed. Finally, it is worth saying that the order of magnitude of the TL in the multiple sources is one degree larger than in the case of the single source.

2.2.2. Identification and Tracking of Thunderstorms Using Radar Data

The identification, tracking, and nowcasting of thunderstorms working at the SMC were presented in [21]. This consists of the analysis of the 10-level constant altitude plan position indicator (CAPPI) generated for the composition of the XRAD every 6 min. The technique is a multi-threshold reflectivity (35–65 dBZ, with gaps of 5 dBZ) searching for those regions exceeding 24 km2 for the largest reflectivity threshold, for each one of the 10 CAPPI. Then, the areas are connected vertically, obtaining a 3D volume associated with every thunderstorm. Several parameters characterise the cell: the 3D centroid, the heights of the top and the base, the maximum and mean reflectivity, the volume, and the VIL, among others. This information allows performing an accurate tracking of most of the thunderstorms. Figure 5 shows the tracking and the part of the life cycle of a severe thunderstorm that occurred on 6 September 2021, which produced a hailfall with stones of a diameter over the 6 cm.
The previous figure illustrates some important questions to have in mind at the time of using the LJ tool operationally. Firstly, one of the main advantages is the time resolution (one minute) and the short delay (also one minute), in front of the weather radar volumetric composite and its final tracking product (six minutes and three minutes of resolution and delay, respectively). However, the capability to provide an accurate location decreases when we consider the multi-source lightning data, and especially for the case of the single source. Besides, because of the use of different restrictions in the number of TLs and the area, the first and last stages of the thunderstorm’s life cycle are detected. In any case, the good results (with a CSI [22] skill score over 70%) of the LJ in the real-time operational performance of the tool indicate that these issues are important, but not a constrain in most of the events. In any case, the good results (with a CSI [22] skill score over 70%) of the LJ in the real-time operational performance of the tool indicate that these issues are important, but not a constraint in most of the events.

2.2.3. Characterisation of Thunderstorms with Lightning Jumps

The main point of the research consists of the identification and characterisation of those thunderstorms producing LJs. To do this, the data bases of LJs, single-TL sources, and radar convective cells were analysed, considering the following steps (Figure 6):
  • Identify each LJ, and search for other ones occurring at a distance of less than 50 km and no later than 2 h (the thresholds are based on the operational campaigns of 2018 to 2021; none of the thunderstorms produced two correlative LJs with differences in time and space exceeding those values);
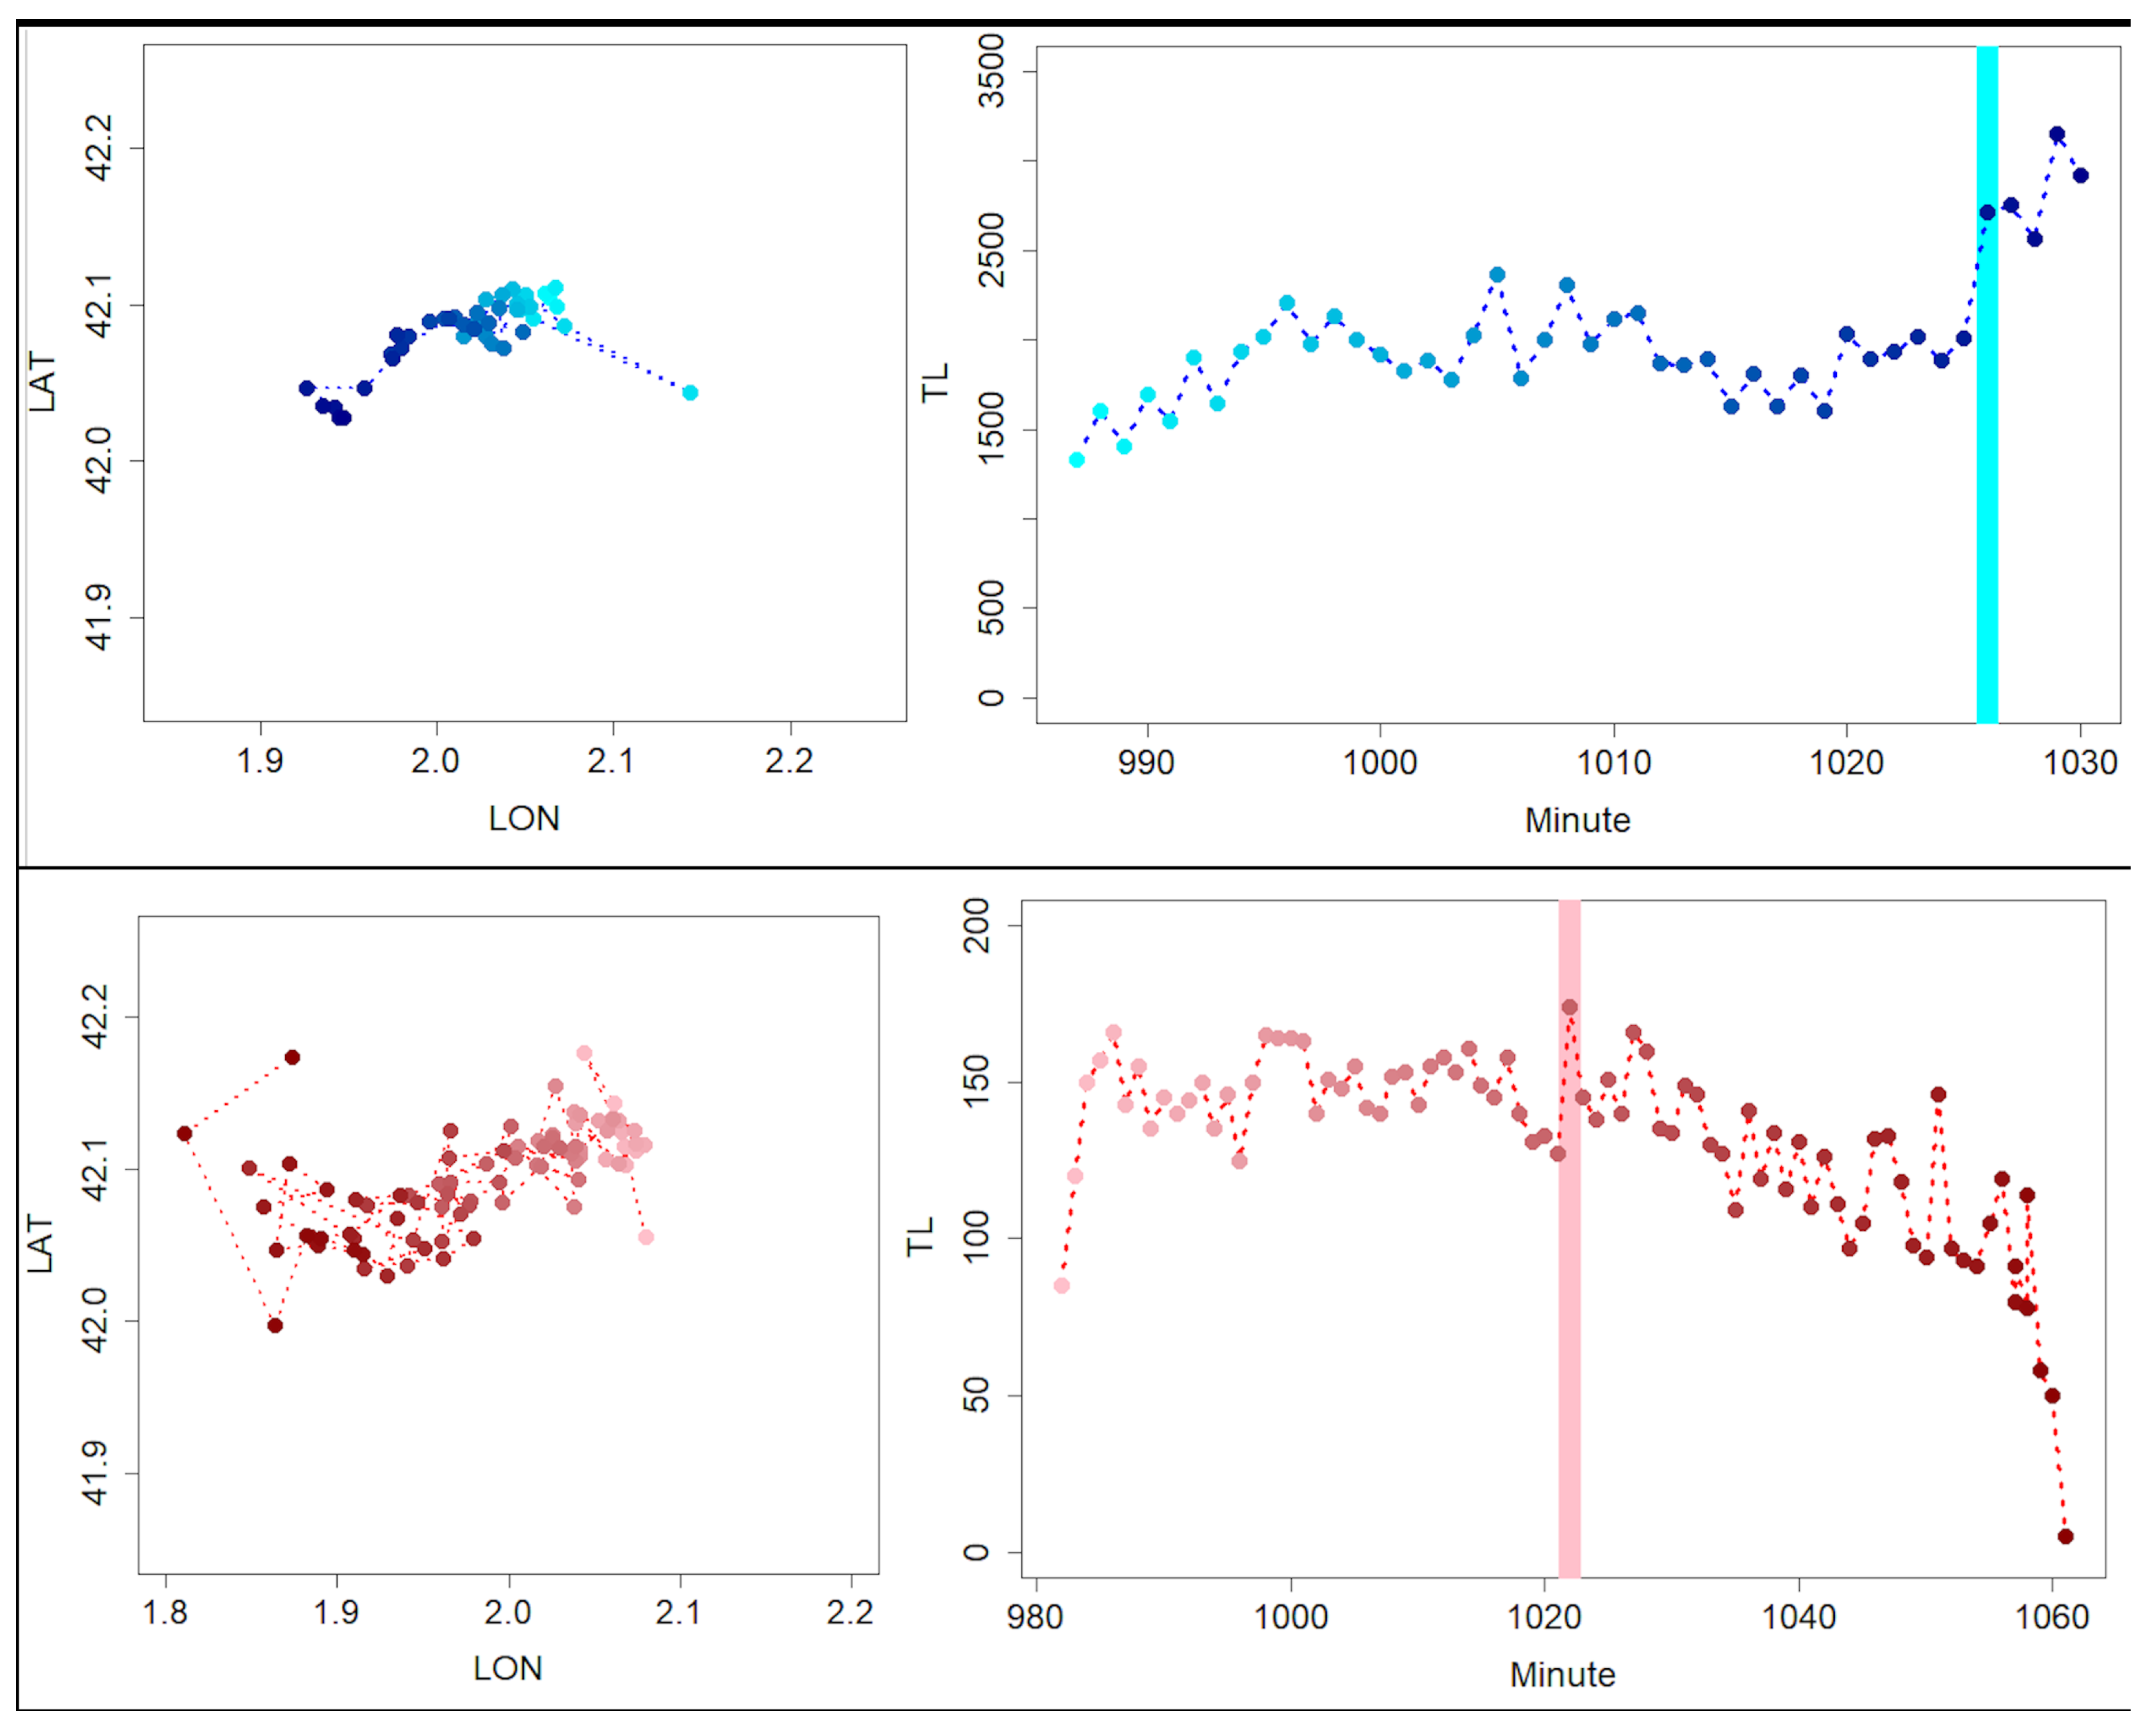
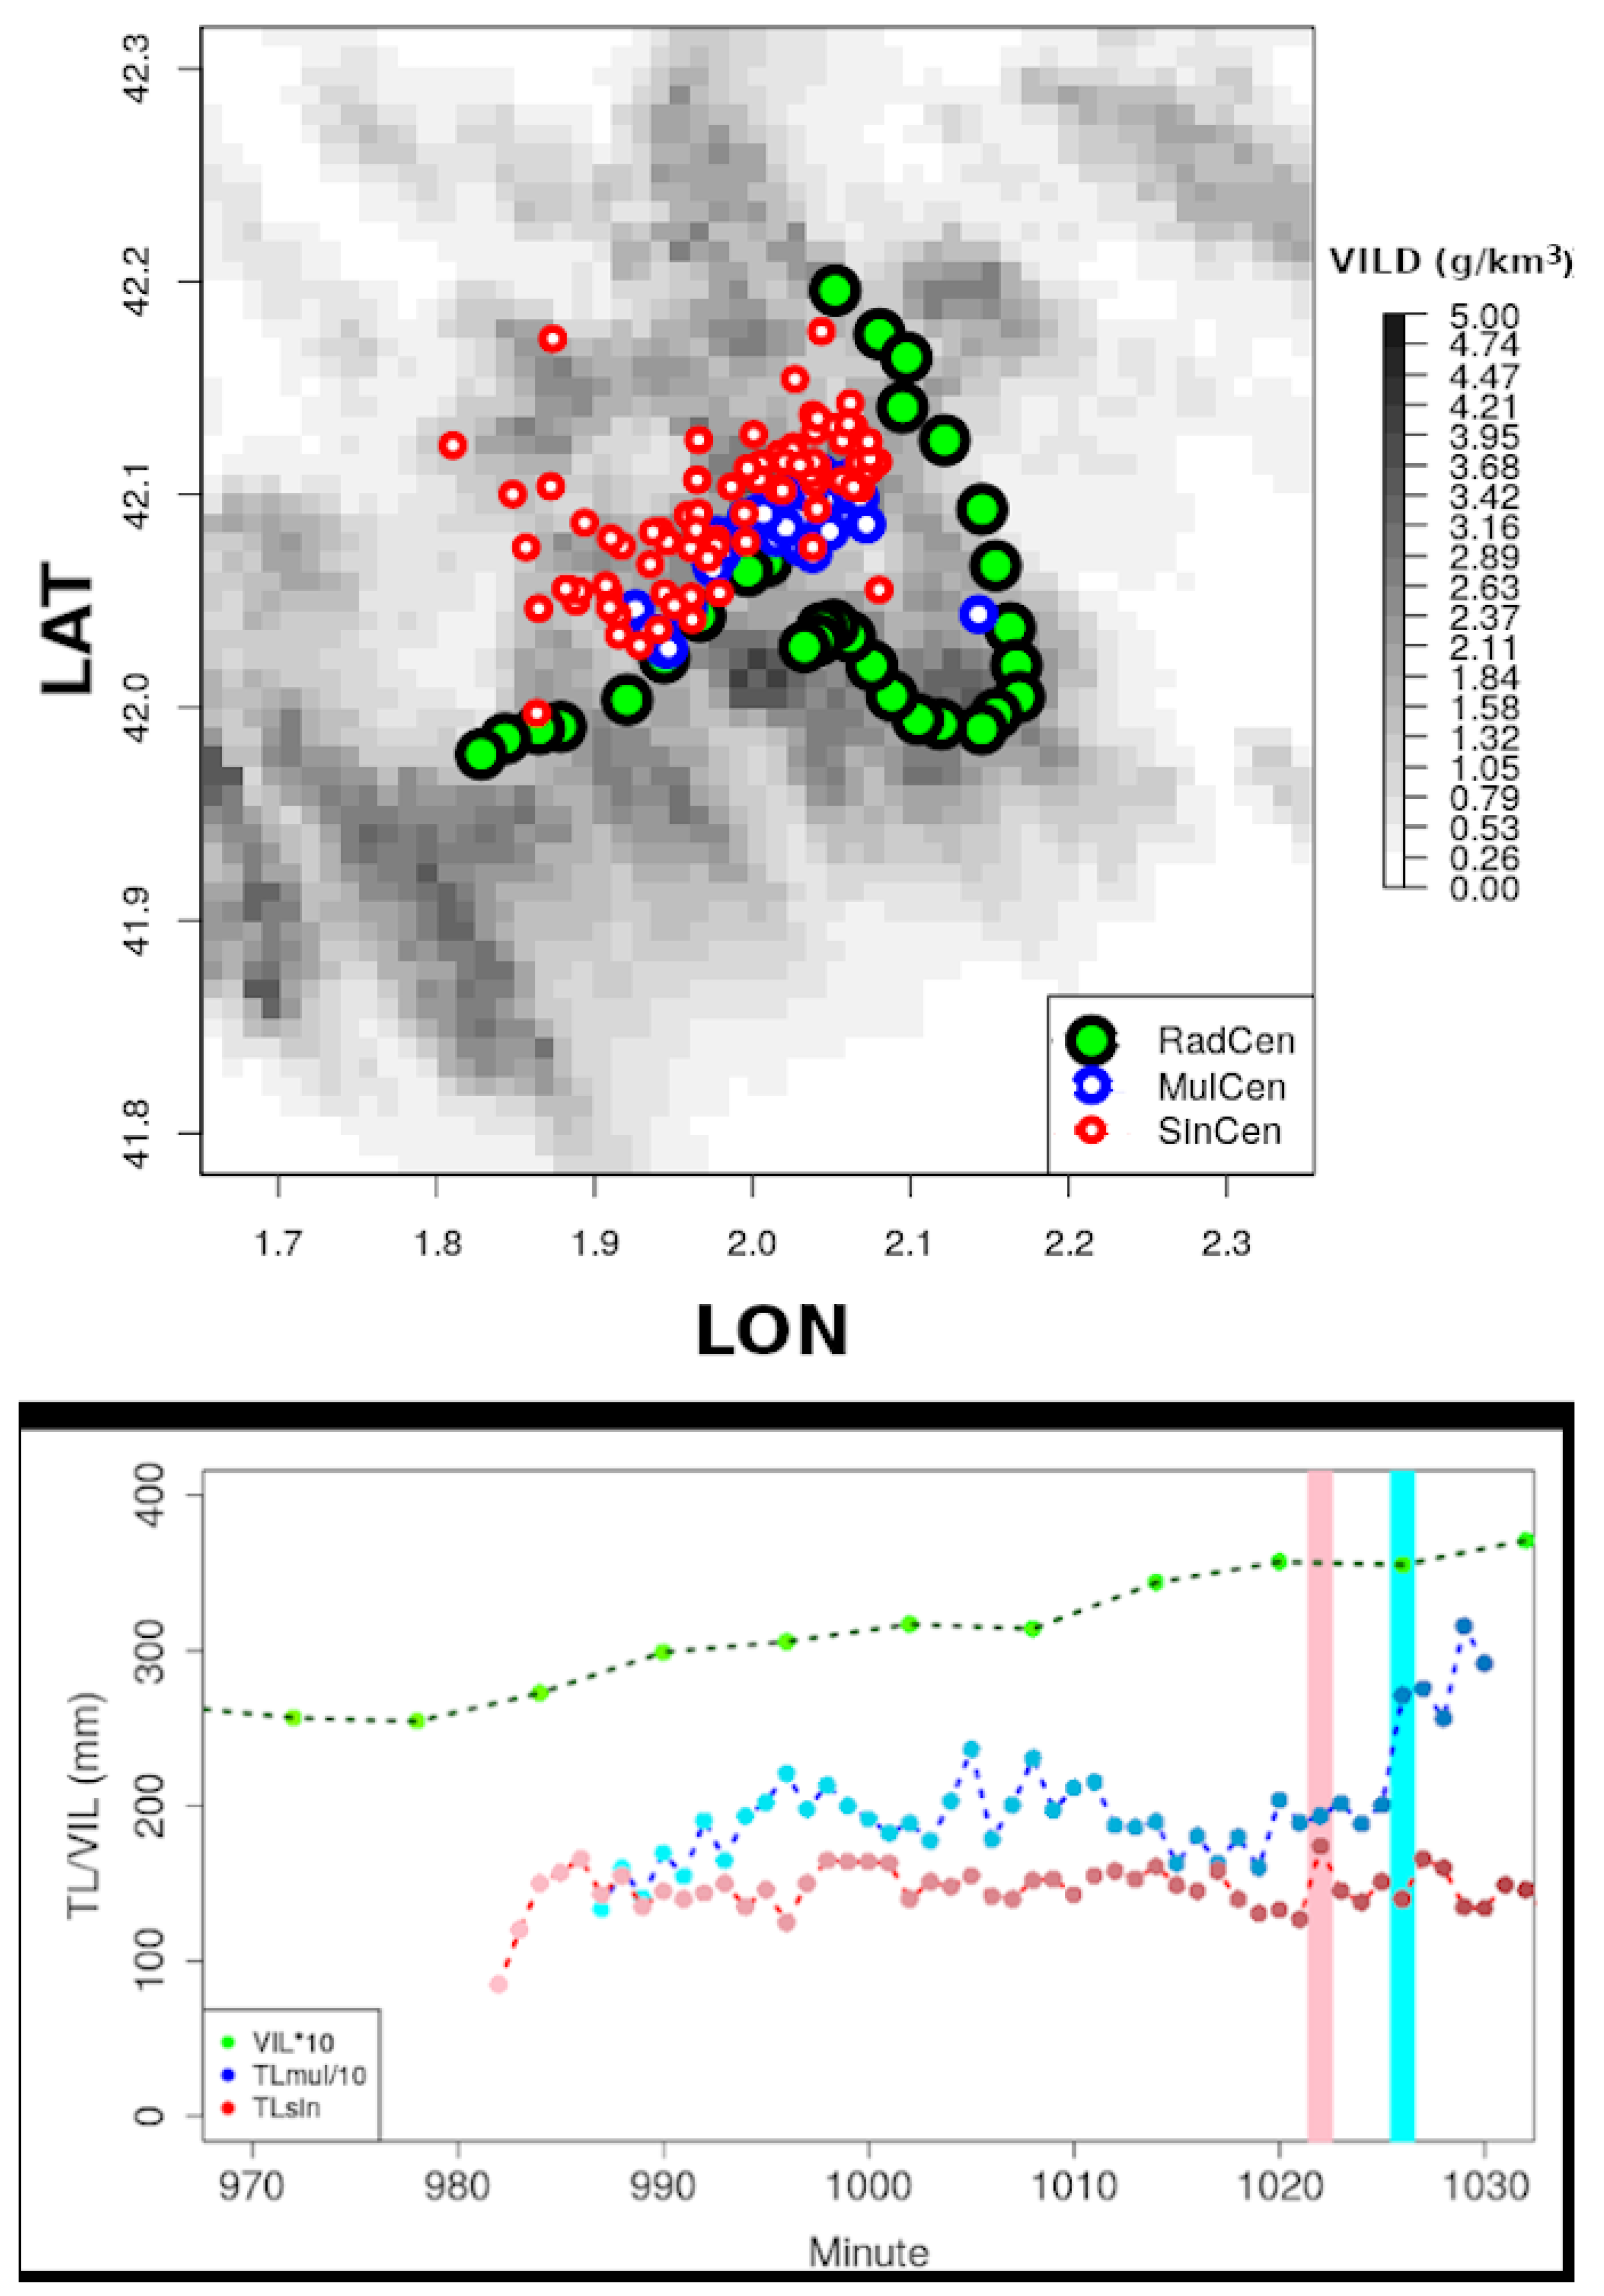
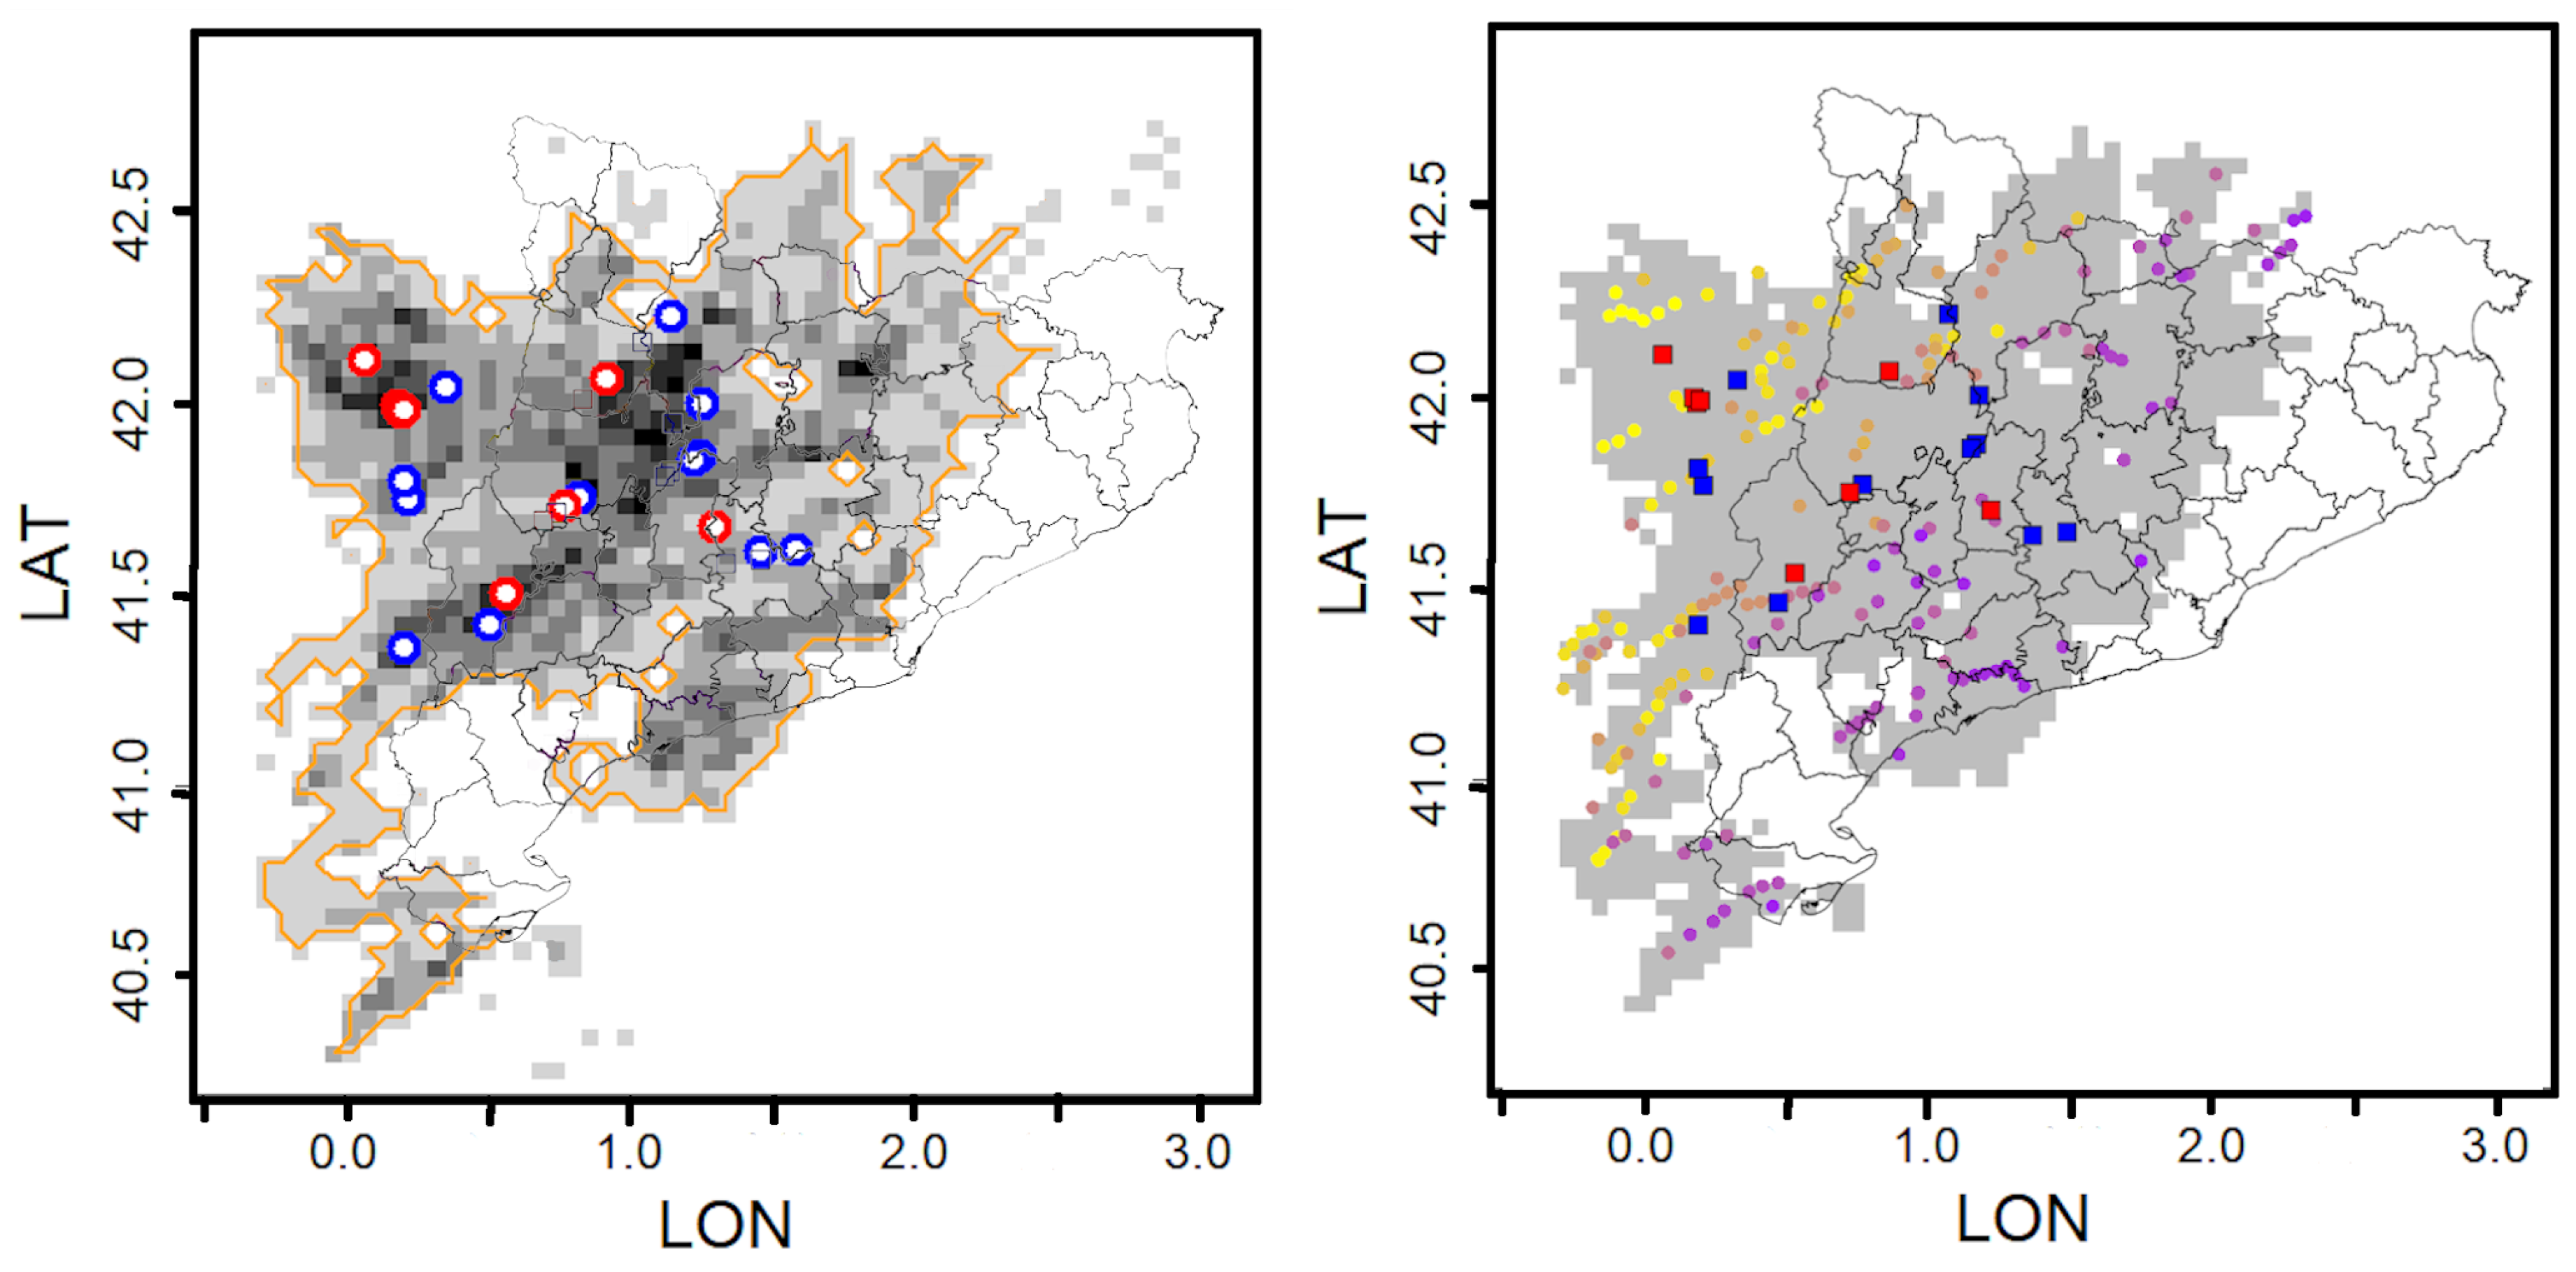
  • Confirm that the two LJs correspond to the same thunderstorm; the map of the TL density of single sources has a plot confirming or not that there is spatial continuity in the electrical activity between both LJs, as shown in Figure 6;
  • The last step includes all the cells during the period when the thunderstorm occurred in the region of electrical activity.
The thunderstorms were characterised by different types of variables: the initial and ending times (with the format: year, month, day, hour, and minute), the area of TL activity, the duration, the number of LJs, which corresponded to single- (Level 2) or multi- (Level 1) source flashes, the number of radar cells, and the maxima and mean reflectivity, and the echo top. From this information, we tried to answer the following questions:
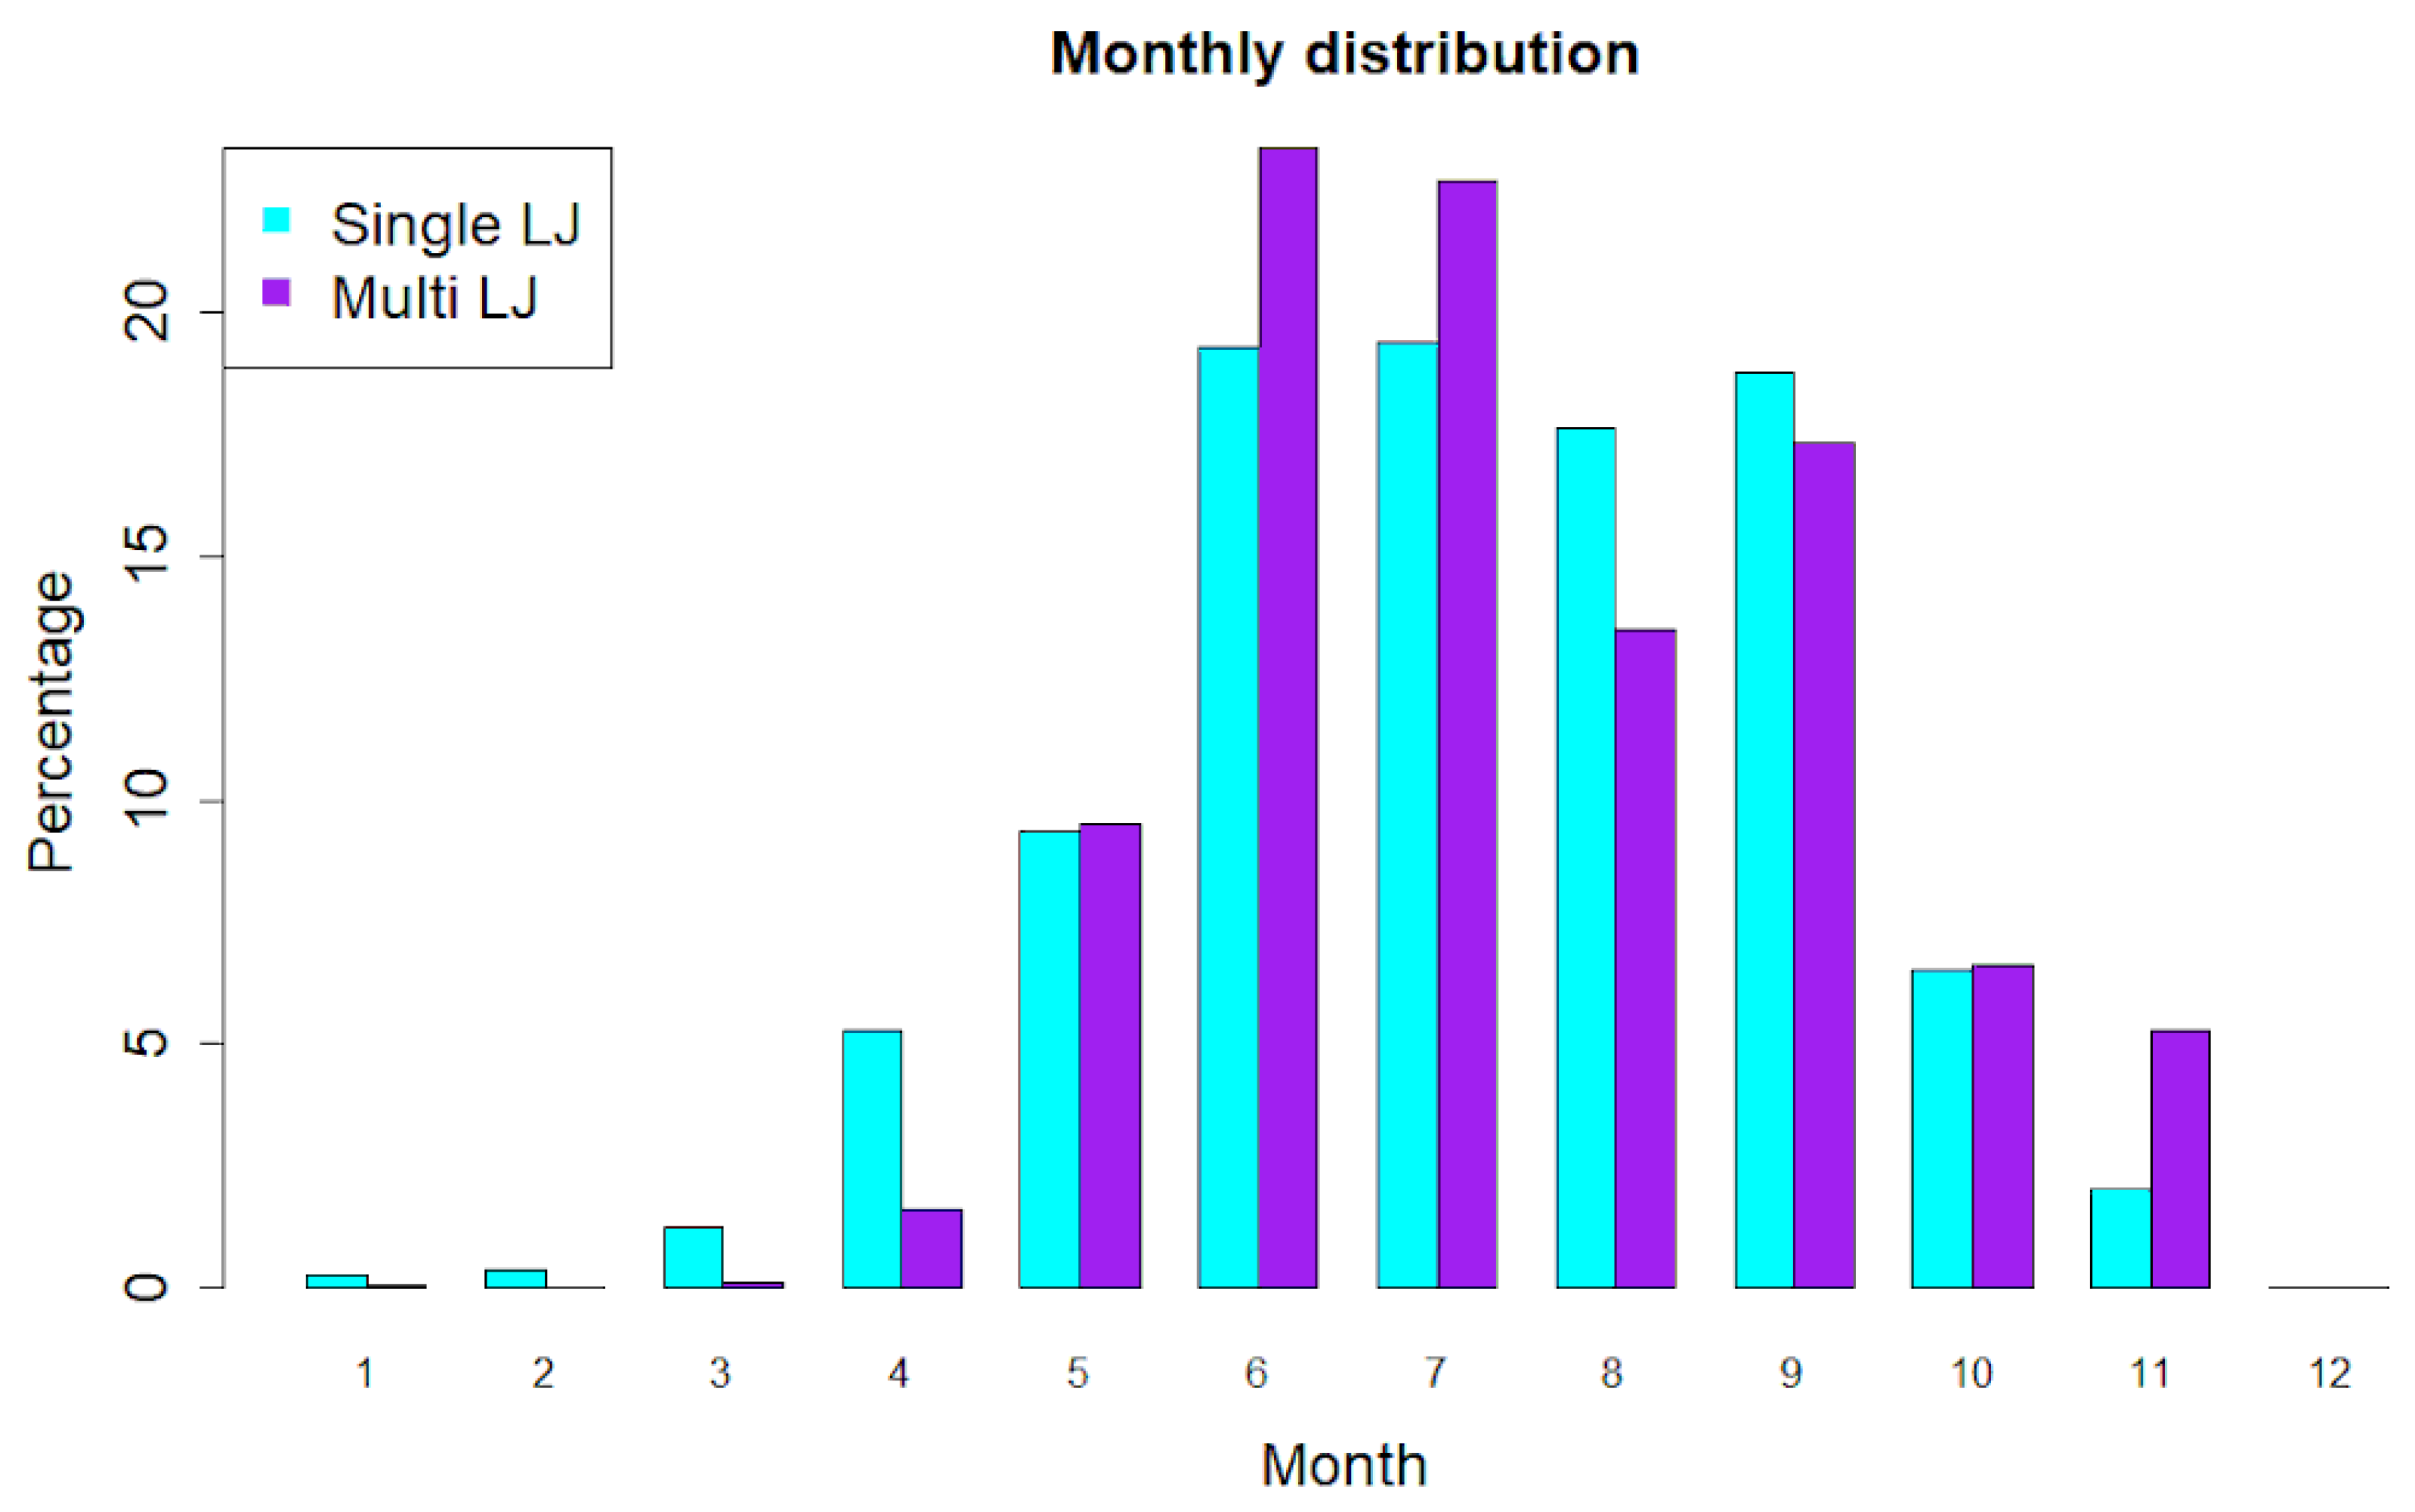
  • Which is the period of greater occurrence of LJ thunderstorms? Which is the part of the day with a higher probability?
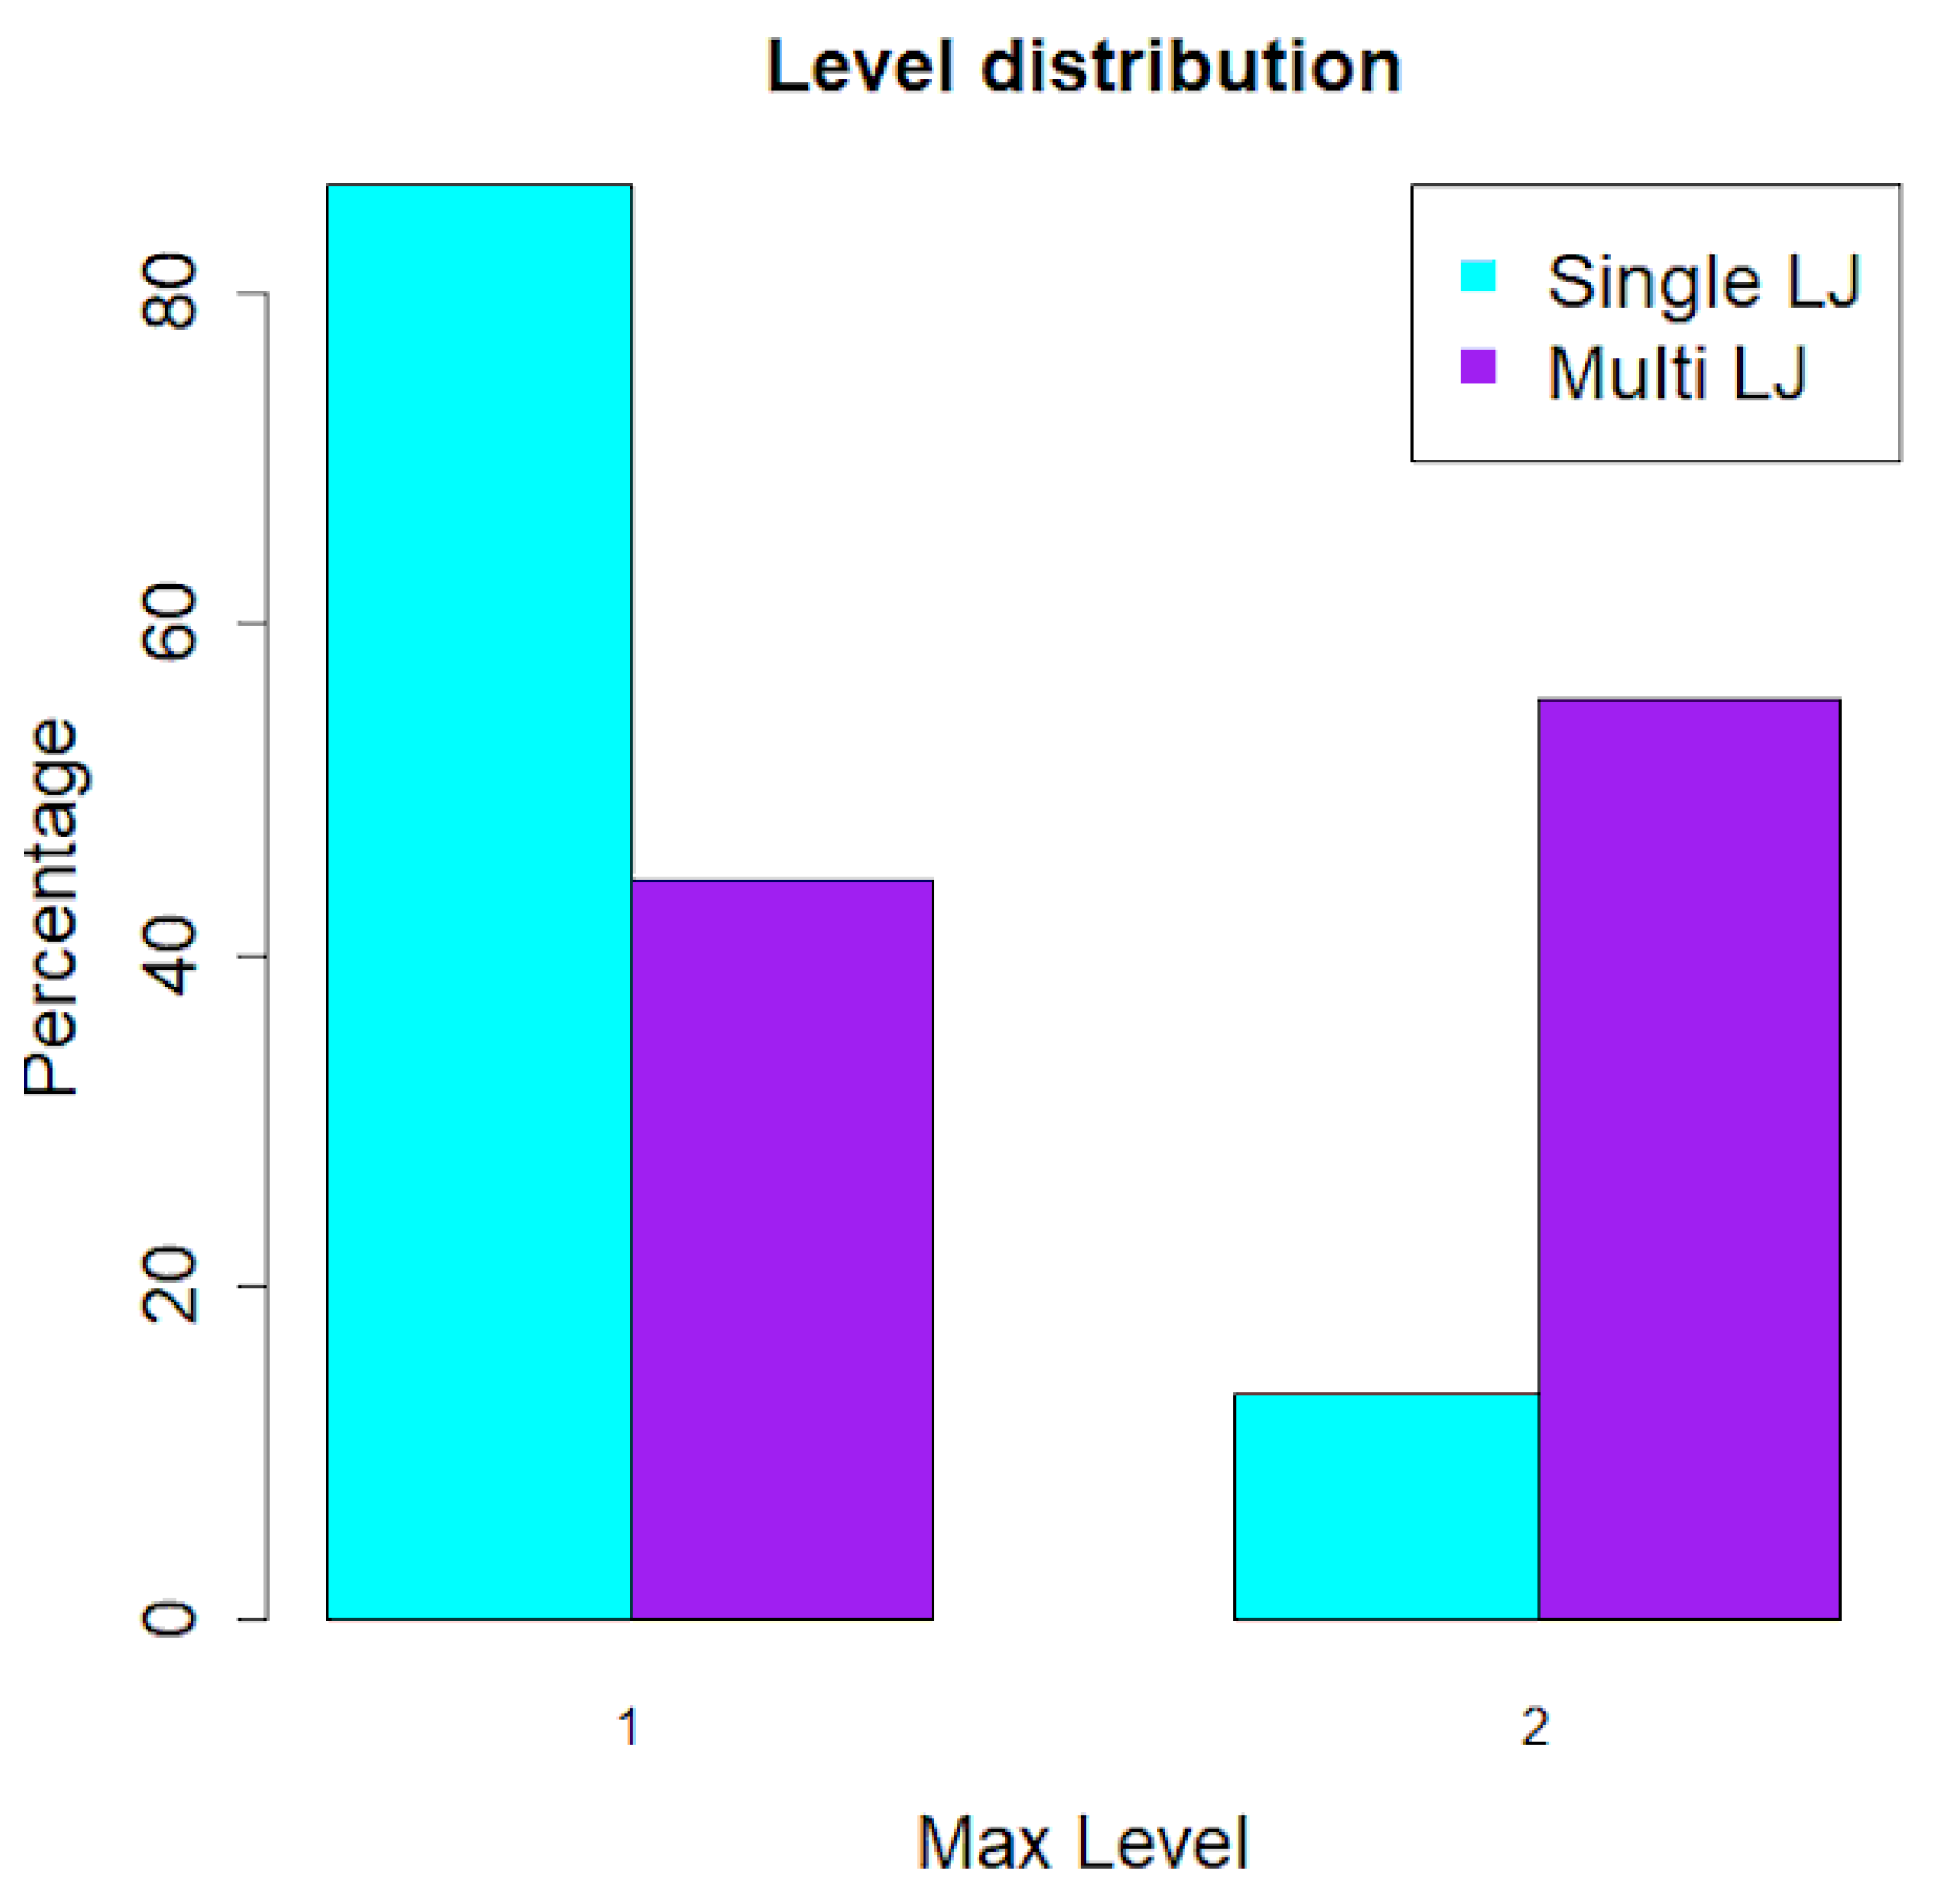
  • Is SLJst or MLJst more common?
  • Which are the radar parameters that act to discriminate between single- and multiple-LJ thunderstorms?
  • Which are the usual degrees of convective organisation associated with multiple LJs?

3. Results

The analysis of the dataset of LJs of both levels, 1 (multi-source TL) and 2 (single-source TL), included a total of 8906 LJs, for the period 1 January 2006 to 30 September 2021. This value corresponds to 982 d with, at least, one LJ, of the total of 5752 d of the full period. This implies that in a 17.1% of the days of the period, at least one LJ occurred. Having in mind that the convective period in the region of study goes from April to October, the period where the probability of the major occurrence of LJs reduces to 3393 d and the percentage of days with LJs (considering that there were 937 d with LJs during these months) increased to 27.6%. The next sections present the analysis of the different characteristics of the thunderstorms producing single- and multiple-LJs during this period.

3.1. Short Climatology of Thunderstorms Producing LJs in Catalonia

From the eight-thousand, nine-hundred and six LJs and considering the previous criteria that two LJs correspond to the same thunderstorm if they occurred at a distance less than 50 km, a time gap under 120 min, and a continuity in the single-source TL field, we found that they could be grouped into two-thousand, four-hundred and seven thunderstorms, from which eight-hundred were were SLJsts and one-thousand six-hundred and seven were MLJsts (that is, 59.4% of the thunderstorms producing LJs were MLJsts).
The monthly distributions of SLJsts and MLJsts (Figure 7) showed a similar shape, with a normal curve with a maximum probability for the months June and July. However, there were significant differences, which could be relevant in terms of operational purposes. The first one is that the months August and September present similar probabilities of occurrence (only a bit lower) than June and July in the cases of SLJsts, while the differences are more significant in the case of the MLJsts. Then, the probability of having an MLJst decreases while the SLJst occurrence increases as we move far from June and July. In this sense, the cases with MLJsts for the months December, January, February, and March are practically null, and only SLJsts are usual. Finally, November is the unique month out of the convective period (April to October) where the probability of MLJsts is more relevant than in the case of SLJsts.
The hourly distributions (Figure 8) also presented the same pattern, with the maximum probability of occurrence between 12 UTC and 18 UTC (coinciding with the diurnal cycle of the convection). However, the peak of the SLJsts was sharper because their duration was shorter and more concentrated in less hours. On the other hand, the MLJsts can stand for longer periods, and then, LJs can also occur out of the maximum period.
Considering the two levels of the LJs, the first associated with the detection of multiple sources of flashes (occurring in thunderstorms producing small hail, moderate wind gusts, or intense rainfalls) and the second linked to the single sources of the lightning in severe thunderstorms (the ones producing tornadoes, large hail, or strong wind gusts), Figure 9 presents which is the highest level of an LJ in SLJsts and MLJsts, respectively. In the case of MLJsts, a value of two does not mean that jumps of this level only have occurred. MLJsts usually produce both levels of LJs. In any case, SLJsts are more prone to give Level 1 jumps, while the contrary occurs in MLJsts. In this way, deeper convective thunderstorms will produce more than one LJ and at least one of Level 2 also.
It is interesting to indicate that 44.6% (716) of MLJsts only produced Level 1 jumps. Of these MLJsts without Level 2 jumps, a 78.9% (562) triggered three jumps as the maximum. Only 1% (eleven) of MLJsts with only Level 1 jumps produced nine or more LJ. We did not find any relevant feature of those cases regarding the normal distributions shown in the previous figures. On the other hand, in the case of the ninety three MLJsts that produced five or more jumps, the pattern was very relevant. There were 86% (80) of cases that occurred between July and September, and 40.1% (38) of the thunderstorms developed between 13 UTC and 15 UTC. Then, diurnal and summer deep convection play a principal role in the occurrence of MLJsts with several jumps of Level 2.
To end this point, Table 1 presents the number (and the percentage) of thunderstorms of the different categories: single-LJ, 2 to 4 LJs, 5 to 9 LJs, 10 to 14 LJs, and more than 14 LJs. In all cases, the number of thunderstorms with Level 1 LJs was notably higher than of Level 2. Besides, all those thunderstorms with five or more LJ had, at least, one Level 1 jump. In the same way, the presence of Level 2 LJs in thunderstorms increased from the same value (this is, cases with five or more LJ).

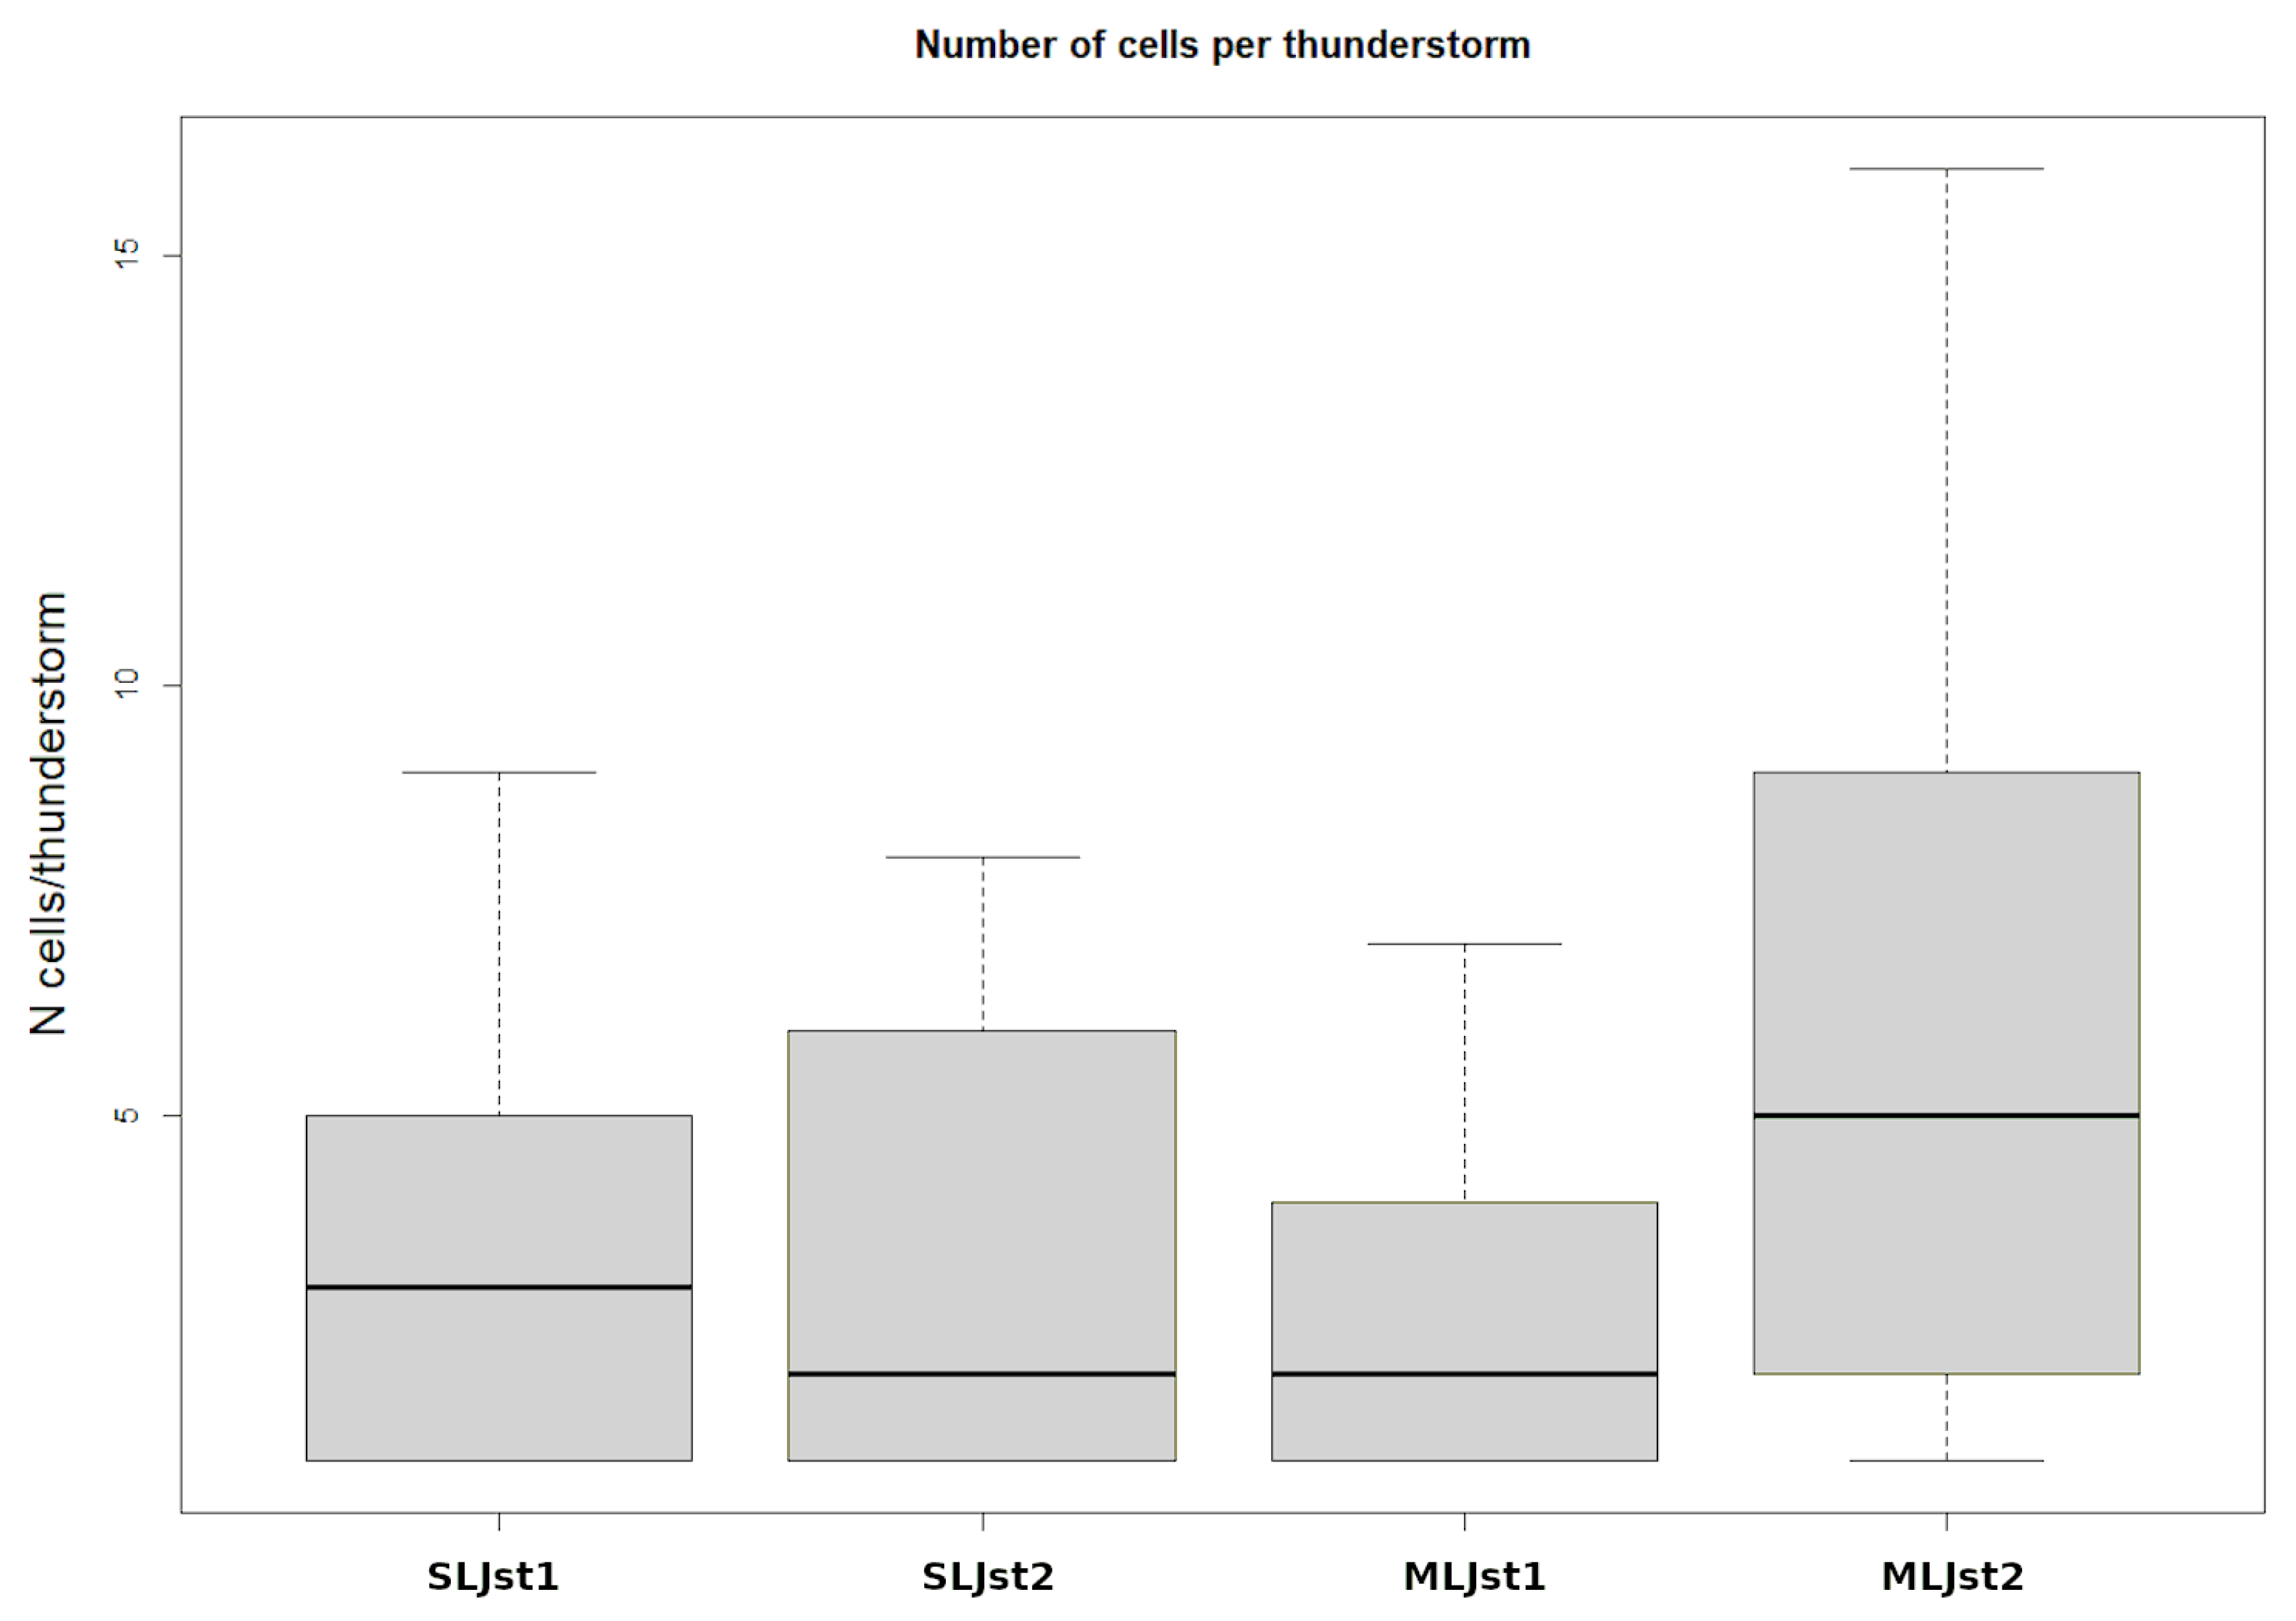
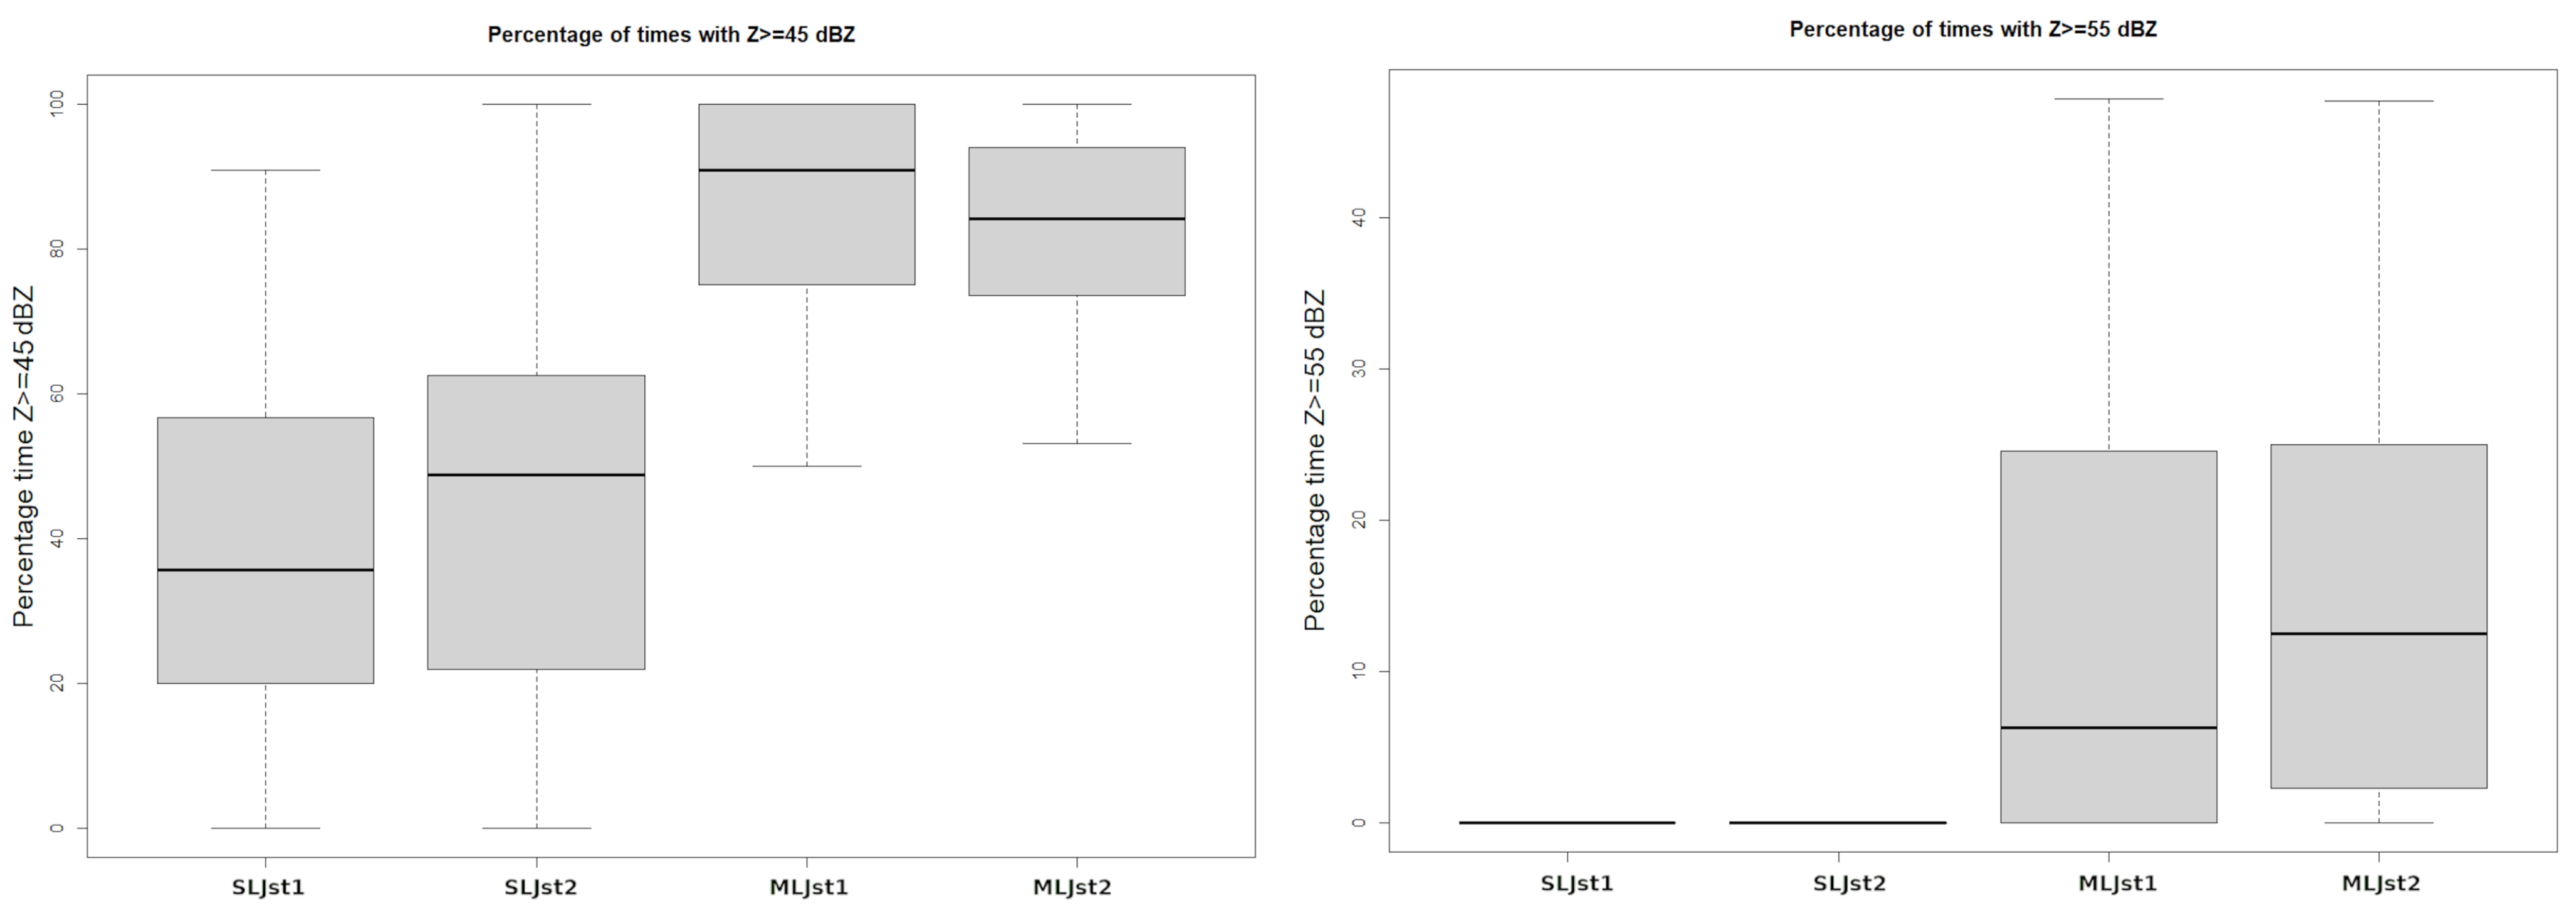
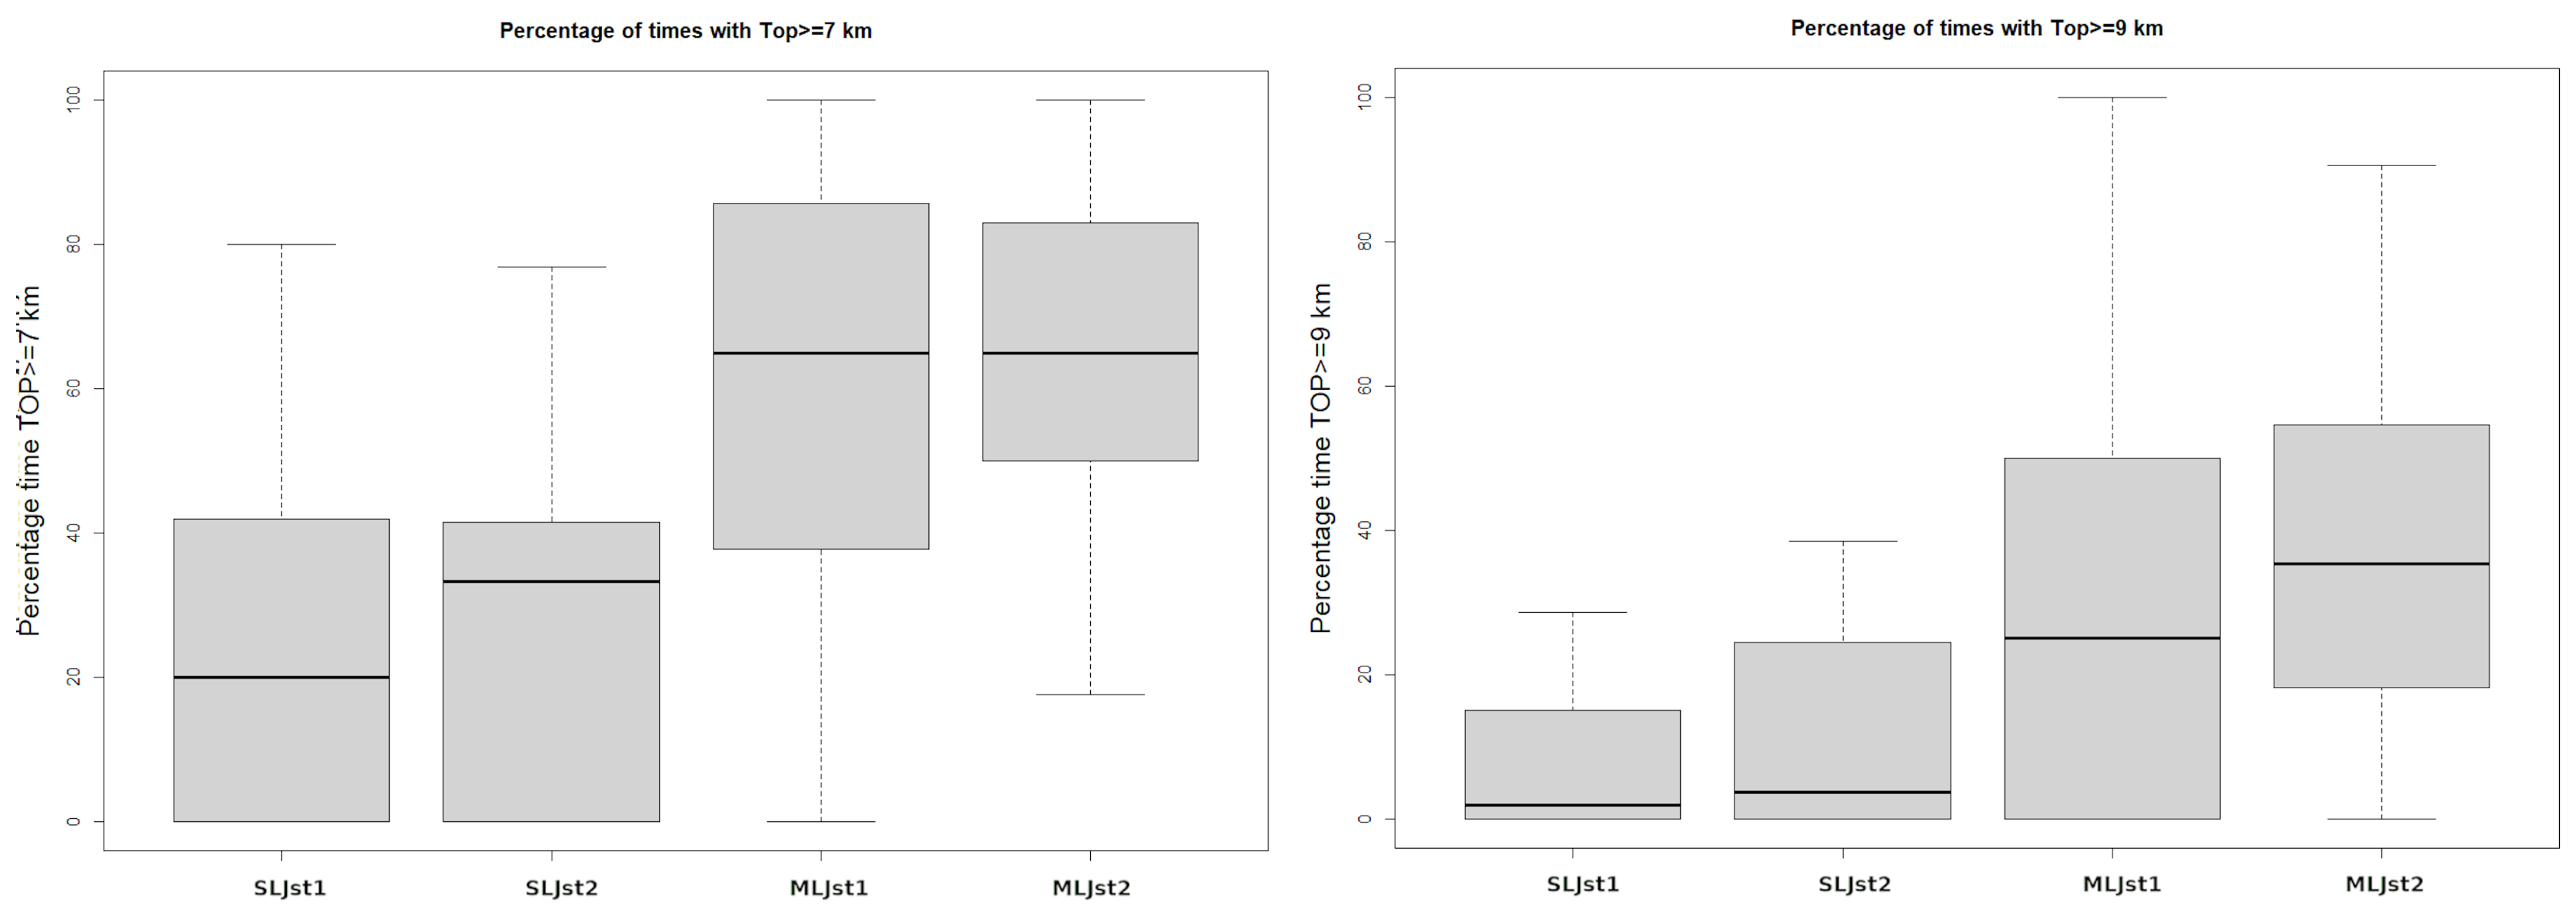
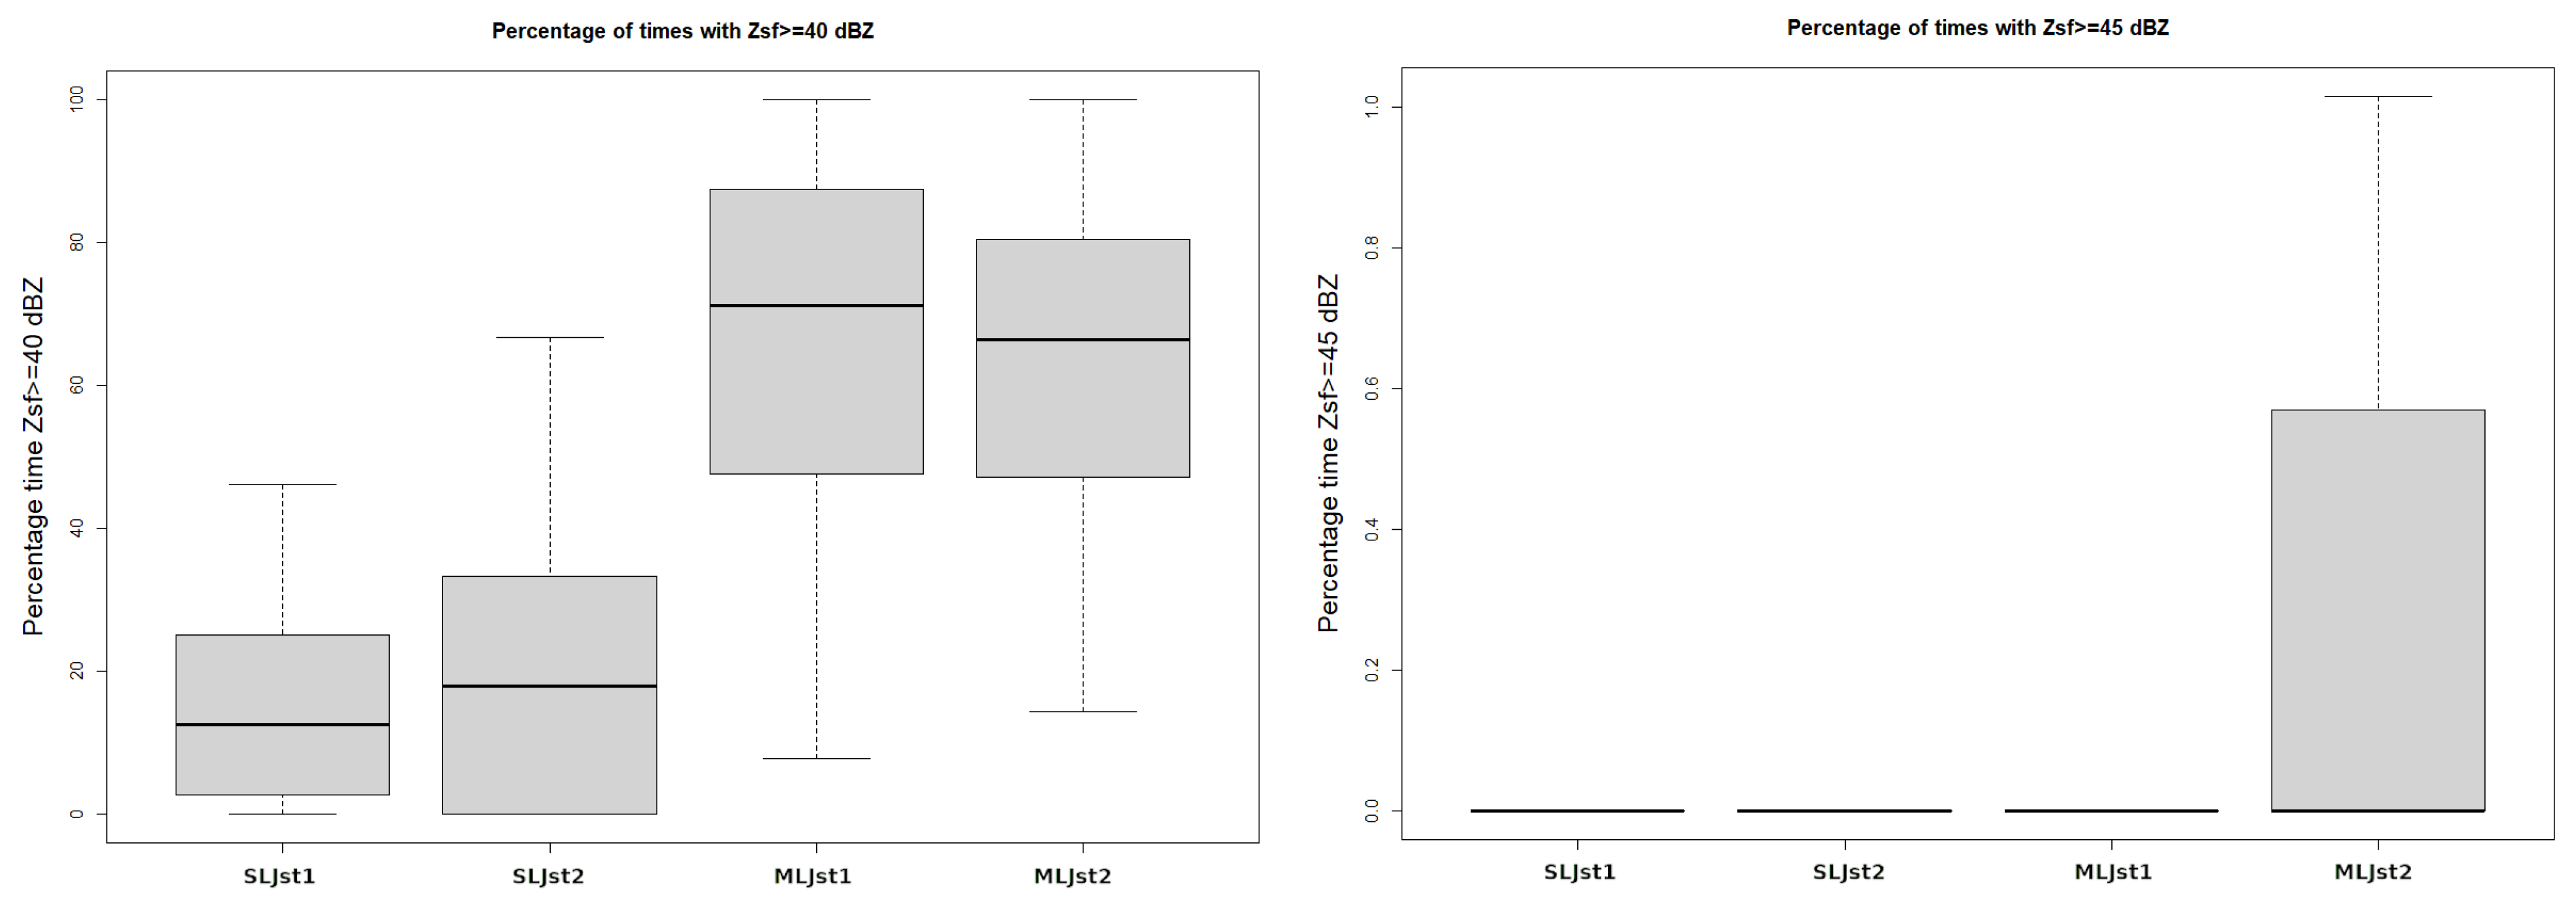
3.2. Radar Parameters Associated with Thunderstorms Producing LJs

The analysis of the radar data in cases of thunderstorms producing LJs was performed using the information of the algorithm of identification, characterisation, tracking, and nowcasting of convective cells of the Meteorological Service of Catalonia [21]. This consisted of determining the behaviour of some signatures such as the number of convective cells and the reflectivity and the height of those cells. The thunderstorms were classified as: (1) with a single Level 1 jump (SLJst1), (2) with a single Level 2 jump (SLJst2), (3) with multiple jumps all of Level 1 (none of Level 2) (MLJst1), and (4) with multiple jumps and at least one of Level 2 (MLJst2). Figure 10 reveals how the MLJst2 category of thunderstorms presented the largest number of cells on average (with a mean value of five), probably because of the high degree of organisation of the convection and the largest duration. On the other hand, thunderstorms with MLJst1 had the lowest number of cells, with a mean value of two, a bit lower that the class of thunderstorms with SLJst2.
To discriminate the different categories of thunderstorms, we observed that the maximum values of reflectivity or echo top (for the 35 dBZ reflectivity threshold, in this case) did not work properly. Most thunderstorms producing any class of LJ reached high values of both parameters, at least for a short period. However, from our experience and from the analysis of many of the thunderstorms of the dataset, it was possible to identify that the discriminating signatures were more related to the duration of the exceedance of certain thresholds. Because of this, we analysed the reflectivity at the surface and for the whole cell volume, as well as the echo top. In the first case, we considered two different thresholds: 40 dBZ and 45 dBZ. Figure 11 presents how, in the first case, all thunderstorm categories exceeded the threshold for a more or less long period of the life cycle. However, MLJsts showed a higher duration of the exceedance, while SLJsts had a more brief period with intense reflectivity at the surface. However, if we move to the highest threshold, only MLJst2 had periods where 45 dBZ were exceeded. Then, this type of thunderstorm has the highest and more intense exceedance periods of high reflectivity values.
In a similar way, but for the maximum reflectivity of the full cell volumes (Figure 12), the SLJsts usually had a shorter duration of exceedance of 45 dBZ than MLJst. Besides, SLJsts rarely exceeded during their life cycle 55 dBZ, contrary to MLJst. Finally, it is important to remark that this exceedance was more common in MLJst2.
Finally, the echo top 35 dBZ (Figure 13) presented again a similar behaviour as the reflectivities, for both thresholds of height exceedance (6 km and 8 km). SLJsts exceeded for a shorter time period both thresholds, in comparison to MLJsts. Besides, the values were larger in those MLJst2 cases.

3.3. Degree of Convection in Thunderstorms Producing LJs

The set of LJ-producing thunderstorms were classified according to the scheme shown in Figure 14. The classification was performed by combining the automatic generation of the maps, as presented in Figure 7, and the visual analysis of these maps. It is worth noting some considerations regarding the classification. The first one regards the question of the subjectivity of the analysis: the experience of the authors can reduce this issue, but some complex thunderstorms can be classified in a different way depending on the point of view. In any case, the number of doubtful events was reduced compared with the total number. The second point is that only those cases totally in the range of volumetric information of the radar network were included (see, for instance, [23]). This consideration avoided having the wrong perspective of the selected thunderstorm. In the case of the SLJsts, the percentage of discarded elements was 15% (the total of valid thunderstorms was 675). However, for the MLJsts, only 37% of cases were used (605). We preferred reducing the total number of cases (that is, comparable with the SLJsts) to generate a large set of misclassified events.
Table 2 summarises the distribution of the cases for each type of thunderstorm (SLJst or MLJst), which, at the same time, were sub-classified depending on the maximum degree of the warnings (1 or 2). The key elements of the classification (see the caption of the table for the definition of the different categories) were as follows: First, organised thunderstorms are the most common except in the case of MLJst1. Second, for this last category, the unique convective cells types predominated, in particular those with a lineal trajectory. Third, the isolated category was the least common except for SLJst1. Lastly, for those categories with Level 2 jumps (SLJst2 and MLJst2), a clear predominance of the organised structures existed.

4. Discussion

The novelty of the research makes it complicated to find other works useful for comparison with the current results. In any case, some references showed equivalence with the analysis of MLJsts, mainly in the sense that they referred to severe phenomena and the convection that produced them. In the case of the time distributions of the thunderstorms, the comparative research works referred mainly to the region of study (Catalonia and the surroundings). References [24,25] showed the high degree of occurrence of severe weather in thunderstorms moving along an anomalous path (e.g., splitting, merging, or deviation from the normal flow). In this way, Reference [26] analysed convective thunderstorms with anomalous trajectories through weather radar data, finding that March to September presented the largest number of convective cases. This monthly distribution agrees with that observed in the current research. The same occurs with severe phenomena: Reference [4] presented a peak of activity between the months of May and September and, in the case of the hourly distribution, between 12 UTC and 20 UTC, also coincident with the thunderstorms producing LJs. Then, it is consequent that the analysis of hailstorms for the western part of Catalonia [21] also coincides in the monthly distribution. On the other hand, the comparison with mesoscale convective systems (MCSs) in Catalonia [27] presents notable differences, with a maxima of activity during the months of March, April, September, October, and November and for the hours of the day between 18 UTC and 22 UTC. This is because only a portion of the MCSs present an intense electrical activity, and then, the occurrence of LJs in those thunderstorms is less frequent.
Compared with other analyses for European regions ([9] or [16]), the time and monthly distributions follow similar regimes, with differences according to the local topographic conditions. To end this first comparison, the hourly distribution was compared with infrared satellite overshooting (OT), another severe weather indicator [28]. Reference [29] showed the high interaction between OT and LJs in severe thunderstorms. Then, the European analysis of [28] indicated also that the maxima of OT coincided with the period 12 UTC to 18 UTC in the case of Catalonia.
Moving to the radar parameters observed in thunderstorms producing LJs, the number of references for performing a direct comparison is larger than in the previous case. For instance, Reference [11] found that clusters producing LJs have a greater duration, which has a certain similitude with the fact that, having more than one jump, the organisation and the number of cells in the thunderstorm increase. Besides, References [9,11,15,16] observed a larger intensity in different radar parameters in those thunderstorms that produced at least one LJ. Again, the present research followed the same line, but went a step further, indicating that it is not only a question of intensity if not also of the maintenance of these large values observed in the different radar parameters: MLJsts, and mainly in the case of Level 2, have durations of intensity much longer than the rest of the thunderstorms.
Finally, the analysis of the convective mode of the thunderstorms gives an explanation to the previous point (thunderstorms maintaining large values of radar parameters): the organisation of the convection in MLJsts is much larger than in other cases, with a predominance of structures with a long linear path for a unique convective cell, or multiple cells moving parallel or producing well-defined splitting and merging processes. Both cases can be associated with super-cellular convection, according to [30]. Besides, multiple cells moving parallel is the classic structure of MCSs or squall-lines with well-defined lines of cells ([31] or [27]). In both cases, supercells and MCSs, this refers to the convective structures with the highest degree level of organisation [32].

5. Conclusions

To sum up, most of the thunderstorms producing LJs are associated with the diurnal cycle of convection (occurring between 12 UTC and 18 UTC) and with the months with the peak of solar insolation (March to September). One important conclusion is that more than two thirds of these thunderstorms produce more than one jump (MLJsts). Besides, MLJsts have a larger probability of producing Level 2 jumps (60% in front of the 15% that happens in SLJsts).
Regarding the relationship with radar parameters, the main points are:
  • Thunderstorms with Level 2 LJs include more convective cells interacting;
  • There are notable differences in the maximum values between SLJsts and MLJsts, with largest values in the second case;
  • In any case, the main differences are observed when the analysis is focused on the duration of the more intense cores in the thunderstorm.
Finally, the organisation of the convective cell(s) in the structure of the thunderstorm has a major role in its intensification, with long-linear paths or splitting–merging processes occurring during the life cycle.
These results can help to improve the operational forecasting tasks and, besides, to have better knowledge of this type of thunderstorm, which has a high relationship with extreme precipitation cases in many regions of the globe.

Author Contributions

Conceptualisation, T.R. and C.F.; methodology, T.R.; software, T.R.; validation, C.F.; formal analysis, T.R. and C.F.; investigation, T.R. and C.F.; data curation, T.R.; writing—original draft preparation, T.R.; writing—review and editing, C.F.; visualisation, T.R. and C.F. All authors have read and agreed to the published version of the manuscript.

Funding

This research received no external funding.

Institutional Review Board Statement

Not applicable.

Informed Consent Statement

Not applicable.

Data Availability Statement

Not applicable.

Acknowledgments

The authors want to thank to the colleagues of the Meteorological Service of Catalonia for the provided help and to the three anonymous reviewers for their interesting suggestions and comments.

Conflicts of Interest

The authors declare no conflict of interest.

Abbreviations

The following abbreviations are used in this manuscript:
CAPPIConstant altitude plan position indicator
CGCloud-to-ground
CSICritical success index
ICIntra-cloud
LJLightning jump
LJ1LJ from multi-source lightning
LJ2LJ from single-source lightning
LLSLightning Location System
LFLow frequency
SMCMeteorological Service of Catalonia
TLTotal lightning
VHFVery high frequency
VILVertical integrated liquid
SLJstThunderstorms producing a single LJ
MLJstThunderstorms producing multiple LJs
SLJst1Thunderstorms producing a single LJ of Level 1
MLJst1Thunderstorms producing multiple LJs of Level 1
SLJst2Thunderstorms producing a single LJ of Level 2
MLJst2Thunderstorms producing multiple LJs with at least one of Level 2

References

  1. Farnell, C.; Rigo, T.; Pineda, N. Lightning jump as a nowcast predictor: Application to severe weather events in Catalonia. Atmos. Res. 2017, 183, 130–141. [Google Scholar] [CrossRef]
  2. Gatlin, P.N.; Goodman, S.J. A total lightning trending algorithm to identify severe thunderstorms. J. Atmos. Ocean. Technol. 2010, 27, 3–22. [Google Scholar] [CrossRef]
  3. Schultz, C.J.; Petersen, W.A.; Carey, L.D. Preliminary development and evaluation of lightning jump algorithms for the real-time detection of severe weather. J. Appl. Meteorol. Climatol. 2009, 48, 2543–2563. [Google Scholar] [CrossRef] [Green Version]
  4. Farnell, C.; Rigo, T. The Lightning Jump, the 2018 “Picking up Hailstones” Campaign and a Climatological Analysis for Catalonia for the 2006–2018 Period. Tethys 2020, 17, 10–20. [Google Scholar] [CrossRef]
  5. Farnell, C.; Rigo, T. The lightning jump algorithm for nowcasting convective rainfall in Catalonia. Atmosphere 2020, 11, 397. [Google Scholar] [CrossRef] [Green Version]
  6. Wu, F.; Cui, X.; Zhang, D.L. A lightning-based nowcast-warning approach for short-duration rainfall events: Development and testing over Beijing during the warm seasons of 2006–2007. Atmos. Res. 2018, 205, 2–17. [Google Scholar] [CrossRef]
  7. Farnell, C.; Rigo, T.; Pineda, N. Exploring radar and lightning variables associated with the Lightning Jump. Can we predict the size of the hail? Atmos. Res. 2018, 202, 175–186. [Google Scholar] [CrossRef]
  8. Schultz, C.J.; Petersen, W.A.; Carey, L.D. Lightning and severe weather: A comparison between total and cloud-to-ground lightning trends. Weather Forecast. 2011, 26, 744–755. [Google Scholar] [CrossRef]
  9. Nisi, L.; Hering, A.; Germann, U.; Schroeer, K.; Barras, H.; Kunz, M.; Martius, O. Hailstorms in the Alpine region: Diurnal cycle, 4D-characteristics, and the nowcasting potential of lightning properties. Q. J. R. Meteorol. Soc. 2020, 146, 4170–4194. [Google Scholar] [CrossRef]
  10. Yao, W.; Zhang, Y.; Meng, Q.; Wang, F.; Lu, W. A comparison of the characteristics of total and cloud-to-ground lightning activities in hailstorms. Acta Meteorol. Sin. 2013, 27, 282–293. [Google Scholar] [CrossRef]
  11. Chronis, T.; Carey, L.D.; Schultz, C.J.; Schultz, E.V.; Calhoun, K.M.; Goodman, S.J. Exploring lightning jump characteristics. Weather Forecast. 2015, 30, 23–37. [Google Scholar] [CrossRef] [Green Version]
  12. Schultz, E.V.; Schultz, C.J.; Carey, L.D.; Cecil, D.J.; Bateman, M. Automated storm tracking and the lightning jump algorithm using GOES-R Geostationary Lightning Mapper (GLM) proxy data. J. Oper. Meteorol. 2016, 4, 92. [Google Scholar] [CrossRef] [PubMed]
  13. Murphy, M.J.; Said, R.K. Comparisons of lightning rates and properties from the US National Lightning Detection Network (NLDN) and GLD360 with GOES-16 Geostationary Lightning Mapper and Advanced Baseline Imager data. J. Geophys. Res. Atmos. 2020, 125, e2019JD031172. [Google Scholar] [CrossRef]
  14. Rudlosky, S.D.; Fuelberg, H.E. Documenting storm severity in the mid-Atlantic region using lightning and radar information. Mon. Weather Rev. 2013, 141, 3186–3202. [Google Scholar] [CrossRef]
  15. Schultz, C.J.; Carey, L.D.; Schultz, E.V.; Blakeslee, R.J. Insight into the kinematic and microphysical processes that control lightning jumps. Weather Forecast. 2015, 30, 1591–1621. [Google Scholar] [CrossRef]
  16. Wapler, K. The life-cycle of hailstorms: Lightning, radar reflectivity and rotation characteristics. Atmos. Res. 2017, 193, 60–72. [Google Scholar] [CrossRef]
  17. Xu, S.; Zheng, D.; Wang, Y.; Hu, P. Characteristics of the two active stages of lightning activity in two hailstorms. J. Meteorol. Res. 2016, 30, 265–281. [Google Scholar] [CrossRef]
  18. Nag, A.; Rakov, V.A. Some inferences on the role of lower positive charge region in facilitating different types of lightning. Geophys. Res. Lett. 2009, 36, L05815. [Google Scholar] [CrossRef] [Green Version]
  19. Nag, A.; Rakov, V.A. Pulse trains that are characteristic of preliminary breakdown in cloud-to-ground lightning but are not followed by return stroke pulses. J. Geophys. Res. Atmos. 2008, 113, D01102. [Google Scholar] [CrossRef]
  20. Dwyer, J.R.; Uman, M.A. The physics of lightning. Phys. Rep. 2014, 534, 147–241. [Google Scholar] [CrossRef]
  21. Rigo, T.; Llasat, M.C. Forecasting hailfall using parameters for convective cells identified by radar. Atmos. Res. 2016, 169, 366–376. [Google Scholar] [CrossRef]
  22. Wilks, D.S. Statistical Methods in the Atmospheric Sciences; Academic Press: Cambridge, MA, USA, 2011; Volume 100. [Google Scholar]
  23. Rigo, T.; Llasat, M.C.; Esbrí, L. The Results of Applying Different Methodologies to 10 Years of Quantitative Precipitation Estimation in Catalonia Using Weather Radar. Geomatics 2021, 1, 20. [Google Scholar] [CrossRef]
  24. del Moral, A.; Rigo, T.; Llasat, M.C. A radar-based centroid tracking algorithm for severe weather surveillance: Identifying split/merge processes in convective systems. Atmos. Res. 2018, 213, 110–120. [Google Scholar] [CrossRef]
  25. Cotton, W.R.; Bryan, G.H.; Van den Heever, S.C. Storm and Cloud Dynamics; Academic Press: Cambridge, MA, USA, 2010. [Google Scholar]
  26. del Moral, A.; del Carmen Llasat, M.; Rigo, T. Identification of anomalous motion of thunderstorms using daily rainfall fields. Atmos. Res. 2017, 185, 92–100. [Google Scholar] [CrossRef]
  27. Rigo, T.; Berenguer, M.; del Carmen Llasat, M. An improved analysis of mesoscale convective systems in the western Mediterranean using weather radar. Atmos. Res. 2019, 227, 147–156. [Google Scholar] [CrossRef]
  28. Bedka, K.M. Overshooting cloud top detections using MSG SEVIRI Infrared brightness temperatures and their relationship to severe weather over Europe. Atmos. Res. 2011, 99, 175–189. [Google Scholar] [CrossRef]
  29. Jurković, P.M.; Mahović, N.S.; Počakal, D. Lightning, overshooting top and hail characteristics for strong convective storms in Central Europe. Atmos. Res. 2015, 161, 153–168. [Google Scholar] [CrossRef]
  30. Zeitler, J.W.; Bunkers, M.J. Operational forecasting of supercell motion: Review and case studies using multiple datasets. Natl. Weather Dig. 2005, 29, 81–97. [Google Scholar]
  31. Houze, R.A., Jr. Mesoscale convective systems. Rev. Geophys. 2004, 42, RG4003. [Google Scholar] [CrossRef] [Green Version]
  32. Yu, X.; Zheng, Y. Advances in severe convection research and operation in China. J. Meteorol. Res. 2020, 34, 189–217. [Google Scholar] [CrossRef]
Figure 1. Geographic location of the area of study. (Left) European map with the region of interest marked with a black rectangle. (Right) Zoom of the region of interest showing the location of the elements of the LLS (red triangles) and of the XRAD (yellow triangles).
Atmosphere 13 00171 g001
Figure 2. Scheme of the different types of lightning (IC: intra-cloud, CG+: positive cloud-to-ground, CG-: negative cloud-to-ground) in a thunderstorm and the sources (blue ones correspond to Level 1—multiple TL sources—and red ones to Level 2—single flash sources) detected for each one (based on [20]).
Atmosphere 13 00171 g002
Figure 3. Idealised identification of different types of sources in a thunderstorm and its idealistic transformation into two centroids, which characterise the storm at a certain time.
Atmosphere 13 00171 g003
Figure 4. Examples of the partial life cycles of a thunderstorm for the Level 1 (multiple sources) centroids and lightning jump warning (above) and the same for single-TL sources detected, or Level 2 (below). Left panels correspond to the trajectories and right ones to the total lightning time evolution. The vertical shaded lines indicated the time the lightning jumps occurred. Event of 6 September 2021.
Atmosphere 13 00171 g004
Figure 5. (Above) Partial tracking of the same thunderstorm presented in Figure 4, but considering the radar information (green points), the single-TL information (red dots), and the multiple-TL data (blue points). (Below) Partial life cycle of the same thunderstorm, showing the VIL evolution (6 min time resolution) and the TL with single- (red) and multiple- (blue) lightning sources. The vertical lines indicate the time of occurrence of the two LJs.
Atmosphere 13 00171 g005
Figure 6. (Left) Total lightning area (shaded grey region) associated with multiple-lightning jump warnings (blue dots correspond to multiple-lightning sources and red ones to single sources). The orange line encloses the area associated with the warnings. Case of 10 October 2013. (Right) The same as the left panel (LJs marked with blue and red squares), but including the centroids of the thunderstorms identified based on the volumetric radar product (circle dots).
Atmosphere 13 00171 g006
Figure 7. Monthly distributions (in percentage) of the SLJsts (cyan) and MLJsts (purple).
Atmosphere 13 00171 g007
Figure 8. Hourly distributions (in percentage) of the SLJsts (cyan) and MLJsts (purple).
Atmosphere 13 00171 g008
Figure 9. Maximum level distributions (in percentage) of the SLJsts (cyan) and MLJsts (purple).
Atmosphere 13 00171 g009
Figure 10. Boxplot of the number of convective cells identified in LJ thunderstorms. From left to right: SLJst1, SLJst2, MLJst1, and MLJst2.
Atmosphere 13 00171 g010
Figure 11. Same as Figure 10, but for the number of times that surface reflectivity exceeded a certain threshold: (left) 40 dBZ; (right) 45 dBZ.
Atmosphere 13 00171 g011
Figure 12. Same as Figure 10, but for the number of times that maximum reflectivity exceeded a certain threshold: (left) 45 dBZ; (right) 55 dBZ.
Atmosphere 13 00171 g012
Figure 13. Same as Figure 10, but for the number of times that echo top 35 dBZ exceeded a certain height threshold: (left) 6 km; (right) 8 km.
Atmosphere 13 00171 g013
Figure 14. Scheme of the classification of the LJ-producing thunderstorms according to the number of jumps (brown stars): SLJsts (above) or MLJsts (below). The shadowed grey area indicates the limits of the thunderstorm based on the reflectivity footprint, while the green dots correspond to the cells identified using the algorithm of [21]. From left to right: isolated (a unique convective cell with a reduced path), lineal (a unique convective cell with a large trajectory), unorganised (multiple convective cells following unconnected paths), and organised (multiple cells with parallel or quasi-parallel trajectories, or the result of the splitting and merging processes).
Atmosphere 13 00171 g014
Table 1. Number of thunderstorms (in parenthesis in the first row) with a single-LJ, between 2 and 4 LJs, 5 to 9 LJs, 10 to 14 LJs, and more than 14 LJs. Each category has two columns, with the number (and the percentage with respect to the total Ls of the selected category) of thunderstorms with at least one LJ of Level 1 (left) and Level 2 (right). Note that, except in the single-LJ case, the numbers are not complementaries.
Number LJ1 (800)2–4 (1013)5–9 (416)10–14 (130)>14 (48)
LJ Level1212121212
N cases6911099673844163381301224847
%86.413.695.437.910081.310093.810097.9
Table 2. Distribution of convective modes according to the number of jumps (single or multiple) and the level of the LJ (1 or 2).
IsolatedLinealUnorganisedOrganised
SLJst110450186241
SLJst29102550
MLJst164883436
MLJst241107106129
Publisher’s Note: MDPI stays neutral with regard to jurisdictional claims in published maps and institutional affiliations.

