Abstract
Among the China Seas, the Yellow Sea has the highest occurrence frequency of sea fog that can be categorized into widespread sea fog and coastal sea fog. In this paper, we study a typical coastal sea fog along the Shandong Peninsula that is accompanied by sea-land breezes. Based on a series of numerical experiments conducted by the Weather Research and Forecasting model with high spatial resolution, the impacts of the sea–land breezes on the formation and development of sea fog are investigated in detail. The land breeze can act as an accelerator that enhances humidification and cooling near the coast which promotes sea fog formation during the nighttime, resulting from nearshore vapor convergence and offshore cool-air transportation jointly by the descending branch and low-level breeze of the land breeze circulation. During the daytime, the sea breeze acts as a reducer that inhibits sea fog development, including the contraction of fog area caused by onshore advection of the sea breeze on cloud liquid water, and the restraint of fog vertical growth due to warming and drying by the descending branch of the sea breeze circulation.
1. Introduction
Sea–land breezes are widely known as typical local wind circulations that take place over coastal zones and are driven by the thermal difference between land and sea [1]. More than four decades ago, sea–land breeze circulations were modeled both analytically [2] and numerically, using models that were simple and two-dimensional to more sophisticated in three dimensions [3,4]. The Shandong Peninsula (see its location in Figure 1a), which juts northeastward between the Bohai Sea and the Yellow Sea toward the Korean Peninsula, is commonly affected by sea–land breezes [5,6]. Located beside the northern edge of the Yellow Sea, which has the highest frequency of sea fog occurrence among the China seas [7,8,9,10], the Shandong Peninsula is frequently influenced by sea fog as well.
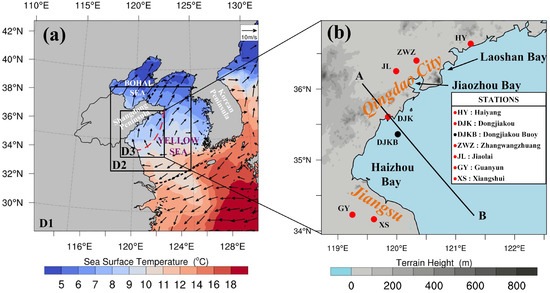
Figure 1.
Location of the Shandong Peninsula, geographic map of the Yellow Sea, and three nested domains (D1, D2, and D3) used for numerical simulations (a). Distributions of sea surface temperature (color shades) and 10-m wind field (vectors) at 2000 LST (=UTC + 8 h) 1 April 2014 (b). The former is provided daily from North-East Asian Regional Global Ocean Observing System (NEAR-GOOS) dataset, and the latter is derived from the ERA5 reanalysis. Sites of four surface measurement stations (red dot) and one buoy (black dot) are marked.
On the southern side of the Shandong Peninsula, there is a large city named Qingdao (see its location in Figure 1b), which has several important ports and is famous for marine manufacturing and its fisheries. Since Qingdao has a long sea fog season from March to August, it often suffers from low atmospheric horizontal visibility (hereafter visibility) caused by sea fog [8,9].
According to the formation mechanism, most sea fogs over the Yellow Sea can be identified as advection sea fogs [7,9]. Under an appropriate synoptic condition, for example, the rear of a high-pressure system [7,11], warm moist air masses are advected from south to north over the cold sea surface of the Yellow Sea, resulting in sea fog formation. Controlled by different weather situations, sea fog formed over the Yellow Sea can greatly differ in the horizontal area covered (hereafter called fog area). Figure 2 demonstrates four typical satellite visible pictures for two kinds of sea fog over the Yellow Sea, one occurring along the coast and the other over the vast part of the Yellow Sea (hereafter termed as coastal sea fog and widespread sea fog, respectively).
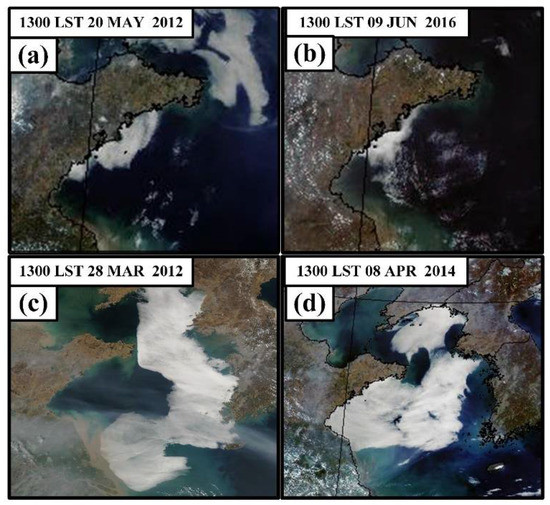
Figure 2.
Satellite images of two kinds of typical sea fog episodes over the Yellow Sea: coastal sea fog along the Shandong Peninsula (a,b) and widespread sea fog (c,d).
Coastal sea fog usually begins at night [7], whereas the occurrence of widespread sea fog is not limited by time and mainly depends on the weather situation, for example, a dominant stable high system [11] or rapid transition of a weather system [9]. It is apparent that coastal sea fog strongly affects marine activities, such as nearshore rescue, navigation, and transport related to ports (Figure 2a,b). Although widespread sea fog forms over the open sea, it can rapidly develop and approach and even invade the coast (Figure 2d). A great number of detailed studies have been devoted to widespread sea fog over the Yellow Sea [9,12,13,14,15,16,17]. By comparison, similar studies on coastal sea fog over the Yellow Sea are quite few, and they mostly focus on the western coast of the Korean Peninsula [18,19,20,21], seldom on the Shandong Peninsula [22].
In order to see the approximate proportion of coastal sea fog along the Shandong Peninsula (e.g., fog in Figure 2a,b) and widespread sea fog over the Yellow Sea (e.g., fog in Figure 2c,d), we carried out rough statistics. Based on satellite visible imageries, coastal surface measurements, and buoy observations, we recognized and picked out typical widespread sea fogs and coastal sea fogs during 2011 to 2020, in which the latter fogs were limited within the sea area enclosed by the red dash line in Figure 1a. Table 1 shows the statistical result, and it suggests that the coastal sea fog along the Shandong Peninsula should be studied in detail because it has a large occurrence rate of 29.2% on average and cannot be ignored.

Table 1.
Occurrence rate of coastal sea fog along the Shandong Peninsula (2011–2020).
When a coastal sea fog occurs along the Shandong Peninsula, the weather situation is generally dominated by a high-pressure system [7,11], which is suitable for inducing sea–land breezes to form. On the opposite side of the Yellow Sea to the Shandong Peninsula, it has already been found that sea–land breezes can strongly affect the formation of coastal sea fog along the Korean Peninsula [23]. Therefore, we propose a study on how sea–land breezes impact the formation and development of coastal sea fog along the Shandong Peninsula. The motivation of the present paper is to try to answer this question, through an investigation into a typical coastal sea fog by using observational analysis and numerical simulation.
The remainder of this paper is organized as follows: Section 2 describes the numerical simulation with the study case, numerical experiments, and preliminary analysis of the simulation results. The impacts of sea–land breezes on the sea fog formation and development are revealed in Section 3, and two interesting features of the sea fog area are explored in Section 4. Finally, the conclusion is summarized in Section 5.
2. Data and Case
2.1. Data
The European Centre for Medium-Range Weather Forecasts (ECWMF)’s fifth-generation atmospheric reanalysis (ERA5) (0.25° × 0.25°; 3 hourly) [24] provides initial and lateral boundary conditions for atmospheric numerical simulations, which take the daily sea surface temperature (SST) dataset (0.25° × 0.25°) of the North-East Asian Regional Global Ocean Observing System (NEAR-GOOS) [25] as their bottom conditions for the ocean area.
Surface measurements and buoy observations were obtained from the China Meteorological Administration (CMA) [26] to demonstrate the observed facts of sea–land breeze phenomenon, and surface synoptic maps were downloaded from the Korea Meteorological Administration (KMA) [27] to show the weather situation of the study case. The observed sea fog patches were empirically retrieved using the method proposed by Wang et al. [15], which uses the multichannel data of Japanese Multifunctional Transport Satellite (MTSAT) [28], including albedo, short-wave and long-wave infrared, and visible cloud imageries. In addition, Moderate Resolution Imaging Spectroradiometer (MODIS) visible pictures were also used. However, the retrieving method by Wang et al. [15] was employed only for nighttime fog due to its poor capability of detecting daytime fog patches on coastal land. Thus, MTSAT visible pictures were used for daytime fog.
2.2. Study Case
2.2.1. Sea Fog
A sea fog spread narrowly along the Shandong Peninsula coast on 2 April 2014 (see the upper panels of Figure 3). This case belongs to the coastal sea fog type that generally forms around midnight and then gradually expands along the Shandong Peninsula coast. In order to easily understand the variation of physical variables related to solar altitude angle with time, local standard time (LST; =UTC + 8 h) is referred to hereafter, because the difference between LST and local time in this study was within 15 min. Two small sea fog patches had already appeared in the Haizhou Bay at 0200 LST 2 April (Figure 3b, and then developed and occupied almost the entire Haizhou Bay and on the south coast of Shandong Peninsula around the noon of 2 April (Figure 3c) and remained into the early afternoon (Figure 3d).
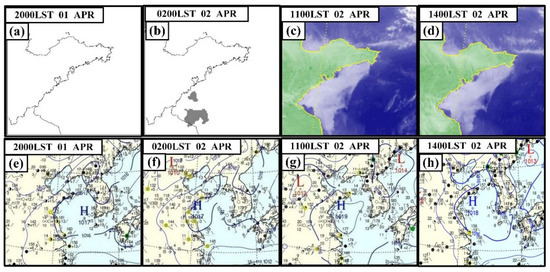
Figure 3.
The retrieved sea fog (a,b) and Multifunctional Transport Satellite (MTSAT) visible satellite images (c,d), and Korea Meteorological Administration (KMA) surface synoptic charts (e–h) from 2000 LST 1 April to 1400 LST 2 April 2014.
The mean sea level pressure analysis showed that the high-pressure system which dominated the Yellow Sea governed the sea fog progress (Figure 3e–h). Figure 3 shows that the weather patterns at 2000 LST 1 April and 1400 LST 2 April were almost the same (cf. Figure 3e,h) but the high pressure became stronger from 0200 LST to 1400 LST 2 April (cf. Figure 3f,g). Under this weather situation, southerly winds prevailed over the northern Yellow Sea (see the sea surface winds in Figure 1a), resulting in a warm–moist air mass being transported onto the coastal waters along the Shandong Peninsula where the sea surface temperature (SST) was 9 °C or so (see color shading in Figure 1a). These conditions are conducive to forming sea fog and sea–land breezes.
2.2.2. Sea–Land Breezes
To investigate whether a sea–land breeze phenomenon occurred accompanied by the sea fog process, time series hourly surface measurements at stations DJK, HY, and DJKB (see their sites in Figure 1b) are displayed in Figure 4. This time series included temperature, relative humidity (RH), specific humidity, and wind (thin vectors at the lower part in the panels of Figure 4). For better viewing of the sea–land breeze, the background wind component was removed from the observed wind by a 24-h moving average from 2000 LST 1 April to 2000 LST 2 April. Thus, the left wind component was the sea–land breeze (thick vectors at the upper part in the panels of Figure 4).
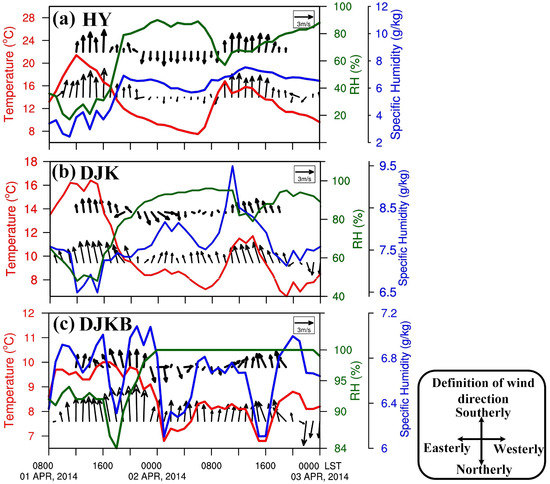
Figure 4.
Time series of hourly surface measurements at the stations: HY (a), DJK (b), and DJKB (c). Variables were the 2-m air temperature, relative humidity, and specific humidity. Lower vectors were the measured 10-m surface winds, while the upper vectors were surface winds with the 24-h average removed. Thick vectors are sea–land breezes.
Since HY and DJK are coastal stations, and DJKB is a buoy, there were differences between their time series (Figure 4). For the two coastal stations, a temperature diurnal cycle was clearly seen, and the onshore wind was stronger near the temperature peak while it became weaker near the temperature minimum. Sea and land breezes were already recognized easily at HY station even without a 24-h moving average (Figure 4a). The result of 24-h moving average on winds showed an obvious signature of a sea–land breeze, i.e., southerly sea breeze from 1100 LST to 1800 LST and northerly land breeze from 2300 LST to 0900 LST (Figure 4a–c).
Therefore, a sea–land breeze phenomenon occurred along the Shandong Peninsula during 1–2 April. Furthermore, the relative humidity began to rapidly increase when the sea breeze shifted to a land breeze, and sea fog quickly formed around 0000 LST 2 April at DJKB (Figure 4c). These observations suggest that there is a tight relationship between sea–land breezes and coastal sea fog.
3. Numerical Simulation
3.1. Numerical Experiments
3.1.1. Model Configuration
The Advanced Research (AR) core of the Weather Research and Forecasting (WRF) (WRF-ARW, version 3.9.1) [29] was employed. According to the previous works on sea fog simulation over the Yellow Sea [9,11,15,16,17], the Lin (Perdue) microphysics scheme, the Yonsei University (YSU) planetary boundary layer (PBL) scheme, and the 5-layer soil scheme were chosen for the numerical simulations. Detailed model configurations are listed in Table 2. The ysu_topdown_pblmix option in the YSU scheme was switched on for describing the turbulent diffusion driven by fog-top cooling on sea fog development [17].

Table 2.
Advanced Research Weather Research and Forecasting (WRF-ARW) configuration.
In order to describe the details of the study case, triple-nested domains were designed (D1 and D2 in Figure 1). Two-way nesting was implemented for the two outer domains with 57 full-η levels and 50-hPa model top, while one-way nesting was specially arranged for the most inner domain with much finer resolutions (D3 in Figure 1). Particularly, the vertical resolution for D3 was greatly increased to 86 full-η levels, among which there were about 20 full-η levels below 1000 m. In addition, the bottom-level height of the 86 full-η levels was approximately 8 m, which is vital to capture sea fog formation and development according to Yang et al. [17]. Unlike the previous studies on sea fog modeling [36], the complex Noah land-surface model [37] was not utilized, because we found that it tends to produce a large cold bias during nighttime over the Shandong Peninsula. Instead, a simple 5-layer thermal diffusion scheme was adopted.
3.1.2. Experiment Design
Three numerical experiments were conducted, including a control experiment and two sensitivity experiments (Table 3). The control experiment (Exp-Ctrl) aimed to well capture the formation and evolution of the coastal sea fog and the sea–land breeze phenomenon. Prior to Exp-Ctrl, we conducted a couple of extra test experiments with and without data assimilation, finding that the simulation results hardly benefitted from the data assimilation process. As a result, the Exp-Ctrl run was made without data assimilation. Two sensitivity experiments, Exp-LB0 and Exp-SB0 (LB and SB short for land breeze and sea breeze, respectively), were designed to explore the roles of land breeze and sea breeze in sea fog formation and development.

Table 3.
List of the numerical experiments.
All experiments started 2000 LST 1 April and ended 2000 LST 2 April, driven by the ERA5 data and the NEAR-GOOS SST. Their output intervals were all set to 1 h.
3.2. Preliminary Analysis of the Simulation Results
3.2.1. Verification of Exp-Ctrl by Surface Measurements
The surface measurements at six stations (Figure 1b) were used to verify the control experiment Exp-Ctrl first, including two coastal stations (HY and DJK) and four inland stations (ZWZ, JL, GY, and XS). Because sea–land breeze circulation is driven by the temperature difference between land and sea, we focused on checking the 2-m temperature. From Figure 5, the simulated 2-m temperature (red solid line) at all stations was very close to the observed (red dash line). For the two coastal stations DJK and HY, the simulated 2m-RH (green solid line) was basically consistent with the observed (green dash line) (Figure 5a,b); in addition, the land breeze and sea breeze were apparent, which agrees well with the observations (cf. Figure 5a with Figure 4a, Figure 5b with Figure 4b, respectively). It infers that the control experiment Exp-Ctrl is reliable.
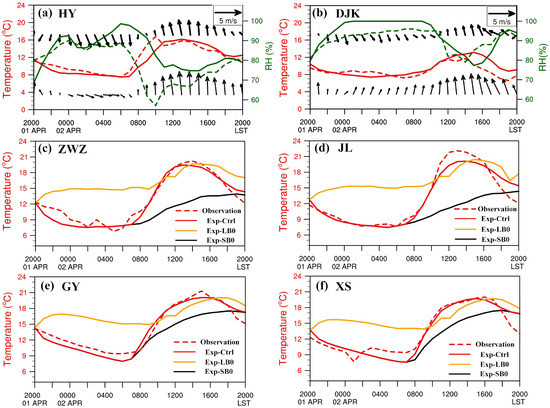
Figure 5.
Comparison of the control experiment (solid line) and the observations (dash line) in 2-m temperature, 2-m RH, and 10-m wind. Thick vectors in (a,b) are offshore and onshore winds of the sea–land breezes. The time series of 2m-temperature of Exp-LB0 and Exp-SB0 are given in (c,d). The panels (a–f) are for the stations HY, DJK, ZWZ, JL, GY, and XS, respectively. See the definition of wind direction in Figure 4.
The purposes of Exp-LB0 and Exp-SB0 were to remove the land breeze and sea breeze, respectively (Table 3). The purposes were realized by the aid of changing the land temperature, not the SST because changing the SST might distort vertical water vapor flux near the sea surface. The time series of 2-m temperature at the four inland stations (ZWZ, JL, GY, and XS) for Exp-LB0 and Exp-SB0 are shown in Figure 5c,d, respectively. In Exp-LB0, the 2-m temperature was much higher than that of Exp-Ctrl during the nighttime, whereas they differed little during the daytime, which did not trigger the land breeze in Exp-LB0. Unlike the rapid increase after sunrise in Exp-Ctrl, the 2-m temperature of Exp-SB0 grew slowly and continually kept below 14 °C at the stations ZWZ and JL during the whole afternoon. In this situation, a sea breeze did not happen.
3.2.2. Comparison of the Simulated Sea Fog Area
In order to compare with the observed sea fog, the simulated sea fog was diagnosed from the model output cloud liquid water (CLW). As a result of the visibility formula developed by Stoelinga and Thomas [38], the CLW content corresponding to 1 km visibility was 0.016 g/kg. Thus, the simulated sea fog was defined in those areas where the following criteria were met: the CLW at the lowest model level was ≥0.016 g/kg or the cloud top was ≤400 m [39]. The cloud top was determined when the CLW abruptly dropped below 0.016 g/kg in searching the model level’s CLW from down to up. Sometimes sea fog develops and spreads upward rapidly, leaving the sea surface and becoming into low-level stratus that is usually mingled within sea fog patches. Unfortunately, it is rather difficult to capture this change in our current modeling well. Hereafter, both sea fog and low-level stratus are called sea fog. Figure 6 shows the observed sea fog and the simulated sea fog for all experiments listed in Table 3.
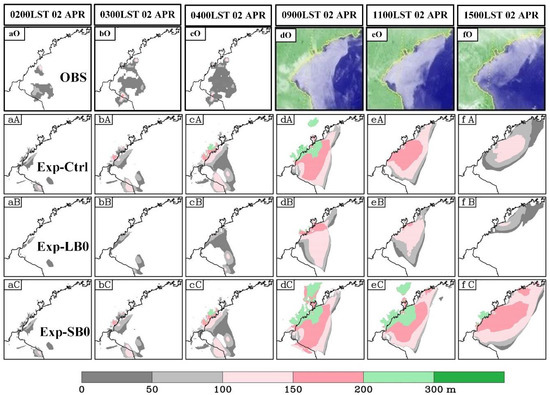
Figure 6.
Comparison of the observed sea fog (top row; aO–fO) and the simulated sea fog. From the second row, the results of Exp-Ctrl (aA–fA), Exp-LB0 (aB–fB), and Exp-SB0 (aC–fC) are shown, respectively. Color shades represent the simulated fog-top height (i.e., fog depth; m).
Visually comparing the simulated sea fog of Exp-Ctrl and the observed sea fog shown in Figure 6, the formation (cf. Figure 6(aO) with Figure 6(aA), Figure 6(bO) with Figure 6(bA)) and the development (cf. Figure 6(eO,fO) with Figure 6(aA–fA), respectively) of the sea fog was well captured by Exp-Ctrl. So, Exp-Ctrl was taken as the baseline to examine the performance difference in the sensitivity experiments relative to Exp-Ctrl.
Compared with Exp-Ctrl, Exp-LB0 had a much smaller fog area and a lower fog top. The fog started to form later and smaller in Exp-LB0 than in Exp-Ctrl at nighttime (cf. Figure 6(bB,cB) with Figure 6(bA,cA), respectively). This situation strongly affected the subsequent development of the fog at daytime (cf. Figure 6(dB–fB) with Figure 6(dA–fA), respectively). Note that the land breeze was removed in Exp-LB0. As a result, it is inferred that the land breeze enhances the fog formation. In contrast to Exp-LB0 with the removal of the land breeze, the sea breeze was removed in Exp-SB0. During the daytime, the fog area of Exp-SB0 was obviously larger than that of Exp-Ctrl (cf. Figure 6(dC–fC) with Figure 6(dA–fA), respectively). Since the background synoptic flow was onshore (Figure 1a), the removal of sea breeze decreased the onshore wind. It seems there is a correlation between the size of the fog area and the strength of the onshore wind by the sea breeze. This suggests that the sea breeze slows down the expansion of the fog area.
The above analysis shows that the breezes have important impacts on the sea fog formation.
4. Impacts of the Sea–Land Breezes on the Sea Fog
4.1. Relation between the Sea–Land Breezes and the Sea Fog
4.1.1. Land Breeze and Sea Fog
The observational analysis in Section 2.2 has shown that a sea fog case is accompanied by sea–land breezes. However, the Yellow Sea was dominated by a high-pressure system (Figure 3e–h) that led to near southerly winds prevailing over Qingdao coastal waters during 1–2 April (Figure 1a), and this background synoptic flow was almost opposing to the offshore low-level land breeze near Qingdao coast. To isolate the land-breeze circulation, we removed the background synoptic flow off Exp-Ctrl by directly subtracting Exp-LB0.
The result of the removal operation is shown in Figure 7. It shows the surface temperature, RH, and wind of Exp-LB0 at the two coastal stations HY and DJK, and the surface wind difference of Exp-Ctrl minus Exp-LB0 is displayed (thick vector in Figure 7). Because the land surface upward longwave radiation was shut down from 2000 LST 1 April to 0600 LST 2 April (Table 3), the surface temperature almost did not decrease during the nighttime, which means no land-breeze circulation was activated. In Figure 7, it is seen that the surface wind difference during the nighttime was offshore, and consistent with the observed land breeze in Figure 4. This suggests that the removal operation is appropriate.

Figure 7.
Simulated 2-m temperature (red line), 2-m RH (green line), and 10-m wind (lower vector) of Exp-LB0 at the two stations HY (a) and DJK (b). Upper vectors were 10-m winds in the result of Exp-Ctrl minus Exp-LB0. See the definition of wind direction in Figure 4.
The land-breeze circulation coexisting with the sea fog was identified by analyzing the velocity difference from Exp-Ctrl minus Exp-LB0. For seeking the relationship between sea fog and land breeze circulation, we examined a vertical cross-section along the line AB that is perpendicular to the coastline and passing through the station DJK (Figure 1b). Figure 8 demonstrates the fog vertical extents of Exp-Ctrl and Exp-LB0, and the velocity difference between Exp-Ctrl and Exp-LB0 during the nighttime from 2300 LST 1 April to 04 00 LST 2 April. In addition, the water vapor mixing ratio is given in Figure 8a–c but not in Figure 8d–f for picture clarity.
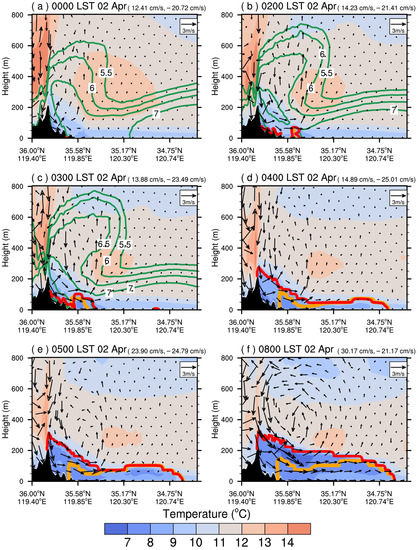
Figure 8.
Evolution of the land breeze circulation (vectors), mixing ratio (green lines), and sea fog in the vertical cross-section along the line A–B marked in Figure 1. Temperatures of Exp-Ctrl are shown by color shades. Sea fog vertical extents of Exp-Ctrl and Exp-LB0 are outlined by the coarse lines colored in red and orange, respectively. The information of time and maximal vertical velocities are shown at the top of the panels (a–f).
In Figure 8, the evolution of the land-breeze circulation and sea fog can be clearly seen. On 0000 LST 2 April (Figure 8a), the land surface became cooler due to longwave radiation, while the air aloft kept the warm feature of the mixing layer (residual layer) formed during the daytime. Hence, the air aloft descended toward the land surface, and then the land breeze began to form, and it brought the cool air offshore to the sea, but the ascending branch of the land breeze was not apparent (Figure 8a). Although an inversion near the sea surface (see color shades) already existed, sea fog did not appear (see red coarse lines for Exp-Ctrl).
As time went on, the ascending branch gradually appeared, and then the structure of the land-breeze circulation became clearer (Figure 8b–e). Meanwhile, the sea fog started to form (Figure 8b) and grew rapidly (cf. Figure 8c with Figure 8d). On 0800 LST 2 April (Figure 8f), the land breeze circulation was quite complete and clear. For instance, there apparently existed a return flow (anti-land breeze) of 1–2 m/s aloft that brought the cooler air back to land, resulting in faster cooling of the residual layer (see the temperature aloft over land and compare each panel). At the same time, the sea fog’s depth grew up to about 200 m.
The difference in sea fog between Exp-Ctrl and Exp-LB0 shows that the existence of land breeze circulation has a significant positive impact on the sea fog formation during the nighttime. This was seen in Figure 6. Compared with Exp-Ctrl, the fog of Exp-LB0 formed about 1 h later and much thinner, particularly around the coast where the land breeze was strongest.
4.1.2. Sea Breeze and Sea Fog
Following the method for identifying land breeze, a similar method was taken to extract the sea that already existed by removing the background synoptic flow from Exp-Ctrl by subtracting Exp-SB0.
Figure 9 presents the 2-m temperature, 2m-RH, and 10-m wind of Exp-SB0 at the two coastal stations HY and DJK, and the surface wind difference of Exp-Ctrl minus Exp-SB0. There was little change in the simulated 2-m temperature of Exp-SB0 during the daytime, which resulted from weak solar shortwave radiation because the solar azimuth was fixed from 0800 LST to 1800 LST 2 April. The sea breeze’s signature was distinct in the surface wind difference (upper vectors).

Figure 9.
Simulated 2-m temperature (red line), 2-m RH (green line), and 10-m wind (thin vector) of Exp-SB0 at the two stations HY (a) and DJK (b). Upper vectors are the Exp-Ctrl minus Exp-SB0 10-m winds. See the definition of wind direction in Figure 4.
The sea breeze circulation was easily recognized from the wind difference Exp-Ctrl minus Exp-SB0. Figure 10 displays the circulation on 1600 LST and 1800 LST 2 April (Figure 10a–d), and the vertical extents and horizontal areas of Exp-Ctrl and Exp-SB0 (Figure 10e,f). Compared with the land breeze circulation in Figure 8, the sea breeze circulation was much larger, in terms of horizontal and vertical scales. For instance, the circulation depth was about 900 m (see the upper-level return flow), and the descending branch over the sea reached about 35° N (Figure 10b). It was found that not only the sea fog thickness but also the sea fog area was much smaller in Exp-SB0 than in Exp-Ctrl. It seems that the sea breeze is not conducive to the development of sea fog. Especially for the sea fog patch, there is a shrinking trend toward the coast in Exp-Ctrl in contrast to Exp-SB0 (Figure 10e,f).
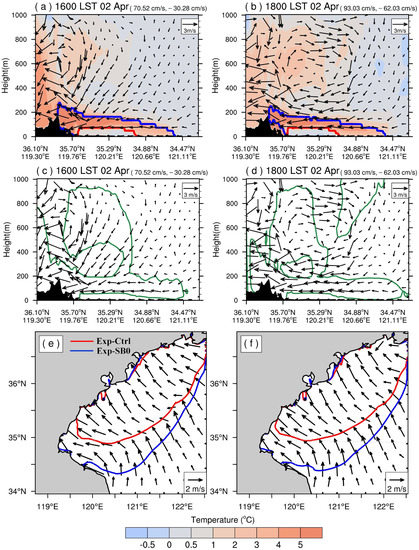
Figure 10.
Panels (a–d) show the vertical cross-section along the line A-B marked in Figure 1 for the sea breeze circulation (vectors), the differences of Exp-Ctrl minus Exp-SB0 for temperature (shades in (a,b)) and RH (contours in (c,d); only those lines with the values of −5% are shown for clarity). Panels (e,f) present the horizontal display for sea fog area with the differences of 10-m wind of Exp-Ctrl minus Exp-SB0. The sea fog vertical extents of Exp-Ctrl and Exp-SB0 (a,b) are outlined by the coarse lines in blue and red colors, respectively. The maximal vertical velocities are shown at the upper right corner of the panels (a–d) and the horizontal velocities in the lower right of the panels (e,f).
From the simulated results shown in Figure 10, it is evident that the existence of sea breeze circulation has a significant negative impact on sea fog development during the daytime.
4.2. Role of the Land Breeze on the Sea Fog Formation
The offshore limit of cool air progression over the sea is known as the land breeze front. For this case, the front might be distinct because the southerly background synoptic flow was almost in the opposite direction to the low-level land breeze (Figure 4). The horizontal expansion of the land-breeze circulation is shown with the sea surface winds in Figure 11. The front is apparent in the gradient of the winds and the average vertical speeds. The front at 0200 LST 2 April is indicated by the dark-blue strip (Figure 11b), where the wind gradient and vertical speed were both much larger. It is apparent that the front gradually moved away from the coast (Figure 11) as the land-breeze circulation strengthened (cf. Figure 11 with Figure 8). The land-breeze front was a cold front that transported cool air from the land onto the sea.
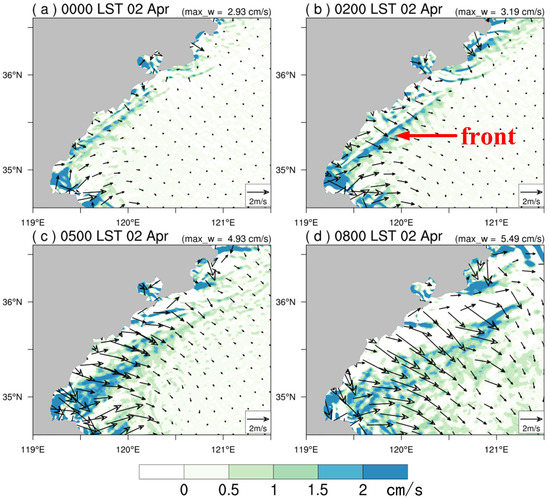
Figure 11.
Horizontal expansion of the land breeze circulation that is shown by both 10-m winds (black vectors) and vertical speeds (shades) averaged within 100–600 m from the result of Exp-Ctrl minus Exp-LB0. The information of time and maximum vertical velocity are shown at the top of the panels (a–d).
In Figure 8a–c, the descending branch of the land-breeze circulation over the land acted as a barrier against water vapor progressing inland, resulting in high mixing ratio values near the coastal zone, especially within the near-surface layer (see 7 g/kg contour) as the low-level land breeze became stronger.
The increments of mixing ratio caused by the land-breeze circulation are shown by the green contours in Figure 12. With the strengthening of the land breeze circulation, the mixing ratio increased, and the sea fog (see the coarse lines) slowly generated near the sea surface, and the sea fog in Exp-Ctrl formed earlier than in Exp-LB0 (Figure 12d). Figure 12 also shows how the land-breeze circulation transported cool air, demonstrating the horizontal heat flux defined by the product of the differences of wind and temperature between Exp-Ctrl and Exp-LB0. The negative heat flux region near the coastal zone indicated that the low-level land breeze transported cool air over the sea. Due to this cool-air transportation, the sea fog grew upward, and the depth of Exp-Ctrl became much higher than that of Exp-LB0 (Figure 12e,f).
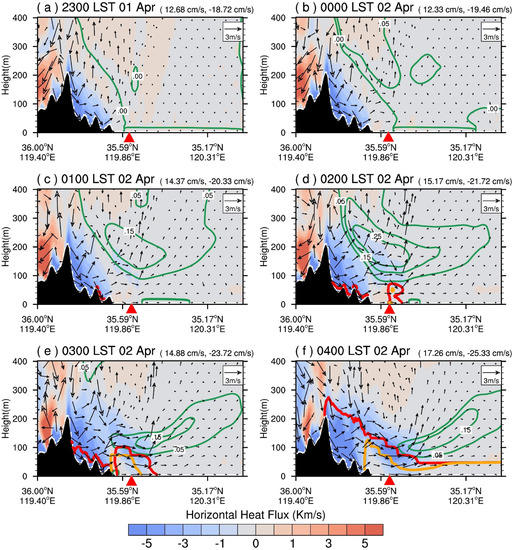
Figure 12.
Evolution of horizontal heat flux (color shades) transported by offshore wind and sea fog during the formation stage of the land breeze circulation (vectors) in the vertical cross-section along the line A-B marked in Figure 1. Green contours are the mixing ratio increments of Exp-Ctrl relative to Exp-LB0. Sea fog vertical extents of Exp-Ctrl and Exp-LB0 are outlined by the coarse lines in red and orange colors, respectively. The red triangle indicates the location of vertical profiles in Figure 13. The information of time and maximal vertical velocities are shown at the top of the panels (a–f).
To clearly see the impact on the sea fog formation by the land breeze, the vertical profiles of air temperature, CLW, and mixing ratio (Qv) are plotted for a selected location (see the red triangle in Figure 12). The location was a water point near the coast, and it was within the sea fog area. Since 0000 LST 2 April, the profile of Exp-Ctrl became cooler with a weaker inversion than that of Exp-LB0 (see the 1st row in Figure 13). Meanwhile, the mixing ratio profile became wetter in Exp-Ctrl than in Exp-LB0 (see the 3rd and 4th rows in Figure 13; QV condensed into CLW when fog forming). Due to the weaker inversion and wetter condition, the sea fog started to form on 0200 LST in Exp-Ctrl, while the sea fog not only formed one hour later but also was much thinner and lighter in Exp-LB0 (see the 2nd row in Figure 13).
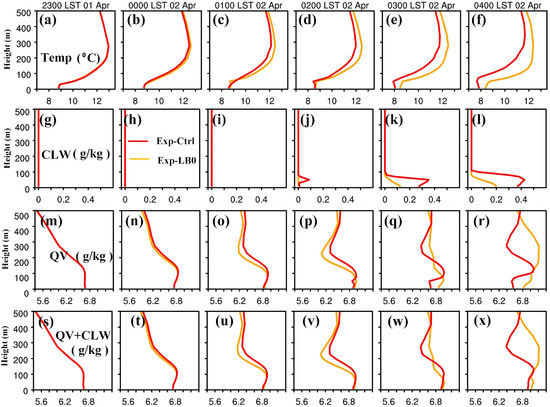
Figure 13.
Vertical profiles of air temperature (Temp; (a–f)), cloud liquid water (CLW; (g–l)), water vapor (Qv; (m–r)), and the sum of CLW and Qv ((s–x)) from 2300 LST 1 April to 0400 LST 2 April for Exp-Ctrl (red line) and Exp-LB0 (orange line), respectively. The profile location is marked by a red triangle in Figure 12.
The summary is that the land breeze acts as an accelerator that promotes the physical process of humidification and cooling near the coast which is conducive to the formation of sea fog. The descending branch and low-level breeze of the land breeze circulation jointly modify the humidification, in which the former is a barrier preventing water vapor from progressing inland, while the latter is against the onshore background wind and strengthens the convergence and accumulation of the water vapor. Meanwhile, the cool-air transportation by the offshore low-level land breeze accelerates the cooling that is originally caused only by mechanical turbulent mixing.
4.3. Effect of the Sea Breeze on the Sea Fog Development
Contrary to the positive role of the land breeze on the sea fog formation during the nighttime, the sea breeze has a negative effect on the sea fog development during the daytime based on the analysis of simulated results (Figure 6 and Figure 10). Because the low-level breeze was almost in the same direction as the background synoptic flow, the reduction in the sea fog area in Exp-Ctrl relative to Exp-SB0 is probably due to the advection of CLW by the onshore low-level breeze (see the wind vectors in Figure 10e,f). In addition, the descending branch of the sea-breeze circulation not only brings a drier and warmer air mass from the land downward onto the sea but also causes warming and drying. The increments of temperature and RH of Exp-Ctrl relative to Exp-SB0 (Figure 10c,d) clearly showed the warming and drying, and their sequential effect on fog development, e.g., thinner fog depth and smaller fog area in Exp-Ctrl compared with Exp-SB0 (see the sea fog difference between Exp-Ctrl and Exp-SB0 in Figure 10a,b).
An extra experiment Exp-SB1 based on Exp-SB0 was conducted for confirming the effect of CLW advection, which reduced the sea fog area. From the observations (Figure 5), the speed of low-level sea breeze was about half of the actual wind speed. As a result, the CLW advection was reduced by half from 0800 to 1800 LST 2 April in Exp-SB1, attempting to remove the extra CLW advection by the sea breeze.
Figure 14 displays the simulated sea fog areas of Exp-Ctrl, Exp-SB0, and Exp-SB1, and the differences of vertical integration of mixing ratio from 100 m to 600 m between Exp-Ctrl and Exp-SB0, Exp-Ctrl and Exp-SB1. In most parts of the sea fog area of Exp-Ctrl, the vertical integration of CLW was much larger than those of Exp-LB0 (Figure 14a,b). The sea fog area of Exp-SB1 was much smaller than that of Exp-SB0 (cf. Figure 14c with Figure 14a and Figure 14d with Figure 14b, respectively), and it was close to the fog area of Exp-Ctrl (Figure 14c,d). The reason why the fog area of Exp-SB0 was much larger than that of Exp-Ctrl is mainly due to the lack of the CLW advection by the sea breeze. Note that there was a clear-air gap in the sea fog area of Exp-SB1 (Figure 14c,d). This again verifies the importance of the extra CLW advection driven by the sea breeze.
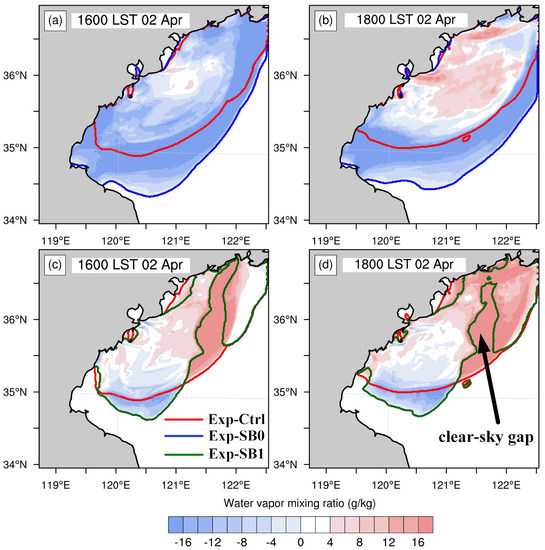
Figure 14.
Simulated sea fog areas (contours) and the differences of vertical integration of mixing ratio from 100 m to 600 m (shades) for Exp-Ctrl minus Exp-SB0 (a,b) and Exp-Ctrl minus Exp-SB1 (c,d).
It is concluded that the sea breeze acts as a reducer that restrains the sea fog development during the daytime. The restraint has two aspects: one is the enhanced CLW advection due to the low-level sea breeze that leads to the sea fog convergence toward the coast; the other is the warming and drying caused by the descending branch of the sea breeze circulation that limits the vertical development of the sea fog.
5. Conclusions
Sea fog has a serious safety effect on many maritime activities due to its low atmospheric horizontal visibility. The Yellow Sea has the highest frequency of sea fog occurrence among all the China seas. Sea fog over the Yellow Sea can be categorized into widespread (large-scale) sea fog and coastal sea fog, where the latter especially negatively affects coastal marine activities, such as nearshore rescue, navigation, and transport. According to our statistics of widespread sea fog and coastal sea fog along the Shandong Peninsula from 2011 to 2020, the coastal sea fog had an occurrence rate of about 30% on average. However, the present forecast skill for coastal sea fog is unsatisfactory because the physical mechanism of its formation and development is still not well understood.
A typical coastal sea fog along the Shandong Peninsula was selected for a case study in this paper. Observational analysis indicated this sea fog was accompanied by sea–land breezes. In order to investigate the impacts of the sea–land breezes on the formation and development of the sea fog, a series of numerical modeling experiments were conducted with the aid of the WRF model, including one control experiment and three sensitivity experiments. Based on the detailed analyses of the simulated results, the impacts were clearly revealed. The main conclusions of this work are summarized as follows:
- (1)
- Overall, the land breeze circulation has a significant positive impact on sea fog formation during the nighttime, while the sea breeze circulation has a significant negative impact on the sea fog development during the daytime.
- (2)
- The land breeze circulation acts as an accelerator that promotes sea fog forming earlier, becomes much thicker near the coast, and expands further over the sea. The land breeze circulation can enhance the processes of humidification and cooling near the coast because its descending branch is a barrier preventing water vapor from progressing inland and its low-level land breeze is against the onshore background wind, thus intensifying the convergence and accumulation of water vapor. At the same time, the cool-air transportation by the offshore low-level land breeze weakens the near-surface inversion and speeds up the cooling originally caused only by turbulent mixing.
- (3)
- Contrary to the nighttime land breeze circulation, the daytime sea breeze circulation acts as a reducer that slows sea fog development. The onshore advection of cloud liquid water by the low-level sea breeze restrains the sea fog expanding outward from the coast, resulting in the contraction of the fog area. On the other hand, the descending branch of the sea breeze circulation, which leads to warming and drying, hence limits the vertical development of the sea fog.
Compared with widespread sea fog that generally forms and develops over the open sea, it is more difficult to deal with coastal sea fog because it involves complex sea–land interactions during the evolution of coastal sea fog. The present case study showed this complexity, and the results were encouraging. As seen in the simulations, however, 2 m-RH simulations at some coastal sites seemed to have some limitations, showing a 10–20% difference with respect to observations. The information of fog occurrence in numerical weather forecast highly depends on RH values, and thus uncertainty in RH means inaccurate fog forecast. Data assimilation is needed for coastal sea fog simulation in the future, and relevant work is already underway [40,41].
Previous numerical studies of coastal sea fog mainly focused on two aspects: one to investigate how a dominant synoptic system promotes suitable weather conditions for fog formation and development [14,42], and the other to explore the influences of the turbulent mixing of heat and moisture, and radiative cooling, using a 3D regional model with high resolution and even coupled with a 1D turbulence model [17,20]. However, this study focused on the role of coastal mesoscale thermal circulation, and it revealed the importance of the advection effects of the nighttime land breeze on inland cool air which is transported over the sea, and of the daytime sea breeze on sea fog which is withdrawn toward the coast. This study’s findings can help us to better understand the evolution mechanism of coastal sea fog.
The Yellow Sea has a long sea fog season starting from March and ending with an abrupt termination in August [8,9], which almost spans spring and summer. During this sea fog season with southerly prevailing winds, sea-land breezes along the Shandong Peninsula usually occur once a high dominates the Yellow Sea. Maybe there is a seasonal dependence of current fog results because the occurrence and strength of sea–land breezes depend on the temperature difference between sea and land. So far, we cannot give an answer because only one case has been studied. More cases need to be investigated in future research.
Author Contributions
Conceptualization, S.G. and X.L.; methodology, G.J. and H.S.; software, Y.Y. and Q.Z.; validation, S.G. and X.L.; formal analysis, S.G. and G.J.; writing—original draft preparation, G.J.; writing—review and editing, S.G.; visualization, G.J. and H.S.; supervision, S.G.; project administration, S.G.; funding acquisition, S.G. All authors have read and agreed to the published version of the manuscript.
Funding
This research was funded by the National Natural Science Foundation of China (42075069), the Key Research and Development Program of Shandong Province (2019GSF111066).
Institutional Review Board Statement
Not applicable.
Data Availability Statement
The site https://www.ecmwf.int/en/forecasts/datasets/reanalysis-datasets/era5 (accessed on 10 July 2021) provides for ERA5 downloading. The NEAR-GOOS SST data are available at http://ds.data.jma.go.jp/gmd/goos/data (accessed on 10 July 2021). The MTSAT data are available at http://weather.is.kochi-u.ac.jp/sat/GAME (accessed on 9 June 2021), including albedo, infrared, and visible cloud imageries. The MODIS high-resolution visible imageries can be obtained from https://worldview.earthdata.nasa.gov (accessed on 15 May 2021). Modeling data can be accessed by contacting the corresponding author: Shanhong Gao (gaosh@ouc.edu.cn).
Acknowledgments
The authors acknowledge UCAR/NCAR/CISL/TDD for providing the powerful graphic tool NCL (https://doi.org/10.5065/D6WD3XH5 (accessed on 28 March 2021)).
Conflicts of Interest
The authors declare that there are no conflicts of interest regarding the publication of this paper. The funders had no role in the design of the study; in the collection, analyses, or interpretation of data; in the writing of the manuscript, or in the decision to publish the results.
References
- Stull, R.B. An Introduction to Boundary Layer Meteorology, 1st ed.; Kluwer Academic Publishes: Dordrecht, The Netherlands, 1988. [Google Scholar]
- Rotunno, R. On the linear theory of the land and sea breeze. J. Atmos. Sci. 1983, 40, 1999–2009. [Google Scholar] [CrossRef]
- Martin, C.L.; Pielke, R.A. The adequacy of the hydrostatic assumption in sea breeze modeling over flat terrain. J. Atmos. Sci. 1983, 40, 1472–1481. [Google Scholar] [CrossRef]
- Briere, S. Energetics of daytime sea-breeze circulation as determined from a two dimensional, third-order turbulence closure model. Atmos. Sci. 1987, 44, 1455–1474. [Google Scholar] [CrossRef]
- Wang, S.Z.; Song, X.L. The sea/land breeze in the northern coastal area of Shandong Peninsula. China Ocean Press 1989, 8, 367–378. (In Chinese) [Google Scholar]
- Wu, Z.M. Numerical study on the local wind structures forced by the complex terrain of Qingdao area. Acta Mete Sin. 1992, 6, 355–366. [Google Scholar]
- Wang, B.H. Some characteristics of sea fog along China coast and its vicinity. Trans. Oceanol. Limnol. 1980, 10, 9–20. [Google Scholar]
- Zhang, S.P.; Xie, S.P.; Liu, Q.Y.; Yang, Y.Q.; Wang, X.G.; Ren, Z.P. Seasonal variations of Yellow Sea fog: Observations and mechanisms. J. Clim. 2009, 22, 6758–6772. [Google Scholar] [CrossRef]
- Gao, S.H.; Lin, H.; Shen, B.; Fu, G. A heavy sea fog event over the Yellow Sea in March 2005: Analysis and numerical modeling. Adv. Atmos. Sci. 2007, 24, 65–81. [Google Scholar] [CrossRef]
- Koračin, D.; Dorman, C.E. Marine Fog: Challenges and Advancements in Observations, Modeling, and Forecasting, 1st ed.; Springer International Publishing: San Diego, CA, USA, 2017. [Google Scholar]
- Yang, Y.; Gao, S.H. Sensitivity study of vertical resolution in WRF numerical simulation for sea fog over the Yellow Sea. Acta Meteorol. Sin 2016, 74, 974–988. (In Chinese) [Google Scholar]
- Sheng, L.F.; Liang, W.F.; Wang, D.; Gao, S.H. Analysis on impact meteorology Condition on one advection sea fog in Qingdao. J. Ocean Univ. China 2010, 40, 1–10. (In Chinese) [Google Scholar]
- Wang, S.; Fu, D.; Chen, D.L.; Li, P.Y.; Fu, G. An observation and numerical simulation of a sea fog event over the Yellow Sea in the spring of 2009. Trans. Atmos. Sci. 2012, 35, 282–294. [Google Scholar]
- Fu, G.; Guo, J.T.; Xie, S.P.; Duan, Y.H.; Zhang, M.G. Analysis and high-resolution modeling of a dense sea fog event over the Yellow Sea. Atmos. Res. 2006, 81, 292–303. [Google Scholar] [CrossRef]
- Wang, Y.; Gao, S.H.; Fu, G.; Sun, J.; Zhang, S. Assimilating MTSAT derived humidity in now-forecasting sea fog over the Yellow Sea. Weather Forecast. 2014, 29, 205–225. [Google Scholar] [CrossRef]
- Yang, Y.; Hu, X.M.; Gao, S.H.; Wang, Y.M. Sensitivity of WRF simulations with the YSU PBL scheme to the lowest model level height for a sea fog event over the Yellow Sea. Atmos. Res. 2018, 215, 253–267. [Google Scholar] [CrossRef]
- Yang, Y.; Gao, S.H. The impact of turbulent diffusion driven by fog-top cooling on sea fog development. JGR Atmos. 2019, 125, 10608–10625. [Google Scholar] [CrossRef]
- Cho, Y.K.; Kim, M.O.; Kim, B.C. Sea fog around the Korean Peninsula. J. Appl. Meteorol. 2007, 39, 2473–2479. [Google Scholar] [CrossRef]
- Kim, C.K.; Yum, S.S. Local meteorological and synoptic characteristics of fogs formed over Incheon international airport in the west coast of Korea. Adv. Atmos. Sci. 2010, 27, 761–776. [Google Scholar] [CrossRef]
- Kim, C.K.; Yum, S.S. A numerical study of sea-fog formation over cold sea surface using a one-dimensional turbulence model coupled with the Weather Research and Forecasting model. Bound.-Layer Meteorol. 2012, 143, 481–505. [Google Scholar] [CrossRef]
- Ghonima, M.S.; Yang, H.; Kim, C.K.; Heus, T.; Kleissl, J. Evaluation of WRF SCM simulations of stratocumulus-topped marine and coastal boundary layers and improvements to turbulence and entrainment parameterizations. J. Adv. Model. Earth Syst. 2017, 9, 2635–2653. [Google Scholar] [CrossRef] [Green Version]
- Huang, S.; Zhang, S.P.; Yi, L. The analysis of the formation of Coastal fog under surface offshore Airflow in the Western yellow sea in Spring. J. Ocean Univ. China 2019, 49, 20–29. (In Chinese) [Google Scholar]
- Choi, H.; Speer, M.S. The influence of synoptic-mesoscale winds and sea surface temperature distribution on fog formation near the Korean western peninsula. Meteorol. Appl. 2006, 13, 347–360. [Google Scholar] [CrossRef]
- ECMWF ERA5 Hourly Data. Available online: https://www.ecmwf.int/en/forecasts/datasets/reanalysis-datasets/era5 (accessed on 12 March 2021).
- NEAR-GOOS Dataset. Available online: http://ds.data.jma.go.jp/gmd/goos/data (accessed on 12 October 2017).
- China Meteorological Administration. Available online: http://www.cma.gov.cn/en2014/ (accessed on 15 May 2021).
- Korea Meteorological Administration. Available online: http://web.kma.go.kr/eng/index.jsp (accessed on 10 March 2021).
- MTSAT Data Archive. Available online: http://weather.is.kochi-u.ac.jp/sat/GAME (accessed on 15 November 2017).
- Skamarock, W.C.; Klemp, J.B.; Dudhia, J.; Gill, D.O.; Barker, D.M.; Duda, M.G.; Huang, X.Y.; Wang, W.; Powers, J.G. A Description of the Advanced Research WRF Version 3. Available online: http://www2.mmm.ucar.edu/wrf/users/docs/arw_v3.pdf (accessed on 10 January 2021).
- Hong, S.Y.; Lim, K.S.; Kim, J.H.; Lim, J.O.J.; Dudhia, J. The WRF single-moment 6-class microphysics scheme (WSM6). J. Korean Meteorol. Soc. 2006, 42, 129–151. [Google Scholar]
- Lin, Y.L.; Farley, R.D.; Oriville, H.D. Bulk parameterization of the snow field in a cloud model. J. Clim. Appl. Meteorol. 1983, 22, 1065–1092. [Google Scholar] [CrossRef] [Green Version]
- Kain, J.S.; Fritsch, J.M. A one-dimensional entraining/detraining plume model and its application in convective parameterization. J. Atmos. Sci. 1990, 47, 2784–2802. [Google Scholar] [CrossRef] [Green Version]
- Iacono, M.J.; Delamere, J.S.; Mlawer, E.J.; Shephard, M.W.; Clough, S.A.; Collins, W.D. Radiative forcing by long-lived greenhouse gases: Calculations with the AER radiative transfer models. J. Geophys. Res. Atmos. 2008, 113, D13103. [Google Scholar] [CrossRef]
- Dudhia, J. Numerical study of convection observed during the Winter Monsoon Experiment using a mesoscale two-dimensional model. J. Atmos. Sci. 1989, 46, 3077–3107. [Google Scholar] [CrossRef]
- Jimenez, P.A.; Dudhia, J.; Gonzalez-Rouco, J.F.; Navarro, J.; Montavez, J.P.; Garcia, B.E. A revised scheme for the WRF surface layer formulation. Mon. Weather Rev. 2012, 140, 898–918. [Google Scholar] [CrossRef] [Green Version]
- Jiang, H.Y.; Gao, S.H. Comparison of simulation effects between two land surface schemes on land fog and sea fog. J. Mari Meteorol. 2021, 41, 30–44. (In Chinese) [Google Scholar]
- Chen, F.; Dudhia, J. Coupling an advanced land surface–hydrology model with the Penn State–NCAR MM5 modeling system. Part I: Model implementation and sensitivity. Mon. Weather Rev. 2001, 129, 569–585. [Google Scholar] [CrossRef] [Green Version]
- Stoelinga, M.T.; Warner, T.T. Nonhydrostatic, mesobeta-scale model simulations of cloud ceiling and visibility for an east coast winter precipitation event. J. Appl. Meteor. 1999, 38, 385–404. [Google Scholar] [CrossRef]
- Zhou, B.B.; Du, J. Fog prediction from a multimodel mesoscale ensemble prediction system. Weather Forecast. 2010, 25, 303–322. [Google Scholar] [CrossRef]
- Gao, X.Y.; Gao, S.H. Impact of Multivariate Background Error Covariance on the WRF-3DVAR Assimilation for the Yellow Sea Fog Modeling. Adv. Meteorol. 2020, 2020, 8816185. [Google Scholar] [CrossRef]
- Yang, Y.; Wang, Y.M.; Gao, S.H.; Yuan, X.Y. A New Observation Operator for the Assimilation of Satellite-Derived Relative Humidity: Methodology and Experiments with Three Sea Fog Cases over the Yellow Sea. J. Meteor. Res. 2021, 35, 1104–1124. [Google Scholar] [CrossRef]
- Li, P.Y.; Fu, G.; Lu, C.G. Large-scale environmental influences on the onset, maintenance, and dissipation of six sea fog cases over the Yellow Sea. Pure Appl. Geophys. 2011, 169, 983–1000. [Google Scholar] [CrossRef]
Publisher’s Note: MDPI stays neutral with regard to jurisdictional claims in published maps and institutional affiliations. |
© 2022 by the authors. Licensee MDPI, Basel, Switzerland. This article is an open access article distributed under the terms and conditions of the Creative Commons Attribution (CC BY) license (https://creativecommons.org/licenses/by/4.0/).