Article

Seasonal Variations of Ecosystem Water Use Efficiency and Their Responses to Climate Factors in Inner Mongolia of China

1
Yinshanbeilu National Field Research Station of Desert Steppe Eco-Hydrological System, China Institute of Water Resources and Hydropower Research, Beijing 100038, China
2
Institute of Water Resources for Pastoral Area Ministry of Water Resources, Hohhot 010020, China
*
Author to whom correspondence should be addressed.
Atmosphere 2022, 13(12), 2085; https://doi.org/10.3390/atmos13122085
Submission received: 2 November 2022 / Revised: 3 December 2022 / Accepted: 6 December 2022 / Published: 11 December 2022
(This article belongs to the Special Issue Impact of Land-Use and Climate Change on Vegetation)

Abstract

:
Ecosystem water use efficiency (eWUE) is a useful metric to examine the interactions between water and carbon cycles in ecosystems. To reveal the response and adaptation characteristics of different vegetation types within the context of global warming on a regional scale, the spatiotemporal characteristics and influencing factors of the seasonal eWUE of various vegetation types in Inner Mongolia from 2001 to 2020 were explored. Based on MODIS gross primary productivity (GPP), evapotranspiration (ET) data and meteorological data, in this study, we estimated eWUE in different seasons in Inner Mongolia and used trend analysis and correlation analysis methods to analyze the relationship between eWUE in spring, summer and autumn and the temperature–precipitation. From 2001 to 2020, in this region, the GPP and ET in spring, summer and autumn showed increasing trends. In addition, the growth rates of GPP and ET in spring and summer were higher than those in autumn. Under the combined effect of GPP and ET, eWUE in different seasons showed a significant decreasing trend (p < 0.05)—this is ascribed to the extent of ET increasing more than GPP, especially in summer, with the most obvious decreasing rate. In terms of spatial trend, in spring and summer, there is a decreasing trend from northeast to southwest. The effects of precipitation and temperature on the eWUE in Inner Mongolia were mainly negatively correlated in the northeastern part of Inner Mongolia with higher altitudes during the spring and autumn seasons. In total, 95.096% of the total area had positive correlations between eWUE and temperature in spring. In summer, the region in which the WUE of the vegetation had an inverse relationship with both the temperature and the amount of precipitation was the largest compared to these regions in spring and autumn.

1. Introduction

Global climate change is significantly affecting land-based ecosystem productivity and water use distribution patterns. Climate warming may promote plant growth in heat-limited high-latitude and high-altitude regions. However, in many water-limited regions, temperature increases may lead to increased drought, the deceleration of plant growth and increased ecosystem disturbance, resulting in reduced terrestrial carbon uptake capacity [1,2]. To evaluate ecosystems’ vulnerability to climate change, scientists employ indicators such as ecosystem water use efficiency (eWUE), which is a crucial aspect of research related to carbon–water cycle coupling [3]. The quantification of the temporal and spatial changes in the water use efficiency of ecosystems in response to climate change is highly significant in light of the increasing visibility of environmental problems caused by global change, and it provides a basis for humans to exercise control over scarce water resources to obtain the greatest yield and economic benefits [4].
The first studies regarding water use efficiency were mainly experimental observations, and most of them took measurements directly in the field [5]. Later, with the development of observation technology, eddy correlation technology was gradually applied to the simulation of water–carbon cycles and to determine the productivity and water use efficiency of different types of ecosystems [6,7,8]. In regional ecosystems, to estimate water usage efficiency, extensive use has been made of remote sensing technology due to its robust capacity to acquire surface information and high temporal resolution [9,10], and breakthroughs have been made in the study of water use efficiency at the ecosystem level [11]. In recent years, researchers from both China and elsewhere have used ecosystem process models to assess the efficacy of water usage at various spatial and temporal scales in China’s terrestrial ecosystems. Research regarding the former has suggested that drought has different effects on water use efficiency in different regions [12]. Research regarding the latter has revealed the zonal law of WUE with increasing latitude [13]. In addition, variations in eWUE are directly tied to the conditions of the climate, such as temperature [14], precipitation [15], solar radiation [16] and saturated water vapor pressure difference [17]. However, the effects of these factors on eWUE are significantly different in different regions and among different vegetation types. Studies have found that eWUE has a positive correlation with temperature in areas with high latitudes [18], but it has a negative correlation in relatively diffuse South America, Southeast Asia and other regions [19]. An increase in precipitation can reduce the eWUE in forests in eastern China [20]. However, it can promote eWUE in the temperate grasslands of Inner Mongolia [21]. It can be seen that the response of eWUE to global change is very complex; therefore, it is necessary to strengthen our understanding of the spatiotemporal patterns of eWUE in different regions and its relationship with climate factors.
As the global water resource crisis worsens, water usage efficiency, a comprehensive physiological and ecological gauge of plant growth appropriateness, has become a hot topic in arid and semi-arid zone research [22]. Inner Mongolia is distinguished by its extreme climate, water and geographical diversity. Even though it serves as a vital ecological security barrier in China’s northern regions, the region’s ecosystem is highly vulnerable and delicate. The scarcity of water is a major contributor to environmental degradation and a barrier to economic growth in developing regions. Most of Inner Mongolia is becoming warmer and more humid because of global climate change [23]. In order to utilize limited water resources reasonably and efficiently, a more comprehensive and in-depth understanding of the water use efficiency characteristics of different vegetation ecosystems is necessary, and the water use efficiency of ecosystems should be understood and improved. However, current research has mostly focused on the interannual fluctuation of eWUE, rather than interannual variations in seasonal eWUE, which restricts our knowledge regarding the fundamental mechanism of eWUE to climate response. In addition, related studies have shown that in spring and winter, the warming rate is higher [24], and seasonal changes in precipitation also occur [25]. We still need to determine whether these seasonal changes have an effect on seasonal eWUE. As discussed above, this study aims: (1) To investigate the temporal and spatial trends of GPP, ET and eWUE in different seasons; (2) To analyze the relationship between soil temperature utilization efficiency and precipitation and temperature in different seasons; (3) To quantitatively evaluate the effects of vegetation types on eWUE, precipitation and temperature in different seasons. This will help us to learn more about the relationship between plants and climate change and protect the ecological environment in Inner Mongolia’s steppe region.

2. Study Area and Methods

2.1. Study Area

The Inner Mongolia steppe (97°12′–126°04′ E, 37°34′–53°23′ N) is a vital piece of the Eurasian steppe. It is mostly located to the west of the Great Hinggan Mountains, to the north of the Yinshan and Helan Mountains, in the Inner Mongolia Plateau and in the hills and mountains in the border zone, as well as in the Ordos High Plain, which has a clear temperate continental climate. The average temperature of 0~8 °C increases from east to west. Precipitation is 50~450 mm, decreasing from east to west [26]. In this way, the climate changes from humid to semi-humid to dry as one moves from east to west. Controlled by the main comprehensive factors of hydrothermal conditions, the horizontal zonation of vegetation types in Inner Mongolia is obvious, with coniferous forest, broadleaved forest, grassland and desert being located from east to west (Figure 1b).

2.2. Data Sources

2.2.1. Remote Sensing Data

The MODIS data were derived from the GPP (MOD17A2, NASA, Washington, D.C., USA) and ET (MOD16A2, NASA, Washington, D.C., USA) terrestrial grade 4 products. The GPP product is calculated based on the photosynthetically active radiation utilization efficiency model, and the ET product is calculated using the improved MOD16 algorithm. The accuracy of these data has been compared and verified with flux site data in many regions worldwide, and these data have been widely used in global and regional studies [27,28,29].

2.2.2. Meteorological Data

The monthly average temperature and precipitation data from 43 meteorological stations in the research region from 2001 to 2020 were taken from the China Meteorological Data Network (http://data.cma.cn, accessed on 1 June 2022) (Figure 1a). Long-term meteorological raster data of the research region were tailored using ANUSPLIN interpolation software, using elevation as a covariate. The spatial distribution maps of precipitation and temperature in different seasons were obtained (Figure 2).

2.2.3. Vegetation Type Data

The international geo-biosphere program (IGBP) classification method is used to classify plant type data in the MCD12Q1(NASA, USA) data package, which has a 500 m spatial resolution. In order to reduce the classification error and the possible impact of land cover changes, in this paper, we only retained the pixels in which the land cover types remained unchanged from 2001 to 2020. The main vegetation types were as follows: Deciduous Needleleaf Forests (0.66%), Deciduous Broadleaf Forests (1.30%), Mixed Forests (0.26%), Woody Savannas (6.08%), Savannas (1.34%), Grasslands (49.99%), Croplands (4.65%), Other (25.43%), Change (10.25%).

2.2.4. Other Data and Processing

The preprocessing of each remote sensing datum mainly includes image stitching, projection, extraction, resampling and masking processes. First, in order to ensure the minimum area deformation of each datum, in this study, we projected all the remote sensing data into the WGS84 geographic coordinate system and the Albers equal-area conic projection spatial coordinate system, and we resampled the data to 1 km × 1 km to ensure that all the remote sensing data could be efficiently matched spatially. All of the data preprocessing was carried out on ArcGIS (ESRI, Redlands, CA, USA) and ENVI (Exelis VIS, Boulder, CO, USA).

2.3. Methodology

The data processing process is shown in Figure 3. According to the figure from left to right, the MODIS data were preprocessed first to extract ET and GPP data. Then, eWUE was calculated according to GPP and ET data, and the temperature and precipitation climatic factors were interpolated according to the original climate data of weather stations. Secondly, the spatial distribution and trend of eWUE were calculated by the linear regression method. Then, correlation analysis was used to analyze the relationship between rainfall, temperature and eWUE. The effects of vegetation types on the correlation between rainfall, temperature and eWUE were quantified.

2.3.1. eWUE

In this paper, WUE refers to the amount of dry matter produced by the loss of plant canopy and soil moisture per unit mass [30]. The calculation formula is
e W U E = G P P / E T
where eWUE is the water use efficiency (g C·kg−1 H2O), GPP is the total primary productivity of the ecosystem (g C m−2) and ET is the ecosystem evapotranspiration (mm).

2.3.2. Trend Analysis

The univariate linear regression trend analysis method was used to simulate the temporal and spatial trends of eWUE and climate factors from 2001 to 2020 at the pixel scale, that is, with the season as the independent variable and the eWUE and climate factors of each pixel as the dependent variables to conduct a univariate linear regression analysis [31]. The calculation formula is
s l o p e = ( n i = 1 n i × y i i = 1 n i i = 1 n y i ) / ( n i = 1 n i 2 ( i = 1 n i ) 2 )
where slope represents the slope of the variable regression equation; n represents the annual span; i represents the year; and yi represents the seasonal eWUE, temperature and precipitation data of the ith year.

2.3.3. Correlation Analysis between eWUE and Climatic Factors

From 2001 to 2020, seasonal eWUE data and climatic parameters in the research region were correlated on a pixel-by-pixel basis, and the geographical distribution of the correlation coefficient was derived to show the degree of connection between the seasonal eWUE and climatic factors [32]. The partial correlation coefficient was further obtained by using the simple correlation coefficient, the partial correlation result was used to control one of the variables and the correlation of the other two factors was discussed. The method used to calculate the correlation coefficient r is
r x y = i = 1 n ( x i x ¯ ) ( e W U E i e W U E ¯ ) i = 1 n ( x i x ¯ ) 2 i n ( e W U E i e W U E ¯ ) 2
where n represents the length of time; x ¯ represents the meteorological element; e W U E ¯ represents the average value of eWUE in each season.
The formula used to calculate the partial correlation coefficient is
r x y , z = r x y r x z × r y z ( 1 r x y 2 ) ( 1 r y z 2 )
where rxy,z represents the partial correlation coefficients of the x and y variables after the fixed variable z; rxy, rxz, and ryz are the correlation coefficients between the respective variables; the value range of the partial correlation coefficient is between −1 and 1.

3. Results

3.1. Temporal Trends in Different Seasons

From 2001 to 2020, the GPP in this region increased at a rate of 0.244% per year, 0.066% per year and 0.041% per year, respectively. The rise in spring was statistically significant (p < 0.05). There was a statistically significant upward trend in spring, summer and autumn ET (p < 0.05), with yearly rates of 1.252, 2.746 and 0.824. Spring and summer displayed faster rates of increase in terms of GPP and ET than autumn did (Figure 4). Under the combined effect of GPP and ET, the average seasonal eWUE in Inner Mongolia was 0.930 g C·kg−1 H2O, 2.035 g C·kg−1 H2O and 0.828 g C·kg−1 H2O, respectively, and the eWUE in different seasons showed a significant decreasing trend (p < 0.05), especially in summer, in which the change in the decreasing rate was the most obvious (−0.045). In Inner Mongolia, the summertime evapotranspiration rate was much higher than the GPP rate because the seasonal growth rate in terms of evapotranspiration was higher. This means that when the amount of rainfall increased, eWUE would drop.

3.2. Spatial Trends in Different Seasons

3.2.1. Spatial Distribution Characteristics of ET and GPP

There was a consistent seasonal southward trend in GPP and ET from the northeast to the southwest (Figure 5a–f). It is clear that the high values of GPP and ET were concentrated in the northeastern region of the research area. Summer displayed greater maximum values of GPP and ET (5.634–699.50 g C m−2 d−1, 5.946–494.999 mm) than spring and fall. The southern part of the research area was characterized by low GPP and ET values because of the region’s lower mean annual temperature and lower mean annual precipitation values.

3.2.2. Characteristics of the Distribution, as Well as the General Trend of Change, of the Yearly Mean Value of eWUE

There were obvious spatial differences in eWUE in different seasons in Inner Mongolia, and the variation ranges were 0.130–4.012 g C·kg−1 H2O, 0.416–4.147 g C·kg−1 H2O and 0.083–2.531 g C·kg−1 H2O, respectively. The spatial distribution pattern of eWUE in spring, summer and autumn was high in the northeast and low in the southwest (Figure 6a–c), and the high-value areas were mainly concentrated in the middle and small undulating mountainous areas in the northeast and the Hetao Plain in the west. The low-value areas were located in the plain crops and grasslands in the central and northern regions and the mountain forest regions in the northeast.
While there was an overall decreasing tendency in eWUE across Inner Mongolia’s four distinct seasons, there was also evidence of an upward trend in specific regions. Eighteen percent (18.36%) of the areas exhibited an increasing trend, and twenty-nine percent (29.31%) showed a declining trend in the spring. It can be shown in Figure 6d that the general geographical difference in eWUE in Inner Mongolia in spring was not statistically significant, with the rising areas scattered in sections of the northeastern part of the research area. Mainly in the study’s central and southern regions, summer temperatures rose in 28.24% of the areas, fell in 69.36% of the areas and remained stable in 78.65% of the areas, with all of the changes being statistically significant at the p < 0.05 level (Figure 6e). In total, 66% of the regions, mostly in the central and southwestern sections of the research area and some parts of the northeastern region, passed the significance (p < 0.05) test in the fall, with 33.64% and 42.18% of the regions showing an increasing trend and a downward trend, respectively (Figure 6f).
The results showed that, in DNF and GRA, the mean eWUE in spring and summer was significantly higher than that in autumn. In CRO, DBF, MF, SA and WSA, the mean eWUE in summer was significantly higher than that in spring and autumn (Figure 7). In spring and summer, the average eWUEs of DNF were the highest—2.163 g C·kg−1 H2O and 2.165 g C·kg−1 H2O, respectively—which were significantly higher than those of DBF and MF forest types (p < 0.05); the average eWUE of SA was the lowest, being only 1.676 g C·kg−1 H2O, which was significantly lower than other vegetation types (p < 0.05). However, in autumn, the average eWUE of GRA was the smallest, which was 0.739 g C·kg−1 H2O. In summer, the eWUE size order of each vegetation type was DNF (2.165 g C·kg−1 H2O) > GRA (2.101 g C·kg−1 H2O) > MF (2.045 g C·kg−1 H2O) > WSA (2.031 g C·kg−1 H2O)> DBF (1.744 g C·kg−1 H2O) > CRO (1.715 g C·kg−1 H2O) > SA (1.676 g C·kg−1 H2O).

3.3. Results of Correlation Analysis between eWUE and Hydrothermal Factors

Temperature and precipitation are the main climatic parameters that impact vegetation growth. Figure 6 shows that the correlation coefficient between eWUE and precipitation in Inner Mongolia in spring was −0.876 to 0.623; 88.169% of regional WUE and precipitation was negatively connected, especially in the southwest and southeast of the research area, and 11.831% was positively correlated. It was positively associated, dispersed in the center of the research region (Figure 8a), and the significance test area accounted for 16.2% (p < 0.05), mostly near the Wushen Banner in the southwest (Figure 9a). The correlation coefficients between eWUE and summer precipitation in Inner Mongolia varied from −0.915 to 0.771, with 89.104% of the region negatively linked with precipitation, mostly in the center and southwest, and 10.896% favorably connected, mostly in the northeast (Figure 8b). A total of 56.6% (p < 0.05) of the research region passed the significance test, mostly in the center and southwest (Figure 9b). The correlation coefficient between eWUE and precipitation in autumn in Inner Mongolia ranged from −0.887 to 0.775, and 88.828% of the regional eWUE was negatively correlated with precipitation, mainly distributed around the Wushen Banner in the northeast and southwest of the study area; 11.172% of the regional eWUE was positively correlated with precipitation, distributed in the central part of the study and near the Hetao irrigation area (Figure 8c), and the area that passed the significance test accounted for 20.3% (p < 0.05), mainly in the northeastern part of the study area (Figure 9c).
In spring in Inner Mongolia, the correlation coefficient between eWUE and temperature ranged from −0.668 to 0.920. In 4.904% of the area, eWUE and temperature had a negative correlation, mostly in the central and western parts of the study area, especially in the Hetao Plain. In 95.096% of the area, eWUE and temperature had a positive correlation. A total of 52.7% (p < 0.05) of the area that passed the significance test was in the agro-pastoral cross belt near Chifeng and the northeast of the study area (Figure 8d). Most of this area was in the northeast of the study area (Figure 9d). In summer in Inner Mongolia, the correlation between eWUE and temperature ranged from −0.834 to 0.724. A total of 64.105% of the area was negatively correlated with temperature, mostly around Chifeng and Tongliao; 35.895% of the area was positively correlated with temperature, mostly around Hulun Lake and Near Erenhot (Figure 8e). In total, 10.5% of the area passed the significance test (p < 0.05), mostly around Tongliao and Chifeng (Figure 9e). eWUE correlated with Inner Mongolian autumn temperature from −0.793 to 0.842. Temperature was inversely linked with soil usage efficiency in 18.231% of the region, mostly in the southwest and northeast. eWUE was positively linked with temperature in 81.769% of the locations, dispersed in the central grassland region of Inner Mongolia (Figure 8f), and 22.6% passed the significance test (p < 0.05), mostly at the intersection of the middle and east of the research area (Figure 9f).
The correlation analysis results of the seasonal eWUE for different vegetation types and precipitation showed (Figure 10a) that, except for DBF and SA in summer, the eWUEs of vegetation types in other seasons were negatively correlated with precipitation. Except for grassland, the eWUE in summer was greater than that in spring and autumn among other vegetation types, and the correlation between eWUE and precipitation in summer grassland was the lowest.
The correlation analysis results regarding the seasonal eWUE and temperature of different vegetation types showed (Figure 10b) that, among different vegetation types, the correlation between eWUE and temperature in spring was greater than that in autumn and summer. In spring, the eWUEs of different vegetation types were all positively correlated with temperature, among which, the eWUE of GRA had the largest correlation with temperature, and the eWUE of DNF had the smallest correlation with temperature. In summer, except for GRA and WSA, the eWUEs of other vegetation types were negatively correlated with temperature, among which, the eWUE of GRA had the largest correlation with temperature, and the eWUE of DBF had the smallest correlation with temperature. In autumn, except for DNF and WSA, the eWUEs of other vegetation types were positively correlated with temperature, among which, the eWUE of CRO had the largest correlation with temperature, and the eWUE of DNF had the smallest correlation with temperature.

4. Discussion

4.1. Seasonal Variation Characteristics of eWUE

The findings of this research indicate that there are discernible distinctions to be found in the patterns of the geographical distribution of eWUE between seasons. It is possible that this is due to the fact that various types of flora make use of water in different ways at different times of the year. For instance, the distribution ranges of DNF and GRA both exhibited increased WUE during the spring, but CRO and SA both showed lower WUE over the same time period. In the summer, the distribution ranges of CRO and SA showed lower WUE, whereas the distribution ranges of GRA and DBF showed greater WUE. This indicates that in the summer, when there is considerable evaporation, grassland with poor carbon fixation is more likely to be found. Instead, it may adjust to its surroundings by modifying its tactics for water usage and become more efficient in its water use. Conversely, MF with higher carbon fixation was less efficient in water use. In autumn, the distribution range of DNF showed higher WUE, while GRA showed lower WUE. The vegetation eWUE of DNF in different seasons in the study area was higher than that of DBF, which was inconsistent with the conclusions drawn by other researchers [33]. This may have been caused by different vegetation site conditions caused by differences in soil, climate, hydrology and other environmental factors [34]. Compared with coniferous forests, DBF has a stronger canopy interception capacity, which makes its evapotranspiration higher, so the eWUE of DBF is lower [35]. In addition, the eWUE of DBF is also slightly lower than that of GRA, which is mainly due to the low stomatal conductance of forest vegetation, and thus, the low photosynthetic rate [36]. At the same time, forests in Inner Mongolia are mainly distributed in high-altitude areas where the annual average temperature is lower than zero, and a low-temperature environment is not conducive to the photosynthesis of vegetation. In addition, typical shrubs (sea buckthorn, caragana, etc.) have small leaves and low chlorophyll content, so the remote sensing signal cannot truly reflect the vegetation coverage of low shrubs, and GPP remote sensing products have a certain degree of underestimation [37,38]. This is also one of the reasons for the lower eWUE of shrubs. The differences in eWUE caused by natural vegetation types in different seasons may be related to the heterogeneity of the vegetation community structure in the ecosystem, the water use strategies of different vegetation types and the limitations of geobotanical factors [39,40,41].
In terms of trend, eWUE in different seasons in Inner Mongolia generally showed a downward trend, but eWUE in some areas showed an increasing trend, and the downward trend in summer was significantly higher than that in spring and autumn, indicating that there were differences in vegetation water use strategies and capacities in different growth stages. The eWUE showed a reverse trend in the eastern and western regions, indicating that the western arid region will greatly promote the increase in surface evapotranspiration under the condition of more precipitation in summer, which will lead to the decline in eWUE, while the eastern region will be affected by increased precipitation. The favorable climatic conditions of increasing temperature increased the photosynthesis of vegetation, and the increase in GPP was greater than that in ET, thus, effectively promoting the significant increase in eWUE.

4.2. Temporal and Spatial Dynamics of Seasonal eWUE in Response to Hydrothermal Conditions

CO2 concentration, leaf area index, air temperature, precipitation, soil moisture, etc., will all have an impact on regional eWUE [42,43,44]. The areas with negative correlations between eWUE and precipitation in spring and autumn in Inner Mongolia were mainly concentrated in the middle and high mountains (Figure 8). This was because the vegetation in the middle and high mountains grows poorly due to the low temperature caused by its high altitude, the vegetation water demand is limited and the precipitation increases. This has little significance in terms of vegetation growth but will increase the evaporation of the site [45]. Therefore, water use efficiency was negatively correlated with precipitation in this region. However, in these areas, eWUE in Inner Mongolia was positively correlated with precipitation in summer, mainly because most of these areas had higher altitudes and lower evapotranspiration rates, while the higher the altitude in eastern Inner Mongolia, the better the vegetation growth [46]. That is to say, the greater the potential of vegetation to sequester carbon, the more the eWUE of vegetation will increase when the temperature satisfies the requirements for the development of vegetation, which coincides with an increase in the amount of precipitation. [47,48,49,50]. The performance of eWUE varies in regions with different precipitation levels. In China, areas with annual precipitation levels less than 627 mm showed significant positive correlations (R2 = 0.9, p < 0.01), and areas with annual precipitation levels greater than 627 mm showed significant negative correlations [51]. When the annual precipitation level was less than 2352 mm, eWUE would increase with the increase in precipitation. However, when the annual precipitation was more than 4450 mm, the effective water use efficiency would decrease with the increase in precipitation [52]. In Europe, the WUE of Quercus suber with a precipitation gradient of 491~1299 mm decreased with increasing precipitation [53].
In areas which experience less precipitation, the increase in precipitation would promote plant photosynthesis, resulting in a substantial increase in GPP, while the increase in ET would be small, resulting in an increase in WUE in areas which experience less precipitation. Meanwhile, for areas which experience more precipitation, the same increase would be observed. Precipitation contributed less to GPP but greatly increased the amount of water available for evaporation, resulting in lower eWUE in the region [54]. Excessive precipitation would gradually decrease the eWUE [55].
In the study area, the response of water use efficiency of ecosystems to air temperature in different seasons was different. In spring, the areas with positive correlations between eWUE and temperature were mainly distributed in the northeastern part of the study area. More dry matter mass was present, thereby improving vegetation eWUE [56]. In summer, the areas with positive correlations between eWUE and temperature were mainly distributed near Hulun Lake and Erenhot, and the areas with negative correlations were mainly distributed in the agro-pastoral cross belt near Tongliao and Chifeng and the Hetao Plain. As the response of eWUE to meteorological elements depends on the dominant process driving plant photosynthesis and ecosystem water loss, that is, the relative change of GPP to ET [57], the correlation between eWUE and temperature is mainly determined by vegetation ecosystems and depends on the degree of development. Although a warmer climate usually results in better vegetation growth, the southwestern part of the study area was mostly located in low latitudes and had relatively high temperatures. Excessive temperatures will cause plant respiration to be stronger than photosynthesis, stunting plant growth and even causing plants to die. Similarly, the increase in temperature will also lead to the increase in vegetation transpiration, and the increase rate of ET is higher than that of GPP. Observations of flux in the semi-arid Prosopis velutina community in Arizona, USA showed that evapotranspiration influenced by temperature significantly changed the WUE [58].
Therefore, the increase in temperature is not conducive to improving the water use efficiency of ecosystems in low-vegetation areas. In autumn, the areas with positive correlations between eWUE and temperature were mainly distributed in the grassland area in the middle of the study area, and the areas with negative correlations were mainly distributed in the southwest and northeast of the study area. In these regions, the eWUE in early spring and late autumn showed an increasing trend, which was due to the low temperature all year round in high latitudes, and the warmer temperatures in early spring and late autumn extended the growth period of plants [59]. As a result, the growth of GPP was higher than that of ET, which meant that eWUE displayed a growing trend. There is a critical value for the influence of temperature on WUE. A too-high or too-low temperature is detrimental to eWUE. eWUE increases with temperature when it is below the crucial value and decreases when it is beyond it. The combined influence of temperature on plant photosynthesis and transpiration may alter eWUE [60,61,62].

4.3. Uncertainties and Limitations

It should be noted that although we used the latest improved GPP and ET products released by MODIS in this study, there are still certain uncertainties in both. There will be some differences in the maximum light rate of plant cover types [63]. At the same time, the input of climatic factors will also introduce certain errors. Uncertainties in ET products are mainly due to errors introduced by inversion algorithms, climate input data and other input variables. Nevertheless, the results of this study still reflect the overall seasonal variation characteristics of eWUE in Inner Mongolia, and more accurate conclusions need to introduce more data and different methods used to carry out multi-channel integration research. This research emphasized the analysis of the influence that precipitation and temperature have on eWUE; however, the impact factors of eWUE are comprehensive and complicated. Since 2000, the Chinese government has implemented several large-scale ecological restoration projects, including the conversion of farmland to forest project (since 1999), the Three-North Shelterbelt Project (since 1978) and the grassland ecological protection subsidy and incentive policy (since 2010), which have had a significant impact on the structure and function of the terrestrial ecosystem [64]. Thus, the impact of other variables such as drought conditions, ecological projects and human activities on eWUE should be further increased. Additionally, its contribution ratio should be quantitatively differentiated according to the degree of its effect.

5. Conclusions

Using MODIS remote sensing data to estimate eWUE in different seasons in Inner Mongolia, the temporal and spatial characteristics of eWUE and its correlation with hydrothermal factors were quantitatively studied, and the following conclusions were drawn:
(1)
From 2001 to 2020, the GPP and ET in spring, summer and autumn in this region showed increasing trends. In addition, the growth rates of GPP and ET in spring and summer were higher than those in autumn. Under the combined effect of GPP and ET, eWUE seasons showed significant decreasing trends in different regions (p < 0.05), especially in summer (−0.045). In terms of spatial trend, eWUE in Inner Mongolia showed a downward trend in different seasons, but in some areas, eWUE showed an increasing trend.
(2)
In DNF and GRA, the average eWUE in spring and summer was significantly higher than that in autumn. In CRO, DBF, MF, SA and WSA, the mean eWUE in summer was significantly higher than that in spring and autumn. In spring and summer, the mean eWUE of DNF was the highest, which was significantly higher than that of the two forest types, DBF and MF (p < 0.05), and the mean eWUE of SA was the lowest, which was significantly lower than that of other vegetation types (p < 0.05).
(3)
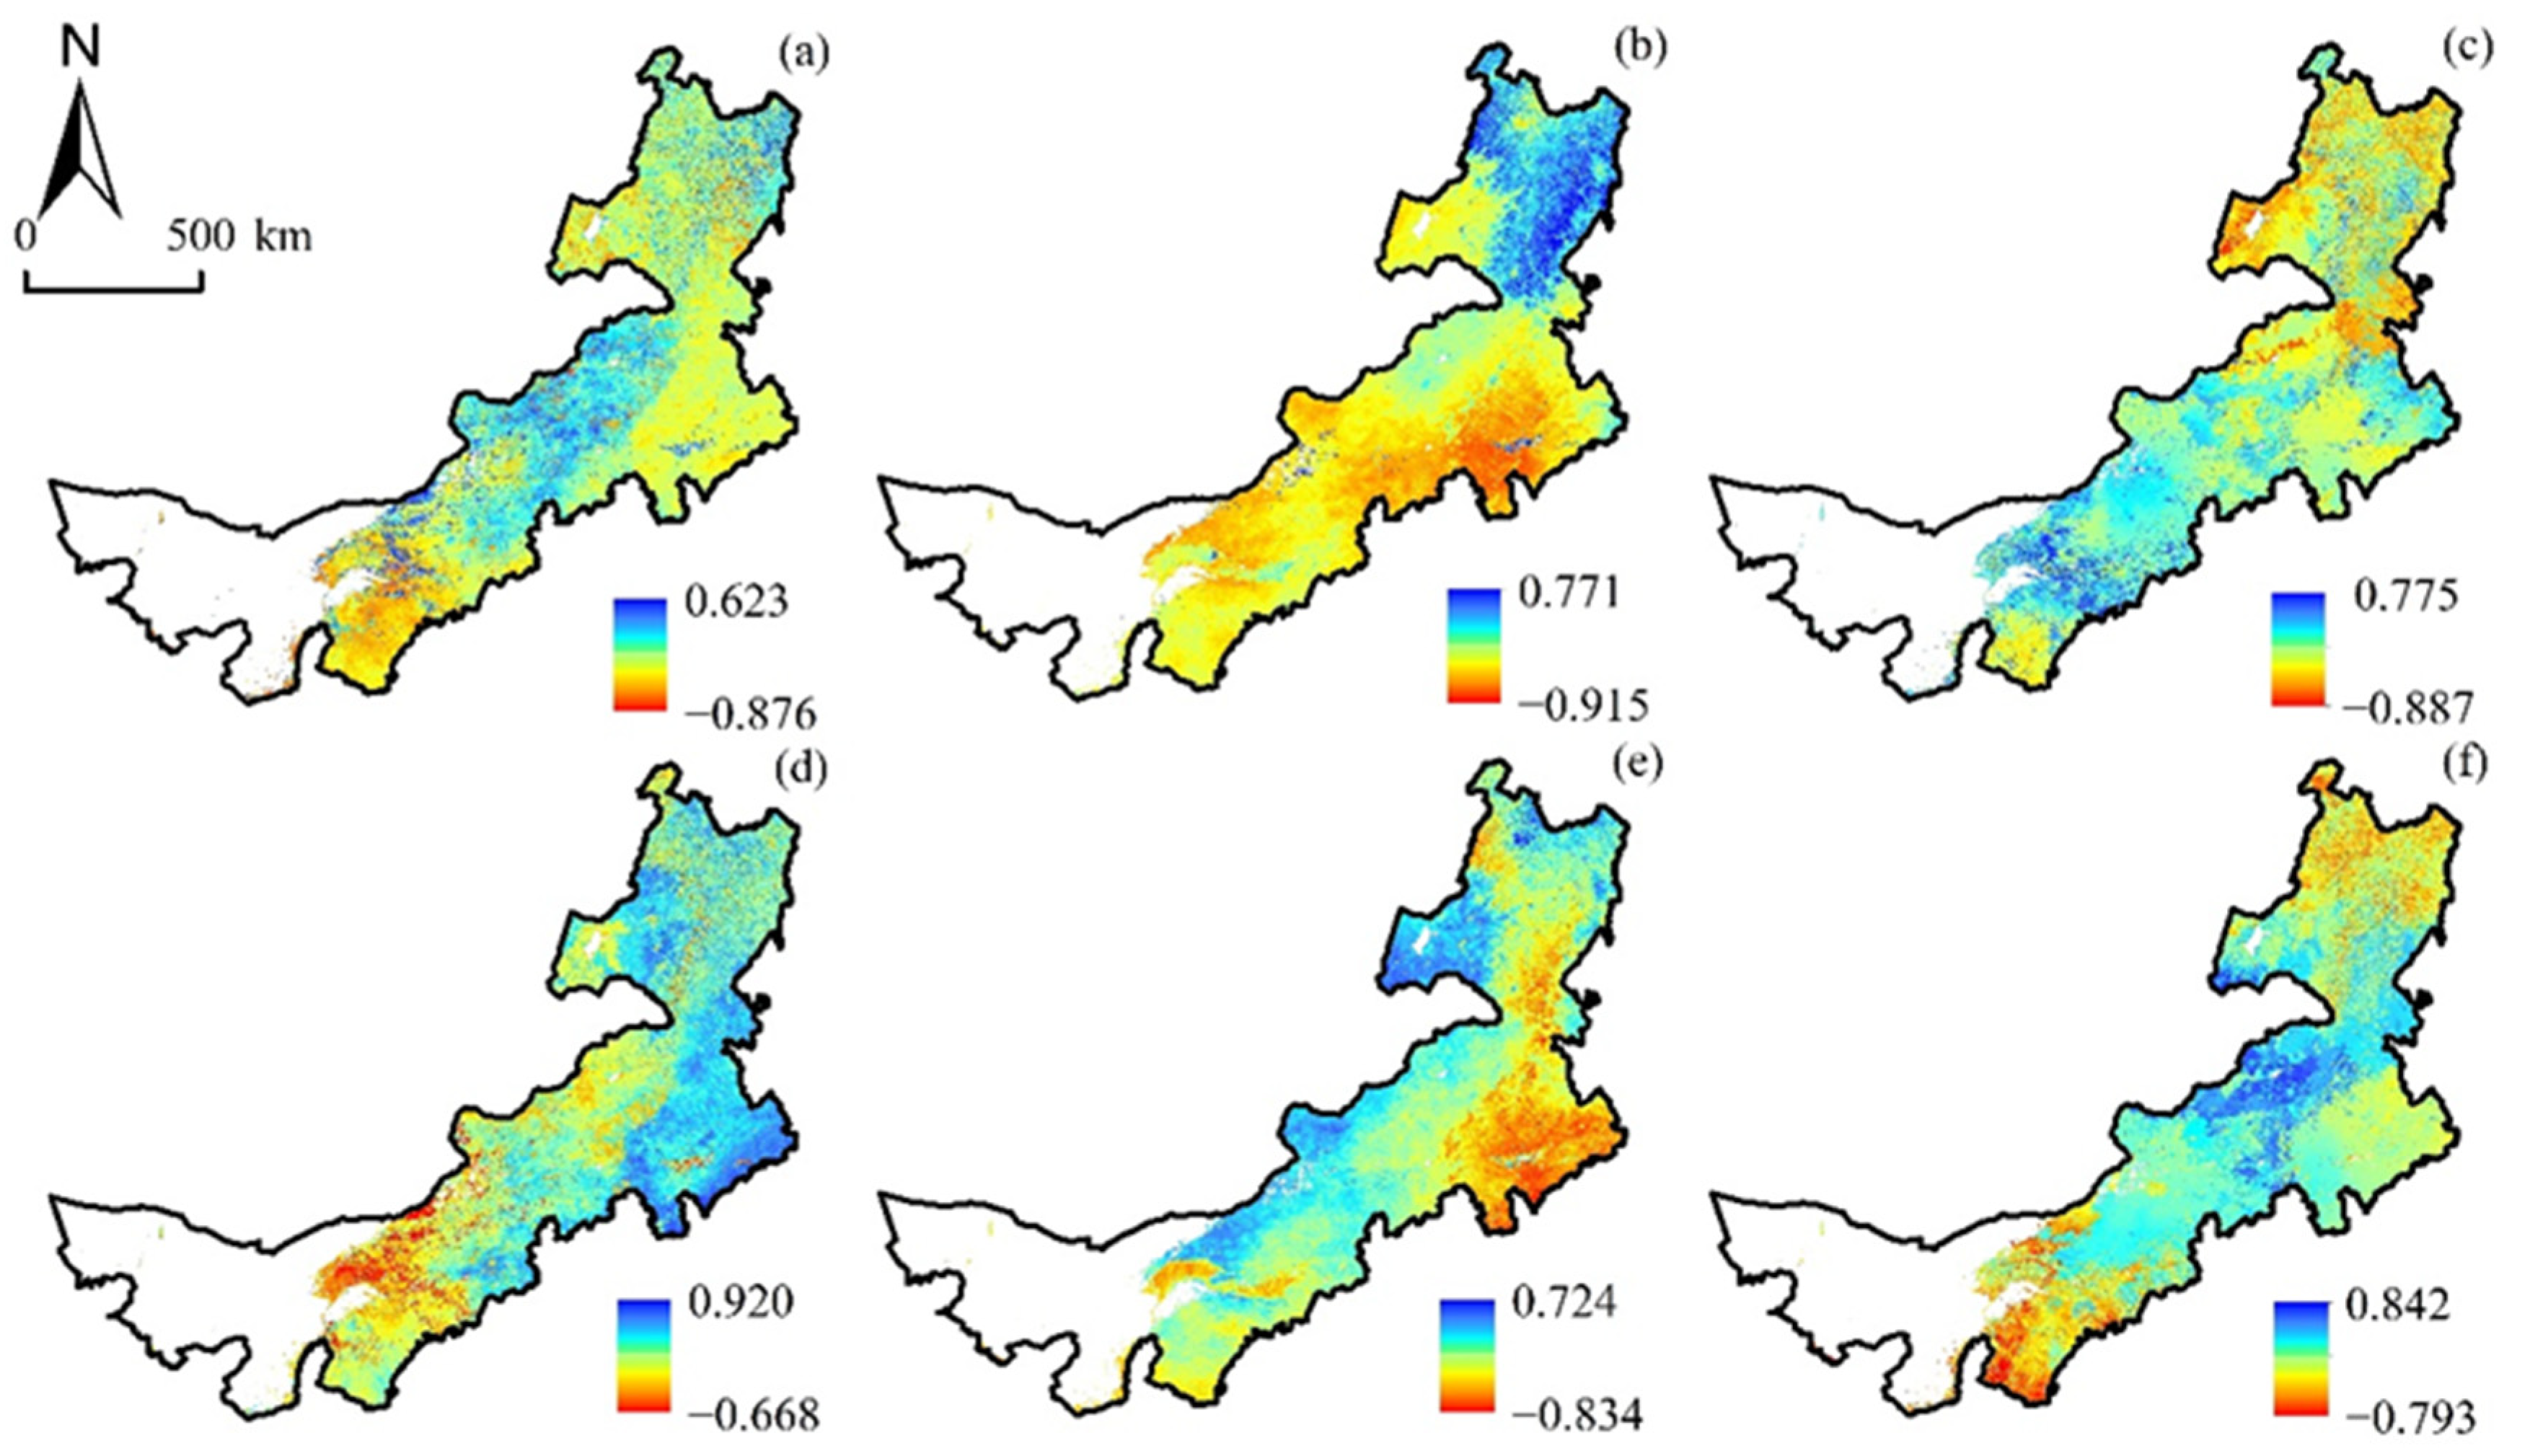
In spring and autumn in Inner Mongolia, temperature and precipitation were mostly negatively connected in places with relatively high elevations, and in spring, eWUE was positively correlated with temperature in 95.096% of the area. Summer had the strongest vegetation WUE–temperature–precipitation negative correlation.
(4)
Except for DBF and SA in summer, the vegetation types’ eWUE was negatively correlated with precipitation in other seasons. Except for grassland, the eWUE in summer was greater than that in spring and autumn among other vegetation types, and the correlation between eWUE and precipitation in summer grassland was the lowest.

Author Contributions

Methodology, W.L.; Software, H.Y.; Writing—Original Draft, S.W., W.W. and S.Z.; Writing—Review and Editing, Y.W. All authors have read and agreed to the published version of the manuscript.

Funding

This research was funded by the Special Research Project of the China Institute of Water Resources and Hydropower Research (MK2020J11); Inner Mongolia Applied Technology Research and Development fund project (2021GG0020, 2021GG0050); Inner Mongolia Autonomous Region Key Research and Development and Achievement Transformation plan project (2022YFHH0100); Yinshanbeilu Grassland Eco-Hydrology National Observation and Research Station, and China Institute of Water Resources and Hydropower Research, Beijing 100038, China (grant no YSS202114). The central government guide local funding projects for scientific and technological development (2021ZY0027); Inner Mongolia Autonomous Region “Science and technology to Revitalize Mongolia” action key special project (2022EEDSKJXM004); The IWHR Research & Development Support Program (MK0145B022021) and the IWHR Internationally-oriented Talents Program.

Informed Consent Statement

Not applicable.

Data Availability Statement

Not applicable.

Acknowledgments

The authors are grateful to the editors and the anonymous reviewers for their insightful comments and helpful suggestions.

Conflicts of Interest

The authors declare no conflict of interest.

References

  1. Leemans, R.; Eickhout, B. Another reason for concern: Regional and global impacts on ecosystems for different levels of climate change. Glob. Environ. Chang. 2004, 14, 219–228. [Google Scholar] [CrossRef]
  2. Huang, M.; Piao, S.; Sun, Y.; Ciais, P.; Cheng, L.; Mao, J.; Poulter, B.; Shi, X.; Zeng, Z.; Wang, Y. Change in terrestrial ecosystem water-use efficiency over the last three decades. Glob. Chang. Biol. 2015, 21, 2366–2378. [Google Scholar] [CrossRef] [PubMed]
  3. Gang, C.; Wang, Z.; Chen, Y.; Yang, Y.; Li, J.; Cheng, J.; Qi, J.; Odeh, I. Drought-induced dynamics of carbon and water use efficiency of global grasslands from 2000 to 2011. Ecol. Indic. 2016, 67, 788–797. [Google Scholar] [CrossRef]
  4. Klein, T.; Zeppel, M.J.B.; Anderegg, W.R.L.; Bloemen, J.; De Kauwe, M.G.; Hudson, P.; Ruehr, N.K.; Powell, T.L.; von Arx, G.; Nardini, A. Xylem embolism refilling and resilience against drought-induced mortality in woody plants: Processes and trade-offs. Ecol. Res. 2018, 33, 839–855. [Google Scholar] [CrossRef]
  5. Beer, C.; Ciais, P.; Reichstein, M.; Baldocchi, D.; Law, B.E.; Papale, D.; Soussana, J.F.; Ammann, C.; Buchmann, N.; Frank, D. Temporal and among-site variability of inherent water use efficiency at the ecosystem level. Glob. Biogeochem. Cycles 2009, 23. [Google Scholar] [CrossRef] [Green Version]
  6. Emmerich, W.E. Ecosystem water use efficiency in a semiarid shrubland and grassland community. Rangel. Ecol. Manag. 2007, 60, 464–470. [Google Scholar] [CrossRef]
  7. Niu, S.; Wu, M.; Han, Y.; Xia, J.; Li, L.; Wan, S. Water-mediated responses of ecosystem carbon fluxes to climatic change in a temperate steppe. New Phytol. 2008, 177, 209–219. [Google Scholar] [CrossRef]
  8. Wang, T.; Tang, X.; Zheng, C.; Gu, Q.; Wei, J.; Ma, M. Differences in ecosystem water-use efficiency among the typical croplands. Agric. Water Manag. 2018, 209, 142–150. [Google Scholar] [CrossRef]
  9. Wang, M.; Ding, Z.; Wu, C.; Song, L.; Ma, M.; Yu, P.; Lu, B.; Tang, X. Divergent responses of ecosystem water-use efficiency to extreme seasonal droughts in Southwest China. Sci. Total Environ. 2021, 760, 143427. [Google Scholar] [CrossRef]
  10. Guo, L.; Sun, F.; Liu, W.; Zhang, Y.; Wang, H.; Cui, H.; Wang, H.; Zhang, J.; Du, B. Response of Ecosystem Water Use Efficiency to Drought over China during 1982–2015: Spatiotemporal Variability and Resilience. Forests 2019, 10, 598. [Google Scholar] [CrossRef]
  11. Xu, H.-J.; Wang, X.-P.; Zhao, C.-Y.; Zhang, X.-X. Responses of ecosystem water use efficiency to meteorological drought under different biomes and drought magnitudes in northern China. Agric. For. Meteorol. 2019, 278, 107660. [Google Scholar] [CrossRef]
  12. Liu, D.; Yu, C.; Zhao, F. Response of the water use efficiency of natural vegetation to drought in Northeast China. J. Geogr. Sci. 2018, 28, 611–628. [Google Scholar] [CrossRef] [Green Version]
  13. Zhu, X.-J.; Yu, G.-R.; Wang, Q.-F.; Hu, Z.-M.; Zheng, H.; Li, S.-G.; Sun, X.-M.; Zhang, Y.-P.; Yan, J.-H.; Wang, H.-M. Spatial variability of water use efficiency in China’s terrestrial ecosystems. Glob. Planet. Chang. 2015, 129, 37–44. [Google Scholar] [CrossRef]
  14. Zhang, Q.A.; Chen, W. Ecosystem water use efficiency in the Three-North Region of China based on long-term satellite data. Sustainability 2021, 13, 7977. [Google Scholar] [CrossRef]
  15. Nie, C.; Huang, Y.; Zhang, S.; Yang, Y.; Zhou, S.; Lin, C.; Wang, G. Effects of soil water content on forest ecosystem water use efficiency through changes in transpiration/evapotranspiration ratio. Agric. For. Meteorol. 2021, 308, 108605. [Google Scholar] [CrossRef]
  16. Yang, X.; Asseng, S.; Wong, M.T.F.; Yu, Q.; Li, J.; Liu, E. Quantifying the interactive impacts of global dimming and warming on wheat yield and water use in China. Agric. For. Meteorol. 2013, 182, 342–351. [Google Scholar] [CrossRef]
  17. Ryan, A.C.; Dodd, I.C.; Rothwell, S.A.; Jones, R.; Tardieu, F.; Draye, X.; Davies, W.J. Gravimetric phenotyping of whole plant transpiration responses to atmospheric vapour pressure deficit identifies genotypic variation in water use efficiency. Plant Sci. 2016, 251, 101–109. [Google Scholar] [CrossRef] [Green Version]
  18. Huang, G.; Li, Y.; Mu, X.; Zhao, H.; Cao, Y. Water-use efficiency in response to simulated increasing precipitation in a temperate desert ecosystem of Xinjiang, China. J. Arid Land 2017, 9, 823–836. [Google Scholar] [CrossRef] [Green Version]
  19. Xue, B.-L.; Guo, Q.; Otto, A.; Xiao, J.; Tao, S.; Li, L. Global patterns, trends, and drivers of water use efficiency from 2000 to 2013. Ecosphere 2015, 6, art174. [Google Scholar] [CrossRef]
  20. Gao, Y.; Zhu, X.; Yu, G.; He, N.; Wang, Q.; Tian, J. Water use efficiency threshold for terrestrial ecosystem carbon sequestration in China under afforestation. Agric. For. Meteorol. 2014, 195, 32–37. [Google Scholar] [CrossRef]
  21. Wu, Y.; Wang, W.; Li, W.; Zhao, S.; Wang, S.; Liu, T. Assessment of the spatiotemporal characteristics of vegetation water use efficiency in response to drought in Inner Mongolia, China. Environ. Sci. Pollut. Res. 2022, 1–13. [Google Scholar] [CrossRef] [PubMed]
  22. Xie, G.; Liu, J.; Xu, J.; Xiao, Y.; Zhen, L.; Zhang, C.; Wang, Y.; Qin, K.; Gan, S.; Jiang, Y. A spatio-temporal delineation of trans-boundary ecosystem service flows from Inner Mongolia. Environ. Res. Lett. 2019, 14, 065002. [Google Scholar] [CrossRef]
  23. Wang, S.; Li, R.; Wu, Y.; Zhao, S. Effects of multi-temporal scale drought on vegetation dynamics in Inner Mongolia from 1982 to 2015, China. Ecol. Indic. 2022, 136, 108666. [Google Scholar] [CrossRef]
  24. Guo, D.; Song, X.; Hu, R.; Cai, S.; Zhu, X.; Hao, Y. Grassland type-dependent spatiotemporal characteristics of productivity in Inner Mongolia and its response to climate factors. Sci. Total Environ. 2021, 775, 145644. [Google Scholar] [CrossRef]
  25. Khan, M.S.; Liaqat, U.W.; Baik, J.; Choi, M. Stand-alone uncertainty characterization of GLEAM, GLDAS and MOD16 evapotranspiration products using an extended triple collocation approach. Agric. For. Meteorol. 2018, 252, 256–268. [Google Scholar] [CrossRef]
  26. Wang, S.; Li, R.; Wu, Y.; Zhao, S. Vegetation dynamics and their response to hydrothermal conditions in Inner Mongolia, China. Glob. Ecol. Conserv. 2022, 34, e02034. [Google Scholar] [CrossRef]
  27. Tang, R.; Shao, K.; Li, Z.-L.; Wu, H.; Tang, B.-H.; Zhou, G.; Zhang, L. Multiscale validation of the 8-day MOD16 evapotranspiration product using flux data collected in China. IEEE J. Sel. Top. Appl. Earth Obs. Remote Sens. 2015, 8, 1478–1486. [Google Scholar] [CrossRef]
  28. Tang, X.; Zhou, Y.; Li, H.; Yao, L.; Ding, Z.; Ma, M.; Yu, P. Remotely monitoring ecosystem respiration from various grasslands along a large-scale east–west transect across northern China. Carbon Balance Manag. 2020, 15, 6. [Google Scholar] [CrossRef] [Green Version]
  29. Tang, X.; Li, H.; Desai, A.R.; Nagy, Z.; Luo, J.; Kolb, T.E.; Olioso, A.; Xu, X.; Yao, L.; Kutsch, W. How is water-use efficiency of terrestrial ecosystems distributed and changing on Earth? Sci. Rep. 2014, 4, 7483. [Google Scholar] [CrossRef] [Green Version]
  30. Zhang, T.; Peng, J.; Liang, W.; Yang, Y.; Liu, Y. Spatial–temporal patterns of water use efficiency and climate controls in China’s Loess Plateau during 2000–2010. Sci. Total Environ. 2016, 565, 105–122. [Google Scholar] [CrossRef]
  31. Chuai, X.W.; Huang, X.J.; Wang, W.J.; Bao, G. NDVI, temperature and precipitation changes and their relationships with different vegetation types during 1998–2007 in Inner Mongolia, China. Int. J. Climatol. 2013, 33, 1696–1706. [Google Scholar] [CrossRef]
  32. Pei, Z.; Fang, S.; Yang, W.; Wang, L.; Wu, M.; Zhang, Q.; Han, W.; Khoi, D.N. The Relationship between NDVI and Climate Factors at Different Monthly Time Scales: A Case Study of Grasslands in Inner Mongolia, China (1982–2015). Sustainability 2019, 11, 7243. [Google Scholar] [CrossRef] [Green Version]
  33. Luo, H.; Bie, X.; Yi, G.; Zhou, X.; Zhang, T.; Li, J.; Lai, P. Dominant Impacting Factors on Water-Use Efficiency Variation in Inner Mongolia from 2001 to 2018: Vegetation or Climate? Remote Sens. 2022, 14, 4541. [Google Scholar] [CrossRef]
  34. Li, Y.; Shi, H.; Zhou, L.; Eamus, D.; Huete, A.; Li, L.; Cleverly, J.; Hu, Z.; Harahap, M.; Yu, Q. Disentangling climate and LAI effects on seasonal variability in water use efficiency across terrestrial ecosystems in China. J. Geophys. Res. Biogeosci. 2018, 123, 2429–2443. [Google Scholar] [CrossRef] [Green Version]
  35. Yang, Y.; Guan, H.; Batelaan, O.; McVicar, T.R.; Long, D.; Piao, S.; Liang, W.; Liu, B.; Jin, Z.; Simmons, C.T. Contrasting responses of water use efficiency to drought across global terrestrial ecosystems. Sci. Rep. 2016, 6, 23284. [Google Scholar] [CrossRef] [PubMed] [Green Version]
  36. Jiang, Y.; Still, C.J.; Rastogi, B.; Page, G.F.M.; Wharton, S.; Meinzer, F.C.; Voelker, S.; Kim, J.B. Trends and controls on water-use efficiency of an old-growth coniferous forest in the Pacific Northwest. Environ. Res. Lett. 2019, 14, 074029. [Google Scholar] [CrossRef] [Green Version]
  37. Cai, W.; Ullah, S.; Yan, L.; Lin, Y. Remote Sensing of Ecosystem Water Use Efficiency: A Review of Direct and Indirect Estimation Methods. Remote Sens. 2021, 13, 2393. [Google Scholar] [CrossRef]
  38. Costa, G.B.; Santos e Silva, C.M.; Mendes, K.R.; dos Santos, J.G.M.; Neves, T.T.A.T.; Silva, A.S.; Rodrigues, T.R.; Silva, J.B.; Dalmagro, H.J.; Mutti, P.R. WUE and CO2 Estimations by Eddy Covariance and Remote Sensing in Different Tropical Biomes. Remote Sens. 2022, 14, 3241. [Google Scholar] [CrossRef]
  39. Ahmadi, B.; Ahmadalipour, A.; Tootle, G.; Moradkhani, H. Remote Sensing of Water Use Efficiency and Terrestrial Drought Recovery across the Contiguous United States. Remote Sens. 2019, 11, 731. [Google Scholar] [CrossRef] [Green Version]
  40. Zhang, Y.; Song, C.; Sun, G.; Band, L.E.; McNulty, S.; Noormets, A.; Zhang, Q.; Zhang, Z. Development of a coupled carbon and water model for estimating global gross primary productivity and evapotranspiration based on eddy flux and remote sensing data. Agric. For. Meteorol. 2016, 223, 116–131. [Google Scholar] [CrossRef]
  41. Zhao, J.; Xu, T.; Xiao, J.; Liu, S.; Mao, K.; Song, L.; Yao, Y.; He, X.; Feng, H. Responses of water use efficiency to drought in southwest China. Remote Sens. 2020, 12, 199. [Google Scholar] [CrossRef] [Green Version]
  42. Grossiord, C.; Sevanto, S.; Adams, H.D.; Collins, A.D.; Dickman, L.T.; McBranch, N.; Michaletz, S.T.; Stockton, E.A.; Vigil, M.; McDowell, N.G. Precipitation, not air temperature, drives functional responses of trees in semi-arid ecosystems. J. Ecol. 2017, 105, 163–175. [Google Scholar] [CrossRef]
  43. Zhang, B.; Tan, X.; Wang, S.; Chen, M.; Chen, S.; Ren, T.; Xia, J.; Bai, Y.; Huang, J.; Han, X. Asymmetric sensitivity of ecosystem carbon and water processes in response to precipitation change in a semi-arid steppe. Funct. Ecol. 2017, 31, 1301–1311. [Google Scholar] [CrossRef] [Green Version]
  44. Sun, H.; Bai, Y.; Lu, M.; Wang, J.; Tuo, Y.; Yan, D.; Zhang, W. Drivers of the water use efficiency changes in China during 1982–2015. Sci. Total Environ. 2021, 799, 149145. [Google Scholar] [CrossRef] [PubMed]
  45. Joiner, J.; Yoshida, Y.; Anderson, M.; Holmes, T.; Hain, C.; Reichle, R.; Koster, R.; Middleton, E.; Zeng, F.-W. Global relationships among traditional reflectance vegetation indices (NDVI and NDII), evapotranspiration (ET), and soil moisture variability on weekly timescales. Remote Sens. Environ. 2018, 219, 339–352. [Google Scholar] [CrossRef] [PubMed] [Green Version]
  46. Lu, Q.; Zhao, D.; Wu, S.; Dai, E.; Gao, J. Using the NDVI to analyze trends and stability of grassland vegetation cover in Inner Mongolia. Theor. Appl. Climatol. 2018, 135, 1629–1640. [Google Scholar] [CrossRef]
  47. Gu, C.; Tang, Q.; Zhu, G.; Ma, J.; Gu, C.; Zhang, K.; Sun, S.; Yu, Q.; Niu, S. Discrepant responses between evapotranspiration-and transpiration-based ecosystem water use efficiency to interannual precipitation fluctuations. Agric. For. Meteorol. 2021, 303, 108385. [Google Scholar] [CrossRef]
  48. Kwon, H.; Law, B.E.; Thomas, C.K.; Johnson, B.G. The influence of hydrological variability on inherent water use efficiency in forests of contrasting composition, age, and precipitation regimes in the Pacific Northwest. Agric. For. Meteorol. 2018, 249, 488–500. [Google Scholar] [CrossRef]
  49. Han, J.; Chen, J.; Shi, W.; Song, J.; Hui, D.; Ru, J.; Wan, S. Asymmetric responses of resource use efficiency to previous-year precipitation in a semi-arid grassland. Funct. Ecol. 2021, 35, 807–814. [Google Scholar] [CrossRef]
  50. Song, B.; Niu, S.; Wan, S. Precipitation regulates plant gas exchange and its long-term response to climate change in a temperate grassland. J. Plant Ecol. 2016, 9, 531–541. [Google Scholar] [CrossRef]
  51. Li, G.; Chen, W.; Li, R.; Zhang, X.; Liu, J. Assessing the spatiotemporal dynamics of ecosystem water use efficiency across China and the response to natural and human activities. Ecol. Indic. 2021, 126, 107680. [Google Scholar] [CrossRef]
  52. Zhang, L.; Xiao, J.; Zheng, Y.; Li, S.; Zhou, Y. Increased carbon uptake and water use efficiency in global semi-arid ecosystems. Environ. Res. Lett. 2020, 15, 034022. [Google Scholar] [CrossRef]
  53. Gouveia, A.C.; Freitas, H. Modulation of leaf attributes and water use efficiency in Quercus suber along a rainfall gradient. Trees 2009, 23, 267–275. [Google Scholar] [CrossRef]
  54. Belmecheri, S.; Maxwell, R.S.; Taylor, A.H.; Davis, K.J.; Guerrieri, R.; Moore, D.J.P.; Rayback, S.A. Precipitation alters the CO2 effect on water-use efficiency of temperate forests. Glob. Chang. Biol. 2021, 27, 1560–1571. [Google Scholar] [CrossRef]
  55. Hou, Q.; Pei, T.; Yu, X.; Chen, Y.; Ji, Z.; Xie, B. The seasonal response of vegetation water use efficiency to temperature and precipitation in the Loess Plateau, China. Glob. Ecol. Conserv. 2022, 33, e01984. [Google Scholar] [CrossRef]
  56. Hatfield, J.L.; Dold, C. Water-use efficiency: Advances and challenges in a changing climate. Front. Plant Sci. 2019, 10, 103. [Google Scholar] [CrossRef] [Green Version]
  57. Zhang, B.; Liu, W.; Chang, S.X.; Anyia, A.O. Water-deficit and high temperature affected water use efficiency and arabinoxylan concentration in spring wheat. J. Cereal Sci. 2010, 52, 263–269. [Google Scholar] [CrossRef]
  58. Yepez, E.A.; Scott, R.L.; Cable, W.L.; Williams, D.G. Intraseasonal variation in water and carbon dioxide flux components in a semiarid riparian woodland. Ecosystems 2007, 10, 1100–1115. [Google Scholar] [CrossRef]
  59. Conaty, W.C.; Mahan, J.R.; Neilsen, J.E.; Tan, D.K.Y.; Yeates, S.J.; Sutton, B.G. The relationship between cotton canopy temperature and yield, fibre quality and water-use efficiency. Field Crops Res. 2015, 183, 329–341. [Google Scholar] [CrossRef]
  60. Tan, Z.H.; Zhang, Y.P.; Deng, X.B.; Song, Q.H.; Liu, W.J.; Deng, Y.; Tang, J.W.; Liao, Z.Y.; Zhao, J.F.; Song, L. Interannual and seasonal variability of water use efficiency in a tropical rainforest: Results from a 9 year eddy flux time series. J. Geophys. Res. Atmos. 2015, 120, 464–479. [Google Scholar] [CrossRef]
  61. Jiang, S.; Liang, C.; Cui, N.; Zhao, L.; Liu, C.; Feng, Y.; Hu, X.; Gong, D.; Zou, Q. Water use efficiency and its drivers in four typical agroecosystems based on flux tower measurements. Agric. For. Meteorol. 2020, 295, 108200. [Google Scholar] [CrossRef]
  62. Liu, X.; Hu, B.; Ren, Z. Spatiotemporal variation of water use efficiency and its driving forces on the loess plateau during 2000–2014. Sci. Agric. Sin. 2018, 51, 302–314. [Google Scholar]
  63. Lu, S.; Tian, F. Spatiotemporal variations of agricultural water use efficiency and its response to the Grain to Green Program during 1982–2015 in the Chinese Loess Plateau. Phys. Chem. Earth Parts A/B/C 2021, 121, 102975. [Google Scholar] [CrossRef]
  64. Tang, X.; Xiao, J.; Ma, M.; Yang, H.; Li, X.; Ding, Z.; Yu, P.; Zhang, Y.; Wu, C.; Huang, J.; et al. Satellite evidence for China’s leading role in restoring vegetation productivity over global karst ecosystems. For. Ecol. Manag. 2022, 507, 120000. [Google Scholar] [CrossRef]
Figure 1. The geographical distribution of the study area. (a) Digital elevation model, (b) vegetation types.
Atmosphere 13 02085 g001
Figure 2. Spatial distribution of precipitation and temperature in different seasons. in Inner Mongolia. (ac) Precipitation (Pre) for spring, summer and autumn, (df) temperature (Tmp) for spring, summer and autumn.
Atmosphere 13 02085 g002
Figure 3. Flowchart of the study. Pre: Precipitation; Tmp: Temperature.
Atmosphere 13 02085 g003
Figure 4. Seasonal temporal variation characteristics of gross primary productivity (GPP), evapotranspiration (ET) and eWUE in Inner Mongolia. (ac) GPP for spring, summer and autumn, (df) ET for spring, summer and autumn, (gi) eWUE for spring, summer and autumn.
Atmosphere 13 02085 g004
Figure 5. Distribution characteristics of the multi-year mean values of ET and GPP in Inner Mongolia. (ac) GPP for spring, summer and autumn, (df) ET for spring, summer and autumn.
Atmosphere 13 02085 g005
Figure 6. Characteristics of the distribution, as well as the general trend of change, of the yearly mean value of eWUE. (ac) Average eWUE for spring, summer and autumn; (df) spring, summer and autumn eWUE trends; (gi) spring, summer and autumn eWUE significance.
Atmosphere 13 02085 g006
Figure 7. eWUE statistics for different vegetation types in spring, summer and autumn in Inner Mongolia.
Atmosphere 13 02085 g007
Figure 8. Correlation distribution map of eWUE with precipitation and temperature in different seasons. (ac) Correlation between eWUE and precipitation for spring, summer and autumn; (df) correlation between eWUE and temperature for spring, summer and autumn.
Atmosphere 13 02085 g008
Figure 9. Significance distribution map of eWUE with rainfall and temperature in different seasons. (ac) Significance distribution of eWUE and precipitation in spring, summer and autumn; (df) significance distribution of eWUE with temperature in spring, summer and autumn.
Atmosphere 13 02085 g009
Figure 10. Correlation analysis between seasonal eWUE and climatic factors of different vegetation types. (a) Results of correlation analysis between seasonal eWUE and precipitation; (b) results of correlation analysis between seasonal eWUE and temperature.
Atmosphere 13 02085 g010
Publisher’s Note: MDPI stays neutral with regard to jurisdictional claims in published maps and institutional affiliations.

