Article

Spatio-Temporal Changes and Contribution of Human and Meteorological Factors to Grassland Net Primary Productivity in the Three-Rivers Headwater Region from 2000 to 2019

1
Qingdao Institute of Humanities and Social Sciences, Shandong University, Qingdao 266237, China
2
School of Life Sciences, Shandong University, Qingdao 266237, China
3
Center for Yellow River Ecosystem Products, Shandong University, Qingdao 266237, China
4
School of Environmental Science and Engineering, Shandong University, Qingdao 266237, China
*
Author to whom correspondence should be addressed.
Atmosphere 2023, 14(2), 278; https://doi.org/10.3390/atmos14020278
Submission received: 20 December 2022 / Revised: 15 January 2023 / Accepted: 25 January 2023 / Published: 30 January 2023
(This article belongs to the Special Issue Impact of Land-Use and Climate Change on Vegetation)

Abstract

:
Since the beginning of the 21st century, the net primary productivity (NPP) of grassland in the Three-Rivers Headwaters (TRH) region has changed significantly. In this study, NPP was assessed by the Carnegie-Ames-Stanford approach (CASA) model in TRH from 2000 to 2019. The abrupt changes of NPP and meteorological factors were analyzed by cumulative departure, MK test, and Pettitt test. The contributions of meteorological and human factors to changes in grassland NPP were quantitatively assessed using the scenario simulation method. The obtained results showed that: (1) From 2000 to 2019, the NPP of grasslands increased from 135.72 to 141.16 gC/m−2a−1. However, the overall growth trend was not significant, and the proportion of significant growth was only 31.45%; (2) An abrupt increase in meteorological factors occurred around 2005, while an abrupt increase in NPP occurred around 2008, which showed that 2008 was the year when human factors, such as ecological projects and policies, began to show a significant impact on the growth of NPP; and (3) The contribution of human factors to the abrupt increase in NPP was significantly greater than the contribution of meteorological factors. The contribution of human factors exceeded 70% in 93.68% of the studied area, reaching 98% in general, while the contribution of meteorological factors was less than 2%. Among them, the human contributions to the Yangtze River Source, the Yellow River Source, and the Lancang River Source all exceeded 95%. The negative effects of meteorological factors on the growth of NPP in the abovementioned three regions were as high as 47.35%, 48.66%, and 36.91%, respectively. Human factors have contributed greatly to the increase in NPP in most of the source areas of the Yellow River, the eastern part of Tanggulashan County, the southeastern part of Zhiduo County, and the western part of Zaduo County at the source of the Yangtze River.

1. Introduction

The Three-Rivers Headwaters (TRH) region is located in the hinterland of the Qinghai-Tibet Plateau and is a typical fragile ecosystem and a key area for the conservation of biodiversity and the development of an ecological environment in China. At the same time, it is important to guarantee the maintenance of regional ecological security. The TRH has original natural vegetation, soils rich in organic matter, and exceptional water conservation ability, which is why this area is known as the “China Water Tower” [1,2,3]. Due to the impact of global climate change, the TRH has experienced significant warming in recent decades, which is significantly higher than the surrounding areas and the level of global increase [4,5,6,7,8], and is likely to warm further [9,10]. Thus, under the warming scenario, vegetation growth should increase significantly. However, numerous observations and studies have proven that the ecological environment of the TRH has deteriorated, such as increasing degradation and desertification of grassland, serious soil erosion, drying up of rivers, and shrinking lakes. This seriously compromised the sustainable development of the ecological environment and animal husbandry in the region and posed a serious threat to the ecological security of related areas [11,12,13,14,15]. Considering the degradation of grasslands in the TRH, the TRH Nature Reserve was established in 2000 and promoted to a national nature reserve in 2003. The ecological protection and construction project of the TRH Nature Reserve in 2005 was approved in order to carry out ecological restoration and management. This area became the first pilot national park in China in 2016. Ecological engineering included many measures, such as turning grazing land into grassland, turning reclaimed grassland into grassland, developing facilities for soil and water conservation and protection, and capacity building in order to curb the trend of grassland ecological degradation [16,17,18,19].
NPP of vegetation is the amount of organic matter accumulated by vegetation in a unit area, which is the residue of the total primary production assimilated by plant photosynthesis minus plant autotrophic respiration. It is the material and energy basis of the terrestrial life system and the basis for the formation and maintenance of other ecosystem services [20,21,22,23]. One important characteristic of vegetation degradation is the decline of vegetation NPP. This can also be used to evaluate the sustainable development of terrestrial ecosystems and as an index sensitive to climate change and human activities. It has become an ecological indicator for measuring the impact of land cover changes and management measures [24,25]. Since the beginning of the 21st century, the utilization of remote sensing technology has shifted the perspective of human understanding of vegetation degradation from local to regional quantitative assessment. In recent years, many scholars have used NPP obtained from remote sensing data as an index for the monitoring of grassland ecosystem health and its degradation and to study the driving forces of degradation at larger spatial and temporal scales [26,27,28].
As a typical region where significant grassland degradation occurred, the TRH has been a hot spot for monitoring grassland degradation and restoration in recent decades. How has vegetation growth changed under the combined influence of climate change and human activities in TRH? What are the impacts of human activities and climate change on vegetation growth? How to evaluate the real impact of ecological restoration policies and projects on grassland restoration in the TRH? These are questions that need to be answered. For the TRH region, some studies have analyzed the dynamics and driving forces of grassland productivity. However, alpine vegetation had a large spatial heterogeneity and was under a complex and comprehensive impact of climate change, which led to greater uncertainty in determining the impact of climate change and human activities [29,30,31,32,33,34,35,36,37]. For example, regarding vegetation change, there are two contrasting findings, i.e., “vegetation continues to degrade” [38,39] and “vegetation shows a slight increase” [40]. In terms of driving mechanisms, the importance of human and climate factors is still the focus of academic debate [18,41], and even the relationship between changes in temperature and precipitation and vegetation growth due to climate-driven processes is still unclear [42,43,44]. In recent years, there has been an increasing number of studies on the response of the NPP of alpine vegetation in the TRH to climate change and human activities. This topic is of great importance for understanding the mechanism of NPP change of alpine vegetation in order to implement ecological protection effectively, promote regional sustainable development, and provide a scientific basis for decision-making in the TRH region. However, existing studies have mainly focused on the mechanisms of climate factors affecting vegetation changes in the TRH, and few studies have been conducted on the relationship between human activities and vegetation change [45,46]. In addition, most of the study periods of these studies are concentrated on the period before the year 2015 for completion of restoration engineering, and a new understanding of grassland vegetation growth since 2015 is lacking.
In view of this, this study applied the Carnegie-Ames-Stanford approach (CASA) model to simulate grassland NPP over a long time period (2000–2019) to reveal its spatial and temporal patterns and trends of significant changes in TRH. At the same time, this study did not analyze the direct correlation of climatic factors with NPP but analyzed the contribution of human factors to abrupt changes in the hydrographic field, grassland NPP and climate factors in order to determine whether human factors had a significant effect on the abrupt changes in NPP growth. Then, the contribution degree of human factors to NPP was assessed from the perspective of abrupt change in grassland NPP rather than from the perspective of overall change in NPP. Overall, an analysis of the impact of anthropogenic factors on NPP was conducted to determine whether human factors had a remarkable impact on the abrupt change in NPP and to provide a theoretical basis and decision reference for ecological projects and policies in TRH.

2. Study Area and Methods

2.1. Study Area

The TRH region is the birthplace of the Yangtze River, the Yellow River, and the Lancang River. It is located between 31°39′–36°12′ N and 89°45′–102°23′ E. Its administrative area includes 16 counties in Yushu, Guoluo, Hainan, and Huangnan Tibetan autonomous prefectures and Tanggulashan County in Golmud City, with a total area of 36.3 × 10⁴ km2 (Figure 1). The TRH supplies about 400 × 108 m3 of water downstream every year. The landforms of the TRH are mainly glacial, periglacial, alpine, highland plain, and hilly landforms, with elevations from 2800 m to 6564 m. Grassland is the main land use type in the region, accounting for about 78% of the area, and mainly consists of alpine meadow grassland (82.6%) and alpine steppe grassland (12.1%). Among these two grassland categories, the steppe grassland is mainly distributed in the western part of the Yangtze River Source and the northern part of the Yellow River Source, while the meadow grassland is distributed in most areas of the TRH.

2.2. Data Sources

2.2.1. Remote Sensing Data

The remote sensing data used in this study were the Normalized Difference Vegetation Index (NDVI) data, which were obtained from the MOD13Q1 vegetation index product in the LPDAAC data set of the United States. The analyzed period is from 2000 to 2019. The spatial resolution was 250 m, and the temporal resolution was 16 days. To eliminate the impacts of atmosphere, shadow, and solar elevation angle on data quality, this study used Maximum Value Composites (MVC) to generate monthly series of NDVI data [44].

2.2.2. Meteorological Data

Daily temperature, precipitation, and solar radiation from 46 standard meteorological stations in the TRH region were obtained from the China Meteorological Data Network (http://cdc.cma.gov.cn, accessed on 1 September 2020) for the 2000–2019 period. Long-term, the TRH meteorological raster data were adjusted using ANUSPLIN interpolation software and resampled with the same pixel size and projection as NDVI. Considering the undulating terrain and sparse distribution of meteorological stations, ANUSPLIN could achieve high accuracy in the TRH region compared to interpolation methods such as the Kringing and inverse distance weighting (IDW) methods [47,48,49]. It has been proven that high interpolation accuracy could be achieved in the TRH [50].

2.2.3. Data on the Type of Vegetation

Data on grassland vegetation types were obtained from the 1:1,000,000 vegetation type map provided by the Qinghai-Tibet Plateau Scientific Data Center (http://data.tpdc.ac.cn, accessed on 1 September 2022). Data on the distribution of vegetation types were obtained by combining field research and remote sensing. The dominant types of grasslands were determined and divided into two categories of meadows and grasslands. The obtained map is the most detailed and accurate map of the distribution of grassland types in the TRH region to date.

2.3. Methodology

2.3.1. NPP Estimation

In this study, the CASA model was used to estimate NPP in the TRH. The CASA model is a process model based on the light use efficiency principle driven by remote sensing, meteorology, vegetation, and soil types. It has been calibrated by more than 1900 measurement stations worldwide [32,51]. The model can estimate the photosynthetically active radiation (PAR) absorbed by vegetation from solar radiation using a vegetation index extracted from remote sensing data. Furthermore, the model can estimate the increase in vegetation dry matter by combining the use efficiency (ε) of vegetation for PAR reaching the surface.
The NPP of vegetation estimated by the CASA model is as follows:
N P P ( x , t ) = P A R x , t × ε x , t
where, PAR(x,t) is the PAR absorbed by pixel x in month t, and ε x ,   t is the actual light utilization rate of pixel x in month t. PAR absorbed by vegetation depends on total solar radiation and the proportion of PAR absorbed by vegetation, and the calculation is as follows:
P A R ( x , t ) = S O L x , t × F P A R x , t × 0.5
where, S O L x , t is the total solar radiation (MJ/m2) of pixel x in month t; constant 0.5 is the proportion of effective solar radiation (400–700 nm) available to vegetation to the total solar radiation; and FPAR is the absorption ratio of vegetation layer to incident PAR. Within a certain range, PAR can be estimated using NDVI obtained from remote sensing images, and the Equation is as follows:
F P A R N D V I ( x , t ) = N D V I x , t N D V I i , m i n N D V I i , m a x N D V I i , m i n × F P A R m a x F P A R m i n + F P A R m i n
where, N D V I i , m i n and N D V I i , m a x are the minimum and maximum NDVI values of different types of vegetation cover, respectively, and N D V I x , t is the NDVI value of pixel x in month t. The values of F P A R m a x and F P A R m i n are independent of the type of vegetation cover and are set as 0.95 and 0.001, respectively.
Light use efficiency (ε) refers to the efficiency of vegetation to convert absorbed PAR into organic carbon, which is mainly affected by temperature and moisture. The Equation is as follows:
ε ( x , t ) = T e 1 x , t × T e 2 x , t × W ε x , t × ε m a x
where, T e 1 x , t and T e 2 x , t are the influences of temperature on the utilization rate of light energy; W ε x , t is the influence of water conditions on the utilization rate of light energy; and ε m a x is the maximum utilization rate of energy under ideal conditions, and their values vary greatly depending on the vegetation type. According to the principle of minimum error, Zhu et al. [52] used measured NPP data in China to simulate the maximum light utilization rate of each vegetation type, and the value of ε m a x used in this study referred to his result [51].

2.3.2. Trend Analysis

The Theil-Sen slope estimation and the MK test are nonparametric estimations and tests that are insensitive to measurement errors and small outliers [53]. Therefore, the Sen-MK trend analysis has been widely used in trend analysis of long-time series datasets [54]. The Sen’s slope of the NPP time series in this study is calculated as follows:
β = Median N P P j N P P i j i , j > i
where, NPPi and NPPj were the NPP values of the ith and jth years in the NPP time series; Median is the median function; and β is the median slope of all data pairs. When β > 0, the time series showed an increasing trend; when β < 0, the time series showed a decreasing trend. The significance of the time series trend was tested with the application of the MK test, and the Equation for calculating the S statistic is as follows:
S = i = 1 w = 1 j = i + 1 w s g n x j x i
where, Xi and Xj are the ith and jth terms of the time series, respectively, and sgn(θ) is the sign function defined as follows:
s g n θ = + 1 , i f   θ > 0 0 , i f   θ = 0 1 , i f   θ < 0
For a time series length of n ≥ 10, the test statistic Z after normalization of S could be calculated as follows:
Z = S 1 V a r S , i f   S > 0 0 , i f   S = 0 S + 1 V a r S , i f   S < 0
V a r S = n n 1 2 n + 5 18
NPP trends are classified into 5 categories according to significance levels |Z| > 1.96 (p < 0.05) and |Z| > 2.58 (p < 0.01) of Sen-MK trend analysis (Table 1).

2.3.3. Analysis of Abrupt Changes

In this study, the cumulative departure, MK test, and Pettitt test were used to analyze the abrupt changes in the time series comprehensively. The cumulative departure, the MK test, and the Pettitt test are all effective methods for recognizing the timing of abrupt changes. The advantages of these methods are as follows. The cumulative anomaly analysis could intuitively estimate the point of abrupt change in time series through the change of cumulative anomaly value [55]. The MK test does not require that the data samples follow a certain distribution, which can avoid the interference of abnormal values [32]. The Pettitt test can test whether there is an abrupt change point in the time series as a non-parametric test method [56].

2.3.4. Contribution Degree Analysis of the Abrupt Change in NPP

This paper referred to the research on the contribution of human and meteorological factors to abrupt changes in runoff in the hydrological field and transposed the frequently used scenario contribution analysis method [57,58,59,60] from the hydrological field to this study in order to calculate the meteorological and human contributions to abrupt changes in NPP. This study sets the years before the abrupt NPP change as the base period and the years after the NPP abrupt change as the change period. Meteorological data in the change period were input into the base period model in order to simulate the NPPsim as a result without the impact of human factors. Based on the obtained values of NPPsim, the contribution of meteorological and human factors to NPP changes were calculated as ΔNC and ΔNH, respectively. Meanwhile, the contribution degrees for NPP changes were calculated as ηC and ηL based on the NPP change (ΔNv) before and after the NPP abrupt change time. The Equations are as follows:
Total amount of NPP change: ΔNv = NpostNpre
NPP change due to human factors: ΔNH = NpostNsim
NPP change due to meteorological factors: ΔNC = NsimNpre
Contribution   degree   of   meteorological   factors :   η C = Δ N C Δ N V × 100 %
Contribution   degree   of   human   factors :   η H = Δ N H Δ N V × 100 %
where Npost is the multi-year average NPP during the change period; Npre is the multi-year average NPP during the base period; Nsim is simulated by inputting meteorological data of the change period into the base period model as a result under the influence of meteorological factors.

3. Results

3.1. Spatio-Temporal Distribution and Variation of Grassland NPP

3.1.1. Spatial Distribution of NPP from 2000 to 2019

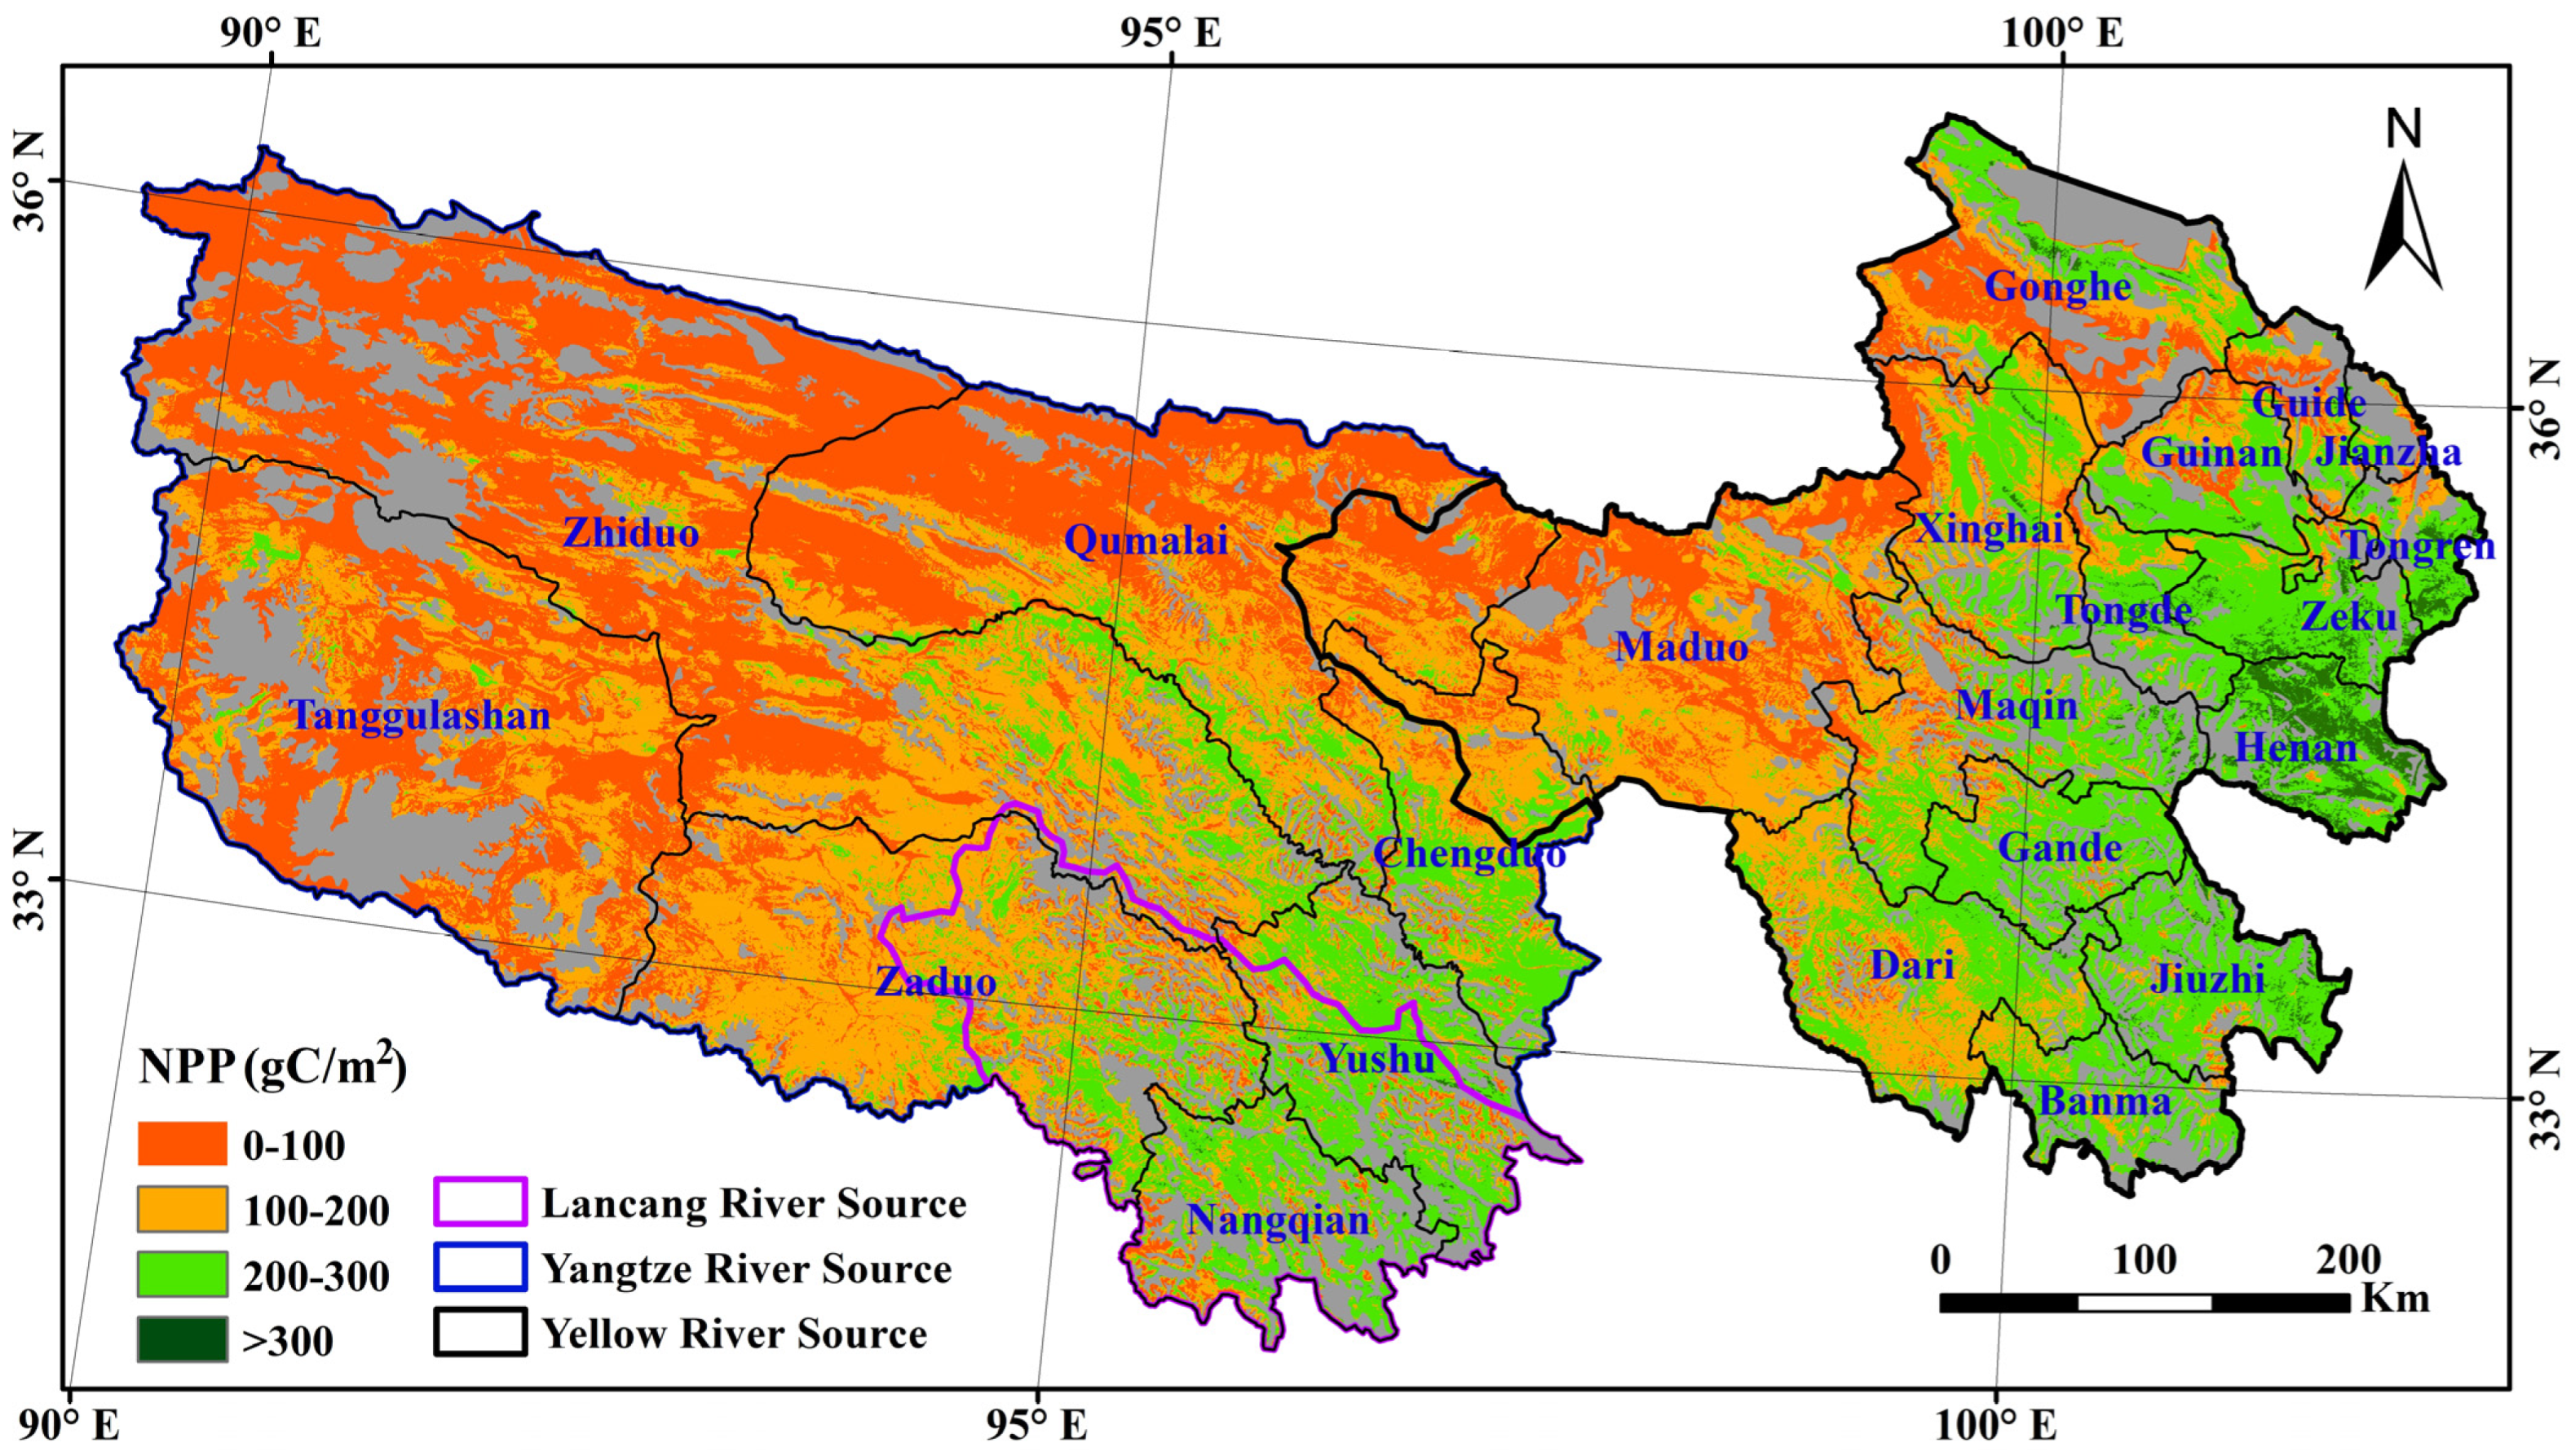
The NPP of the whole TRH was divided into four grades: 0–100, 100–200, 200–300, and >300 gC/m−2a−1. The proportion of NPP of each grade was counted from the overall and sub-regional levels (Table 2). The obtained results showed that the multi-year average NPP value of the TRH region was 142.90 gC/m−2a−1, among which the average NPP of meadow and steppe grasslands was 105.55 and 159.36 gC/m−2a−1, respectively, while the multi-year average NPP of the Lancang River Source and the Yellow River Source was 187.28 gC/m−2a−1 and 180.74 gC/m−2a−1, respectively. These values exceeded the multi-year average NPP of the Yangtze River by 67.94% and 74.02%, respectively. In the entire TRH, the proportion of areas (73.59%) with NPP values above 200 gC/m−2a−1 significantly exceeded the proportion of areas (26.41%) with NPP values below 200 gC/m−2a−1. Among these areas, the proportion of areas (about 36%) with NPP values of 0–100 gC/m−2a−1 almost equaled the proportion of areas with NPP values of 100–200 gC/m−2a−1, followed by 200–300 gC/m−2a−1 and >300 gC/m−2a−1 with 25.04% and 1.57%, respectively. For the two grassland categories, NPP values above 200 gC/m−2a−1 occupied 13.58% of the steppe grassland area and 32.35% of the meadow grassland area, respectively, and NPP with values of 0–100 gC/m−2a−1 had the highest proportion of 58.94% in the steppe grassland, and NPP with values of 100–200 gC/m−2a−1 had the highest proportion of 40.59% in the meadow grassland. In the Yangtze River Source, NPP values above 100 gC/m−2a−1 occupied 47.08% of the area, among which the NPP values above 200 gC/m−2a−1 only occupied 9.97% of the area. On the contrary, the NPP values of 0–100 gC/m−2a−1 had the highest proportion of 52.92%. In the Yellow River Source and the Lancang River Source, the NPP above 200 gC/m−2a−1 occupied 44.4% and 47.79% of the areas, respectively, followed by 35.06% and 39.95% for the NPP values of 100–200 gC/m−2a−1. The proportion of NPP values below 100 gC/m−2a−1 was less than 21% in both areas.
The spatial distribution of NPP at the defined levels (0–100, 100–200, 200–300, and > 300 gC/m−2a−1) was obtained using geospatial technology (Figure 2). The obtained results showed increases in the NPP values from northwest to southeast in the TRH region. In the Yangtze River Source, the areas with NPP values below 100 gC/m−2a−1 were mainly distributed in the west and north of Qumalai, Zaduo, and Zhiduo counties and most areas of Tanggulashan County, while the areas with NPP values above 200 gC/m−2a−1 were mainly distributed in the southeast of Zhiduo and Qumalai counties, and most areas of Zaduo County. In the Yellow River Source, the NPP values were generally higher than 100 gC/m−2a−1, among which the NPP values above 200 gC/m−2a−1 were mainly distributed in the areas of Banma, Dari, Jiuzhi, Gande, Henan, Zeku, Tongren, Jianzha, Xinghai, and Maqin Counties. The NPP values below 200 gC/m−2a−1 were distributed in most areas of Maduo and Gonghe Counties. In the Lancang River Source, the NPP values were generally higher than 200 gC/m−2a−1, especially in Nangqian and Yushu Counties, while the NPP values below 200 gC/m−2a−1 were distributed only in the central part of Zaduo County.

3.1.2. Spatial Distribution of NPP Changes from 2000 to 2019

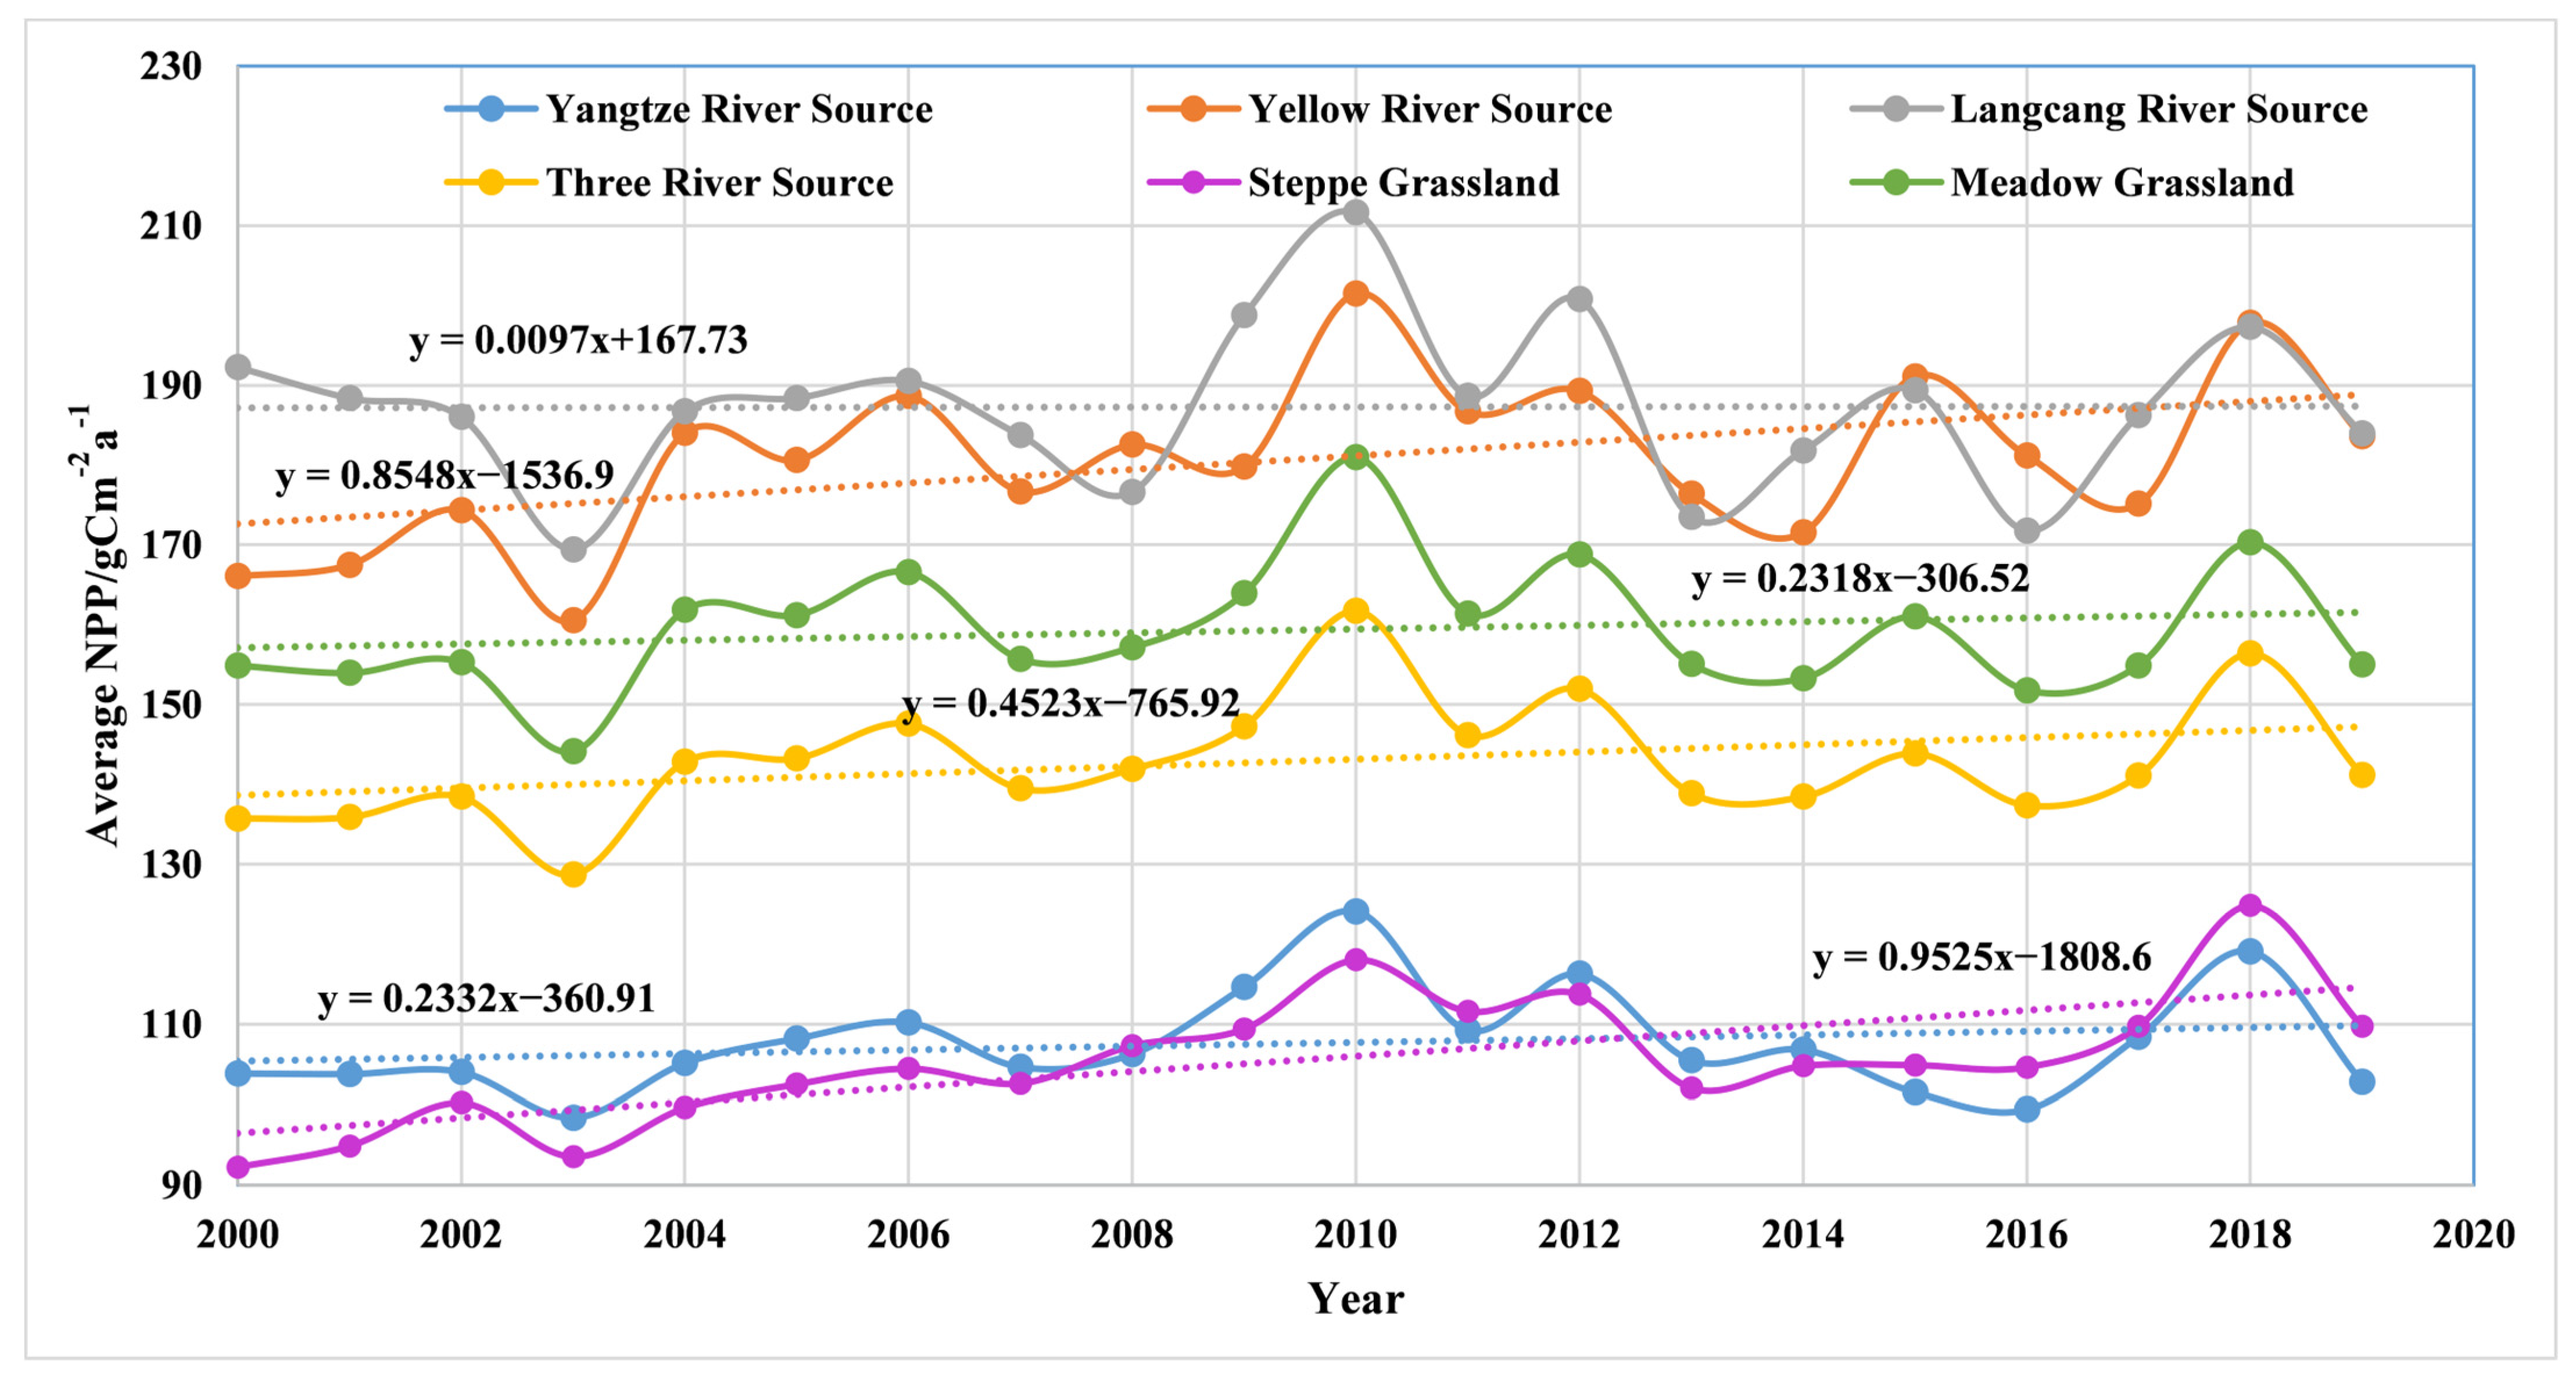
The annual average NPP changes in the TRH region and sub-regions are shown in Figure 3. The obtained results showed that the annual average NPP values in the TRH region, three sub-regions, and two categories of grasslands had a fluctuating increase-decrease-increase trend, with the maximum value of NPP registered in 2010. The NPP values of the TRH region, the Yangtze River Source, the Yellow River Source, and the Lancang River Source in 2010 were as high as 161.72, 124.09, 201.48, and 211.61 gC/m−2a−1 in 2010, respectively. The NPP values of the steppe grassland and meadow grassland were as high as 118.03 and 180.96 gC/m−2a−1 in 2010. The NPP growth rate of the Yellow River Source was higher than the NPP growth level of the whole TRH region, while those in the Yangtze River Source and the Lancang River Source were lower than the overall growth level of the TRH region. The Lancang River Source had a strong fluctuating trend of NPP values, and there was no obvious growth trend. The NPP growth rate of the steppe grassland was higher than the NPP growth level of the entire TRH region, while the NPP growth rate of the meadow grassland was slightly below the growth level of the entire TRH region.
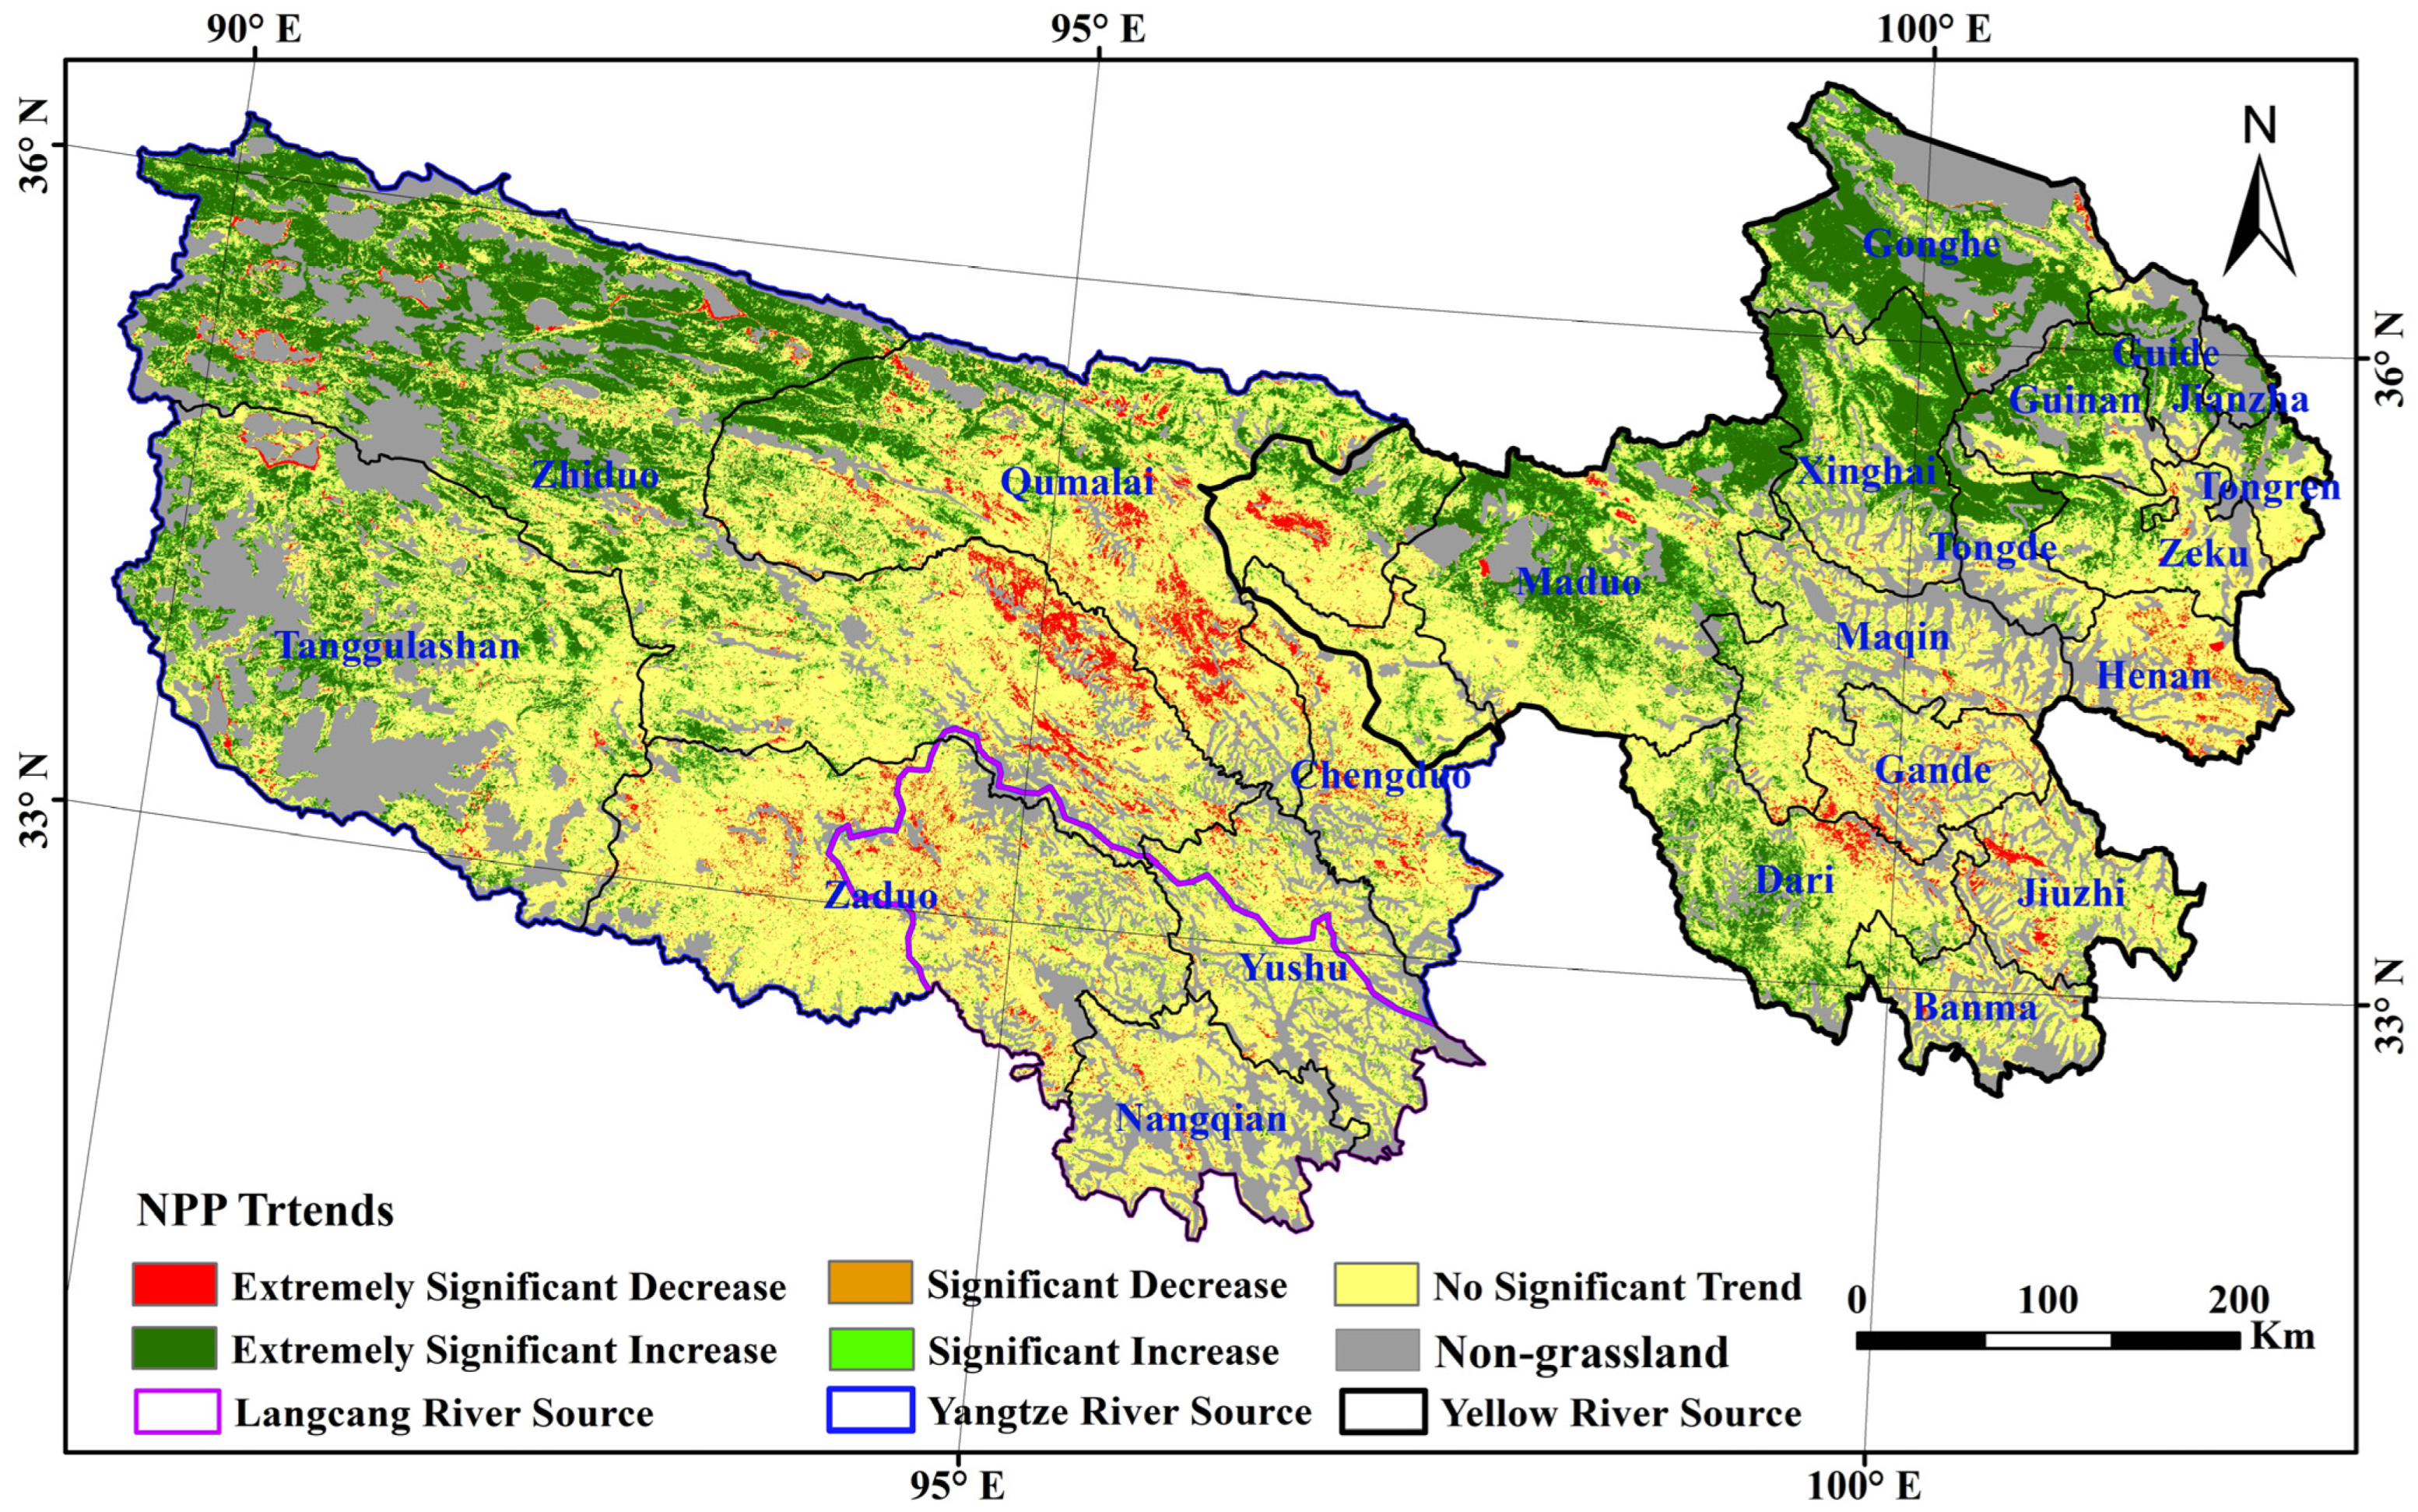
Theil-Sen slope estimation and the MK test were used to analyze the significance of NPP changes in the TRH region from 2000 to 2019. The proportions of significant changes in NPP values in the TRH region and sub-regions and their spatial distribution are shown in Table 3 and Figure 4. The obtained results showed that about 62.51% of the areas in the TRH region had no significant changes in NPP values. The areas with significant increases and decreases in NPP values accounted for 31.45% and 6% of the areas, respectively, among which the areas with extremely significant increases in NPP values accounted for about 25%. For two categories of grasslands, the areas with a significant increase in NPP values accounted for 57.3% of steppe grassland, among which the extremely significant increase was as high as 49.14%. The areas without a significant trend in NPP values accounted for 72.7%, followed by 14.35% for an extremely significant increase in NPP values in meadow grassland. In the three sub-regions, the trends of NPP showed no significant changes similar to the whole TRH. The proportion of NPP with no significant change was about 60% in the Yangtze River Source and the Yellow River Source, while the proportion of NPP with no significant change was as high as 85% in the Lancang River Source. The NPP values increased significantly in 32.52% and 35.81% of the Yangtze River Source and the Yellow River Source, respectively, among which the proportions of extremely significant increases were as high as 26.02% and 28.64%, respectively.
The spatial distribution of significant changes in NPP is shown in Figure 4. The results showed that areas without a significant increase in NPP were mainly concentrated in the central and southeastern parts of the TRH region. The areas with significant NPP increase were mainly concentrated in the western and northern parts of the Yellow River Source and the Yangtze River Source. In comparison, the areas with a significant decrease in NPP were mainly distributed in the eastern part of the Yangtze River Source and the southeast scattered regions of the Yellow River Source. In the Yellow River Source, the areas with extremely significant increases in NPP were mainly concentrated in Maduo, Xinghai, Gonghe, Guide, and Guinan Counties, while the areas with extremely significant decreases were mainly concentrated in Gande, Jiuzhi, and Henan Counties. In the Yangtze River Source, the areas with extremely significant increases were mainly concentrated in the northwest of Tanggulashan, Zhiduo, and Qumalai Counties, and the extremely significant decreases were mainly distributed in the southeast area of Zhiduo and Qumalai Counties. In the Langcang River Source, the areas of significant NPP changes had no obvious spatial concentration.

3.2. Analysis of the Degree of Contribution to the Change in NPP of Grassland

3.2.1. Abrupt Change Analysis of NPP and Meteorological Factors

Abrupt change analysis methods, including the MK test, the Pettitt test, and the cumulative departure, were used to analyze the abrupt changes of NPP, NDVI, precipitation, radiation, and temperature in the TRH region and sub-regions from 2000 to 2019. The obtained results are shown in Table 4. The results showed that NPP and meteorological factors generally had an abrupt upward trend in the TRH region and sub-regions. In the Yangtze River Source, precipitation, radiation, and temperature increased abruptly in 2007, 2005, and 2004, respectively. In the Yellow River Source, precipitation, radiation, and temperature increased abruptly in 2003, 2005, and 2005, respectively. Finally, in the Lancang River Source, radiation and temperature increased abruptly in 2005, while precipitation decreased abruptly in 2014. In summary, abrupt changes in the meteorological factors mainly occurred in 2005. In comparison, NPP and its key characterization index NDVI increased abruptly in 2008. Therefore, it was reasonable to deduce that the long-term cumulative impact of human factors led to the abrupt changes of NPP in 2008, considering different years of abrupt changes for NPP and meteorological factors.

3.2.2. Analysis of the Human and Meteorological Contribution to the Change of Grassland NPP

Taking the abrupt increase in 2008 as the dividing point for NPP, this study set 2000–2007 as the base period and 2008–2019 as the change period. Then, the average NPP of the base period and the average NPP of the change period were calculated. Furthermore, the simulated average NPP based on the scenario when meteorological data in the change period were input into the base period model was calculated, which represented NPP completely under the influence of meteorological conditions without the influence of human factors. NPP in the base period, NPP in the change period, and simulated NPP are shown in Table 5. According to the scenario simulation method, the degree of contributions from human factors and meteorological factors to the abrupt increase in NPP in the TRH region and sub-regions are shown in Table 6. The results showed that the contribution of human factors to the abrupt increase in NPP exceeded the contribution of meteorological factors. The contribution of human factors was as high as 98.2%, in which the areas with a contribution degree of human factors over 70% accounted for 93.68%, and the areas with a contribution degree of human factors over 100% accounted for 46.92%. For comparison, the contribution degree of meteorological factors below 20% accounted for 77.31% of the area. For two grassland categories, the contribution degree of human factors generally exceeds 95%, with the contribution degrees above 70% and 100% accounting for 85.88% and 36.88% in steppe grassland, respectively, and 82.7% and 51.3% in meadow grassland, respectively. The contribution degrees of meteorological factors were generally lower than 5%, with the contribution degrees below 20% and 0% accounting for 77.72% and 36.88 in steppe grassland, respectively, and 76.98% and 51.3% in meadow grassland, respectively. For the three sub-regions, the contribution degree of human factors generally exceeded 95%, in which the contribution degrees above 70% and 100% accounted for 85.37% and 47.35% in the Yangtze River Source, 81.11% and 48.66% in the Yellow River Source, and 84.71% and 36.91% in the Lancang River Source, respectively. The contribution degrees of meteorological factors were generally lower than 5%, in which the contribution degrees below 20% and 0% accounted for 78.6% and 47.35% in the Yangtze River Source, 75.26% and 48.66% in the Yellow River Source, and 77.38% and 36.91% in the Lancang River Source, respectively.
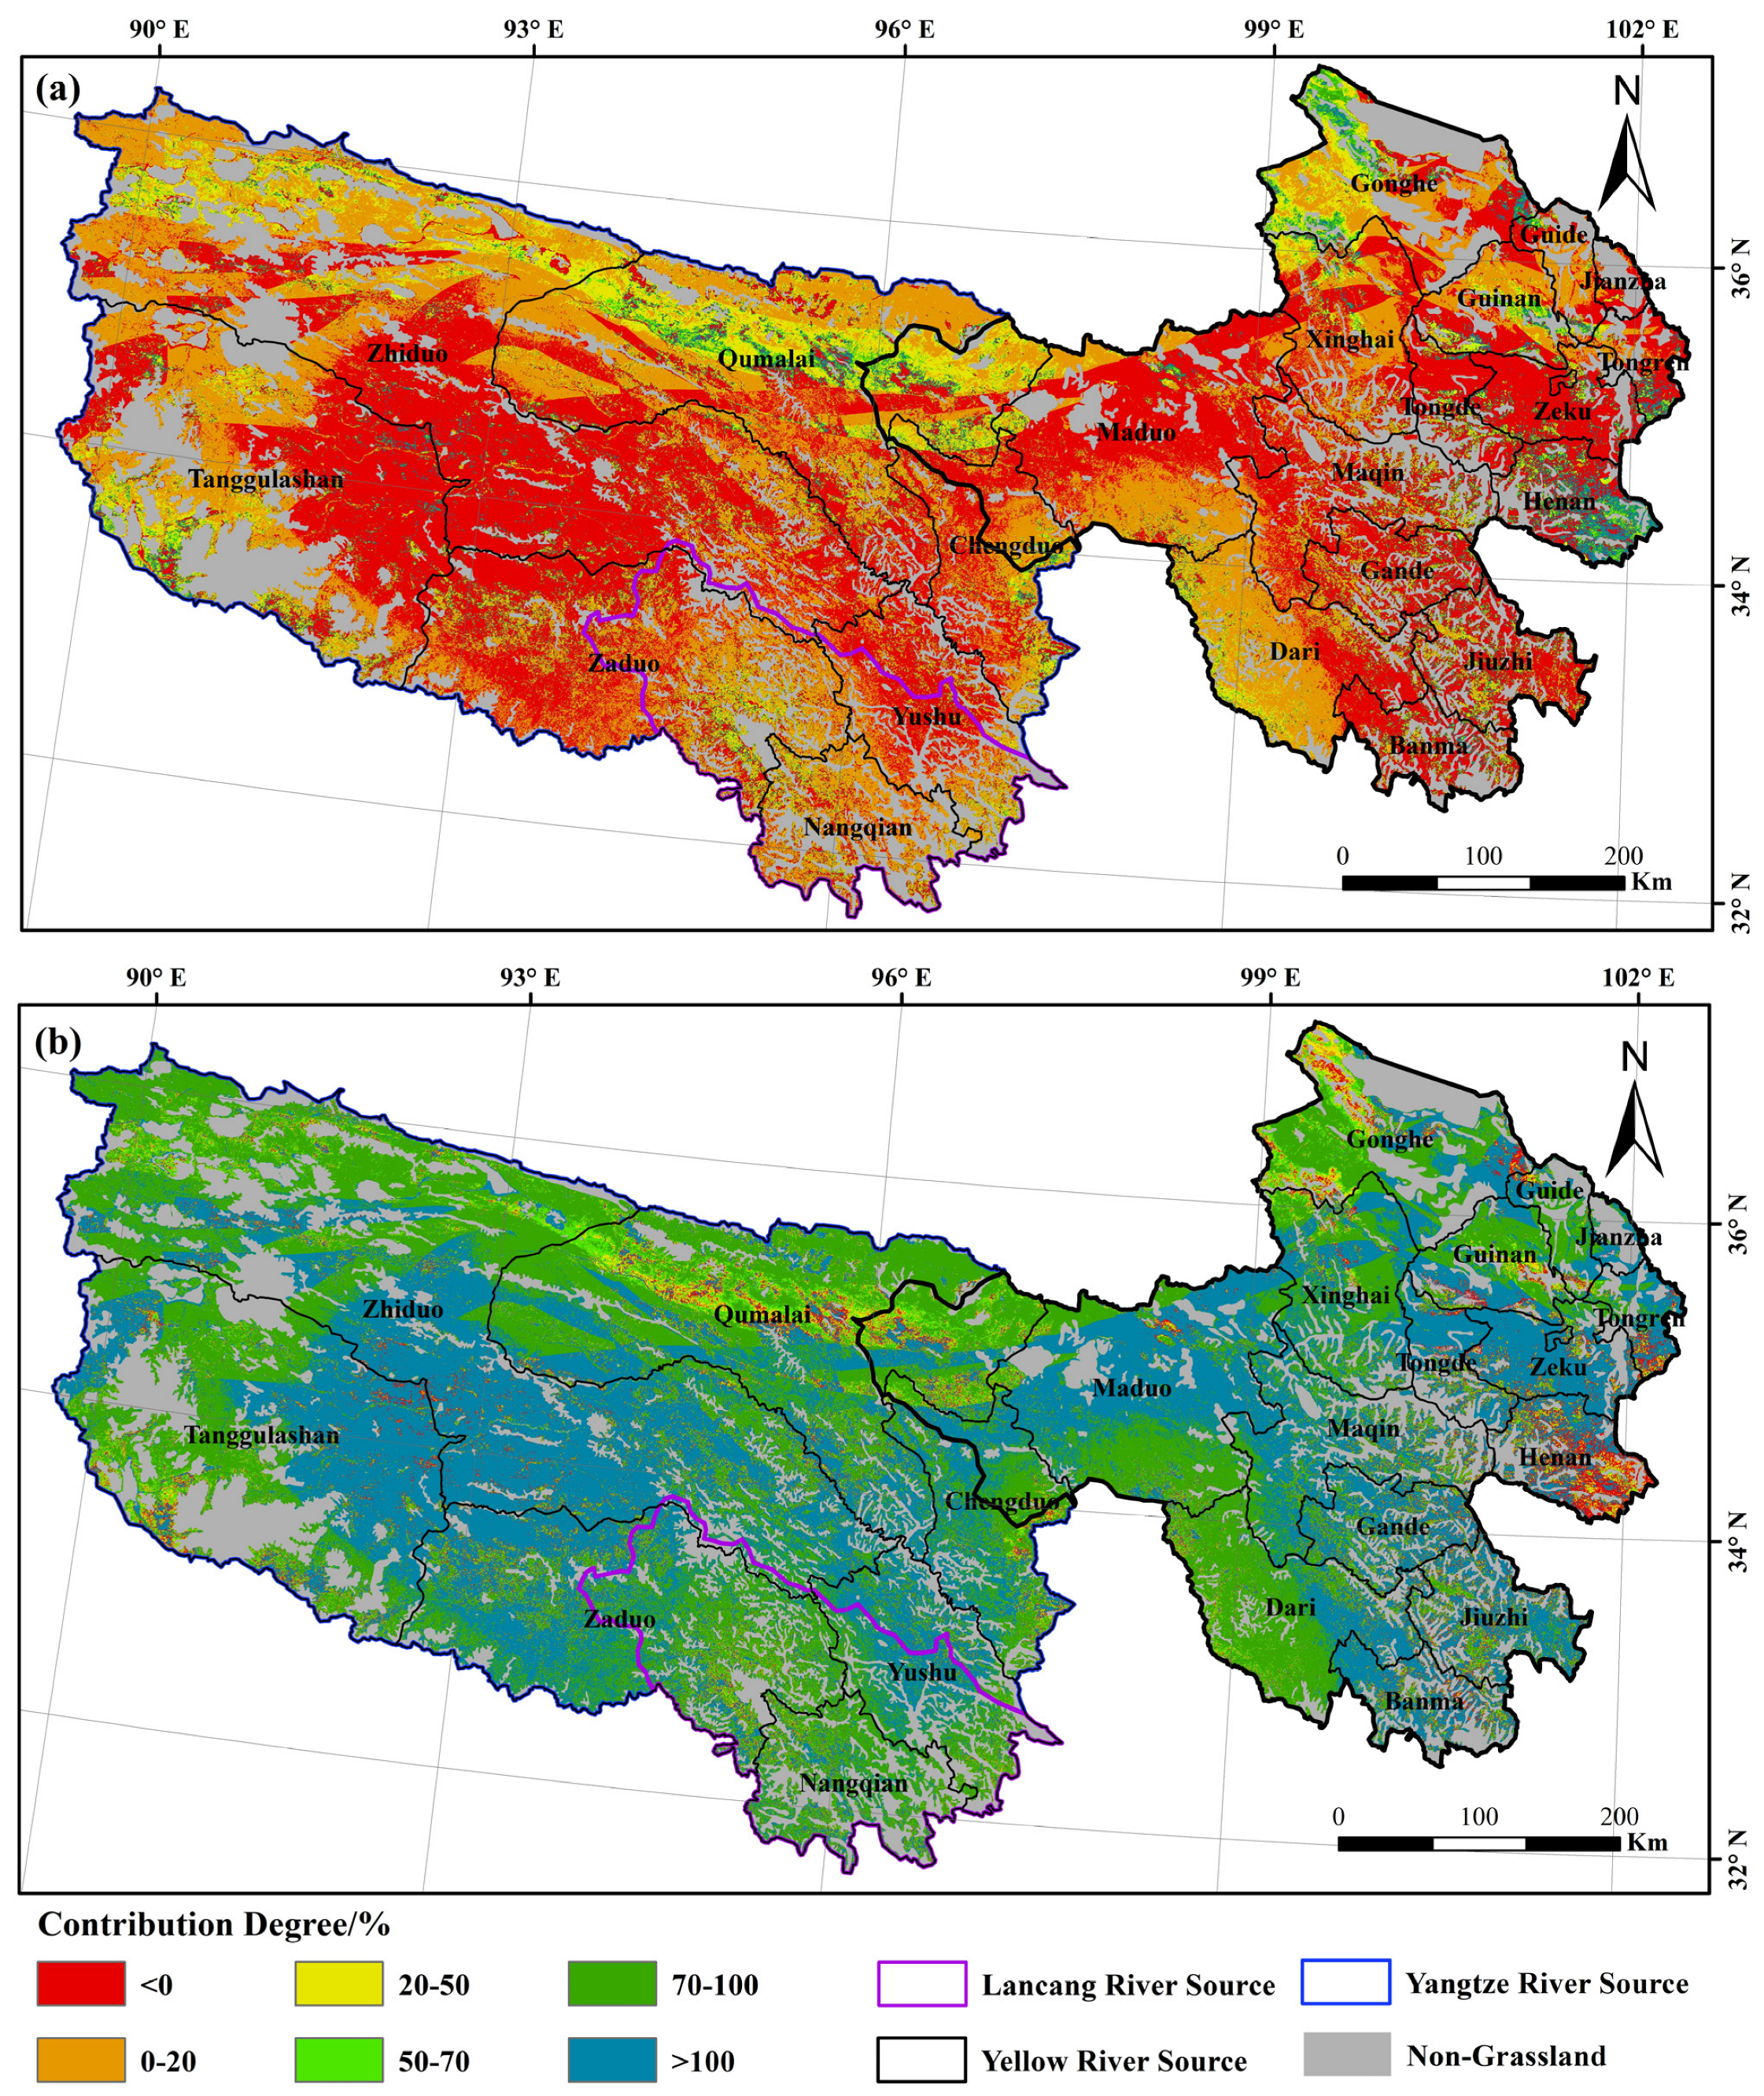
There were significant differences in the contributions of human and meteorological factors to the abrupt increase in NPP and its spatial distribution (Figure 5). In the Yangtze River Source, the contributions of human factors were generally higher than 100% in the areas east of Tanggulashan County, southeast of Zhiduo County, and west of Zaduo County. In addition, negative contributions of meteorological factors were noticed in these areas. The contributions of human factors were generally within 70–100% in the areas west of Tanggulashan County, west of Zhiduo County, and north of Qumalai County, while 0–20% contributions of meteorological factors were noticed in these areas. In the Yellow River Source, the contributions of human factors were generally higher than 100% in most areas, except local areas in Maduo, Dari, Xinghai, Guinan, and Gonghe County, with the contribution of human factors of 70–100%. In addition, 0–20% contributions of meteorological factors were noticed in these areas. In the Lancang River Source, the contribution of human factors was within 70–100%, while the contribution of meteorological factors was 0–20% in these areas.

4. Discussion

4.1. Spatial and Temporal Patterns of NPP

In this study, the average NPP of grassland in TRH was 142.90 gC/m−2a−1, which was almost equal to the NPP estimated by Wang et al. [61] and Chen et al. [62], and the differences in results with Piao et al. [63] and Zhou et al. [64] were generally less than 20 gC/m−2a−1 (Table 7). This indicated that the average NPP estimated in this study was credible. Due to the altitude and temperature, the grassland NPP in the TRH was generally at a low level in China, and the NPP level in most areas was equivalent to that in Tibet and central Inner Mongolia, except for the NPP in the eastern part of the Yellow River Source [65]. From the spatial distribution perspective, the NPP of grassland gradually decreased from southeast to northwest in the TRH in this study, which was consistent with the research of Zhang et al. [66], Wo et al. [67], and Yao [68]. For the three sub-regions, the NPP changes for the Lancang River Source, the Yangtze River Source, and the Yellow River Source in this study were consistent with existing research results [69,70]. The grassland NPP in the Lancang River Source was generally higher and had the highest stability due to the abundant precipitation and better temperature conditions, while the average NPP in the Yangtze River Source was the lowest, and the stability was slightly lower than that in the Lancang River Source due to low temperature and less precipitation. The grassland NPP in the Yellow River Source was at an intermediate level among the three basins, but the fluctuation of NPP was higher than that in the other two basins.

4.2. Influence of Meteorological Factors on NPP

In the past 50 years, the climate of the TRH region has tended to be warm and humid [71,72], and some studies believed that this climate change trend was favorable for vegetation growth and renewal. However, in recent decades, it has been controversial whether climate change has promoted the growth of grassland NPP in the TRH region. Many experts believe that even if the climate gradually becomes warmer and more humid, the overall decrease in radiation in the past two decades is not conducive to the growth of NPP [36,37,38,71,72]. Research by Zhang et al. [66] also showed that the decrease in radiation after entering the 21st century was a key factor leading to the decline in vegetation productivity in the TRH region. Nemani et al. [72] pointed out that the decrease in cloudiness and the increase in radiation in the atmosphere in the 20th century were the main reasons for the increase in global NPP. The study of Piao et al. [63] also pointed out that the increase in radiation had a greater impact on the increase in NPP in the Qinghai-Tibet Plateau compared to precipitation and temperature. Furthermore, our study showed that although precipitation and temperature increased after 2008 in the TRH, solar radiation showed an overall decreasing trend after 2008 as shown in Figure 6. This could also explain that the decrease in radiation was the main factor that caused the negative or low contribution of meteorological factors to the abrupt increase in NPP. Meanwhile, it could also support the viewpoints of Nemani et al. [72] and Piao et al. [63] that the decrease in cloudiness and the increase in atmospheric radiation in the 20th century were the main reasons for the increase in global NPP and that the increase in radiation had a greater impact on the increase in NPP in the Qinghai-Tibet Plateau compared to precipitation and temperature.
In summary, although increased temperature and precipitation contributed positively to the abrupt increase in NPP, the positive effect on increasing NPP is probably smaller than the negative effect of reduced radiation on decreasing NPP, and the final contribution degree of meteorological factors was negative. On the other hand, this study only assessed the contribution degree of meteorological and human factors to the abrupt increase in NPP, and the negative effect of meteorological factors was not applicable for the entire study period. Therefore, the assessment of the contribution degree of the two factors to the NPP change in the entire study period would be the focus of the next research step.

4.3. Influence of Ecological Engineering and Policy on NPP

Although the increase in temperature and precipitation had a positive effect on the abrupt increase in NPP in the TRH region, it could not cause the abrupt increase. Therefore, it could be inferred that a series of ecological projects and policies implemented in the TRH region since 2005 played a positive role in restoring vegetation coverage and grassland productivity, and their impact accumulated and led to an abrupt increase in NPP by 2008. While the health status of the grassland ecosystem was far from ideal, the NPP fluctuation was relatively intense. Local severe grazing still exists, and the extent of ecological engineering implementation is still relatively limited. Therefore, protection and restoration are long-term tasks and face many challenges. In the future, it is necessary to expand the scope of project implementation, strengthen the protection and construction of the ecological environment, strengthen the governance of local overgrazing, respect the objective laws of nature, adhere to the principle of prioritizing natural ecological restoration, and make full use of the advantages of climate change, in order to achieve the ultimate goal of “overall restoration, overall improvement, ecological health and functional stability” of the TRH region.

5. Conclusions

Using meteorological factors and MODIS remote sensing data to simulate grassland NPP of the TRH region based on the CASA model, the spatiotemporal characteristics of NPP and different contributions to NPP changes were quantitatively studied. The following conclusions were drawn:
(1)
The grassland NPP in the TRH region showed an overall increasing trend, but the trend was not significant. The average grassland NPP of the TRH region was about 142.90 gC/m−2a−1. The NPP values of the Yellow River Source and the Lancang River Source were higher than the average NPP of the TRH region, while the NPP of the Yangtze River Source was significantly lower than the average value. The annual average grassland NPP of the TRH region and three sub-regions showed an alternating increase-decrease-increase fluctuation, but the overall increasing trend was not significant in more than 60% of the TRH region. Only about 30% of the regions in the Yellow River Source and the Yangtze River Source had a significant increase.
(2)
Human factors were the determining factors for the abrupt increase in grassland NPP in the TRH region. Abrupt increases in precipitation, temperature, and radiation in the TRH region and sub-regions mostly occurred around 2005, while abrupt increases in NDVI and NPP, which reflected the impact of human activities, occurred in 2008. The difference in the timing of the abrupt increases between meteorological and human factors indicated that human factors were the decisive factors for the abrupt increase in grassland NPP in the study area.
(3)
The contribution of human factors to the abrupt increase in grassland NPP in the TRH region was significantly higher than that of the meteorological factors. The contributions of human factors to the abrupt increase in NPP in three sub-regions were generally above 98%. The contributions of human factors generally exceeded 100% in the eastern part of Tanggulashan County, the southeastern part of Zhiduo County, and the western part of Zaduo County in the Yangtze River Source and most areas in the Yellow River Source.

Author Contributions

Conceptualization, L.Z., and Y.S.; methodology, Y.S., and T.L.; software, Y.S., T.L., and C.H.; validation, T.L., C.H., and H.W.; writing—original draft preparation, Y.S., and T.L.; supervision, Y.S., and T.L.; funding acquisition, L.Z. All authors have read and agreed to the published version of the manuscript.

Funding

This work was financially supported by the Shandong Social Science Planning Project (No. 21CXSXJ01).

Institutional Review Board Statement

Not applicable.

Informed Consent Statement

Not applicable.

Data Availability Statement

Not applicable.

Conflicts of Interest

The authors declare no conflict of interest.

References

  1. Ren, J.Z.; Lin, H.L. Assumed plan on grassland ecological reconstruction in the source region of Yangtse River, Yellow River and Lantsang River. Acta Prataculturae Sin. 2005, 14, 1–8. [Google Scholar] [CrossRef]
  2. Wang, K.; Hong, F.Z.; Zong, J.Y. Resource and their sustainable utility in the “Three-River Headwaters” Region. Acta Agrestia Sin. 2005, 13, 28–31. [Google Scholar]
  3. Doris, C.; Cristan, S.K.; Marcus, J.L.; Raudsepp-Hearne, C. Ecosystems and Human Well Being: Multiscale Assessment s1 Volume 4; Island Press: Washington, DC, USA, 2005; pp. 16–301. Available online: https://www.researchgate.net/publication/37717295_Ecosystems_and_Human_Well-Being_Multiscale_Assessments_Findings_of_the_Sub-Global_Assessments_Working_Group (accessed on 27 January 2023).
  4. Liu, X.D.; Chen, B.D. Climatic warming in the Tibetan Plateau during recent decades. Int. J. Climatol. 2000, 20, 1729–1742. [Google Scholar] [CrossRef]
  5. Ren, G.Y.; Chu, Z.Y.; Zhou, Y.Q.; Xu, M.Z.; Wang, Y.; Tang, G.L.; Zhai, P.M.; Shao, X.M.; Zhang, A.Y.; Chen, Z.H.; et al. Recent progresses in studies of regional temperature changes in China. Clim. Environ. Res. 2005, 10, 701–716. [Google Scholar] [CrossRef]
  6. Duan, A.M.; Wu, G.X.; Zhang, Q.; Liu, Y.M. New proofs of the recent climate warming over the Tibetan Plateau as a result of the increasing greenhouse gases emissions. Chin. Sci. Bull. 2006, 51, 1396–1400. [Google Scholar] [CrossRef]
  7. Li, H.M.; Ma, Y.S.; Bai, Y.F. An analysis of the impact of climate change on vegetation succession in Qinghai Province. J. Glaciol. Geocryol. 2010, 32, 414–421. [Google Scholar] [CrossRef]
  8. Zhang, Y.J.; Dong, W.J.; Yu, Y.Q.; Feng, J.M. A pre-diction of trend of the future climate change in the western China. Clim. Environ. Res. 2004, 9, 342–349. [Google Scholar] [CrossRef]
  9. Ding, Y.H.; Ren, G.Y.; Shi, G.Y.; Gong, P.; Zheng, X.H.; Zhai, P.M.; Zhang, D.; Zhao, Z.C.; Wang, S.W.; Wang, H.J.; et al. National assessment report of climate change (I): Climate change in China and its future trend. Adv. Clim. Chang. Res. 2006, 2, 3–8. [Google Scholar] [CrossRef]
  10. Zhang, Y.L.; Liu, L.S.; Bai, W.Q.; Shen, Z.X.; Yan, J.Z.; Ding, M.J.; Li, S.C.; Zheng, D. Grassland degradation in the source region of the Yellow River. Acta Geogr. Sin. 2006, 61, 3–14. [Google Scholar] [CrossRef]
  11. Bai, W.Q.; Zhang, Y.L.; Xie, G.D.; Shen, Z.X. Analysis of formation causes of grassland degradation in Maduo County in the source region of Yellow River. Chin. J. Appl. Ecol. 2002, 13, 823–826. [Google Scholar]
  12. Chen, Q.; Zhou, Q.; Zhang, H.F.; Liu, F.G. Spatial dis-parity of NDVI response in vegetation growing season to climate change in the Three-River Headwaters Region. Ecol. Environ. Sci. 2010, 19, 1284–1289. [Google Scholar] [CrossRef]
  13. Tang, H.Y.; Xiao, F.J.; Zhang, Q.; Shi, J.M. Vegetation change and its response to climate change in Three-River Source Region. Adv. Clim. Chang. Res. 2006, 2, 177–180. [Google Scholar] [CrossRef]
  14. Li, S.Y.; Sun, X.Q. Research about analysis of the causes of ecological degradation of the pastoral areas in Qinghai- with the case study of the grassland degradation in the three rivers. Qinghai Prataculture 2009, 18, 19–23. [Google Scholar]
  15. Waiz, R. Development of environmental indicator systems: Experiences from Germany. Environ. Manag. 2000, 25, 613–623. [Google Scholar] [CrossRef]
  16. Ge, Q.S.; Zhao, M.C.; Zheng, J.Y.; Fang, X.Q. Study on division of the terrestrial system in China. Acta Prataculturae Sin. 2002, 57, 515–522. [Google Scholar]
  17. Feng, J.M.; Wang, T.; Xie, C. Eco-environmental degradation in the source region of the Yellow River, Northeast Qinghai-Xizang Plateau. Environ. Monit. Assess. 2006, 122, 125–143. [Google Scholar] [CrossRef]
  18. Liu, J.Y.; Xu, X.L.; Shao, Q.Q. Grassland degradation in the “Three-River Headwaters”region, Qinghai Province. J. Geogr. Sci. 2008, 18, 364–376. [Google Scholar] [CrossRef]
  19. Huang, L.; Liu, J.; Shao, Q.; Liu, R. Changing inland lakes responding to climate warming in Northeastern Tibetan Plateau. Clim. Chang. 2011, 109, 479–502. [Google Scholar] [CrossRef]
  20. Sun, Q.L.; Li, B.L.; Li, F.; Zhang, Z.J.; Ding, L.L.; Zhang, T.; Xu, L.L. Review on the estimation of net primary productivity of vegetation in the Three-River Headwater Region, China. Acta Geogr. Sin. 2016, 71, 1596–1612. [Google Scholar] [CrossRef]
  21. Shao, Q.C.; Fan, J.W.; Liu, J.Y.; Huang, L.; Xu, X.L. Effects of an ecological conservation and restoration project in the Three-River Source Region, China. Acta Geogr. Sin. 2017, 27, 183–204. [Google Scholar] [CrossRef]
  22. Su, X.Y.; Chen, K.L. Study on dynamic change of vegetation coverage in Sanjiangyuan National Park from 2005 to 2015. Qinghai Prataculture 2019, 28, 20–23. [Google Scholar]
  23. Liu, M.X.; Jiao, J.; Pan, J.H.; Song, J.Y.; Che, Y.D.; Li, L.R. Spatial and temporal patterns of planting NPP and its driving factors in Qinghai Province. Acta Ecol. Sin. 2020, 40, 5306–5317. [Google Scholar] [CrossRef]
  24. Matsushita, B.; Tamura, M. Integrating remotely sensed data with an ecosystem model to estimate net primary productivity in East Asia. Remote Sens. Environ. 2002, 81, 58–66. [Google Scholar] [CrossRef]
  25. Field, C.B.; Behrenfeld, M.J.; Randerson, J.T.; Falkowski, P.G. Primary production of the biosphere: Integrating terrestrial and oceanic components. Science 1998, 281, 237–240. [Google Scholar] [CrossRef] [PubMed] [Green Version]
  26. Steffen, W.; Noble, I.; Canadell, J.; Apps, M.; Schulze, E.D.; Jarvis, P.G. The terrestrial carbon cycle: Implications for the Kyoto Protocol. Science 1998, 280, 1393–1394. [Google Scholar] [CrossRef]
  27. Piao, S.L.; Fang, J.Y.; Guo, Q.H. Application of CASA model to the estimation of Chinese terrestrial Net Primary Productivity. Acta Phytoecol. Sin. 2001, 25, 603–608. [Google Scholar]
  28. Jiang, L.P.; Qin, Z.H.; Xie, W. A research of monitoring grassland degradation based on mono temporal MODIS data. Chin. J. Grassl. 2007, 29, 39–43. [Google Scholar]
  29. Li, G.; Xin, X.P.; Wang, D.L. Application of improved CASA model in productivity evaluation of grassland in Inner Monglia. Chin. J. Ecol. 2007, 26, 2100–2106. [Google Scholar] [CrossRef]
  30. Zhan, G.C.; Wang, X.; Li, J.; Hua, T. Roles of climate changes and human interventions in land degradation: A case study by net primary productivity analysis in China’s Shiyanghe Basin. Environ. Earth Sci. 2011, 64, 2183–2193. [Google Scholar] [CrossRef]
  31. Zhou, W.; Sun, Z.G.; Li, J.L.; Gang, C.C.; Zhang, C.B. Desertification dynamic and the relative roles of climate change and human activities in desertification in the Heihe River Basin based on NPP. J. Arid Land 2013, 5, 465–479. [Google Scholar] [CrossRef] [Green Version]
  32. Mu, S.J.; Zhou, S.X.; Chen, Y.Z.; Li, J.L.; Ju, W.M.; Odeh, I. Assessing the impact of restoration-induced land conversion and management alternatives on net primary productivity in Inner Mongolian grassland, China. Glob. Planet. Chang. 2013, 108, 29–41. [Google Scholar] [CrossRef]
  33. Xiao, T.; Liu, J.Y.; Shao, Q.Q. A simulation on changes in vegetation productivity in Three River Sources Nature Reserve, Qinghai Province over past 20 years. J. Geo-Inf. Sci. 2009, 11, 557–565. [Google Scholar] [CrossRef]
  34. Liu, S.L.; Sun, Y.X.; Zhao, H.D.; Liu, Y.X.; Li, M.Q. Grassland dynamics and their driving factors associated with ecological construction projects in the Three-River Headwaters Region based on multi-source data. Acta Ecol. Sin. 2021, 41, 3865–3877. [Google Scholar] [CrossRef]
  35. Man, W.J.; Xu, Y.J. Using NPP and EVI to assess the ecological status of the Sanjiangyuan area. Grassl. Turf 2021, 41, 1–8. [Google Scholar] [CrossRef]
  36. Zuo, C.; Wang, J.B.; Zhang, X.J.; Lu, G.X.; Ye, H.; Wang, C.Y. Changes and influencing factors of vegetation net primary productivity in the Sanjiangyuan National Park. Acta Ecol. Sin. 2022, 42, 5559–5573. [Google Scholar] [CrossRef]
  37. Zhang, Y.; Zhang, J.J.; Zhang, Y.D.; Zhai, Y.H.; Zhou, X.P. Spatial variation of long-term runoff trends and response to precipitation change in the Three-River Headwaters Region. Res. Environ. Sci. 2017, 30, 40–50. [Google Scholar] [CrossRef]
  38. Sun, Q.L.; Li, B.L.; Zhou, C.H.; Li, F.; Zhang, Z.J.; Ding, L.L.; Zhang, T.; Xu, L.L. A systematic review of research studies on the estimation of net primary productivity in the Three-River Headwater Region, China. Acta Geogr. Sin. 2017, 27, 161–182. [Google Scholar] [CrossRef]
  39. Zhao, Y.Y.; Long, R.J.; Lin, H.L.; Ren, J.Z. Study on pastoral ecosystem security and its assessment. Acta Prataculturae Sin. 2008, 17, 143–150. [Google Scholar] [CrossRef]
  40. Liu, L.S.; Zhang, Y.L.; Bai, W.Q.; Yan, J.Z.; Ding, M.J.; Shen, Z.X.; Li, S.C.; Zheng, D. Characteristics of grassland degradation and driving forces in the source region of the Yellow River from 1985 to 2000. J. Geogr. Sci. 2006, 16, 131–142. [Google Scholar] [CrossRef]
  41. Yang, Y.H.; Piao, S.L. Variations in grassland vegetation cover in relation to climatic factors on the Tibetan plateau. J. Plant Ecol. 2006, 30, 1–8. [Google Scholar] [CrossRef]
  42. Ma, M.G.; Veroustraete, F. Interannual change trend of NDVI from 1981 to 2001 in the Heihe River Basin, China. In Proceedings of the 2nd International Vegetation User Conference, Antwerp, Belgium, 24–26 March 2004; pp. 231–237. [Google Scholar]
  43. Zhan, Y.L.; Ding, M.J.; Zhang, W.; Wang, Z.F.; Yan, J.Z.; Bai, W.Q.; Zheng, D. Spatial charac-teristic of vegetation change in the source regions of the YangtzeRiver, Yellow River and Lancang River in China. Geo-Graph. Res. 2007, 26, 500–508. [Google Scholar] [CrossRef]
  44. Wu, Y.B.; Tan, H.C.; Deng, Y.C.; Wu, J.; Xu, X.L.; Wang, Y.F.; Tang, Y.H.; Higashi, T.; Cui, X.Y. Partitioning patttern of carbon flux in a Kobresia grassland on the Qinghai-Tibetan Plateau revealed by field 13C pulse-labeling. Glob. Chang. Biol. 2010, 16, 2322–2333. [Google Scholar] [CrossRef]
  45. Li, X.; Cheng, G.D.; Lu, L. Comparison study of spatial interpolation methods of air temperature over Qinghai-Xizang Plateau. Plateau Meteorol. 2003, 26, 565–573. [Google Scholar]
  46. Liu, Z.H.; Li, L.T.; Mcvicar, T.R.; Van Niel, T.G.; Yang, Q.K. Introduction of the professional interpolation software for meteorology data: ANUSPLINN. Meteorol. Mon. 2008, 34, 92–100. [Google Scholar] [CrossRef]
  47. Price, D.T.; Mckenney, D.W.; Nalder, I.A.; Hutchinson, J.L.; Kesteven, J.L. A comparison of two statistical methods for spatial interpolation of Canadian monthly mean climate data. Agric. For. Meteorol. 2000, 101, 81–94. [Google Scholar] [CrossRef]
  48. Hijmans, R.J.; Cameron, S.E.; Parra, J.L.; Jones, P.G.; Jarvis, A. Very high resolution interpolated climate surfaces for global land areas. Int. J. Climatol. 2005, 25, 1965–1978. [Google Scholar] [CrossRef]
  49. Qian, Y.L.; Lv, H.Q.; Zhang, Y.H. Application and assessment of spatial interpolation method on daily meteorological elements based on ANUSPLIN software. J. Meteorol. Environ. 2010, 26, 7–15. [Google Scholar]
  50. Peng, H.L.; Liu, F.; Duo, H.R.; Li, D.Q. The comparison of spatial interpolation methods on temperature and precipitation of Sanjiangyuan area. Meteorol. Environ. Res. 2010, 1, 7–11+57. [Google Scholar]
  51. Yu, D.Y.; Shi, P.J.; Shao, H.B.; Zhu, W.Q.; Pan, Y.Z. Modeling net primary productivity of terrestrial ecosystems in East Asia based on an improved CASA ecosystem model. Int. J. Remote Sens. 2009, 30, 4851–4866. [Google Scholar] [CrossRef]
  52. Zhu, W.Q.; Pan, Y.Z.; Zhang, J.S. Estimation of net primary productivity of Chinese terrestrial vegetation based on remote sensing. J. Plant Ecol. 2007, 31, 413–424. [Google Scholar] [CrossRef]
  53. Hirsch, R.M.; Slack, J.R.; Smith, R.A. Techniques of trend analysis for monthly water quality data. Water Resour. Res. 1982, 18, 107–121. [Google Scholar] [CrossRef] [Green Version]
  54. Wang, J.; Wan, H.L.; Yao, S.B. Spatial and temporal response of vegetation cover to climate change in different zones of Sichuan-Shaanxi area during growing season. Acta Ecol. Sin. 2019, 39, 5218–5231. [Google Scholar] [CrossRef]
  55. Bai, X.L.; Wei, J.H.; Xie, H.W. Characteristics of wetness dryness variation and their influences in the Three-River Headwaters region. Acta Ecol. Sin. 2017, 37, 8397–8410. [Google Scholar] [CrossRef] [Green Version]
  56. Cai, Y.Q.; Li, Q.J.; Liu, X.S.; Tang, H.B.; Li, Y. Variation Characteristics of Runoff Time Series in the Source Region of Three Rivers. J. Yangtze River Sci. Res. Inst. 2017, 34, 1–5. [Google Scholar] [CrossRef]
  57. Xu, W.X.; Gu, S.; Xu, W.J.; Jiang, S.; Xiao, R.X.; Xiao, J.S.; Zhang, J. Spatial pattern and its variations of aridity/humidity during 1971–2010 in Three-River Source Region on the Qinghai-Tibet Plateau. Arid Land Geogr. 2012, 35, 46–55. [Google Scholar] [CrossRef]
  58. Cong, Z.T.; Yang, W.D.; Gao, B.; Yang, H.B.; Hu, H.P. Hydrological trend analysis in the Yellow River basin using a distributed hydrological model. Water Resour. Res. 2009, 45, W00A13. [Google Scholar] [CrossRef]
  59. Wang, J.H.; Hong, Y.; Gourley, J.; Adhikari, P.; Li, L.; Su, F.G. Quantitative assessment of climate change and human impacts on long-term hydrologic response: A case study in a sub-basin of the Yellow River, China. Int. J. Climatol. 2010, 30, 2130–2137. [Google Scholar] [CrossRef]
  60. Jiang, S.H.; Ren, L.L.; Yong, B.; Fu, C.B.; Yang, X.L. Analyzing the effects of climate variability and human activities on runoff from the Laohahe basin in northern China. Hydrol. Res. 2012, 43, 3–13. [Google Scholar] [CrossRef]
  61. Wang, Y.H.; Tang, W.J.; Li, S.; Zhao, H.Y.; Xie, J.L.; Ma, C.; Yan, C.Z. Change in grassland productivity in Qinghai Province and its driving factors. Acta Prataculturae Sin. 2022, 31, 1–13. [Google Scholar] [CrossRef]
  62. Chen, Z.Q.; Shao, Q.Q.; Liu, J.Y.; Wang, J.B. Analysis of net primary productivity of terrestrial vegetation on the Qinghai-Tibetan Plateau, based on MODIS remote sensing data. Sci. China Earth Sci. 2012, 55, 1306–1312. [Google Scholar] [CrossRef]
  63. Piao, S.L.; Fang, J.Y. Terrestrial net primary production and its spatio-temporal patterns in Qinghai-Xizang Plateau, China during 1982–1999. J. Nat. Resour. 2002, 17, 373–380. [Google Scholar] [CrossRef]
  64. Zhou, C.P.; Ou, Y.H.; Wang, Q.X.; Masatak, W.; Sun, Q.Q. Estimation of Net Primary Production in Tibetan Plateau. Acta Geogr. Sin. 2004, 59, 74–79. [Google Scholar] [CrossRef]
  65. Liu, Y.Y.; Zhang, Z.Y.; Tong, L.J.; Wang, Q.; Zhou, W.; Wang, Z.Q.; Li, J.L. Spatiotemporal dynamics of China’s grassland NPP and its driving factors. Chin. J. Ecol. 2020, 39, 349–363. [Google Scholar] [CrossRef]
  66. Zhang, Y.; Wei, Z.F.; Huang, Y. Evaluation of vegetation Net Primary Productivity and its carbon sequestration value in Three-River Headwater Region during 1999–2012. Bull. Soil Water Conserv. 2016, 36, 100–105. [Google Scholar] [CrossRef]
  67. Wo, X.; Wu, L.C.; Zhang, J.P. Estimation of net primary production in the Three-River headwater region using CASA model. J. Arid Land Resour. Environ. 2014, 28, 45–50. [Google Scholar] [CrossRef]
  68. Yao, Y.B.; Yang, J.H.; Wang, R.Y. Responses of Net Primary Productivity of natural vegetation to climatic change over source regions of yangtze river in 1959–2008. J. Glaciol. Geocryol. 2011, 33, 1286–1293. [Google Scholar] [CrossRef]
  69. Zhou, B.R.; Zhu, S.C.; Li, H.M. Temporal and Spatial Characteristics of Vegetation Net Primary Productivity and Its Responses to Climate Change in Three-river Headwaters Region. J. Arid Meteorol. 2016, 34, 958–965. [Google Scholar] [CrossRef]
  70. Wischnewski, J.; Kramer, A.; Kong, Z.; Mackay, A.W.; Simpson, G.L.; Mischke, S.; Herzschuh, U. Terrestrial and aquatic responses to climate change and human impact on the southeastern Tibetan Plateau during the past two centuries. Glob. Chang. Biol. 2011, 17, 3376–3391. [Google Scholar] [CrossRef] [Green Version]
  71. Dou, R.Y. The climate change and adaptation strategies for sustainable development in the Three-River Headwaters Region in Qinghai Province in recent half century. Ecol. Econ. 2016, 32, 165–171. [Google Scholar]
  72. Nemani, R.R.; Keeling, C.D.; Hashimoto, H.; Jolly, W.M.; Piper, S.C. Climate-driven increases in global terrestrial net primary production from 1982 to 1999. Science 2003, 300, 1560–1563. [Google Scholar] [CrossRef]
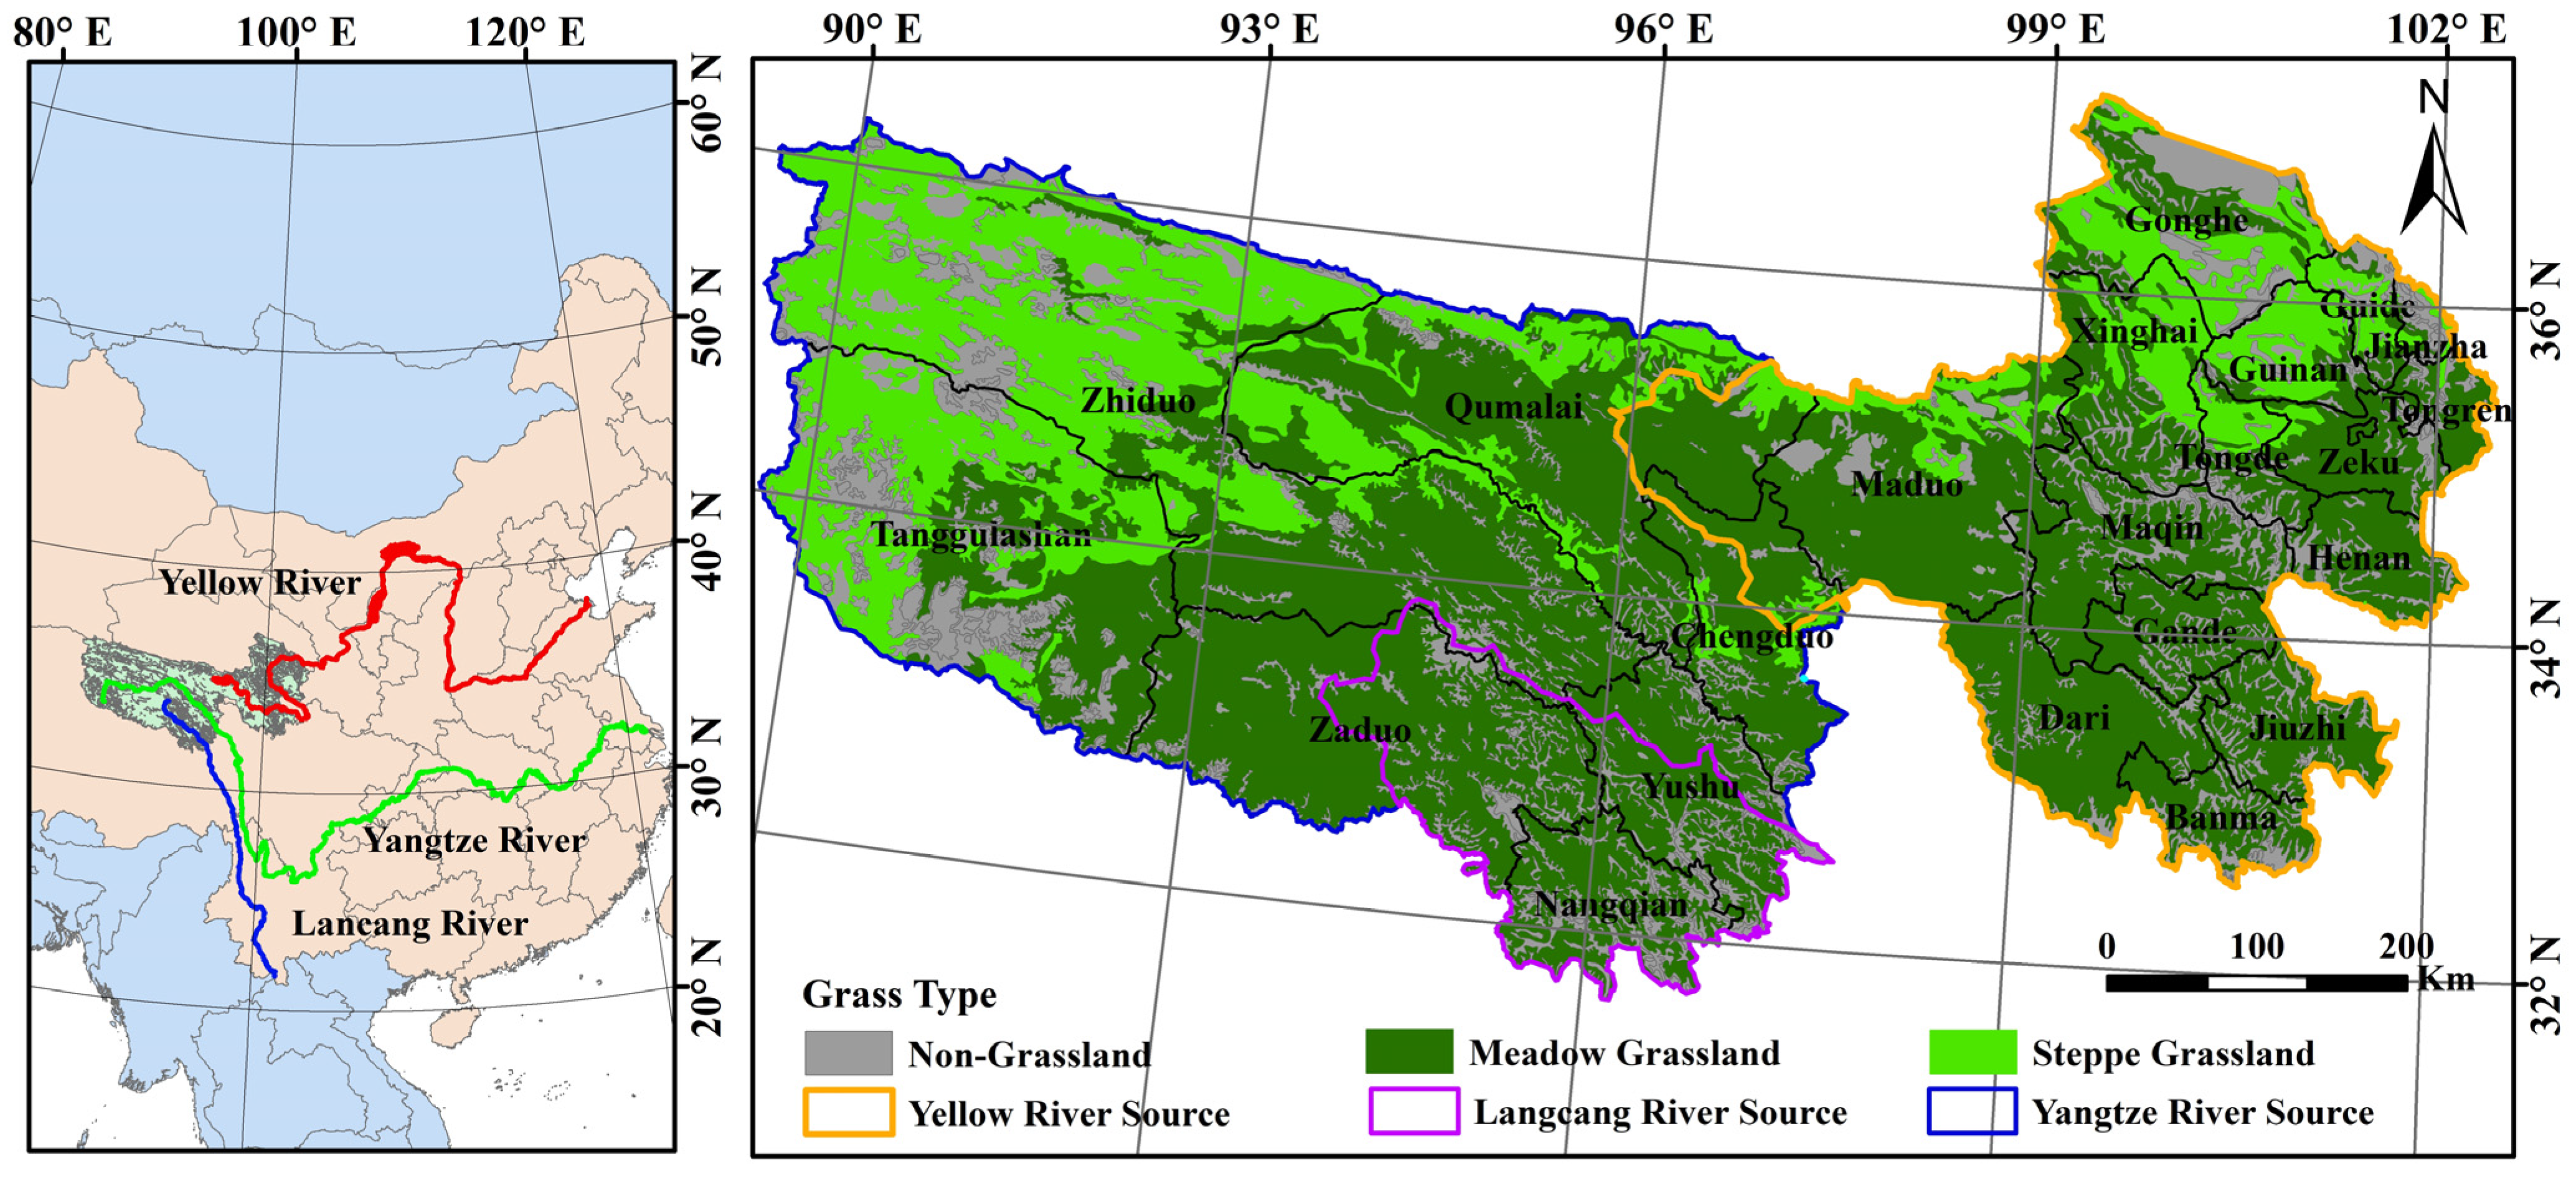
Figure 1. Location, grassland categories, and administrative division of the study area.
Atmosphere 14 00278 g001
Figure 2. Spatial distribution of multi-year average grassland NPP in the TRH region during the period 2000–2019.
Atmosphere 14 00278 g002
Figure 3. Changes in multi-year grassland NPP values in the TRH region and sub-regions during the period 2000–2019.
Atmosphere 14 00278 g003
Figure 4. Spatial distribution of the grassland NPP trends in the TRH region during the period 2000–2019.
Atmosphere 14 00278 g004
Figure 5. Spatial distribution of the contribution degree of meteorological factors (a) and human factors (b) to the grassland NPP in the TRH region during the period 2000–2019.
Atmosphere 14 00278 g005
Figure 6. Changes in multi-year meteorological factors during the period 2000–2019.
Atmosphere 14 00278 g006
Table 1. Categories of NPP significance trends.
TrendsSen Slope (β)MK Test (Z)
Extremely significant increaseβ > 0Z > 2.58
Significant increaseβ > 01.96 < Z ≤ 2.58
No significant trend---−1.96 ≤ Z ≤ 1.96
Significant decreaseβ < 0−2.58 ≤ Z < −1.96
Extremely significant decreaseβ < 0Z < −2.58
Table 2. Statistics of NPP grade proportion in the TRH regions and sub-regions.
RegionNPP Grade Proportion/%
0–100 gC/m−2a−1100–200 gC/m−2a−1200–300 gC/m−2a−1>300 gC/m−2a−1
TRH36.8136.5825.041.57
Yangtze River Source52.9237.119.900.07
Yellow River Source20.5435.0640.623.78
Lancang River Source12.2739.9546.920.87
Steppe grassland58.9427.4913.380.20
Meadow grassland27.0640.5930.182.17
Table 3. Statistics of the NPP change trends in the TRH region and sub-regions.
RegionNPP Change Trend Ratio/%
Extremely Significant DecreaseSignificant DecreaseNo Significant TrendSignificant IncreaseExtremely Significant Increase
TRH4.002.0562.516.4624.99
Yangtze River Source4.852.2460.396.5026.02
Yellow River Source2.751.5259.927.1728.64
Lancang River Source4.383.1885.923.183.35
Steppe grassland2.350.9739.378.1649.14
Meadow grassland4.722.5272.705.7114.35
Table 4. Abrupt change years for NPP and meteorological factors in the TRH region and sub-regions.
RegionIndexDetection Method
MK TestCumulative DeparturePettitt Test
Yangtze River SourcePrecipitation--- *2005 ↑ *2007 ↑
Radiation2005 ↑2005 ↑2007 ↑
Temperature2003 ↑2004 ↑2004 ↑
NDVI2008 ↑2008 ↑2008 ↑
NPP2003 ↑2008 ↑2008 ↑
Yellow River SourcePrecipitation2003 ↑2003 ↑2004 ↑
Radiation2005 ↑2005 ↑2002 ↑
Temperature2005 ↑2005 ↑2004 ↑
NDVI2008 ↑2008 ↑2008 ↑
NPP2003 ↑2008 ↑2008 ↑
Lancang River SourcePrecipitation---2014 ↓ *2014 ↓
Radiation---2005 ↑2016 ↑
Temperature2005 ↑2005 ↑2005 ↑
NDVI---2008 ↑2008 ↑
NPP2008 ↑2008 ↑2012 ↑
* means that abrupt change year could not be detected; ↑ means abrupt increase; ↓ means abrupt decrease.
Table 5. NPP in different periods and scenario simulations in the TRH region and sub-regions.
NPPTRHYangtze River SourceYellow River SourceLancang River Source
Base Period141.87107.09178.9186.8
Change Period149.39112.76189.57191.69
Simulation141.63107.1178.06187.75
Table 6. Contribution degree to the NPP abrupt increase in the TRH region and sub-regions.
RegionFactorsContribution Degree
<0 *0–2020–5050–7070–100>100 *Mean
TRHMeteorology46.9230.2912.62.862.225.111.8
Human5.111.293.796.1336.7646.9298.2
Yangtze River SourceMeteorology47.3531.25132.581.814−0.37
Human41.043.366.2338.0247.35100.37
Yellow River SourceMeteorology48.6626.611.813.282.836.832.41
Human6.831.664.445.9632.4548.6697.59
Lancang River SourceMeteorology36.9140.4713.672.71.994.284.43
Human4.281.143.546.3347.836.9195.57
Steppe grasslandMeteorology36.8840.8414.442.511.793.554.25
Human3.551.003.306.2849.0036.8895.75
Meadow grasslandMeteorology51.3025.6811.803.022.415.80−0.24
Human5.801.424.016.0731.4051.30100.24
* <0 indicates a negative contribution to NPP increase; >100 indicates a completely positive contribution to NPP increase when the contribution is negative for the other side of the factors.
Table 7. Research results on the assessment of grassland NPP in TRH and their surrounding areas.
ScholarsGrassland NPPStudy AreaModel
Piao, S.L. (2002)121.39Qinghai PlateauCASA
Zhou, C.P. (2001)161.4Qinghai PlateauTEM
Zhao, G.S. (2011)102Qinghai ProvinceNPP—EMSC
Chen, Z.Q. (2012)135Qinghai PlateauGLO—PEM
Wo, X. (2014)162.87Three River SourceCASA
Wang, Y.H. (2022)138.5Qinghai ProvinceCASA
Disclaimer/Publisher’s Note: The statements, opinions and data contained in all publications are solely those of the individual author(s) and contributor(s) and not of MDPI and/or the editor(s). MDPI and/or the editor(s) disclaim responsibility for any injury to people or property resulting from any ideas, methods, instructions or products referred to in the content.