Article

Response of Fluorescence and Chlorophyll Physiological Characteristics of Typical Urban Trees to Ozone Stress

1
College of Forestry, Jiangxi Agricultural University/Laboratory of Forest Ecosystem Conservation and Restoration in Poyang Lake Basin, Nanchang 330045, China
2
Lu Mount Forest Ecosystem Positioning Research Station, Jiujiang 332900, China
3
Institute of Forestry and Pomology, Beijing Academy of Agriculture and Forestry Sciences, Beijing 100093, China
4
Guangdong Academy of Forestry, Guangdong Nanling Forest Ecosystem Positioning Observation and Research Station, Guangzhou 510520, China
5
Guangzhou Institute of Forestry and Landscape Architecture, Guangzhou 510520, China
6
Jiangxi Academy of Forestry, Nanchang 330032, China
*
Authors to whom correspondence should be addressed.
Atmosphere 2022, 13(11), 1885; https://doi.org/10.3390/atmos13111885
Submission received: 22 September 2022 / Revised: 7 November 2022 / Accepted: 8 November 2022 / Published: 11 November 2022
(This article belongs to the Special Issue Impact of Land-Use and Climate Change on Vegetation)

Abstract

:
In this study, four typical urban landscaping tree species were selected, three open top air chambers with different ozone concentrations were set, and the responses of chlorophyll fluorescence, chlorophyll content and relative conductivity of the trees to ozone stress were studied. The results showed that with the increase in ozone concentration, the maximum photochemical efficiency, electron transfer quantum yield, electron transfer rate (ETR) and chlorophyll content of the different tree species decreased significantly, while the relative conductivity of the different tree species increased significantly. Compared with the ozone concentration of NF, under an ozone concentration of nf40 and nf80, the decline in the rate of Fv/Fm of Koelreuteria paniculata and Ginkgo biloba was 2.47 and 2.28 times that of Pinus bungeana and Platycladus orientalis, respectively, and the increase in the rate of relative conductivity of K. paniculata and G. biloba was 2.11 and 1.28 times that of P. bungeana and P. orientalis, respectively. Under different ozone concentrations, the photochemical efficiency, electron transfer rate, chlorophyll content and relative conductivity of P. bungeana and P. orientalis were higher than those of Ginkgo biloba and K. paniculata, indicating that K. paniculata and G. biloba were more sensitive to ozone. This study is of great significance for improving urban environmental quality and ozone control and also provides a basis for selecting tree species with strong ozone tolerance.

1. Introduction

The maximum daily (8 h) average concentration of ozone in Beijing has increased from 91.7 nmol·mol−1 to 101.3 nmol·mol−1. Ozone has become the main source of air pollution in Beijing in summer. In May 2017, the Ministry of Environmental Protection reported to the media that, according to the latest air quality forecast results, the primary pollutant in Beijing, Tianjin and Hebei and their surrounding areas was ozone. In 2019, the levels of PM2.5, PM10, SO2, NO2, CO, etc., in 338 cities at the prefecture level and above in China decreased to varying degrees, which was in contrast with the fact that the concentration of ozone was 74 nmol·mol−1, up 6.5% year on year [1]. Tropospheric ozone is mainly generated by the photochemical reaction of precursors such as nitrogen oxides (NOx) and volatile organic compounds (VOCs). It is a secondary pollutant with strong oxidative toxicity and an important greenhouse gas. Ozone is mainly in the stratosphere and is incompatible with the troposphere where humans, animals and plants live [2]. The ozone in the stratosphere has the effect of isolating ultraviolet rays, which makes the earth’s creatures free from trouble. People also produce ozone by themselves, which is mainly used for food sterilization and water purification. However, when a large amount of ozone accumulates on the surface (troposphere) and reaches a certain concentration, it can have many adverse effects on plants. Vegetation plays an important role in the exchange of atmospheric components. On the one hand, forest vegetation can absorb particulate matter as well as pollutants such as ozone [1]; on the other hand, forest vegetation can also release oxygen and increase negative ions in the air, thereby purifying the atmospheric environment and improving environmental quality [3,4]. Stomatal respiration is one of the most important ways for ozone to enter plants. Stomatal restriction and non-stomatal restriction trigger a plant’s self-defense mechanism, stimulate its antioxidant system and membrane system, reduce plant light and capacity, change its nutrient absorption and distribution, and even induce changes in its gene expression [2]. However, the impact of ozone on plants is not unidirectional. Plants can also absorb ozone through stomatal respiration, which plays an important role in urban greening, but is also be affected in the absorption process. Therefore, in recent years, researchers at home and abroad have paid close attention to the impact of elevated ozone concentrations on plants.
In addition to changing the stomatal properties of trees, ozone stress also restricts the non-stomatal factors of leaves, which is mainly reflected in the decrease in chloroplast content caused by cell membrane damage [5], thus affecting the growth of trees. Gao et al. [6] pointed out that with the increase in ozone concentration, the chlorophyll fluorescence index and chlorophyll content decreased. In addition, ozone impeded photoelectron transfer, resulting in a significant decline in its rate. The stress test set by Xin et al. [7] with poplar as the research object showed that factors such as the electron transfer rate (ETR), excitation energy capture efficiency, photochemical quenching coefficient, maximum carboxylation rate and maximum electron transfer rate of the leaves of this kind of tree significantly decreased under ozone stress, while the intercellular CO2 concentration (Ci) significantly increased [8]. The properties of tree cell membranes also change under ozone stress. Ozone enters leaves through the stomata and cuticle, and a small part is consumed by antioxidant enzymes or non-enzymatic substances. The unconsumed ozone further attacks plant plasma membranes, causing increased membrane lipid permeability and inducing cell aging and death [9], while the rest further diffuses to the cell protoplast and reacts with the intracellular redox system to form a series of active plastids [10]. These active molecules further attack the cell membrane, resulting in the partial rupture of the cell membrane, electrolyte extravasation and membrane lipid peroxidation. Finally, the permeability of the cell membrane changes [11]. Cheng et al. [12] found that many plants in subtropical areas were damaged by ozone, which significantly increased the spectral reflectance of plant leaves, but significantly decreased their chlorophyll content. Liu et al. [13] found that the chlorophyll content and maximum photochemical efficiency of different plants showed a downward trend, but the relative conductivity and malondialdehyde content showed an upward trend through fumigation experiments with different ozone concentrations in Weigela florida, Forsythia suspensa and P. tabulaeformis. Guo et al. [14] selected 13 native tree species in South China for resistance testing and found that the increase in ozone concentration changed the membrane permeability of the leaf cell membrane. Most of the above studies were about the physiological characteristics of trees under ozone stress of a single plant, and most of them were shrubs and flowers, but few tree species have been studied, resulting in incomplete research on the physiological and biochemical characteristics of tree species under ozone stress. Therefore, this study analyzed the main physiological characteristics of different trees under ozone stress, such as photochemical efficiency, chlorophyll content and relative conductivity changes, to reveal the physiological and biochemical mechanism of urban trees adapting to ozone stress and provide reference for screening green plants with strong ozone resistance. The research results are of great significance for improving ozone pollution and purifying the atmospheric environment.

2. Research Method

2.1. Study Area

The research site selected for this study was located in the control room of the Beijing Botanical Garden. The whole park covers a large area 18 km away from the urban area. It is located at 39°48′ N, 116°28′ E, with an altitude of 76 m and belongs to temperate continental climate. The average annual temperature is 11.6 °C, with an average temperature of −3.7 °C in January and 26.7 °C in July. The extreme high temperature was 41.3 °C, the extreme low temperature was 17.5 °C, the annual precipitation was 634.20 mm and the relative humidity was 43~79%. There are more than 6000 types of plants in the Beijing Botanical Garden, including trees, shrubs and flowers, aquatic and terrestrial plants with different temperature zones and a small number of fruit trees. Common tree species include Pinus tabulaeformis, P. orientalis, etc. The main shrubs are Ligustrum lucidum, Berberis amurensis, etc.

2.2. Ozone Concentration Control

This study referred to the experimental design method of Chen et al. [15,16] and Zhang [17]. The method was completely in accordance with the article “study on translation water consumption and photosynthetic characteristics of landscape tree species under ozone stress” published in Atmosphere in 2022. Three ozone concentration gradients were set up by using the open top air chamber (OTC) method, NF (normal environment atmospheric ozone concentration), NF40 (normal atmospheric ozone concentration + 40 nmol·mol−1) and NF80 (normal atmospheric ozone concentration + 80 nmol·mol−1), and each gradient was repeated three times. The reason and basis for setting different ozone gradient concentrations in this way was that related studies have found that the threshold value of ozone-induced plant damage in conifers such as pine trees was between 150 ppb to 2 times the environmental concentration, while the threshold value of ozone-induced plant damage in broad-leaved trees such as ginkgo, poplar and birch was between 60 ppb to 1.4 and 1.7 times the environmental concentration [15]; the ozone concentration in Beijing is 60 nmol·mol−1 [15]. A total of nine OTCs were set up, and four landscaping species were selected. At the same time, the selection of tree species and the control of concentration also referred to the methods of other scholars [18,19,20]. Experimentation was carried out from 9:00 to 16:00 every day.
Three potted seedlings of P. bungeana, P. orientalis, K. paniculata and G. biloba were placed in each gas chamber. The seedlings were all 3 years old, because 3-year-old trees are in the early stage of growth and development, making the research results more significant [15]. Functional leaves at the top and lateral branches of each tree species were collected, with 10–20 leaves for each tree and 30–50 leaves for each tree species.

2.3. Determination Chlorophyll Fluorescence

The maximum photochemical quantum efficiency (Fv/Fm) of leaves under dark adaptation was measured by a portable fluorescence measurement system. At first, the leaves were acclimated for 30 min in a dark environment. Then, a modulated light (0.6 kHz) was turned on, and the values of (Fm), (Fv), (F0) and electron transfer quantum yield (ΦPsII) were measured. Finally, the maximum photochemical efficiency and electron transfer rate (ETR) were calculated and tested three per month from May to October. The average value of all tests was taken as the final result during the whole day of each test. The calculation formula is as follows:
F v F m = ( F m F 0 ) F m
E T R = Φ P S × P A R × 0.5 × 0.84 .
where Fv/Fm is the maximum photochemical efficiency, and Fm, Fv and F0 are the maximum fluorescence yield, the actual fluorescence yield at any time and the fixed fluorescence (initial fluorescence), respectively. ETR is the electron transfer rate, ΦPsII is the quantum yield of electron transfer and PAR is photosynthetic active radiation (μmol·m−2·s−1).

2.4. Determination of Chlorophyll Content

Chlorophyll content was measured by using a spectrophotometer. The leaves of four tree species were collected, about 50 mg, cut into pieces at about 4 °C and then soaked with 4 mL of 95% ethanol solution. The absorbance of different leaves after soaking at 664 nm, 648 nm and 470 nm was measured, respectively, and the chlorophyll content was calculated according to the modified formula of Lichtenthale [21]. This was tested three times per month from September to October, and the average value of all tests was taken as the final result during the whole day of each test.

2.5. Measurement of Relative Conductivity

In the OTC air chamber with different ozone concentrations, 2–4 leaves of different tree species were selected, the leaves were tested three times per month during the experiment, the leaves were cleaned with deionized water, 10–20 round pieces were punched with a diameter of 6 mm on the leaves with a punch, and this was repeated 3 times for each tree species. The average value of all tests was taken as the final result during the whole day of each test. The perforated leaves were put into a test tube with deionized water, a vacuum pump was used to extract air for 10–20 min, the leaves were taken out of the test tube and, after cooling for 60 min, a conductometer was used to measure the initial conductance value of the leaves of different tree species, represented by S1. Then, the test tubes were put into a boiling water bath for 10 min. The test tubes were then taken out, cooled to room temperature and shaken well, and the final conductivity value was measured, which is represented by S2.
L = S 1 S 2 × 100
where L is the relative conductivity (%) and S1 and S2 are the initial conductivity value and the final conductivity value, respectively.

2.6. Data Processing and Analysis

SPSS 26.0 was used to carry out the correlation analysis among the variables, single factor ANOVA was used for the analysis of variance, Pearson correlation index was calculated and the significance of the fluorescence characteristics, chlorophyll content and relative conductivity of the various tree species under ozone stress was analyzed.

3. Results and Analysis

3.1. Effects of Ozone Stress on the Maximum Photochemical Efficiency of Trees

With the increase in ozone concentration, the maximum photochemical efficiency (Fv/Fm) and electron transport quantum yield of the different tree species decreased (Figure 1), and there were significant differences between the different ozone treatments (p < 0.05). Under the control of the different ozone concentrations NF, NF40 and NF80, the Fv/Fm of P. bungeana was 0.79 ± 0.02, 0.76 ± 0.02 and 0.72 ± 0.03, respectively; the values of Fv/Fm of P. bungeana decreased by 3.66% and 9.58% under the ozone concentrations of NF40 and NF80, respectively. Under the control of the different ozone concentrations NF, NF40 and NF80, the values of Fv/Fm of P. orientalis were 0.86 ± 0.03, 0.79 ± 0.06 and 0.61 ± 0.23, respectively. Under the ozone concentrations NF40 and NF80, the values of Fv/Fm of P. orientalis decreased by 0.07 and 0.25, respectively. During the whole experiment, the value of Fv/Fm of P. orientalis decreased by 8.27% and 29.53%. Under the control of the different ozone concentrations NF, NF40 and NF80, the values of Fv/Fm of G. biloba were 0.84 ± 0.02, 0.65 ± 0.03 and 0.42 ± 0.01, respectively. Compared with NF, the values of Fv/Fm of G. biloba decreased by 0.19 and 0.49, respectively.

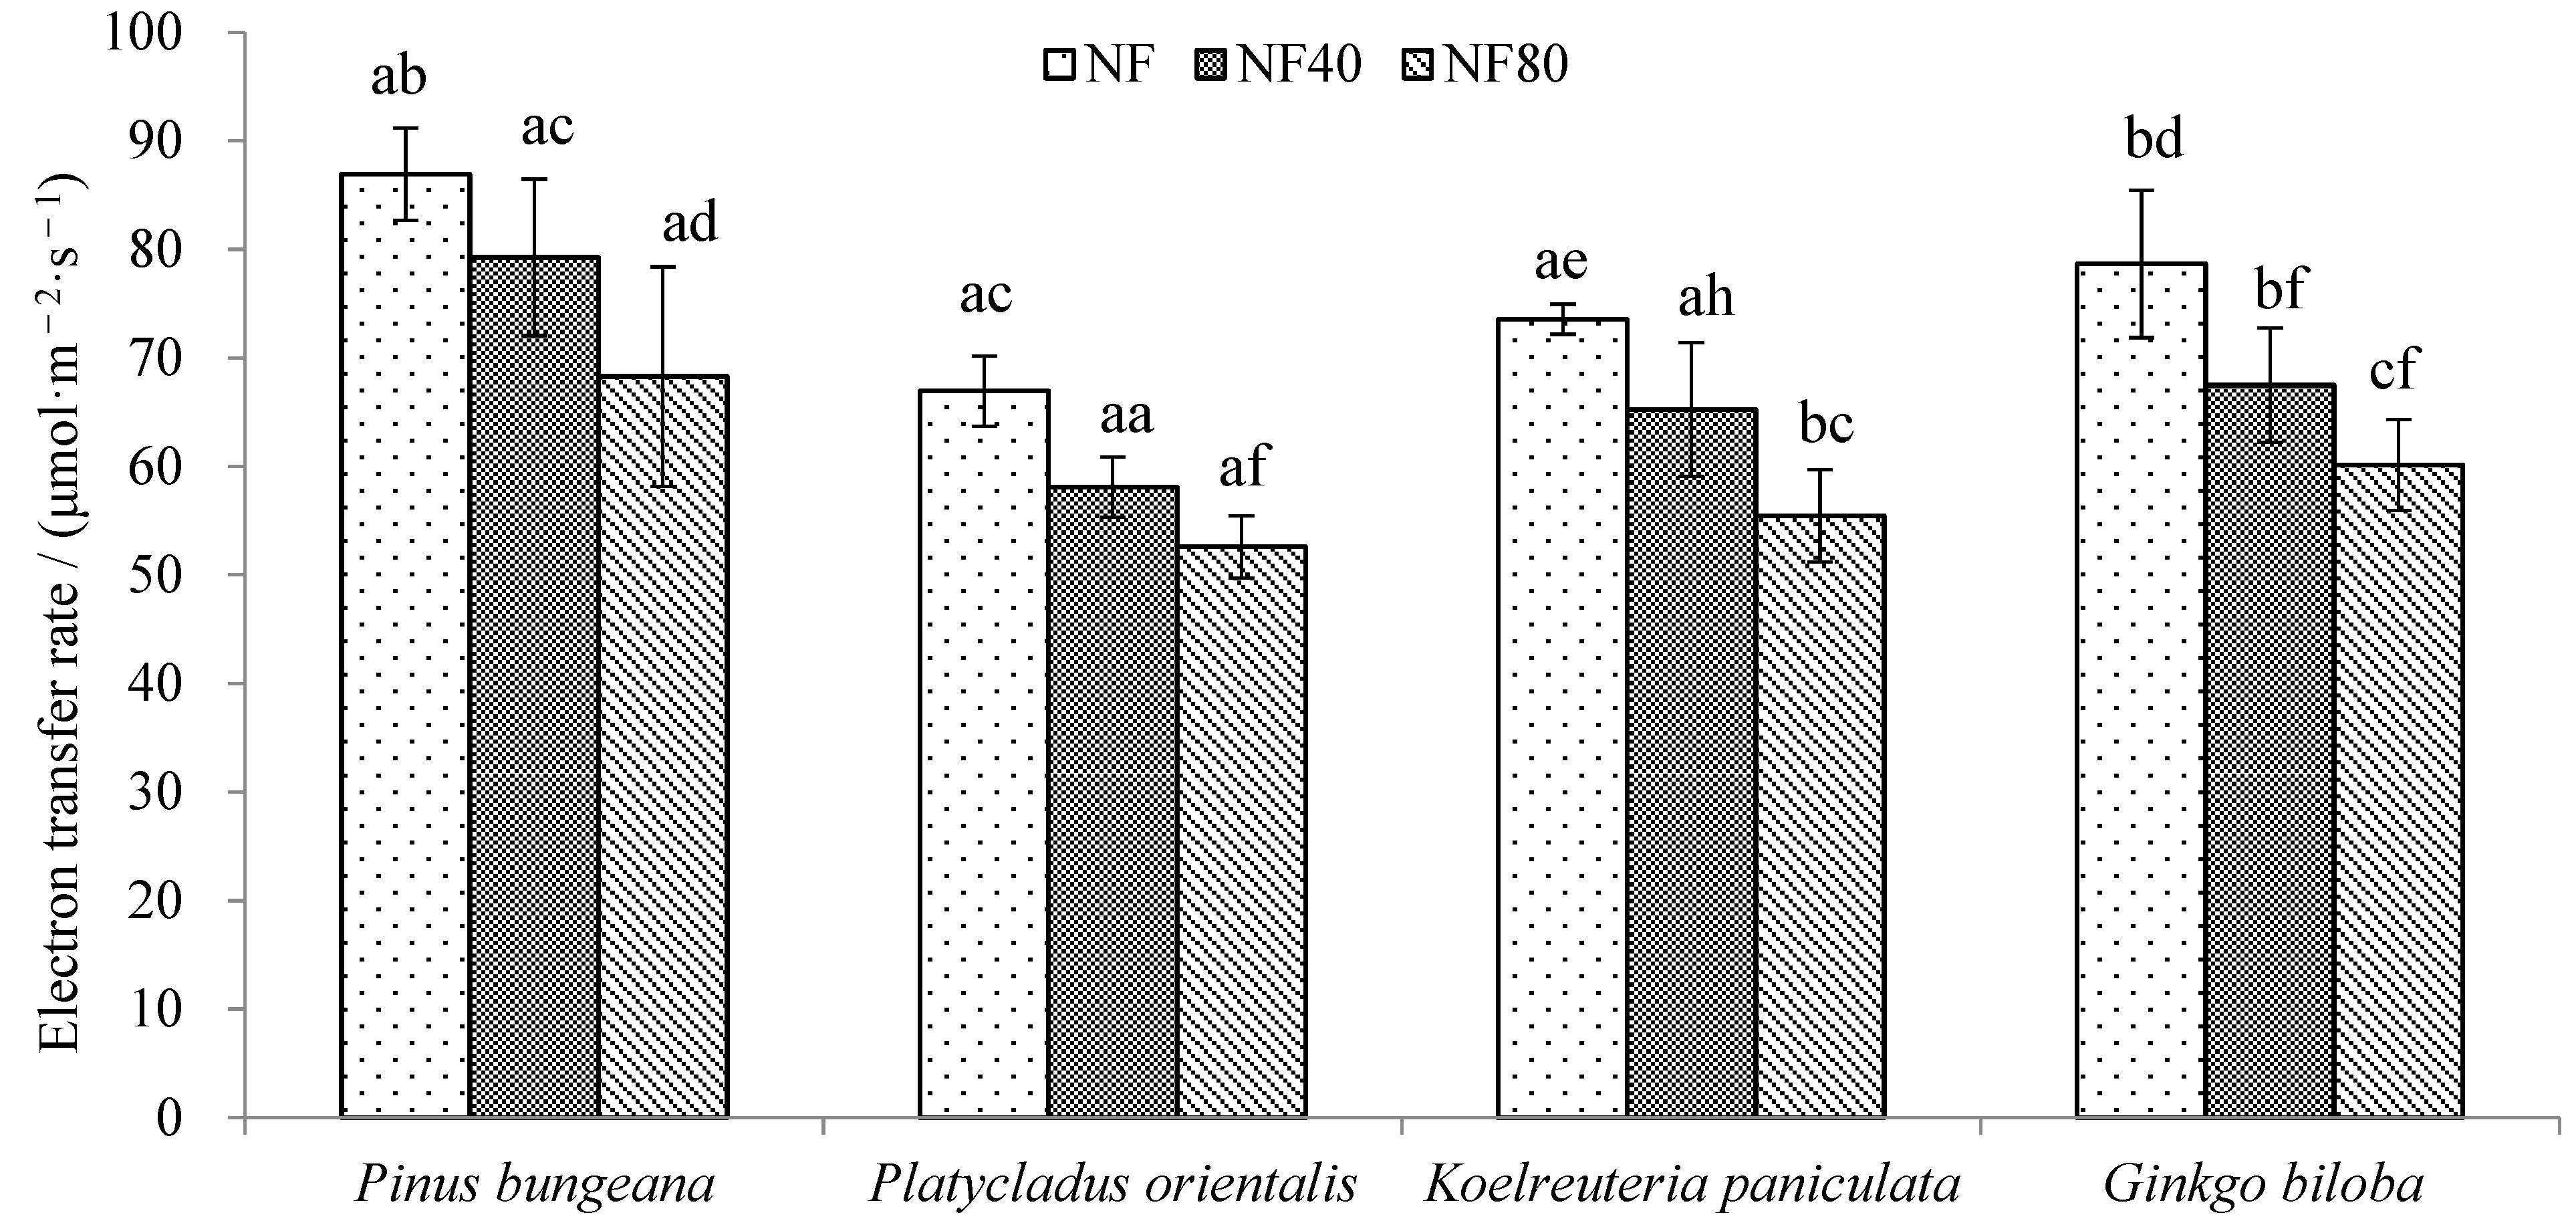
3.2. Response of tree Electron Transfer Rate (ETR) to Ozone Stress

The change in electron transfer rate (ETR) of the different tree species under ozone stress is shown in Figure 2. There were significant differences between the different ozone treatments (p < 0.05). The ETR of the different tree species decreased with the increase in ozone concentration. Under the control of the different ozone concentrations NF, NF40 and NF80, the values of ETR of P. bungeana were 86.92 ± 4.23 μmol·m−2·s−1, 79.25 ± 7.22 μmol·m−2·s−1 and 68.27 ± 10.13 μmol·m−2·s−1, respectively. Compared with the ozone concentration of NF, the values of ETR of P. bungeana decreased by 7.67 μmol·m−2·s−1 and 18.65 μmol·m−2·s−1, respectively. Under the control of the different ozone concentrations NF, NF40 and NF80, the ETR values of P. orientalis were 66.97 ± 3.23 μmol·m−2·s−1, 58.08 ± 2.77 μmol·m−2·s−1 and 52.58 ± 2.86 μmol·m−2·s−1, respectively. Compared with the ozone concentration of NF, the values of ETR of P. orientalis decreased by 8.88μmol·m−2·s−1 and 14.39 μmol·m−2·s−1, respectively. Under the control of the different ozone concentrations NF, NF40 and NF80, the values of ETR of K. paniculata were 73.56 ± 1.39 μmol·m−2·s−1, 65.23 ± 6.16 μmol·m−2·s−1 and 55.47 ± 4.24μmol·m−2·s−1, respectively. During the whole experiment, the values of ETR of K. paniculata decreased by 11.34% and 24.59%. Under the control of the different ozone concentrations NF, NF40 and NF80, the values of ETR of G. biloba were 78.66 ± 6.79 μmol·m−2·s−1, 67.48 ± 5.27 μmol·m−2·s−1 and 60.14 ± 4.18 μmol·m−2·s−1, respectively.

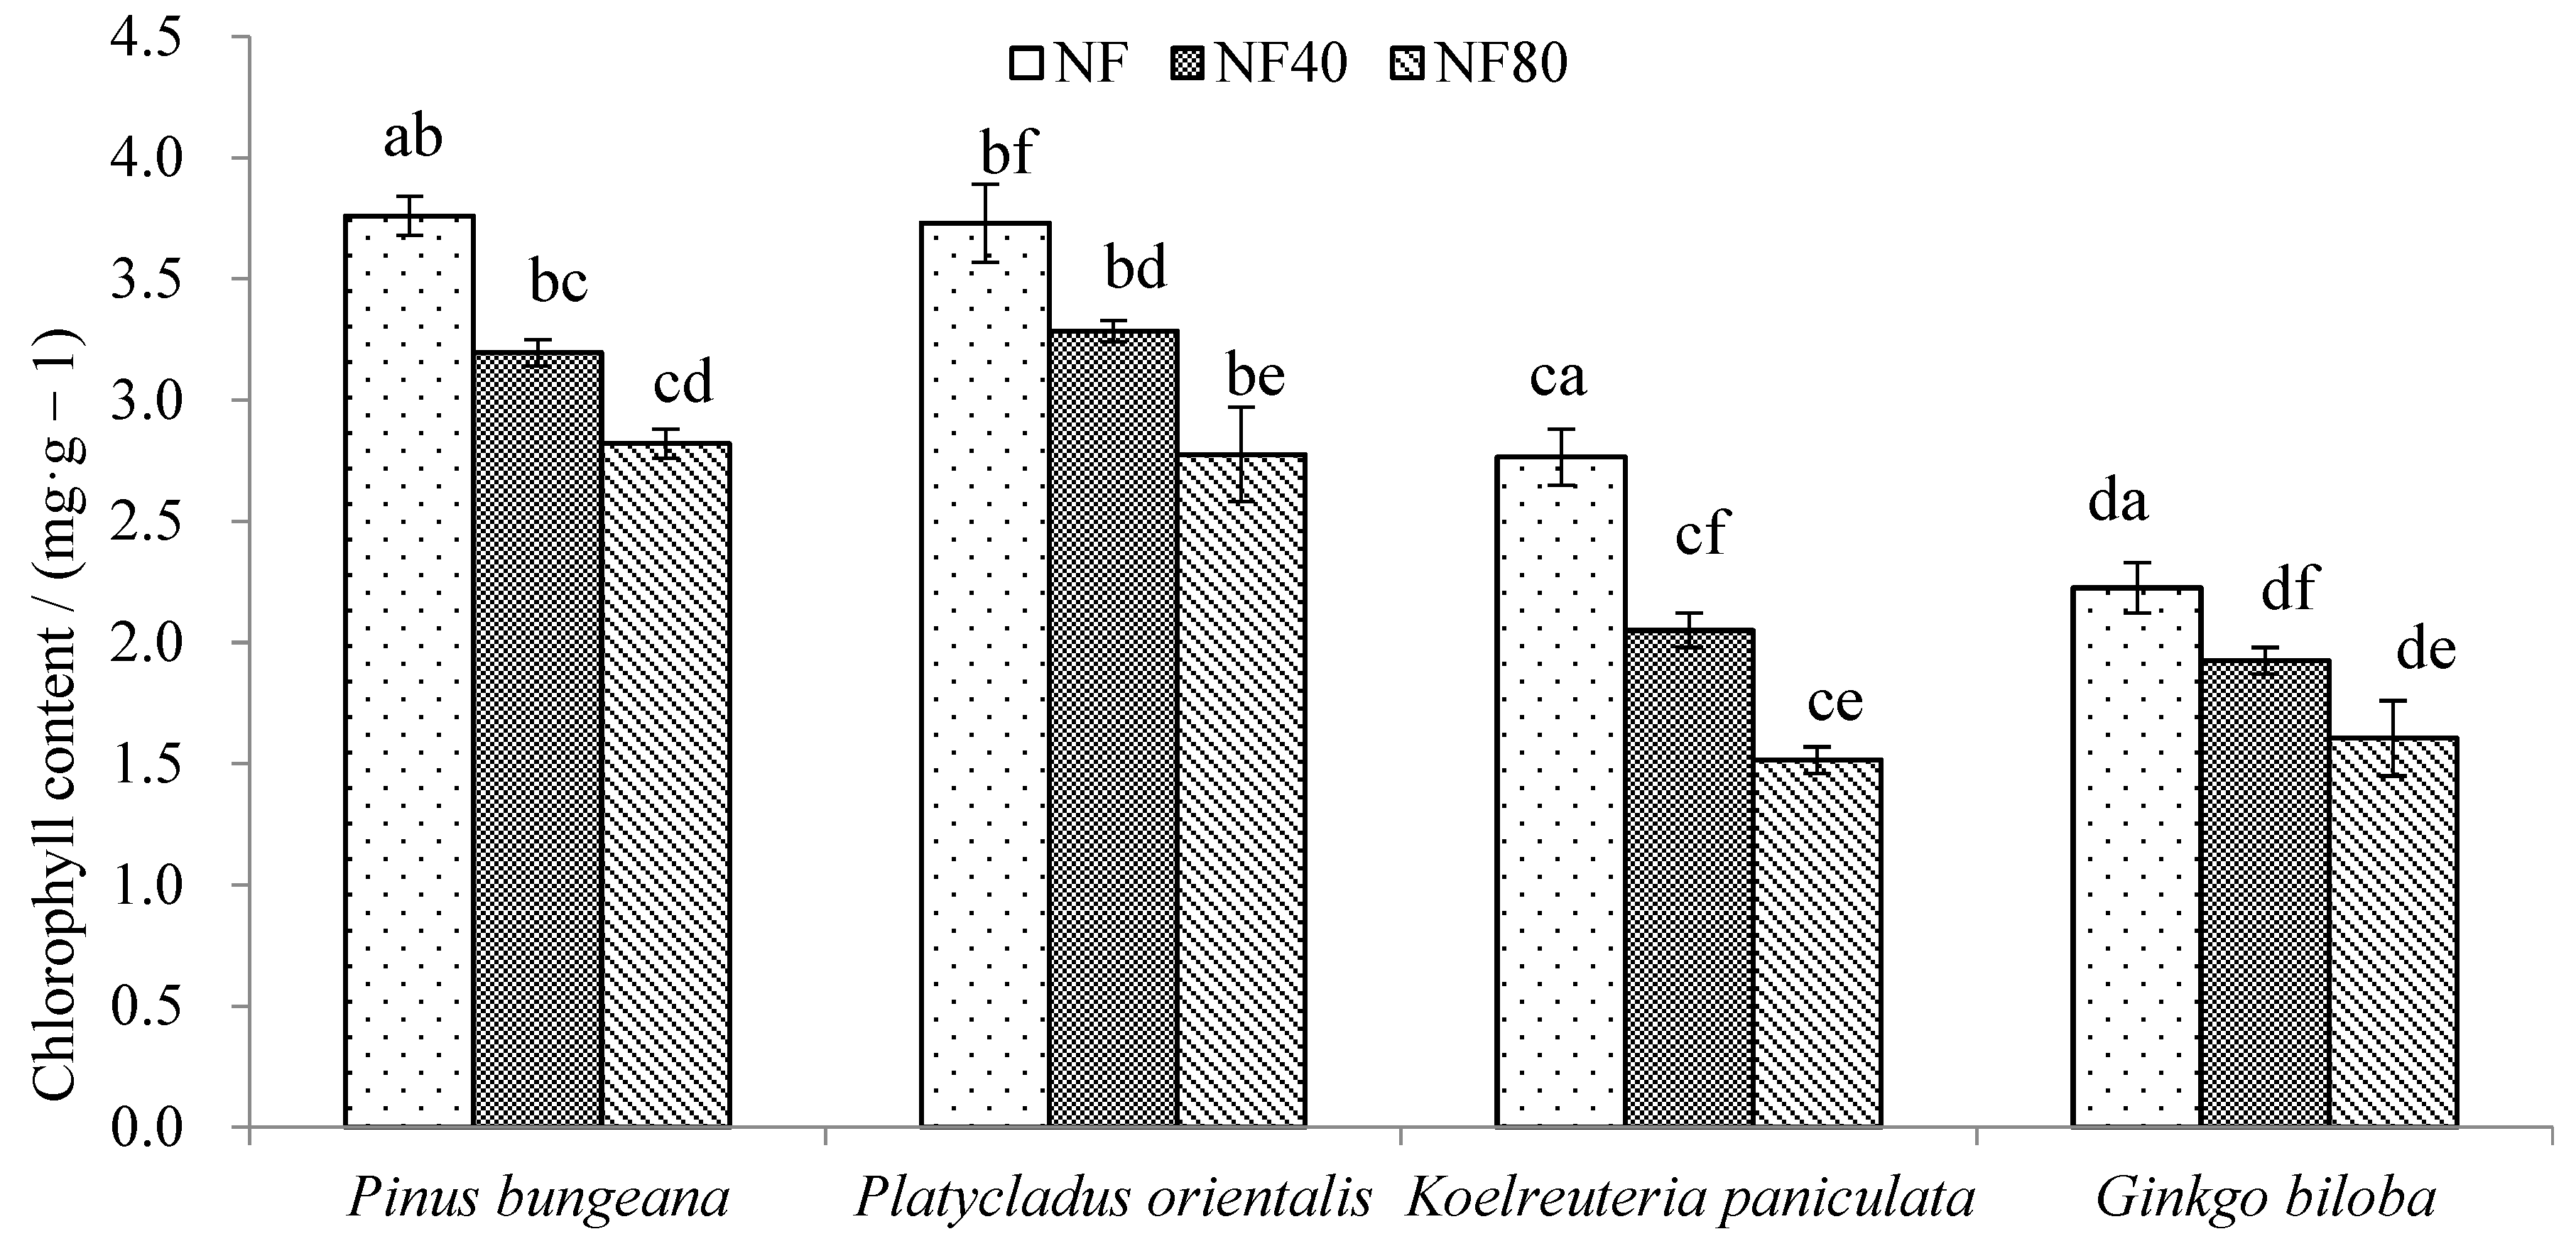
3.3. Response of Tree Chlorophyll Changes to Ozone Stress

The change in chlorophyll content of the different tree species under ozone stress is shown in Figure 3. There were significant differences between the different ozone treatments (p < 0.05). The chlorophyll content of the different tree species decreased with the increase in ozone concentration. Compared with the ozone concentration of NF, the chlorophyll content of P. bungeana decreased by 0.56 mg·g−1 and 0.84 mg·g−1 under the ozone concentrations of NF40 and NF80, respectively. Under the ozone concentrations NF, NF40 and NF80, the chlorophyll contents of P. orientalis were 3.73 ± 0.16 mg·g−1, 3.29 ± 0.04 mg·g−1 and 2.78 ± 0.20 mg·g−1, respectively. Under the NF40 and NF80 ozone concentrations, the chlorophyll content of P. orientalis decreased by 11.93% and 25.60% respectively. Under the ozone concentrations of NF, NF40 and NF80, the chlorophyll contents of K. paniculata were 2.77 ± 0.12 mg·g−1, 2.05 ± 0.07 mg·g−1 and 1.52 ± 0.06 mg·g−1, respectively. Under the ozone concentrations of NF40 and NF80, compared with the ozone concentration of NF, the chlorophyll contents of K. paniculata were reduced by 0.72 mg·g−1 and 1.25 mg·g−1, respectively. During the whole test period, the chlorophyll contents of K. paniculata decreased by 25.86% and 45.21%, respectively under the ozone concentrations of NF40 and NF80. The chlorophyll contents of G. biloba were 2.23 ± 0.11 mg·g−1, 1.93 ± 0.05 mg·g−1 and 1.61 ± 0.16 mg·g−1 under the control of the different ozone concentrations of NF, NF40 and NF80.

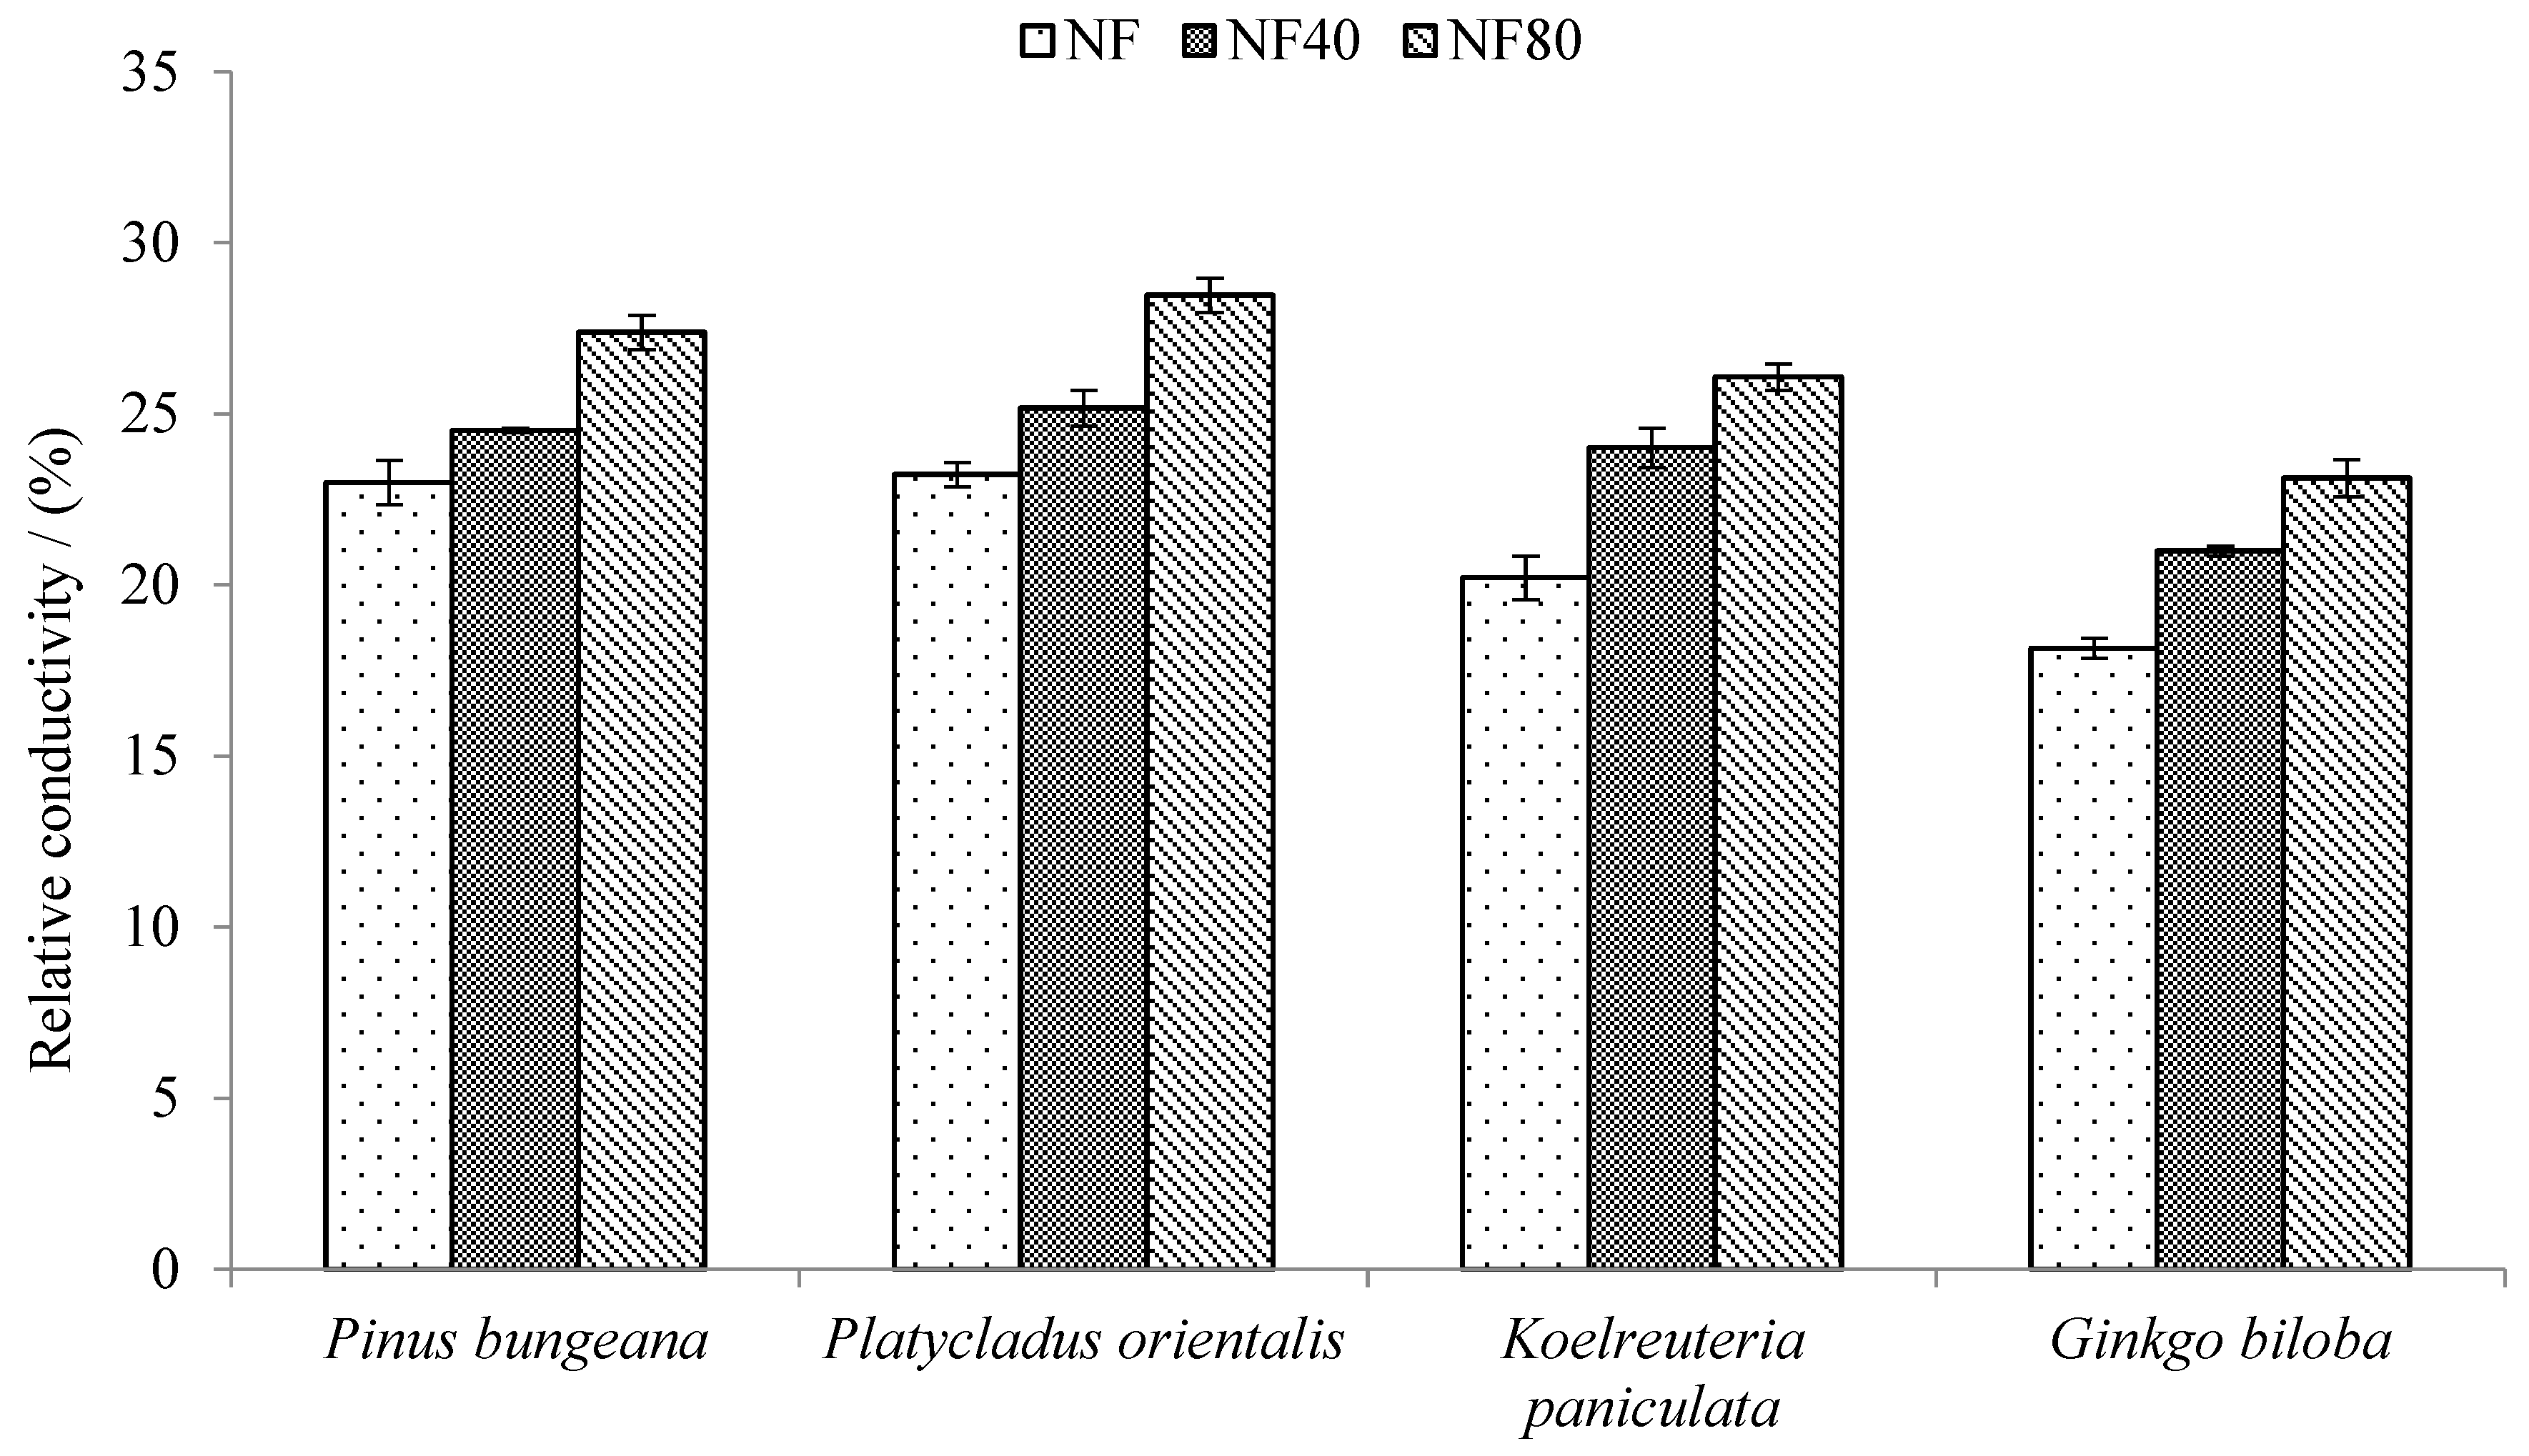
3.4. Response of Relative Conductivity of Trees to Ozone Stress

The relative conductivity of the four tree species increased with the increase in ozone concentration (Figure 4). There were significant differences between the different ozone treatments (p < 0.05). Under the different ozone concentrations, the values of relative conductivity of P. bungeana were 22.99 ± 0.65% (NF), 24.52 ± 0.06% (NF40) and 27.39 ± 0.51% (NF80). Under the ozone concentrations NF40 and NF80, the relative conductivity values of P. bungeana increased by 1.53% and 4.40%, respectively, compared with that of NF. During the whole experiment, the relative conductivity values of P. bungeana increased by 6.22% (NF40) and 16.05% (NF80). Under the control of the different ozone concentrations NF, NF40 and NF80, the values of relative conductivity of P. orientalis were 23.23 ± 0.35%, 25.17 ± 0.52% and 28.47 ± 0.50%, respectively. Under the ozone concentrations NF40 and NF80, the relative conductivity values of P. orientalis increased by 1.94% and 5.24%, respectively, compared with the ozone concentration of NF. During the whole experiment, the relative conductivity values of P. orientalis increased by 7.71% and 18.41% under the ozone concentrations of NF40 and NF80, respectively. Under the different ozone concentrations NF, NF40 and NF80, the relative conductivity values of K. paniculata were 20.21 ± 0.63%, 24.01 ± 0.57% and 26.08 ± 0.39%, respectively. Compared with the ozone concentration of NF, the relative conductivity value of K. paniculata increased by 3.80% and 5.87%, respectively. Under the different ozone concentrations NF, NF40 and NF80, the values of relative conductivity of G. biloba were 18.45 ± 0.30%, 21.00 ± 0.15% and 23.13 ± 0.55%, respectively.

4. Discussion

This study found that an increase in ozone could significantly reduce photosynthesis, hinder the photosynthetic electron transfer chain and reduce the chlorophyll fluorescence parameters electron transfer quantum yield and ETR. With the increase in the ozone concentration, the light energy used in the photochemical reactions of the plants was reduced, and at the same time, the heat dissipation was increased [22,23,24]. Flower et al. [25] also used OTC to control the ozone concentration and found that the value of Fv/Fm of plants obviously decreased under different ozone concentrations, and they pointed out that ozone mainly caused the decrease in the value of Fv/Fm by reducing the fixed maximum fluorescence (Fm) [26]. In this study, the same results were obtained. When the ozone concentration increased, the chlorophyll fluorescence parameters of the four tree species decreased. The values of Fv/Fm of the different tree species decreased by 3.66–22.71% under the ozone concentration of NF40 and by 9.58–50.12% under the ozone concentration of NF80. The ETR values of the different tree species also decreased with the increase in ozone concentration, the reason being that with the increase in ozone concentration, the light energy capture ability of the plants decreased, resulting in a decrease in the light energy utilization efficiency of the plants, which was also related to the decrease in chlorophyll content [27,28]. The increase in ozone concentration reduced the light energy used by the plants for photochemical reactions and at the same time caused an increase in heat dissipation. Ozone mainly causes a decrease in the values of Fv/Fm by reducing the maximum fluorescence (Fm), and the inhibition degree of broad-leaved trees is higher under ozone treatment [1]. This study also confirmed this, as G. biloba and K. paniculata had a higher ETR decline rate. The ETR values also decreased significantly because the absorbed light quantum was converted into heat energy and dissipated by the plants, which was also related to the obstruction of electron transfer and energy conversion and the damage to photosynthetic structure.
Ozone can cause chlorophyll decomposition, change the chloroplast structure [29] and accelerate leaf senescence [17]. The chlorophyll content of Pinus elliottii [30] and Cinnamomum camphora [10] decreased significantly under ozone stress. In this study, it was found that when the ozone concentration increased, the chlorophyll content of the different tree species decreased significantly, and there was a negative correlation with ozone concentration. Under the ozone concentrations of NF40 and NF80, the chlorophyll content decreased, the reason being that when the plants were damaged by ozone, the chlorophyll content and components in the plants changed, which led to chlorophyll degradation [31]. Therefore, the photosynthesis rate of plants decreased, and the photosynthesis rate and metabolism of the plants slowed down, resulting in senescence of the plant leaves [7]. This was consistent with the research results of Zhang et al. [32], and further demonstrates the correctness of the conclusions of this study. At the same time, related studies also found that an increase in ozone concentration damaged the chloroplast envelope of trees [33], which weakened the chloroplast function and caused chloroplast function loss [17].
The relative conductivity affects the damage degree of plant cell membranes. By measuring the change in the value of relative conductivity of different plants, the damage degree and sensitivity of the plant membrane system can be indirectly determined [34]. This study showed that with the increase in ozone concentration, the relative conductivity of the different plants increased. Under the ozone concentrations NF40 and NF80, the relative conductivity of P. bungeana increased by 1.53% and 4.40%, that of P. orientalis increased by 1.94% and 5.24%, that of K. paniculata increased by 3.80% and 5.87%, and that of Ginkgo biloba increased by 13.55% and 21.51%, respectively. This was because under the influence of a high ozone concentration, the cell membranes of the plants were damaged, and the membrane permeability was increased, thereby increasing the relative conductivity. Under the ozone concentrations NF40 and NF80, the increase in the rate of relative conductivity of K. paniculata and Ginkgo biloba was 2.11 and 1.28 times that of P. bungeana and P. orientalis, respectively, which indicated that K. paniculata and G. biloba were more sensitive to ozone, and P. bungeana and P. orientalis had strong ozone resistance.

5. Conclusions

In this study, it was found that the maximum photochemical efficiency (Fv/Fm), electron transfer quantum yield, electron transfer rate (ETR) and chlorophyll content of different tree species decreased significantly with an increase in ozone concentration, while the relative conductivity of different tree species increased significantly with an increase in ozone concentration. The photochemical efficiency, electron transfer rate, chlorophyll content and relative conductivity of P. bungeana and P. orientalis were higher than those of G. biloba and K. paniculata under the different ozone concentrations. The effect of elevated ozone concentrations on the plants’ physiological characteristics was more obvious in G. biloba and K. paniculata, and K. paniculata and G. biloba were more sensitive to elevated ozone concentrations.

Author Contributions

Conceptualization, Y.L. and B.C.; methodology, Y.L., Y.G. and B.C.; software, Y.G., Y.T. and C.C.; validation, Y.W., W.D. and Q.C.; writing—original draft preparation, Y.G. and Y.T; writing review and editing, Y.L. and B.C.; supervision, Y.G and X.Y.; funding acquisition, Y.L. All authors have read and agreed to the published version of the manuscript.

Funding

This work was financially supported by the National Natural Science Foundation of China “forest convalescent elements and their mechanism of action” (31660230) and the Youth fund of Beijing Academy of Agricultural and Forestry Sciences (QNJJ202017).

Conflicts of Interest

The authors declare no conflict of interest.

References

  1. Xu, J.J. Effect of Ozone Stress on the Physiological and Root Characteristics of Greening Tree Species; Hebei Agriculture University: Baoding, China, 2022. [Google Scholar]
  2. Chen, B.; Yang, X.B.; Xu, J.J. Spatio-temporal variation and influencing factors of ozone pollution in Beijing. Atmosphere 2022, 13, 359. [Google Scholar] [CrossRef]
  3. Chen, B.; Lu, S.W.; Li, S.N. Ozone uptake characteristics in different dominance hierarchies of poplar plantation. J. Beijing For. Univ. 2015, 37, 29–36. [Google Scholar]
  4. Wang, H.; Ouyang, Z.Y.; Ren, Y.F.; Zhang, H.X.; Wang, X.K.; Hao, S.Q.; Guan, Y.F.; Gao, F.Y. Ozone uptake at the canopy level in Robinia pseudoacacia in Beijing based on sap flow measurements. Acta Ecol. Sin. 2013, 33, 7323–7331. [Google Scholar] [CrossRef] [Green Version]
  5. Chen, B. Effects of Ozone Stress on the Growth and Physiological Characteristics of Four Tree Species; Beijing Forestry University: Beijing, China, 2018. [Google Scholar]
  6. Gao, F.; Li, P.; Feng, Z.Z. Interactive effects of ozone and drought stress on plants: A review. Chin. J. Plant Ecol. 2017, 41, 252–268. [Google Scholar]
  7. Xin, Y. Effects of Ozone on the Photosynthetic Physiology and Growth of Populus cathayana under Nitrogen Deposition; University of Chinese Academy of Sciences: Beijing, China, 2016. [Google Scholar]
  8. Xin, Y.; Gao, F.; Feng, Z.Z. Photosynthetic Characteristics and Ozone Dose-response Relationships for Different Genotypes of Poplar. Environ. Sci. 2016, 37, 2359–2367. [Google Scholar]
  9. Vollenweider, P.; Ottiger, M.; Güthardt-Goerg, M.S. Validation of leaf ozone symptoms in natural vegetation using microscopical methods. Environ. Pollut. 2003, 124, 101–118. [Google Scholar] [CrossRef]
  10. Niu, J.F. Effects of Elevated Ozone and Nitrogen Deposition on the Growth and Physiology of Cinnamomum Camphora Seedlings; Chinese Academy of Sciences: Beijing, China, 2012. [Google Scholar]
  11. Xin, Y.; Shang, B.; Chen, X.L.; Feng, Z.Z. Effects of elevated ozone and nitrogen deposition on photosynthetic characteristics and biomass of Populus cathayana. Environ. Sci. 2016, 37, 3642–3649. [Google Scholar]
  12. Cheng, X.Y.; Luo, C.W.; Liu, J.Q.; Zhou, Y.S.; Meng, S.W. Influence of ozone stress on spectral characteristics and chlorophyll content of woody plant leaves. Environ. Sci. Technol. 2017, 40, 1–8. [Google Scholar]
  13. Liu, D.H.; Zhao, S.W.; Wang, X.Q.; Fan, J.L. The effect of ozone on the leaf damage symptom and Physiological characteristics of landscape plants. Chin. Ornam. Hortic. Res. Prog. 2015, 507–512. [Google Scholar]
  14. Guo, C.L.; Jiang, J. Effect of ozone fumigation on membrane permeability of 13 native tree species. J. Green Sci. Technol. 2019, 118–119. [Google Scholar]
  15. Chen, B.; Song, Q.F.; Pan, Q.H. Study on Transpiration water consumption and photosynthetic characteristics of landscape tree species under ozone stress. Atmosphere 2022, 13, 1139. [Google Scholar] [CrossRef]
  16. Chen, B.; Xu, J.J.; Liu, D.H.; Yang, X.B. Response of Ginkgo biloba growth and physiological traits to ozone stress. Glob. Ecol. Conserv. 2022, 34, e02020. [Google Scholar] [CrossRef]
  17. Zhang, W.W. Effect of Elevated Ozone Level on Native Tree Species in Subtropical China; Research Center of Ecological Environment, Chinese Academy: Beijing, China, 2011. [Google Scholar]
  18. Wang, X.N.; Agathokleous, E.; Qu, L.Y.; Watanabe, M.; Koike, T. Effects of CO2 and O3 on the interaction between root of woody plants and ectomycorrhizae. J. Agric. Meteorol. 2016, 72, 95–105. [Google Scholar] [CrossRef] [Green Version]
  19. Xu, W.Y.; Qi, S.Y.; He, X.Y.; Chen, W.; Zhao, G.L.; Zhou, Y. Effects of elevated CO2 and O3 concentrations on quantitative characteristics of mature leaf stomata in Ginkgo biloba. Chin. J. Ecol. 2008, 27, 1059–1063. [Google Scholar]
  20. Li, P.; Feng, Z.Z.; Shang, B.; Yuan, X.Y.; Dai, L.L.; Xu, Y.S. Stomatal characteristics and ozone dose-response relationships for six greening tree species. Acta Ecol. Sin. 2018, 38, 2710–2721. [Google Scholar]
  21. Li, L. The Effects of Elevated Ozone on Growth and Physiology of Acer truncatum under Drought Stress; University of Chinese Academy of Sciences: Beijing, China, 2016. [Google Scholar]
  22. Feng, Z.Z.; Li, P.; Yuan, X.Y.; Gao, F.; Jiang, L.J.; Dai, L.L. Progress in ecological and environmental effects of ground-level O3 in China. Acta Ecol. Sin. 2018, 38, 1530–1541. [Google Scholar]
  23. Hoshika, Y.; Watanabe, M.; Inada, N.; Koike, T. O3-induced stomatal sluggishness develops progressively in siebold’s beech (Fagus crenata). Environ. Pollut. 2012, 166, 152–156. [Google Scholar] [CrossRef] [Green Version]
  24. Wang, Y.; Zhang, Y.; Hao, J.; Luo, M. Seasonal and spatial variability of surface ozone over China: Contributions from background and domestic pollution. Atmos. Chem. Phys. Discuss. 2010, 10, 27853–27891. [Google Scholar] [CrossRef] [Green Version]
  25. Flowers, M.D.; Fiscus, E.L.; Burkey, K.O.; Booker, F.C.; Dubois, J.B. Photosynthesis, chlorophyll fluorescence, and yield of snap bean (Phaseolus vulgaris) genotypes differing in sensitivity to ozone. Environ. Exp. Bot. 2007, 61, 190–198. [Google Scholar] [CrossRef]
  26. Cao, J.L.; Zhu, J.G.; Zeng, Q.; Li, C.H. Research advance in the effect of elevated O3 on characteristics of photosynthesis. J. Biol. 2012, 26, 66–70. [Google Scholar]
  27. Liang, J.; Zeng, Q.; Zhu, J.G.; Xie, Z.B.; Liu, G.; Tang, H.Y. Review of indexes for evaluating plant response to elevated near-surface ozone concentration. Chin. J. Eco-Agric. 2010, 18, 440–445. [Google Scholar] [CrossRef]
  28. Wang, L.; Zeng, Q.; Feng, Z.Z.; Zhu, J.G.; Tang, H.Y.; Chen, X.; Xie, Z.B.; Liu, G.; Kobayashi, K. Photosynthetic Damage induced by elevated O3 in two varieties of winter wheat with free air controlled enrichment approach. Environ. Sci. 2009, 30, 527–534. [Google Scholar]
  29. Kivimäenpää, M.; Sutinen, K.; Calatayud, V.; Sanz, M.J. Visible and microscopic needle alterations of mature Aleppo pine (Pinus halepensis) trees growing on an ozone gradient in eastern Spain. Tree Physiol. 2010, 30, 541–554. [Google Scholar] [CrossRef] [PubMed] [Green Version]
  30. Zhang, W.W.; Niu, J.F.; Wang, X.K.; Tian, Y.; Yao, F.F.; Feng, Z.Z. Effects of ozone exposure on growth and photosynthesis of the seedlings of Liriodendron Chinese, a native tree species of subtropical China. Photosynthetica 2011, 49, 29–36. [Google Scholar] [CrossRef]
  31. Feller, U.; Anders, I.; Mae, T. RuBiscolytics: Fate of RuBisco after its enzymatic function in a cell is terminated. J. Exp. Bot. 2008, 59, 1615–1624. [Google Scholar] [CrossRef] [Green Version]
  32. Zhang, W.W.; Feng, Z.Z.; Wang, X.K.; Niu, J.F. Impacts of elevated ozone on growth and photosynthesis of Metasequoia glyptostroboides Hu et Cheng. Plant Sci. 2014, 226, 182–188. [Google Scholar] [CrossRef]
  33. Wustman, B.A.; Oksanen, E.; Karnosky, D.F.; Noormets, A.; Isebrands, J.G.; Pregitzer, K.S.; Hendrey, G.R.; Sober, J.; Podila, G.K. Effects of elevated CO2 and O3 on aspen clones of varying O3 sensitivity. Dev. Environ. Sci. 2001, 3, 391–409. [Google Scholar]
  34. Liu, D.H.; Zhao, S.W.; Kang, W.J.; Wang, S.Y.; Wu, B.J. Comparation of injury on leaf adaxial and abaxial sides in Hosta plantaginea induced by ozone. Plant Physiol. J. 2015, 51, 2039–2046. [Google Scholar]
Figure 1. Changes in photochemical efficiency of trees under different ozone concentrations. Different letters indicate that there are significant differences between different ozone treatments (p < 0.05).
Atmosphere 13 01885 g001
Figure 2. Changes in electron transfer rate of trees under different ozone concentrations. Different letters indicate that there are significant differences between different ozone treatments (p < 0.05).
Atmosphere 13 01885 g002
Figure 3. Effect of increasing ozone concentration on chlorophyll content of trees. Different letters indicate that there are significant differences between different ozone treatments (p < 0.05).
Atmosphere 13 01885 g003
Figure 4. The variation in trees’ relative conductivity under different OZONE concentrations.
Atmosphere 13 01885 g004
Publisher’s Note: MDPI stays neutral with regard to jurisdictional claims in published maps and institutional affiliations.