Article

Analysis and Research on Chaotic Dynamics of Evaporation Duct Height Time Series with Multiple Time Scales

1
School of Marine Sciences, Nanjing University of Information Science and Technology, Nanjing 211544, China
2
Longshan College, Nanjing University of Information Science and Technology, Nanjing 211544, China
*
Author to whom correspondence should be addressed.
Atmosphere 2022, 13(12), 2072; https://doi.org/10.3390/atmos13122072
Submission received: 2 October 2022 / Revised: 30 November 2022 / Accepted: 6 December 2022 / Published: 9 December 2022
(This article belongs to the Section Atmospheric Techniques, Instruments, and Modeling)

Abstract

:
The evaporation duct is a particular type of atmospheric structure that always appears on the open ocean. Predicting the evaporation duct height (EDH) accurately and in a timely manner is of great significance for the practical application of marine wireless communication equipment. Understanding the characteristics of EDH time series is an essential prerequisite for establishing an appropriate prediction model. Moreover, the sampling timescales of EDH data may influence the dynamic characteristics of the EDH time series as well. In this study, EDH time series datasets at three timescales, hourly, daily, and monthly, were constructed as the case study. Statistical methods, namely the augmented Dickey–Fuller test and Ljung–Box test, were adopted to verify the stationary and white noise characteristics of the EDH time series. Then, rescaled range analysis was applied to calculate the Hurst exponent to study the fractal characteristics of the EDH time series. An extensive analysis and discussion of the chaotic dynamics of the EDH time series are provided. From the perspective of nonlinear dynamics, the phase space was constructed from the time delay τ and embedding dimension m, which were calculated from the mutual information method and the Grassberger–Procaccia algorithm, respectively. The maximum Lyapunov exponent was also calculated by the small data volume method to explore the existence of chaos in the EDH time series. According to our analysis, the EDH time series are stationary and have a non-white noise characteristic. The Hurst exponents for all three timescales were greater than 0.5, indicating the predictability of the EDH time series. The phase space diagrams exhibited strange attractors in a well-defined region for all the timescales, suggesting that the evolution of the EDH time series can possibly be explained by deterministic chaos. All of the maximum Lyapunov exponents were positive, confirming the chaos in the EDH time series. Further, stronger chaotic characteristics were found for the finer-resolution time series than the coarser-resolution time series. This study provides a new perspective for scholars to understand the fluctuation principles of the evaporation duct at different timescales. The findings from this study also lay a theoretical and scientific foundation for the future application of chaotic prediction methods in the research on the evaporation duct.

1. Introduction

The evaporation duct is a particular atmospheric structure, which results from the rapid change of moisture with height at the lower interface of the marine atmospheric boundary layer (MABL) [1]. The evaporation duct has a anomalous refractivity profile structure. From the sea surface to a certain height, the refractivity decreases gradually until it reaches a local minimum. This height is referred to as the evaporation duct height (EDH). Then, as the height continues to increase, the refractivity keeps increasing from the local minimum. This unique refractivity profile structure allows the evaporation duct to trap electromagnetic (EM) waves and extend the EM propagation over the horizon [2]. This phenomena is also known as the ducting effect. The EDH is a significant parameter for the practical quantitative evaluation of the ducting effect. Therefore, understanding the variations of the EDH precisely over time is critical for the effective application of marine radio equipment, and this has always been the focus of the research on the evaporation duct [3,4,5].
Currently, the research on the EDH falls into two broad categories: research on the data acquisition methods for the EDH and research on the spatio-temporal characteristics of the distributions of the EDH based on the acquired data. The data acquisition methods for the EDH can be further divided into in situ measurement methods and physics-based model methods. There are two types of in situ measurement methods: direct measurement and inversion measurement. For the direct measurement, microwave refractometers or meteorological gradient towers are primarily used [6,7,8]. According to the physical parameters applied in the inversion, the inversion methods can be classified as radar sea clutter inversion [9,10,11], reflected Global Navigation Satellite System (GNSS) signal inversion [12,13,14], or path loss inversion [15,16,17]. There are many challenges involved in the in situ measurement of the EDH [18,19,20,21]. First, since the atmospheric humidity rapidly changes from the saturated state at the sea surface to the background levels within a few centimeters above the sea, it is difficult to accurately capture this process. Secondly, since the sea surface is always fluctuating, the sea surface height used in research is typically the statistical average of the height values over a period of time, rather than the value at a certain instant. Again, due to the influence of turbulence, a single measurement will be impacted by the atmospheric fluctuations. Therefore, taking the average of multiple measurements has been adopted to attenuate the impact of these fluctuations. In practice, however, measurement equipment is difficult to deploy and operate. All of these factors restrict the wider application of in situ measurement.
The physics-based model methods are the dominant one to obtain the EDH compared to in situ measurements [22]. These methods employ the Monin–Obukhov surface layer similarity theory to simulate the profile distributions of the atmospheric temperature, atmospheric pressure, and saturated water vapor pressure using the sea surface temperature and some meteorological elements (i.e., air temperature, atmospheric pressure, wind speed, and relative humidity) at fixed altitudes. Then, the modified refractivity profiles of the evaporation duct are obtained, as well as the EDH values. Depending on how the Monin–Obukhov scale parameters are calculated, the physics-based models can generally be divided into two categories. The first type uses the empirical relationship between the Richardson number and the Monin–Obukhov length to calculate the relevant scale parameters [23]. The second uses an iterative algorithm derived from the empirical air–sea flux principles proposed by Liu, Katsaros, and Businger [24], hence also referred to as the LKB model [25]. The LKB model provides a framework for calculating the refractivity profiles of the evaporation duct, that is using the sea surface temperature, air temperature, atmospheric pressure, wind speed, and relative humidity at a certain height, combined with the air–sea flux coupling relationship to calculate the parameters of the Monin–Obukhov correlation scale iteratively. Then, these parameters are used to obtain the temperature, atmospheric pressure, specific humidity profiles, and finally, the refractivity profiles. Since then, based on the LKB model framework, researchers have proposed a series of models [26,27,28,29,30]. The data of the air–sea variables are also obtained from different sources, for example from numerical weather prediction (NWP) [31,32].
Based on the collection of the EDH data, there has been additional extensive research examining the spatio-temporal characteristics of the evaporation duct over the globe [33,34] and some regional seas [2,35,36,37,38]. Most of these studies focused on the climatological features and performed various statistical analysis on the annual, seasonal, monthly, daily, diurnal, and hourly EDH time series. Various statistics have been constructed to study the historical variations of the EDH. Among these works, only the principles of how the historical data vary have been discussed. While conducting in-depth research on the historical data, it is also possible to use these historical data to predict the future variations based on the time series theory. More recently, some scholars have taken the time series (TS) characteristics of the EDH data into account and proposed some prediction models for the EDH based on the TS theory. Javeed et al. [39] proposed a modified artificial-neural-network (ANN)-based model to predict the refractivity. Mai et al. [40] applied the Darwinian evolutionary algorithm to realize the short-term prediction of the EDH. Zhao et al. [41] proposed a pure data-driven back propagation neural network (BPNN) EDH prediction model. Hong et al. [42] proposed a seasonal autoregressive integrated moving average (ARIMA) model to fit and forecast the monthly EDH time series data. Yanez [43] explored the applications of several artificial intelligence/machine learning (AI/ML) algorithms, including linear regression, decision trees, random forest, and neural networks, in nowcasting the EDH. Zhao et al. [44] and Han et al. [45] constructed EDH prediction models based on the long short-term memory (LSTM) neural network, respectively. According to the above introduction of the current research status, some progress has been made in the EDH prediction models based on time series theory. However, these works have not analyzed the characteristics of EDH time series in detail, and the models lack a theoretical support.
In order to forecast the EDH, it is necessary to determine whether the EDH time series is predictable and what the predicted scale is. These problems can be solved by fractal theory. Fractal theory has been proven to be very powerful in mining the hidden trends of time series data. Some excellent examples where fractal theory has been successfully applied have been given for air temperature time series [46], air contamination time series [47], atmospheric carbon emission time series [48], precipitation [49], and so on. This can provide a basis for analyzing the rationality of existing EDH time series modeling methods and laying the foundations for applying time series theory to EDH prediction. Thus, the fractal properties of EDH time series are explored in this study, along with detailed descriptions of their fractal characters at various timescales. The evaporation duct derives from the complex air–sea interactions. EDH time series display a high degree of nonlinearity and uncertainty [42]. Considering this, it is difficult to precisely grasp the inherent characteristics and evolution law in EDH time series. There is a similarity between the evaporation duct and the oceanic chaotic system. Nonlinear chaotic systems appear to be random and irregular, but they are actually governed by laws and order [50]. Observing nonlinear dynamic behavior can also reveal some important internal laws of time series [51]. With chaos theory, EDH predictions will be more accurate and objective because the modeling process is more objective. A chaotic-theory-based time series prediction process generally consists of three steps: identifying whether a time series is chaotic, determining the appropriate embedding dimension and delay time to reconstruct the time series in the phase space, and forecasting. Identifying the chaotic characteristics in a time series is the first step, and it is also a crucial part of the whole study. To improve modeling accuracy and reliability, nonlinear dynamics theory can be used to model and analyze the EDH. As such, analyzing the chaotic characteristics of EDH time series at different timescales is both theoretically and practically beneficial. During this study, we expected to obtain the chaotic dynamic behavior and other characteristics of the EDH time series at different timescales. At present, there are few detailed studies about whether the EDH characteristics are the same at different timescales. What is the relationship between the chaotic characteristics and the timescale? Do the chaotic characteristics change if the timescale decreases? Is the chaotic time series predictable? These problems are worth discussing.
The remainder of this paper is structured as follows. Section 2 introduces the statistical tests, the fractal analysis method, and the chaos analysis methods used in this study. The case studies and corresponding results are presented in Section 3. The results are further discussed in Section 4. A conclusion is drawn in the last section, along with some suggestions for further research.

2. Methods

2.1. Statistical Tests

Statistical tests, including the augmented Dickey–Fuller (ADF) test and the Ljung–Box (LB) test, were applied to reveal the hidden characteristics in EDH time series. The ADF test is a unit root test that is widely used to determine whether time series are stationary or not [52,53]. An unit root is adopted to indicate the stochastic trend in a time series. In the test, a null hypothesis is that the time series contains a unit root, and the time series is then considered as non-stationary. If the p-value is less than 0.05, the null hypothesis is rejected. This means no unit root is contained in the time series and the time series is stationary. A white noise judgment is also necessary if the EDH time series is stationary. If the EDH time series is a white noise series (the variables share the same variance, and each value has no correlation with all the other values in the series), the EDH time series is unpredictable. The Ljung–Box test is a type of statistical method to detect the presence of white noise in the time series at 5% significance [54]. A null hypothesis is that the distribution of chronologically ordered data is independent and no statistically significant autocorrelations are detected in the time series.

2.2. Rescaled Range Analysis

Based on fractal theory, rescaled range (R/S) analysis explores the correlation quantification in time series [55,56]. The R/S method follows the power law relationship as follows:
R ( n ) S ( n ) = A n H
where n is the sampling number of the EDH time series. R is the rescaled range, defined as R = max X t , n min X t , n , t = 1 , 2 , , n , where X presents the time series. S is the standard deviation. A is a constant. H is the Hurst exponent. The least-squares method is applied to fit the scatter plot of ln ( R ( n ) / S ( n ) ) corresponding to ln ( n ) , and the slope of the fit line is the Hurst exponent.
Various H values correspond to different time series characteristics. If H = 0.5 , then the times series is considered as a random walk and the data are uncorrelated. This means the future data in the time series are not determined by the current data. If H ∈ [0, 0.5), there is more variability and burstinessin the time series, and the trend of the former moment contrasts with that of the latter. In the case of H ∈ [0.5, 1), the time series is self-similar, which means the future trends are consistent with those of the past. The time series are more closely related to the past time if H is close to 1. Especially, if H 0.5 , the time series are fractal, and the fractal dimension of the time series is denoted as α = 2 H .

2.3. Phase Space Reconstruction

As the first step to detect the chaotic characteristics, the single-dimensional EDH time series should be reconstructed in a multi-dimensional phase space. Considering EDH time series { x ( t ) , t = 1 , 2 , , l } , l is the length, and if the delay time τ is given, the correlation dimension d of the time series can be obtained using the Grassberger–Procaccia (G-P) algorithm [57]. The G-P algorithm introduced by Grassberger and Procaccia is one of the most widely used algorithms to estimate the correlation dimension. Delay time τ is the time lag between the current states with the past and is applied to transform the original time series into a set of time series with successive lagged values. Then, according to the Takens theory [58], the optimal embedding dimension m is determined as m 2 d + 1 . If the delay time τ and embedding dimension m are known, the phase space is reconstructed as
X = X 1 X 2 X N = x ( 1 ) x ( 1 + τ ) x ( 1 + ( m 1 ) τ ) x ( 2 ) x ( 2 + τ ) x ( 2 + ( m 1 ) τ ) x ( l ( m 1 ) τ ) x ( l ( m 2 ) τ ) x ( l )
where N = l ( m 1 ) τ .
Determining delay time τ and embedding dimension m is essential for reconstructed phase spaces. This study used the mutual information method to determine the delay time τ and the G-P algorithm to determine the embedding dimension m.

2.3.1. Delay Time τ

A small delay time τ will result in little new information contained in each of the subsequent data, which leads to an underestimation of the correlation dimension [59]. In contrast, if τ is too large, all information for phase space reconstruction is lost because neighboring trajectories diverge and averaging is no longer useful. This may lead to an overestimation of the correlation [60]. In this study, the delay time τ was determined by the mutual information method [61]. The mutual information method makes use of Shannon’s comentropy theory to calculate the correlation between two variables and measure their overall dependence at the same time. Considering time series { x ( t ) , t = 1 , 2 , , N } and { x ( t + τ ) , t = 1 , 2 , , N } , the mutual information is
I ( τ ) = x t , x t + τ P x t , x t + τ ln P x t , x t + τ P x t P x t + τ
where P ( x t ) and P ( x t + τ ) represent the probability density of x t and x t + τ , respectively, and P ( x t , x t + τ ) is the joint probability density function. The first minimum value of I ( τ ) was chosen as the proper delay time.

2.3.2. Embedding Dimension m

In the G-P algorithm, m is calculated according to the principle that the attractor correlation index D gradually reaches saturation with an increase in m. The calculation process of the G-P algorithm is as follows. First, the correlation integral is defined as
C ( r ) = lim N 2 N ( N 1 ) i , j = 1 N H r Y i Y j
where N is the total number of points that reconstruct the attractor. Y i (or Y j ) is the data vector in the reconstructed phase space, and i (or j) represents the ith (or jth) data vector. The radius of a sphere centered on the vector Y i or Y j is denoted as r. Let u = Y i Y j ; this is the distance between Y i and Y i in the Euclidean space.
C ( r ) β r D 2
where β is constant; D 2 is the correlation dimension, and its expression is the following formula.
D 2 = lim r 0 ln C ( r ) ln r
Stochastic processes exhibit a linear increase in D 2 with increasing dimension m and do not reach saturation. Conversely, deterministic processes tend to have constant D 2 as the dimension m increases and reach saturation. When D 2 tends to be stable, the corresponding dimension is the embedding dimension m.

2.4. Lyapunov Exponent

In this study, a phase space diagram is depicted to analyze the chaos of an EDH time series from a qualitative perspective, and the Lyapunov exponent was calculated to analyze the chaos from a quantitative perspective. In chaotic dynamical systems, the Lyapunov exponent λ reflects the changing of variables over time and the sensitivity of the initial conditions in terms of the speed of the track separation [59]. If the track shrinks in the direction λ < 0 and moves steadily, a system is not sensitive to the initial conditions. If the track separates rapidly in the direction λ > 0 , a system is sensitive to the initial conditions, We only calculate the maximum Lyapunov exponent λ m a x for discrete systems and nonlinear time series, which is an important indicator of chaos and chaotic characteristics. If λ m a x > 0 , the system is chaotic. A big λ m a x indicates strong chaos in the time series. There are several approaches to calculate λ , such as the p-norm method [62], the Wolf method [63], and the small datasets method [64]. Due to the high computational efficiency and accuracy of the small datasets method, this study used it to calculate λ m a x . The steps of the small datasets method are as follows [65]:
(1) Reconstruct the phase space as given by Equation (2) using the appropriate τ and m.
(2) Choose the nearest adjacent point to every point Y j on the given orbit in phase space d j ( 0 ) = min j Y j Y j ^ , | j j ^ | > p , where p is the average period.
(3) For every point Y j , calculate the distances d j ( i ) of its neighborhood points after discrete steps i: d j ( i ) = Y j + i Y j ^ + i , i = 1 , 2 , , min ( M j , M j ^ ) , M = N ( m 1 ) τ .
(4) For every i, calculate the average y ( i ) : y ( i ) = 1 q Δ t j = 1 q ln d j ( i ) , where q is the number of d j ( i ) 0 .
(5) Obtain the regression line L of y using the least-squares algorithm, and the largest Lyapunov exponent λ is the slope of line L.

3. Case Study

3.1. EDH Time Series at Three Time Scales

To obtain the EDH datasets, the hourly EDH data were calculated using the Navy Atmospheric Vertical Surface Layer Model (NAVSLaM) based on the atmospheric parameters from the National Centers for Environmental Prediction (NCEP) Climate Forecast System Reanalysis (CFSR) dataset [66]. NAVSLaM is a kind of LKB model [67,68]. As described in the Introduction, the LKB model calculates the modified refractivity M profiles from the air temperature T (K), total atmospheric pressure P (hPa), partial pressure of water vapor e (hPa), and the height above sea surface z (m) as follows [69]:
M = 77.6 P T 5.6 e T + 3.75 × 10 5 e T 2 + 0.157 z
The profiles of the temperature and pressure required by Equation (7) are then calculated from the NCEP CFSR variables (air temperature (2 m), sea surface temperature, specific humidity (2 m), U and V wind components (10 m), and sea level pressure) based on the Monin–Obukhov similarity and Liu–Katsaros–Businger theories as follows:
T ( z ) = T ( z 0 θ ) + θ * κ ln z z 0 θ ψ h z L Γ d z
q ( z ) = q ( z 0 q ) + q * κ ln z z 0 q ψ h z L
p ( z 2 ) = p ( z 1 ) exp g ( z 1 z 2 ) R T v
e = q p ε + ( 1 ε ) q
Considering that the South China Sea is a hot spot for research on the evaporation duct [37,42,70,71,72], we sampled the EDH data near Yongshu Reef located in the center of the SCS to construct the EDH datasets, as shown in Figure 1. The NCEP CFSR dataset covers a 32 years period (1979–2010), and the EDH dataset constructed in our study was also limited to this period. The daily and monthly EDH time series were averaged from hourly data.

3.2. Statistical Characteristics

Table 1 shows the ADF t-statistic and LB p-values of the EDH time series with different timescales. It can be seen from the results in Table 1 that the t-statistic values of the EDH time series are less than the critical value under the significance level of 0.01. Therefore, it can be known that the EDH time series under different timescales are stationary. The p-values of the EDH time series calculated by the LB statistics method are 0, which is far less than the significance level of 0.05. Therefore, it can be considered that the EDH time series at different scales do not have white noise characteristics, are not random time series, and contain extractable information.

3.3. Fractal Characteristics

Under three different timescales, the Hurst exponent of the EDH time series was calculated, as shown in Table 2. Table 2 shows clearly that the EDH time series have fractal characteristics at different timescales, and the Hurst exponent values of all three time series are greater than 0.5. This shows that the EDH time series at different timescales obey fractal Brownian motion. This shows that the EDH time series are not purely random and have a positive correlation. That is to say, the observation value of each sampling time keeps the memory of all previous states, and the future state also has a great correlation with the present state, which shows that the EDH time series have a long-term correlation. Therefore, the trend of the EDH time series is sustainable. This means that the EDH time series at different timescales have long-term positive correlation characteristics and short-term predictability. The calculation results in Table 2 also show that, with the increase of the timescale, the Hurst exponent of the EDH time series increases. This implies that the EDH at a small timescale is more uncertain and more vulnerable to external interference, leading to lower predictability. With the increase of the timescale, the predictability of the EDH time series increases. Similarly, the results of the fractal dimension also show the same conclusion, that is the smaller the timescale of the EDH time series is, the larger the fractal dimension is, and the corresponding EDH time series are more complex and difficult to predict. These features are relevant to the basic atmospheric dynamics, and the roles of marine environments across different timescales in the development of the evaporation duct are responsible for the different characteristics in the three timescales. For example, according to our previous study, the main environmental variables influencing the EDH include the wind speed, SST, temperature, and specific humidity of the atmosphere [2,34,69,70]. When considering hour-to-hour variability, the fluctuations of the wind speed are more severe than the SST. This is supported by our evaporation duct communication experiments conducted in the South China Sea [73]. By contrast, for the timescales of days to months, it seems the SST has more impact than the surface winds [70]. The predictability of the EDH time series provides the basis for the research of the prediction of the EDH.

3.4. Phase Space Reconstruction

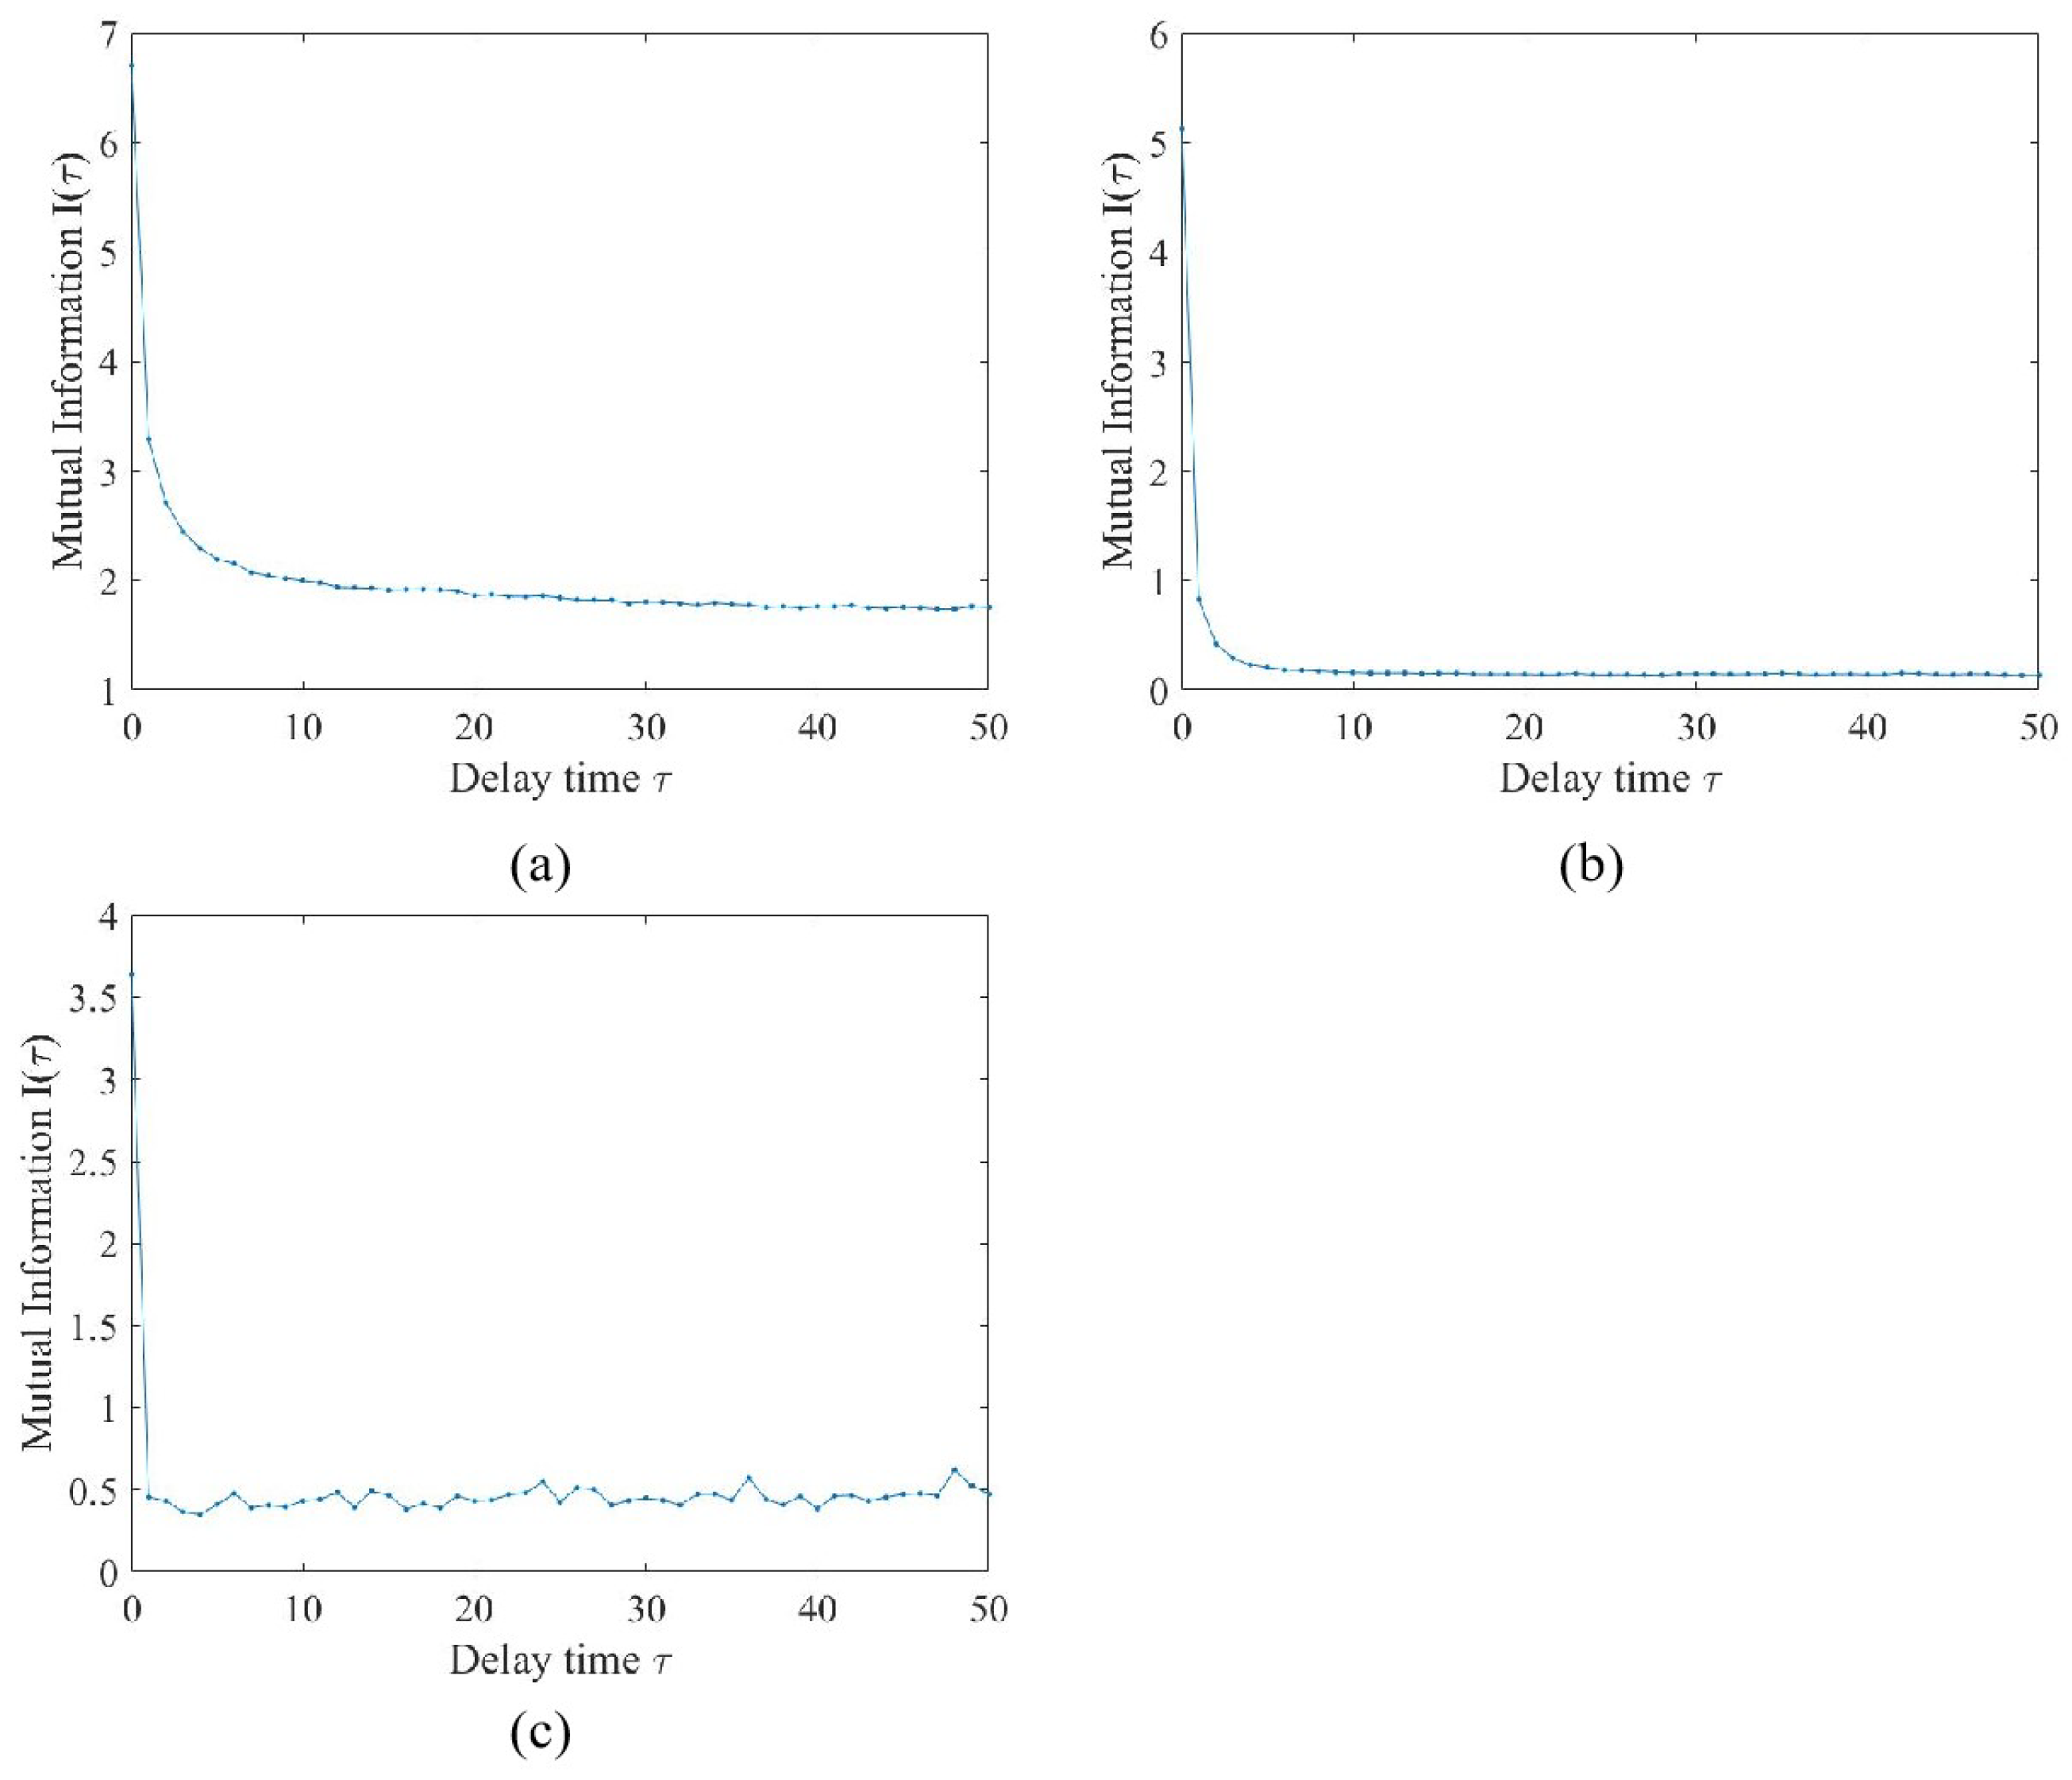
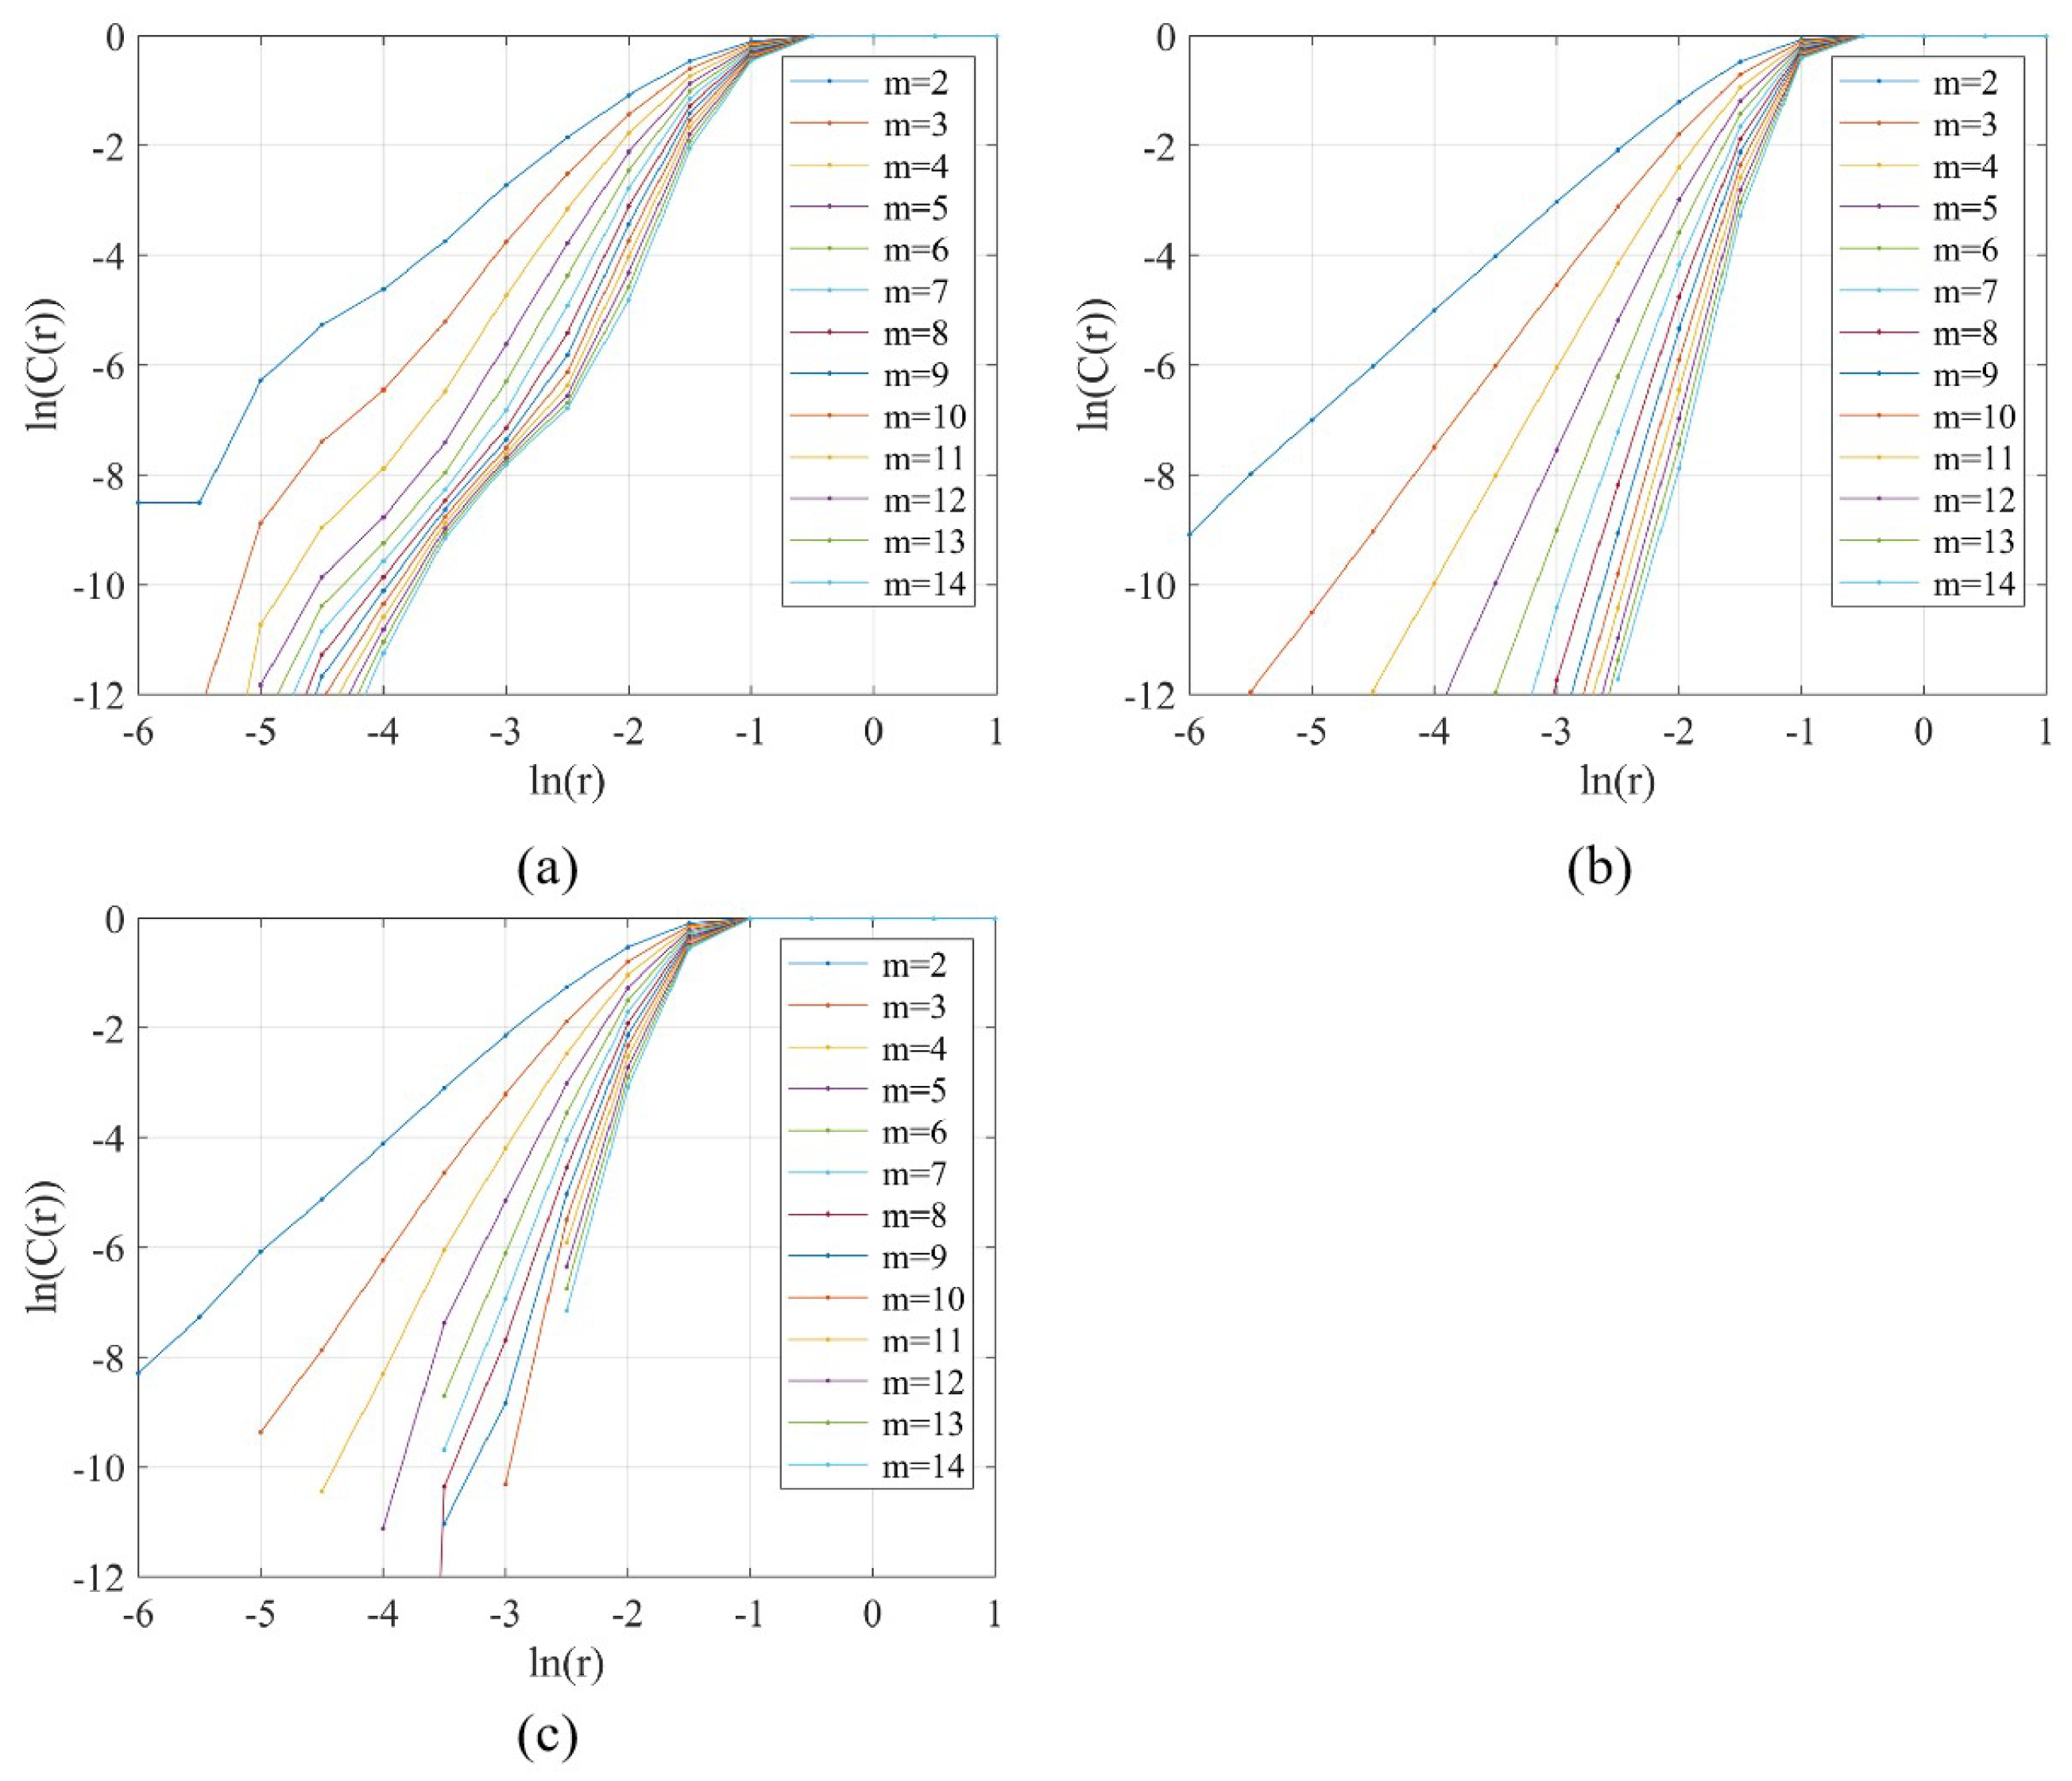
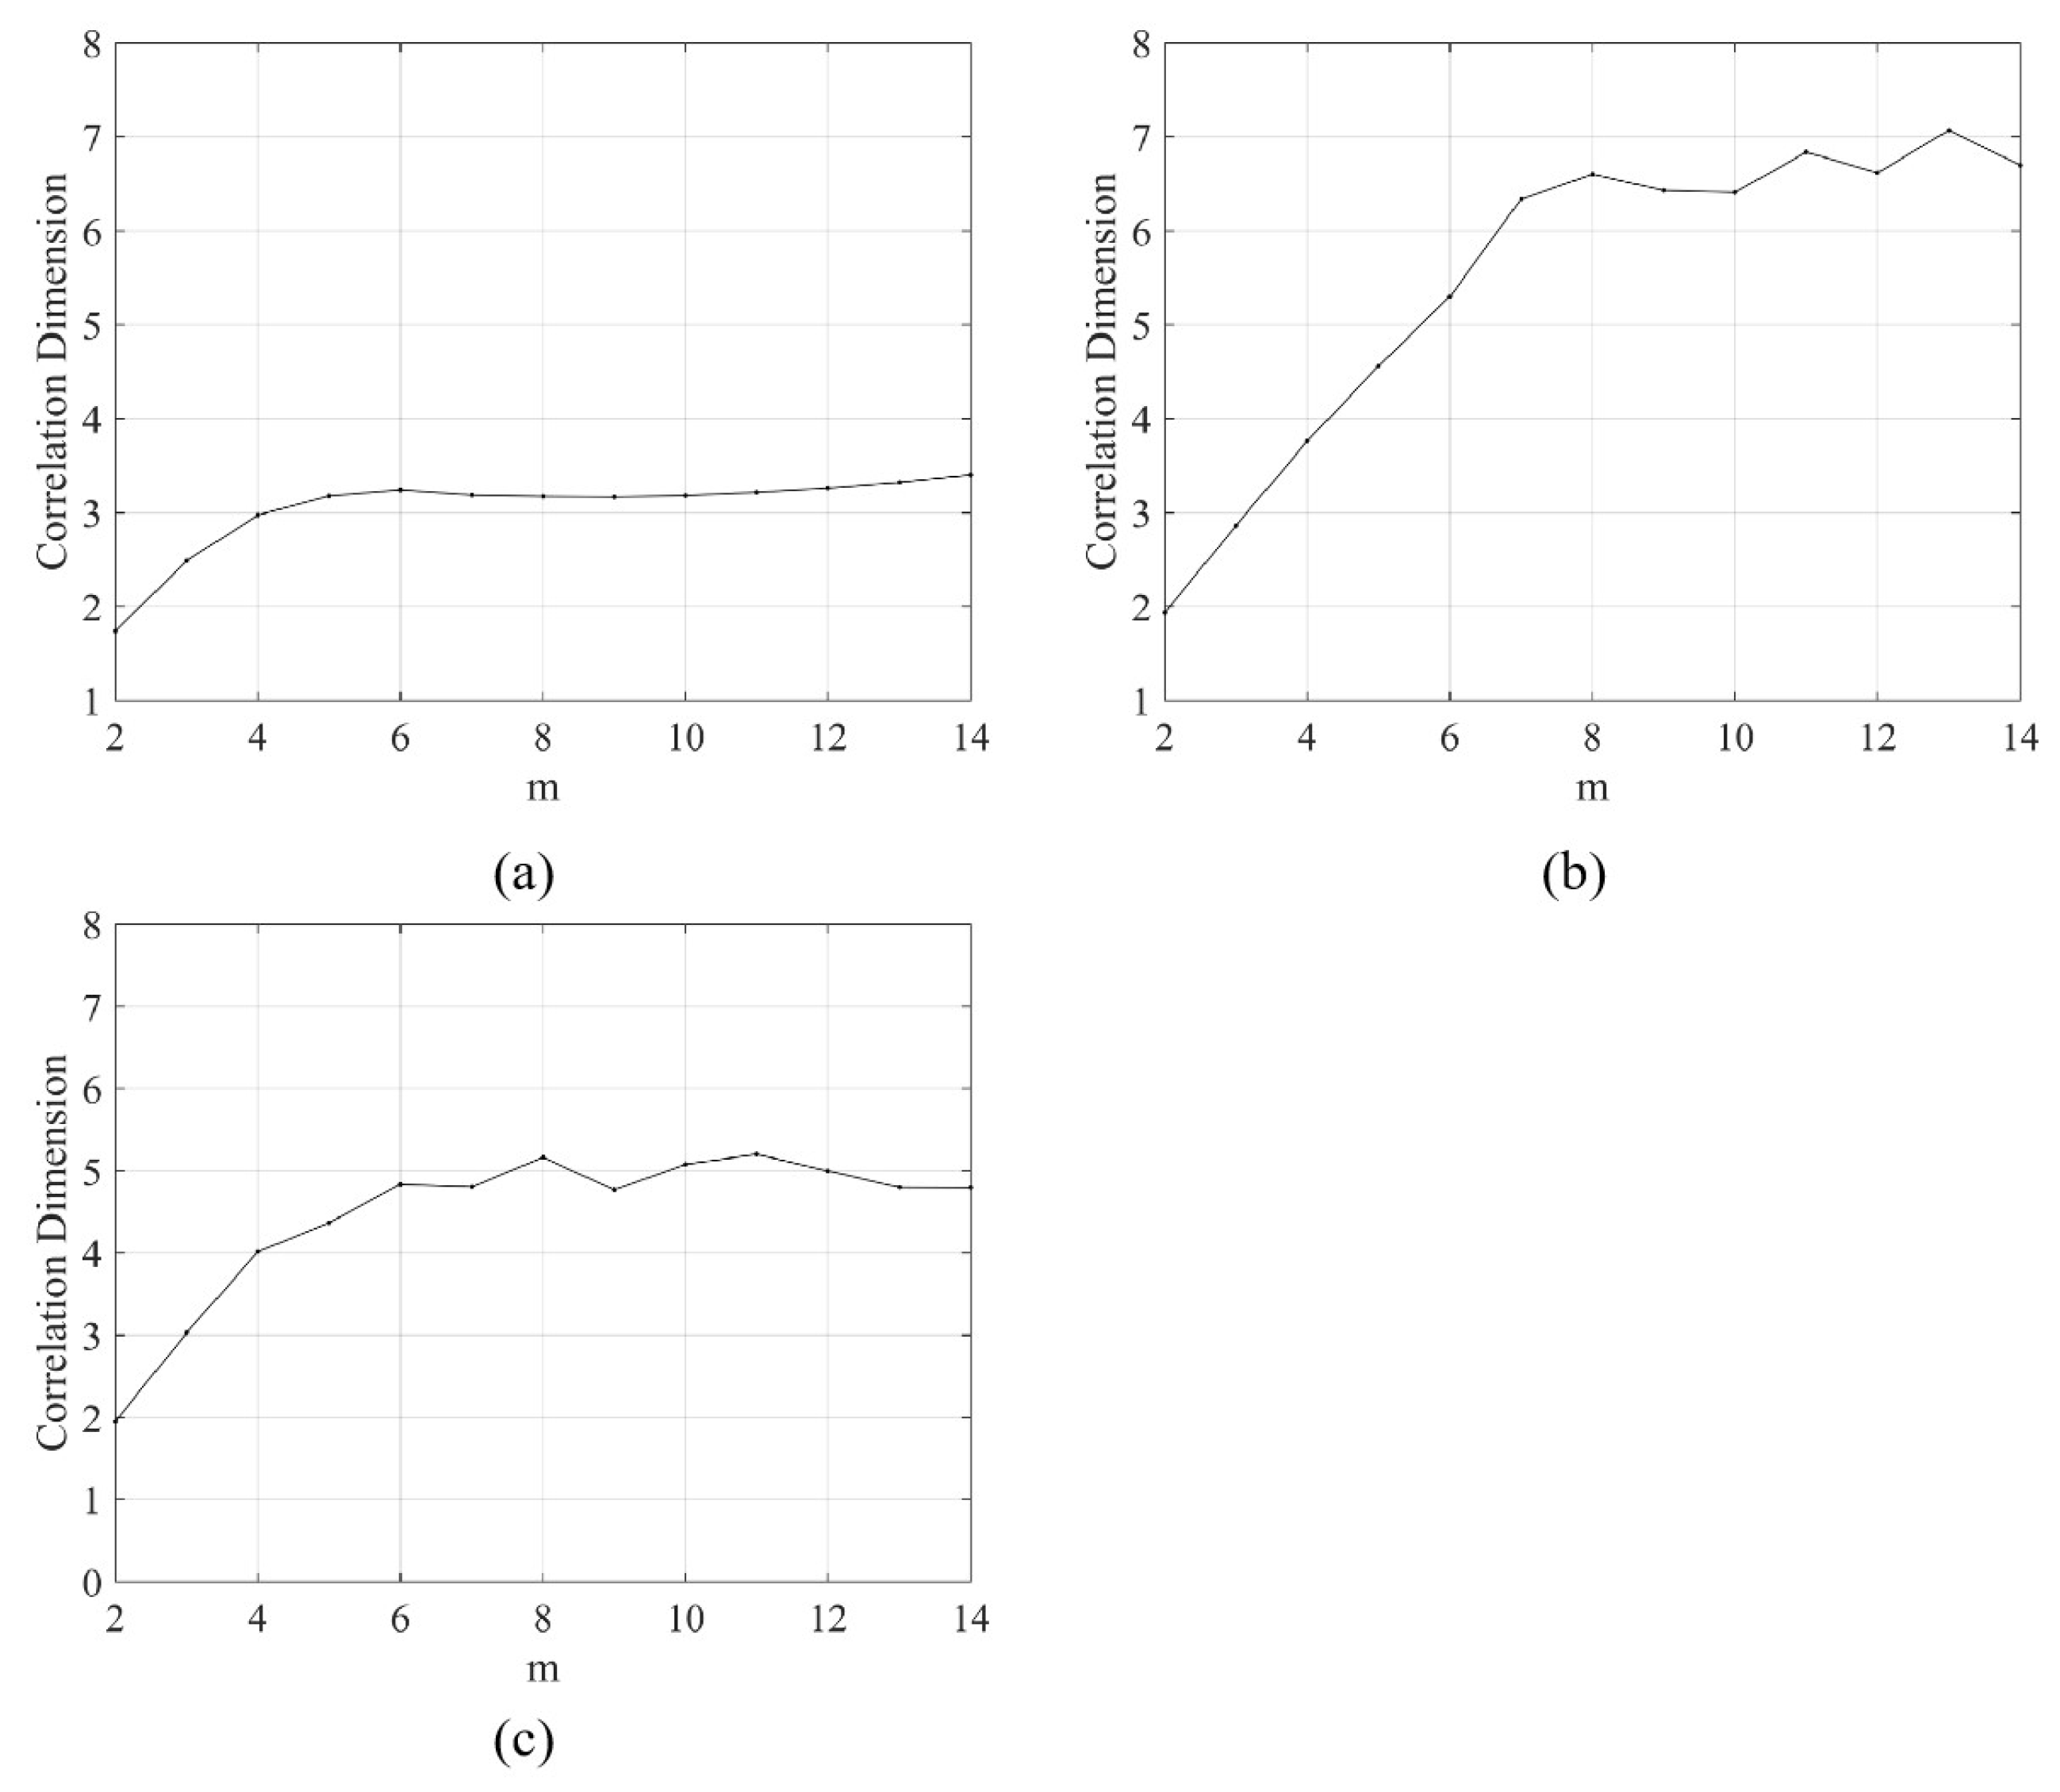
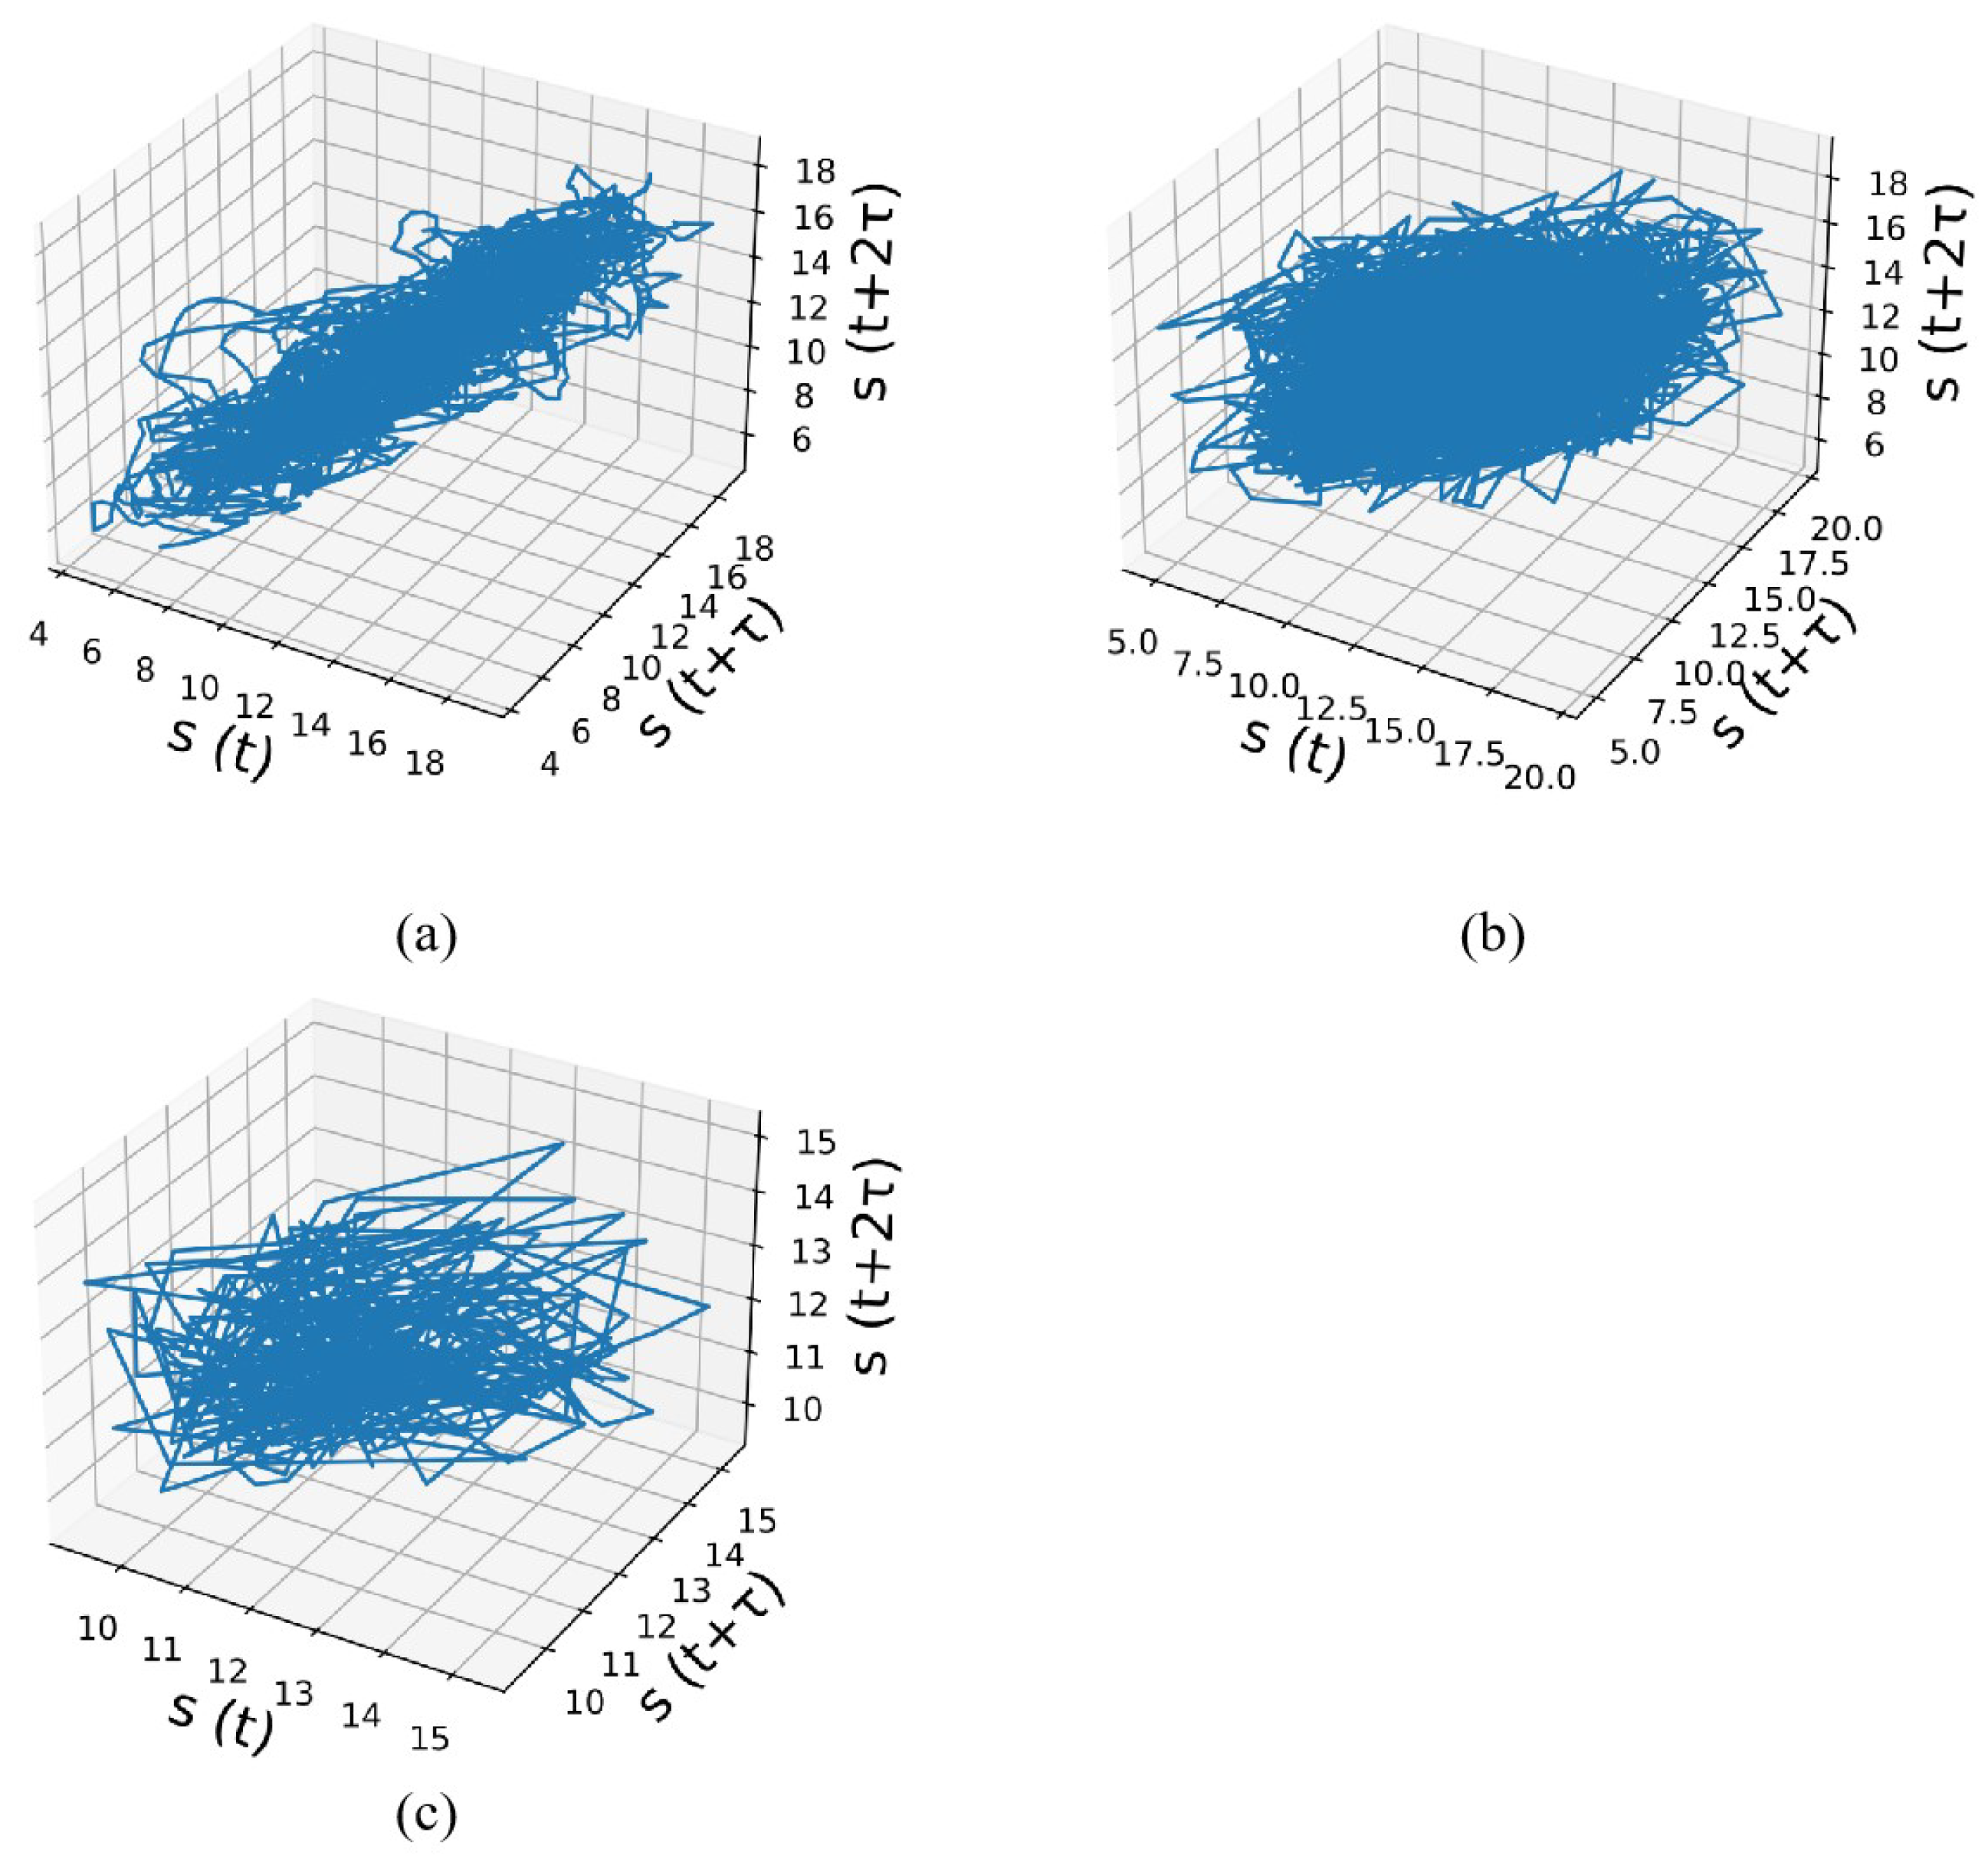
Figure 2a shows that, when delay time τ = 15 , the mutual information I ( τ ) reaches the local minimum value for the first time. Therefore, the delay time τ is 15 for the hourly EDH time series. Similarly, the delay time τ for the daily and monthly timescales is 11 and 4, respectively. Based on the given τ values of three timescales, the optimal embedding dimension of phase space reconstruction was computed using the G-P algorithm. According to the G-P algorithm, the curves of ln C n ( r ) and ln r as m increases are shown in Figure 3. Figure 4 shows the correlation dimension D curve of the three timescales. From Figure 3 and Figure 4, it can be seen that, when the embedding dimension m increases, ln C n ( r ) also increases. However, after reaching a certain value, it will be in a state of saturation. The increasing of the embedding dimension has no effect on the value of the relevant integral. As can be seen from Figure 4a, the convergence value of the correlation dimension D is less than three. According to the m 2 D + 1 principle, the embedding dimension m of the EDH time series with the hourly timescale was determined to be seven. By analogy, the embedding dimension m of the other EDH time series can also be obtained, which is also listed in Table 3. Figure 5 shows three-dimensional diagrams to show the reconstructed phase space where τ = 15, 11, and 4. The phase space diagram exhibits strange attractors in a well-defined region, suggesting that the EDH time series’ evolution can possibly be explained by deterministic chaos.

3.5. Largest Lyapunov Exponent

Using the delay time and embedding dimension obtained above, the largest Lyapunov exponent of the EDH time series with different timescales was calculated by using the small datasets method. Table 4 lists the estimations of the largest Lyapunov exponent and the maximum predictable time. We can see that the largest Lyapunov exponents of the EDH time series at different timescales are all greater than 0, i.e., the EDH time series show weak chaotic characteristics. Therefore, the EDH time series can be predicted in a certain period of time. At the same time, the results also show that, with the increase of the timescale, the largest Lyapunov exponent of the EDH time series also increases, and the predictability becomes weaker. On the other hand, the larger the timescale, the stronger the randomness and the weaker the predictability of the EDH time series are.

4. Discussions

Based on the extensive analysis of the EDH time series at the different timescales, the following conclusions can be drawn.
The t-statistic of the EDH time series is less than the critical value under a significance level of 0.01. Therefore, it can be known that the EDH time series at different timescales are stationary. This is also consistent with our previous study [42]. The LB statistical test also demonstrated that the EDH time series have non-white noise characteristics.
The EDH time series have fractal characteristics at different timescales, and the Hurst index is more than 0.5. The experimental results indicated that the EDH time series obey fractal Brownian motion at different timescales, which is irregular. Therefore, the time series of the EDH has a long-term positive correlation. This also shows that the EDH has short-term predictability. Other scholars have shown that the Hurst index of time series increases with the increase of the timescales, namely the randomness decreases and the long-term correlation increases [74,75,76]. Our analysis found that this also exists in the EDH time series.
The phase space of the EDH time series at the different timescales was reconstructed. The results of the phase space reconstruction of the EDH time series showed that the delay time and embedding dimension of the EDH time series has little relation with the timescales. The phase space reconstruction using the determined optimal embedding dimension and the optimal delay time showed obvious attractors. The chaotic characteristic results showed that the EDH time series at the different timescales are predictable. However, only a short-term prediction can be made, and the accuracy of a long-term prediction is difficult to guarantee. In the evaporation duct’s diagnosis, the phase space parameters’ reconstruction is of great significance for the prediction and characteristic analysis of the EDH. Therefore, how to determine the appropriate calculation algorithm is worth studying. Therefore, in the prediction of the EDH, phase space reconstruction technology should be introduced. This will also be the focus of our future research.
The largest Lyapunov exponent was used to analyze the convergence of the EDH time series with the different timescales. All the largest Lyapunov exponents of time series were greater than zero, and the chaotic degree reflected by the EDH time series increased with a larger timescale. With the increase of the timescale, the chaotic characteristics of the EDH time series became stronger.
It should be pointed out that our chaotic characteristic analyses were based on the EDH data derived from the evaporation duct model NAVSLaM, which is based on the Monin–Obukhov similarity theory (MOST). Some researchers have suggested that, for the moderate-to-strongly stable environments, the MOST may break down [77,78,79,80,81]. Considering this, in the NAVSLaM applied in our study, the latest stability functions were adopted to improve the model performances under stable conditions [2]. In addition, we also identified the frequency of the stable cases in the study area using the index of the air–sea temperature difference (ASTD). The results showed that the probability of a strongly stable condition (ASTD > 1 °C), a weakly stable condition (0 °C < ASTD ≤ 1 °C), and an unstable condition (ASTD < 0 °C) were 0.0018%, 17.4759%, and 82.5223%, respectively. Therefore, the conclusions of this study are reliable and can provide a certain reference for researchers that are interested in the characteristics of the evaporation duct over the South China Sea.

5. Conclusions

Analyzing the chaotic features of EDH time series will be significant as it is a complex stochastic natural phenomenon. EDH time series at different timescales were discussed and analyzed in order to objectively understand the EDH’s fluctuation characteristics. This study focused on three timescales of the EDH time series, namely hourly, daily, and monthly. To analyze the chaotic dynamic characteristics and other characteristics of the EDH at different timescales, the judgment of the non-stationary and non-white noise characteristics was introduced, as well as the Hurst index, chaos test, and maximum Lyapunov exponent. There were some conclusions drawn between the EDH time series and timescales. Chaos analysis provides a new perspective to evaluate the variations of the EDH. Traditional approaches to identifying the chaotic characteristics of time series, such as the maximum Lyapunov exponent, correlation dimension, etc., are highly dependent on the phase space reconstruction parameters. Thus, developing more accurate, convenient, and effective methods to construct the phase plane parameters is essential in the future. In addition, data with the timescale in minutes were not studied due to the limited time resolution of the sample data. As a consequence, further investigation of the properties of the EDH at this timescale will be needed in the future. As a result of the research presented in this paper, we can improve our understanding of the fluctuations of EDH and improve the accuracy of our predictions.

Author Contributions

Q.Z. contributed to the designing and planning the experiments. X.C., F.Y. and F.H. contributed to the data analysis and the writing of the first draft of the manuscript. Q.Z. was the creator and person in charge of the project, directing the experimental design, data analysis, thesis writing, and revision. All authors contributed to the article and approved the submitted version. All authors have read and agreed to the published version of the manuscript.

Funding

This research was funded by the National Natural Science Foundation of China (41906167), the project supported by the Southern Marine Science and Engineering Guangdong Laboratory (Zhuhai) (SML2020SP007), and the Startup Foundation for Introducing Talent of Nanjing University of Information Science and Technology.

Institutional Review Board Statement

Not applicable.

Informed Consent Statement

Not applicable.

Data Availability Statement

Not applicable.

Acknowledgments

The authors would like to thank the National Center for Atmospheric Research for providing the reanalysis datasets used in this paper.

Conflicts of Interest

The authors declare no conflict of interest.

References

  1. Wang, Q.; Alappattu, D.P.; Billingsley, S.; Blomquist, B.; Burkholder, R.J.; Christman, A.J.; Creegan, E.D.; De Paolo, T.; Eleuterio, D.P.; Fernando, H.J.S.; et al. CASPER: Coupled air–sea processes and electromagnetic ducting research. Bull. Amer. Meteoro. Soc. 2018, 99, 1449–1471. [Google Scholar] [CrossRef]
  2. Zhang, Q.; Yang, K.D.; Shi, Y. Spatial and temporal variability of the evaporation duct in the Gulf of Aden. Tellus A 2016, 68, 29792. [Google Scholar] [CrossRef] [Green Version]
  3. Pozderac, J.; Johnson, J.; Yardim, C.; Merrill, C.; de Paolo, T.; Terrill, E.; Ryan, F.; Frederickson, P. X-band beacon-receiver array evaporation duct height estimation. IEEE Trans. Antennas Propag. 2018, 66, 2545–2556. [Google Scholar] [CrossRef]
  4. Guo, X.; Zhao, D.; Zhang, L.; Wang, H.; Kang, S.; Lin, L. C band transhorizon signal characterisations in evaporation duct propagation environment over Bohai Sea of China. IET Microw. Antennas Propaga. 2019, 13, 407–413. [Google Scholar] [CrossRef]
  5. Ma, J.; Wang, J.; Yang, C. Long-range microwave links guided by evaporation ducts. IEEE Commun. Mag. 2022, 60, 68–72. [Google Scholar] [CrossRef]
  6. Wash, C.; Davidson, K. Remote measurements and coastal atmospheric refraction. IEEE IGARSS 1994, 1, 397–401. [Google Scholar]
  7. Richter, J.H. Sensing of radio refractivity and aerosol extinction. IEEE IGARSS 1994, 1, 381–395. [Google Scholar]
  8. Pons, J.; Reising, S.C.; Padmanabhan, S.; Camps, A.; Duffo, N. Passive polarimetric remote sensing of the ocean surface during the Rough Evaporation Duct experiment (RED 2001). IEEE IGARSS 2003, 4, 2732–2734. [Google Scholar]
  9. Karimian, A.; Yardim, C.; Gerstoft, P.; Hodgkiss, W.S.; Barrios, A.E. Refractivity estimation from sea clutter: An invited review. Radio Sci. 2011, 46, 1–16. [Google Scholar] [CrossRef] [Green Version]
  10. Zhao, X.; Yardim, C.; Wang, D.; Howe, B.M. Estimating range-dependent evaporation duct height. J. Atmos. Ocean. Technol. 2017, 34, 1113–1123. [Google Scholar] [CrossRef]
  11. Ji, H.; Yin, B.; Zhang, J.; Zhang, Y. Joint inversion of evaporation duct based on radar sea clutter and target echo using deep learning. Electronics 2022, 11, 2157. [Google Scholar] [CrossRef]
  12. Wang, B.; Wu, Z.S.; Zhao, Z.W.; Wang, H.G. A passive technique to monitor evaporation duct height using coastal GNSS-R. IEEE Geosci. Remote Sens. Lett. 2011, 8, 587–591. [Google Scholar] [CrossRef]
  13. Liao, Q.; Sheng, Z.; Shi, H.; Xiang, J.; Yu, H. Estimation of surface duct using ground-based GPS phase delay and propagation loss. Remote Sens. 2018, 10, 724. [Google Scholar] [CrossRef]
  14. Mai, Y.; Shi, H.; Liao, Q.; Sheng, Z.; Zhao, S.; Ni, Q.; Zhang, W. Using the decomposition-based multi-objective evolutionary algorithm with adaptive neighborhood sizes and dynamic constraint strategies to retrieve atmospheric ducts. Sensors 2020, 20, 2230. [Google Scholar] [CrossRef] [Green Version]
  15. Zhang, Q.; Yang, K.D. Study on evaporation duct estimation from point-to-point propagation measurements. IET Sci. Meas. Technol. 2018, 4, 456–460. [Google Scholar] [CrossRef]
  16. Karabacs, U.; Diouane, Y.; Douvenot, R. A variational adjoint approach on wide-angle parabolic equation for refractivity inversion. IEEE Trans. Antennas Propag. 2021, 69, 4861–4870. [Google Scholar] [CrossRef]
  17. Pastore, D.M.; Wessinger, S.E.; Greenway, D.P.; Stanek, M.J.; Burkholder, R.J.; Haack, T.; Wang, Q.; Hackett, E.E. Refractivity inversions from point-to-point X-band radar propagation measurements. Radio Sci. 2022, 57, 1–16. [Google Scholar] [CrossRef]
  18. Hristov, T. Study of EM Signals Propagation Through Marine Atmospheric Boundary Layer and Static Pressure Measurements in Marine Atmospheric Boundary Layer During CBLAST; Johns Hopkins University: Baltimore, MD, USA, 2005. [Google Scholar]
  19. Kukushkin, A. Radio Wave Propagation in the Marine Boundary Layer; John Wiley & Sons: Hoboken, NJ, USA, 2006. [Google Scholar]
  20. Edson, J.; Crawford, T.; Crescenti, J.; Farrar, T.; Frew, N.; Gerbi, G.; Helmis, C.; Hristov, T.; Khelif, D.; Jessup, A.; et al. The coupled boundary layers and air–sea transfer experiment in low winds. Bull. Amer. Meteoro. Soc. 2007, 88, 341–356. [Google Scholar] [CrossRef]
  21. Hristov, T. Wave-Driven Marine Boundary Layers: Implications for Atmospheric Electromagnetics and Ocean Acoustics; Johns Hopkins University: Baltimore, MD, USA, 2008. [Google Scholar]
  22. Mai, Y.; Sheng, Z.; Shi, H.; Li, C.; Liao, Q.; Bao, J. A new short-term prediction method for estimation of the evaporation duct height. IEEE Access 2020, 8, 136036–136045. [Google Scholar] [CrossRef]
  23. Chai, X.; Li, J.; Zhao, J.; Wang, W.; Zhao, X. LGB-PHY: An evaporation duct height prediction model based on physically constrained lightGBM algorithm. Remote Sens. 2022, 14, 3448. [Google Scholar] [CrossRef]
  24. Liu, W.T.; Katsaros, K.B.; Businger, J.A. Bulk parameterization of air–sea exchanges of heat and water vapor including the molecular constraints at the interface. J. Atmos. Sci. 1979, 36, 1722–1735. [Google Scholar] [CrossRef]
  25. Babin, S.M.; Dockery, G.D. LKB-based evaporation duct model comparison with buoy data. J. Appl. Meteor. 2002, 41, 434–446. [Google Scholar] [CrossRef]
  26. Liu, W.T.; Blanc, T.V. The Liu, Katsaros, and Businger (1979) Bulk Atmospheric Flux Computational Iteration Program in FORTRAN and BASIC; Naval Research Lab.: Washington, DC, USA, 1984. [Google Scholar]
  27. Cook, J. A Sensitivity Study of Weather Data Inaccuracies on Evaporation Duct Height Algorithms. Radio Sci. 1991, 26, 731–746. [Google Scholar] [CrossRef]
  28. Cook, J.; Burk, S. Potential Refractivity as a Similarity Variable. Bound.-Layer Meteorol. 1992, 58, 151–159. [Google Scholar] [CrossRef] [Green Version]
  29. Babin, S.M.; Young, G.S.; Carton, J.A. A New Model of the Oceanic Evaporation Duct. J. Appl. Meteor. 1997, 36, 193–204. [Google Scholar] [CrossRef]
  30. Frederickson, P.A.; Davidson, K.L.; Goroch, A.K. Operational Bulk Evaporation Duct Model for MORIAH; Version 12; Naval Postgraduate School: Monterey, CA, USA, 2000; pp. 93943–95114. [Google Scholar]
  31. Karimian, A.; Yardim, C.; Haack, T.; Gerstoft, P.; Hodgkiss, W.S.; Rogers, T. Toward the Assimilation of the Atmospheric Surface Layer Using Numerical Weather Prediction and Radar Clutter Observations. J. Appl. Meteor. Climatol. 2013, 52, 2345–2355. [Google Scholar] [CrossRef] [Green Version]
  32. Jiao, L.; Zhang, Y. An Evaporation Duct Prediction Model Coupled with the MM5. Acta Oceanol. Sin. 2015, 34, 46–50. [Google Scholar] [CrossRef]
  33. Frederickson, P.A.; Murphree, J.T.; Twigg, K.L.; Barrios, A. A modern global evaporation duct climatology. In Proceedings of the IEEE International Conference Radar, Adelaide, SA, Australia, 10–12 September 2008; pp. 292–296. [Google Scholar]
  34. Yang, K.D.; Zhang, Q.; Shi, Y.; He, Z.Y.; Lei, B.; Han, Y.N. On Analyzing Space-time Distribution of Evaporation Duct Height over the Global Ocean. Acta Oceanol. Sin. 2016, 7, 20–29. [Google Scholar] [CrossRef]
  35. Twigg, K.L. A Smart Climatology of Evaporation Duct Height and Surface Radar Propagation in the Indian Ocean. Master’s Thesis, Naval Postgrad School, Monterey, CA, USA, 2007. [Google Scholar]
  36. Ramsaur, D. Climate Analysis and Long Range Forecasting of Radar Performance in the Western North Pacific. Master’s Thesis, Naval Postgrad School, Monterey, CA, USA, 2009. [Google Scholar]
  37. McKeon, B.D. Climate Analysis of Evaporation Ducts in the South China Sea. Master’s Thesis, Naval Postgrad School, Monterey, CA, USA, 2013. [Google Scholar]
  38. Gurbuz, S.C. Assessing Evaporation Duct Variability in the Eastern Mediterranean Sea in Support of Radar and Radio Communications. Master’s Thesis, Naval Postgrad School, Monterey, CA, USA, 2016. [Google Scholar]
  39. Javeed, S.; Alimgeer, K.S.; Javed, W.; Atif, M.; Uddin, M. A modified artificial neural network based prediction technique for tropospheric radio refractivity. PLoS ONE 2018, 13, e0192069. [Google Scholar] [CrossRef]
  40. Mai, Y.; Sheng, Z.; Shi, H.; Li, C.; Liu, L.; Liao, Q.; Zhang, W.; Zhou, S. A new diagnostic model and improved prediction algorithm for the heights of evaporation ducts. Front. Earth Sci. 2020, 8, 102. [Google Scholar] [CrossRef]
  41. Zhao, W.; Li, J.; Zhao, J.; Jiang, T.; Zhu, J.; Zhao, D. Research on evaporation duct height prediction based on back propagation neural network. IET Microw. Antennas Propaga. 2020, 14, 1547–1554. [Google Scholar] [CrossRef]
  42. Hong, F.; Zhang, Q. Time series analysis of evaporation duct height over South China Sea: A stochastic modeling approach. Atmosphere 2021, 12, 1663. [Google Scholar] [CrossRef]
  43. Yanez, J.F. Machine Learning Approach for Evaporation Duct Nowcast. Master’s Thesis, Naval Postgrad School, Monterey, CA, USA, 2021. [Google Scholar]
  44. Zhao, W.; Zhao, J.; Li, J.; Zhao, D.; Huang, L.; Zhu, J.; Lu, J.; Wang, X. An evaporation duct height prediction model based on a long short-term memory neural network. IEEE Trans. Antennas Propaga. 2021, 69, 7795–7804. [Google Scholar] [CrossRef]
  45. Han, J.; Wu, J.-J.; Zhu, Q.-L.; Wang, H.-G.; Zhou, Y.-F.; Jiang, M.-B.; Zhang, S.-B.; Wang, B. Evaporation duct height nowcasting in China’s Yellow Sea based on deep learning. Remote Sens. 2021, 13, 1577. [Google Scholar] [CrossRef]
  46. Ma, Y.; He, X.; Wu, R.; Shen, C. Spatial Distribution of Multi-Fractal Scaling Behaviours of Atmospheric XCO2 Concentration Time Series during 2010–2018 over China. Entropy 2022, 24, 817. [Google Scholar] [CrossRef]
  47. Kalamaras, N.; Tzanis, C.; Deligiorgi, D.; Philippopoulos, K.; Koutsogiannis, I. Distribution of Air Temperature Multifractal Characteristics Over Greece. Atmosphere 2019, 10, 45. [Google Scholar] [CrossRef] [Green Version]
  48. Gómez-Gómez, J.; Carmona-Cabezas, R.; Sánchez-López, E.; Gutiérrez de Ravé, E.; Jiménez-Hornero, F.J. Multifractal Fluctuations of the Precipitation in Spain (1960–2019). Chaos Solitons Fractals 2022, 157, 111909. [Google Scholar] [CrossRef]
  49. Gil-Alana, L.A.; Yaya, O.S.; Awolaja, O.G.; Cristofaro, L. Long Memory and Time Trends in Particulate Matter Pollution (PM2.5 and PM10) in the 50 U.S. States. J. Appl. Meteo. Climatol. 2020, 59, 1351–1367. [Google Scholar] [CrossRef]
  50. Senyange, B.; Manda, B.M.; Skokos, C. Characteristics of chaos evolution in one-dimensional disordered nonlinear lattices. Phys. Rev. E 2018, 98, 052229. [Google Scholar] [CrossRef] [Green Version]
  51. Safari, N.; Chung, C.; Price, G. Novel multi-step short-term wind power prediction framework based on chaotic time series analysis and singular spectrum analysis. IEEE Trans. Power Syst. 2017, 33, 590–601. [Google Scholar] [CrossRef]
  52. Dickey, D.A.; Fuller, W.A. Distribution of the estimators for autoregressive time series with a unit root. J. Amer. Stat. Assoc. 1979, 74, 427–431. [Google Scholar]
  53. Said, S.E.; Dickey, D.A. Testing for unit roots in autoregressive-moving average models of unknown order. Biometrika 1984, 71, 599–607. [Google Scholar] [CrossRef]
  54. Ljung, G.M.; Box, G.E. On a measure of lack of fit in time series models. Biometrika 1978, 65, 297–303. [Google Scholar] [CrossRef]
  55. Hurst, H.E. Long-term storage capacity of reservoirs. Trans. Ameri. Soc. Civil Eng. 1951, 116, 770–799. [Google Scholar] [CrossRef]
  56. Granero, M.S.; Segovia, J.T.; Perez, J.G. Some comments on Hurst exponent and the long memory processes on capital markets. Phys. A 2008, 387, 5543–5551. [Google Scholar] [CrossRef]
  57. Grassberger, P.; Procaccia, I. Characterization of strange attractors. Phys. Rev. Lett. 1983, 50, 346. [Google Scholar] [CrossRef]
  58. Takens, F. Detecting strange attractors in turbulence. Dyn. Syst. Turb. 1981, 366–381. [Google Scholar]
  59. Hu, Z.; Zhang, C.; Luo, G.; Teng, Z.; Jia, C. Characterizing cross-scale chaotic behaviors of the runoff time series in an inland river of central Asia. Quatern. Int. 2013, 311, 132–139. [Google Scholar] [CrossRef]
  60. Dhanya, C.; Kumar, D.N. Multivariate nonlinear ensemble prediction of daily chaotic rainfall with climate inputs. J. Hydro. 2011, 403, 292–306. [Google Scholar] [CrossRef]
  61. Fraser, A.M.; Swinney, H.L. Independent coordinates for strange attractors from mutual information. Phys. Rev. A 1986, 33, 1134. [Google Scholar] [CrossRef]
  62. Barna, G.; Tsuda, I. A new method for computing lyapunov exponents. Phys. Lett. A 1993, 175, 421–427. [Google Scholar] [CrossRef]
  63. Wolf, A.; Swift, J.B.; Swinney, H.L.; Vastano, J.A. Determining lyapunov exponents from a time series. Phys. D 1985, 16, 285–317. [Google Scholar] [CrossRef] [Green Version]
  64. Rosenstein, M.T.; Collins, J.J.; De Luca, C.J. A practical method for calculating largest lyapunov exponents from small datasets. Phys. D 1993, 65, 117–134. [Google Scholar] [CrossRef]
  65. Zhang, M.; Zhou, L.; Jie, J.; Liu, X. A multi-scale prediction model based on empirical mode decomposition and chaos theory for industrial melt index prediction. Chemometr. Intell. Lab. Syst. 2019, 186, 23–32. [Google Scholar] [CrossRef]
  66. Saha, S.; Moorthi, S.; Pan, H.L.; Wu, X.; Wang, J.; Nadiga, S.; Tripp, P.; Kistler, R.; Woollen, J.; Behringer, D.; et al. The NCEP climate forecast system reanalysis. Bull. Amer. Meteoro. Soc. 2010, 8, 1015–1058. [Google Scholar] [CrossRef] [Green Version]
  67. Frederickson, P.A. Further improvements and validation for the navy atmospheric vertical surface layer model (NAVSLaM). In Proceedings of the IEEE 2015 USNC-URSI Radio Science Meeting (Joint with AP-S Symposium), Piscataway, NJ, USA, 19–24 July 2015; p. 242. [Google Scholar]
  68. Frederickson, P.; Alappattu, D.; Wang, Q.; Yardim, C.; Xu, L.; Christman, A.; Fernando, H.J.S.; Blomquist, B. Evaluating the use of different flux-gradient functions in NAVSLaM during two experiments. In Proceedings of the 2018 IEEE International Symposium on Antennas and Propagation & USNC/URSI National Radio Science Meeting (IEEE), Boston, MA, USA, 8–13 July 2018; pp. 885–886. [Google Scholar]
  69. Zhang, Q.; Yang, K.D.; Yang, Q.L. Statistical analysis of the quantified relationship between evaporation duct and oceanic evaporation for unstable conditions. J. Atmos. Ocean. Technol. 2017, 11, 2489–2497. [Google Scholar] [CrossRef]
  70. Yang, K.D.; Zhang, Q.; Shi, Y. Interannual variability of the evaporation duct over the South China Sea and its relations with regional evaporation. J. Geophys. Res.-Oceans 2017, 8, 6698–6713. [Google Scholar] [CrossRef]
  71. Yang, S.; Li, X.; Wu, C.; He, X.; Zhong, Y. Application of the PJ and NPS evaporation duct models over the South China Sea (SCS) in winter. PLoS ONE 2017, 12, e0172284. [Google Scholar] [CrossRef] [Green Version]
  72. Yang, C.; Wang, J.; Ma, J. Exploration of X-band communication for maritime applications in the South China Sea. IEEE Antennas Wire. Propag. Lett. 2021, 21, 481–485. [Google Scholar] [CrossRef]
  73. Zhang, Q.; Yang, K.; Shi, Y.; Yan, X. Oceanic Propagation Measurement in the Northern Part of the South China Sea. In Proceedings of the OCEANS 2016, Shanghai, China, 10–13 April 2016; IEEE: Shanghai, China, 2016; pp. 1–4. [Google Scholar]
  74. Tian, Z. Chaotic characteristic analysis of network traffic time series at different timescales. Chaos Soliton. Fract. 2020, 130, 109412. [Google Scholar] [CrossRef]
  75. Jiang, F.; Deng, M.; Long, Y.; Sun, H. Spatial pattern and dynamic change of vegetation greenness from 2001 to 2020 in Tibet, China. Front. Plant Sci. 2022, 1292. [Google Scholar] [CrossRef] [PubMed]
  76. Rahmani, F.; Fattahi, M.H. Multi-temporal-scale analysis of the underlying association between temperature and river flow using a cross-correlation and nonlinear dynamic approach. IJST Trans. Civil Eng. 2022, 46, 2511–2529. [Google Scholar] [CrossRef]
  77. Foken, T. 50 Years of the Monin–Obukhov similarity theory. Bound.-Lay. Meteorol. 2006, 119, 431–447. [Google Scholar] [CrossRef]
  78. Alappattu, D.P.; Wang, Q.; Kalogiros, J. Anomalous propagation conditions over Eastern Pacific Ocean derived from MAGIC data. Radio Sci. 2016, 51, 1142–1156. [Google Scholar] [CrossRef] [Green Version]
  79. Østenstad, P.; Meltzer, M.M. Evaporation duct height climatology for Norwegian waters using hindcast data. In Proceedings of the Meet Procedings of the SET-244 Symposium “Bridging the Gap between the Development and Operational Deployment of Naval Tactical Decision Aids”, Den Helder, The Netherlands, 31 October–2 November 2017; pp. 10A1–10A10. [Google Scholar]
  80. Ansorge, C. Scale Dependence of atmosphere–surface coupling through similarity theory. Bound.-Lay. Meteorol. 2019, 170, 1–27. [Google Scholar] [CrossRef]
  81. Jiang, Q. Influence of swell on marine surface-layer structure. J. Atmos. Sci. 2020, 77, 1865–1885. [Google Scholar] [CrossRef]
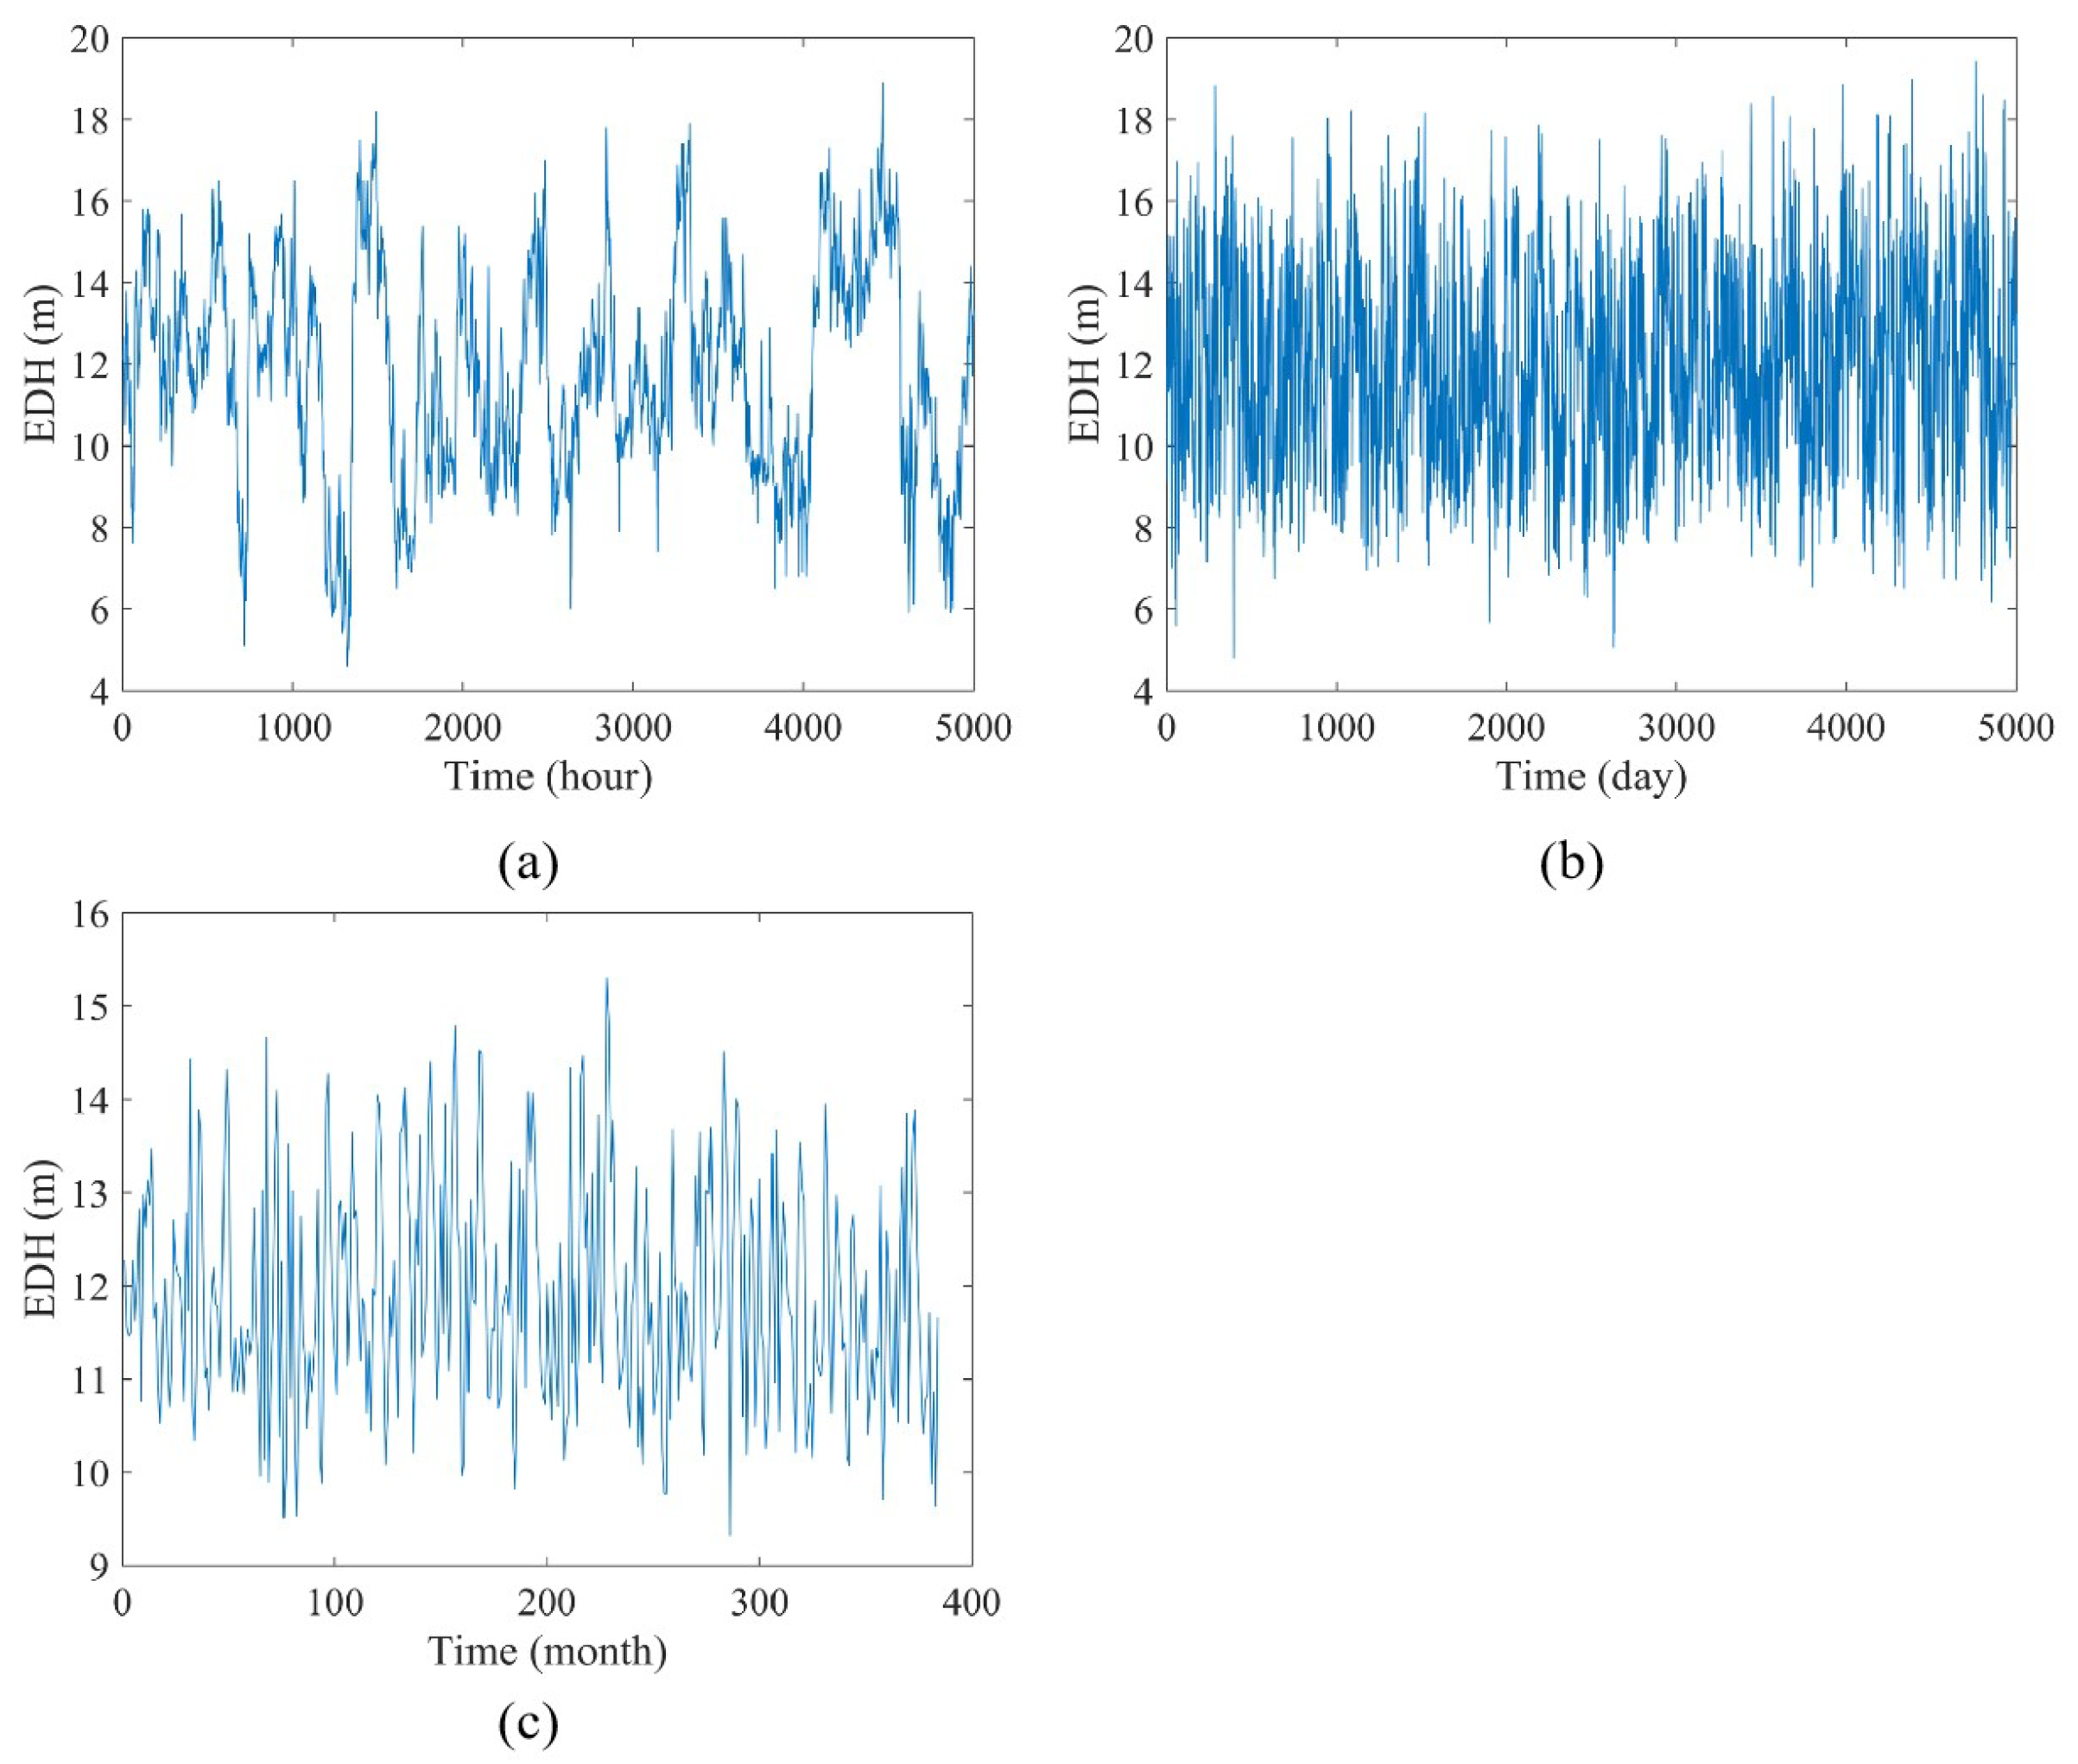
Figure 1. Three datasets of the EDH time series with different timescale:s (a) hourly, (b) daily, and (c) monthly.
Atmosphere 13 02072 g001
Figure 2. The mutual information of the EDH time series, where (a), (b), and (c) are the hourly, daily, and monthly EDH time series, respectively.
Atmosphere 13 02072 g002
Figure 3. The curves of l n C n ( r ) and l n r as m increases for the EDH time series at three different timescales: (a) hourly, (b) daily, and (c) monthly.
Atmosphere 13 02072 g003
Figure 4. The curves of m and correlation dimension D for the EDH time series at three different timescales: (a) hourly, (b) daily, and (c) monthly.
Atmosphere 13 02072 g004
Figure 5. The three-dimensional phase space of the reconstructed EDH time series at three different timescales: (a) hourly, (b) daily, and (c) monthly.
Atmosphere 13 02072 g005
Table 1. ADF test and Ljung–Box test of the EDH time series at different timescales. The t-statistic values are −3.45, −2.87 and −2.57 for 1%, 5%, and 10% significance level, respectively.
Time Scalet-Values of ADFp-Values of Ljung–Box
Hourly−32.670
Daily−24.840
Monthly−4.710
Table 2. Hurst index and fractal dimension of the EDH time series at different timescales.
Time ScaleHurst IndexFractal Dimension
Hourly0.8511.149
Daily0.9441.056
Monthly0.9611.039
Table 3. The delay time τ and embedding dimension m of the EDH time series at different timescales.
Time ScaleDelay Time τ Embedding Dimension m
Hourly157
Daily1115
Monthly411
Table 4. The maximum Lyapunov exponent of the EDH time series at the different timescales.
Time ScaleMaximum Lyapunov Exponent
Hourly0.0393
Daily0.1876
Monthly0.2872
Publisher’s Note: MDPI stays neutral with regard to jurisdictional claims in published maps and institutional affiliations.