Article

Analysis of the Spatio-Temporal Rainfall Variability in Cameroon over the Period 1950 to 2019

by
Valentin Brice Ebodé
Department of Geography, University of Yaounde 1, Yaounde P.O. Box 755, Cameroon
Atmosphere 2022, 13(11), 1769; https://doi.org/10.3390/atmos13111769
Submission received: 15 September 2022 / Revised: 14 October 2022 / Accepted: 18 October 2022 / Published: 27 October 2022
(This article belongs to the Special Issue Long-Term Variability of Atmospheric Precipitation)

Abstract

:
The study of rainfall in the long term is essential for climatic change understanding and socioeconomic development. The main goal of this study was to explore the spatial and temporal variations of precipitation in different time scales (seasonal and annual) in Cameroon. The Mann–Kendall and Pettitt tests were applied to analyze the precipitation variability. In temporal terms, the different regions of Cameroon have recorded significant drops in annual rainfall that Pettitt’s test generally situates around the 1970s. The decreases observed for the northern regions of Cameroon are between −5.4% (Adamawa) and −7.4% (Far North). Those of western regions oscillate between −7.5% (South-West) and −12.5% (West). The southern Cameroon regions recorded decreases varying between −4.3% (East) and −5.9% (Center). In spatial terms, the divisions of the northern, western, and southern regions of Cameroon recorded after the 1970s (a pivotal period in the evolution of precipitation in temporal terms) indicate a precipitation decrease towards the South, the South-West, and the West. This study’s findings could be helpful for planning and managing water resources in Cameroon.

1. Introduction

In the context of current climate change, it is helpful to characterize the spatio-temporal variability of precipitation to correctly assess its impact on natural resources (water, vegetation, etc.) and certain important activities (agriculture, production of hydro-power, etc.) [1,2,3,4]. In some sub-Saharan African countries such as Cameroon, the population essentially depends on small-scale agriculture for its livelihood. However, agricultural practices in this region mainly depend on the rainfed farming system. This implies that rainfall plays an essential role in sustaining livelihoods and economic development across this zone of the continent. Thus, any change in the spatial distribution of rainfall and precipitation amounts can have many consequences on agriculture and other socio-economic activities [5].
The majority of studies on the evolution of precipitation in sub-Saharan Africa have generally been carried out at the regional scale [6,7,8,9,10], since most of these studies were conducted where observational rainfall data were available. Let us briefly recall that, after the 1990s, long-time series of rainfall became rare in sub-Saharan Africa. This scarcity of data is even more marked in Central Africa [11,12]. The active network now only includes 35 stations in the DRC (i.e., 1 station per 67,000 km2), 22 in Cameroon, and less than 20 for all of Gabon, Congo, and Central African Republic [11]. Research dealing directly with the climate and its impact on natural resources (water, vegetation, etc.) has barely emerged in this part of Africa after the 2000s, despite its importance for the sustainable and effective management of these resources.
In sub-Saharan Africa, works devoted to rainfall variability study have mainly been carried out since the 1980s [13,14,15,16]. Many of these works are based on trends and detection of ruptures in the rainfall data. The obtained results confirm, in West Africa’s case, a decline from the 1970s [13,14,15,16]. In Central Africa, the most perceptible rainfall fluctuations have been observed on a seasonal time scale [17,18,19]. Ebodé et al. [20] recently highlighted, in the case of the Nyong basin, that the most significant rainfall variations are those of the dry seasons (summer and winter). Summer rainfall generally increased around the 1970s, while winter rainfall decreased.
In Cameroon, some authors have studied the evolution of rainfall at the national and regional scales [17,21,22]. However, most of these studies were limited to annual and seasonal series analyses for individual stations or groups of stations. In this study, a much broader vision was adopted and the spatio-temporal variability of precipitation was approached using the same time steps for the different regions of the country. In addition, this study is based on the series (1950–2019) that include the two recent decades (2000 and 2010), which is not the case with previous studies. Finally, older studies focus primarily on trend analysis. They have rarely put into perspective the need to examine the variation in the short-term upward and downward sub-trends that characterize the fluctuations of the rainfall series. Separating sub-trends over short periods (e.g., decades) from that of the longer period allows physical explanations to be attached to upward and downward trends in the data [23]. In addition, analyses of the correlation between rainfall and possible forcings (such as sea surface temperature) can help predict future rainfall variability, which is fundamental for planning water resource uses.
This study is devoted to the evolution of rainfall analyses in all the different regions of Cameroon over a recent period, using updated rainfall series. It appears fundamental for this country, whose economy is based essentially on rain-fed agriculture. In addition, the new data and inputs could help manage the demand for water resources in long-term planning, as well as improve the forecasts of rainfall evolution in these regions. Its main objective is to document the trend and amplitude of changes in the precipitation regime in the studied regions.

2. Materials and Methods
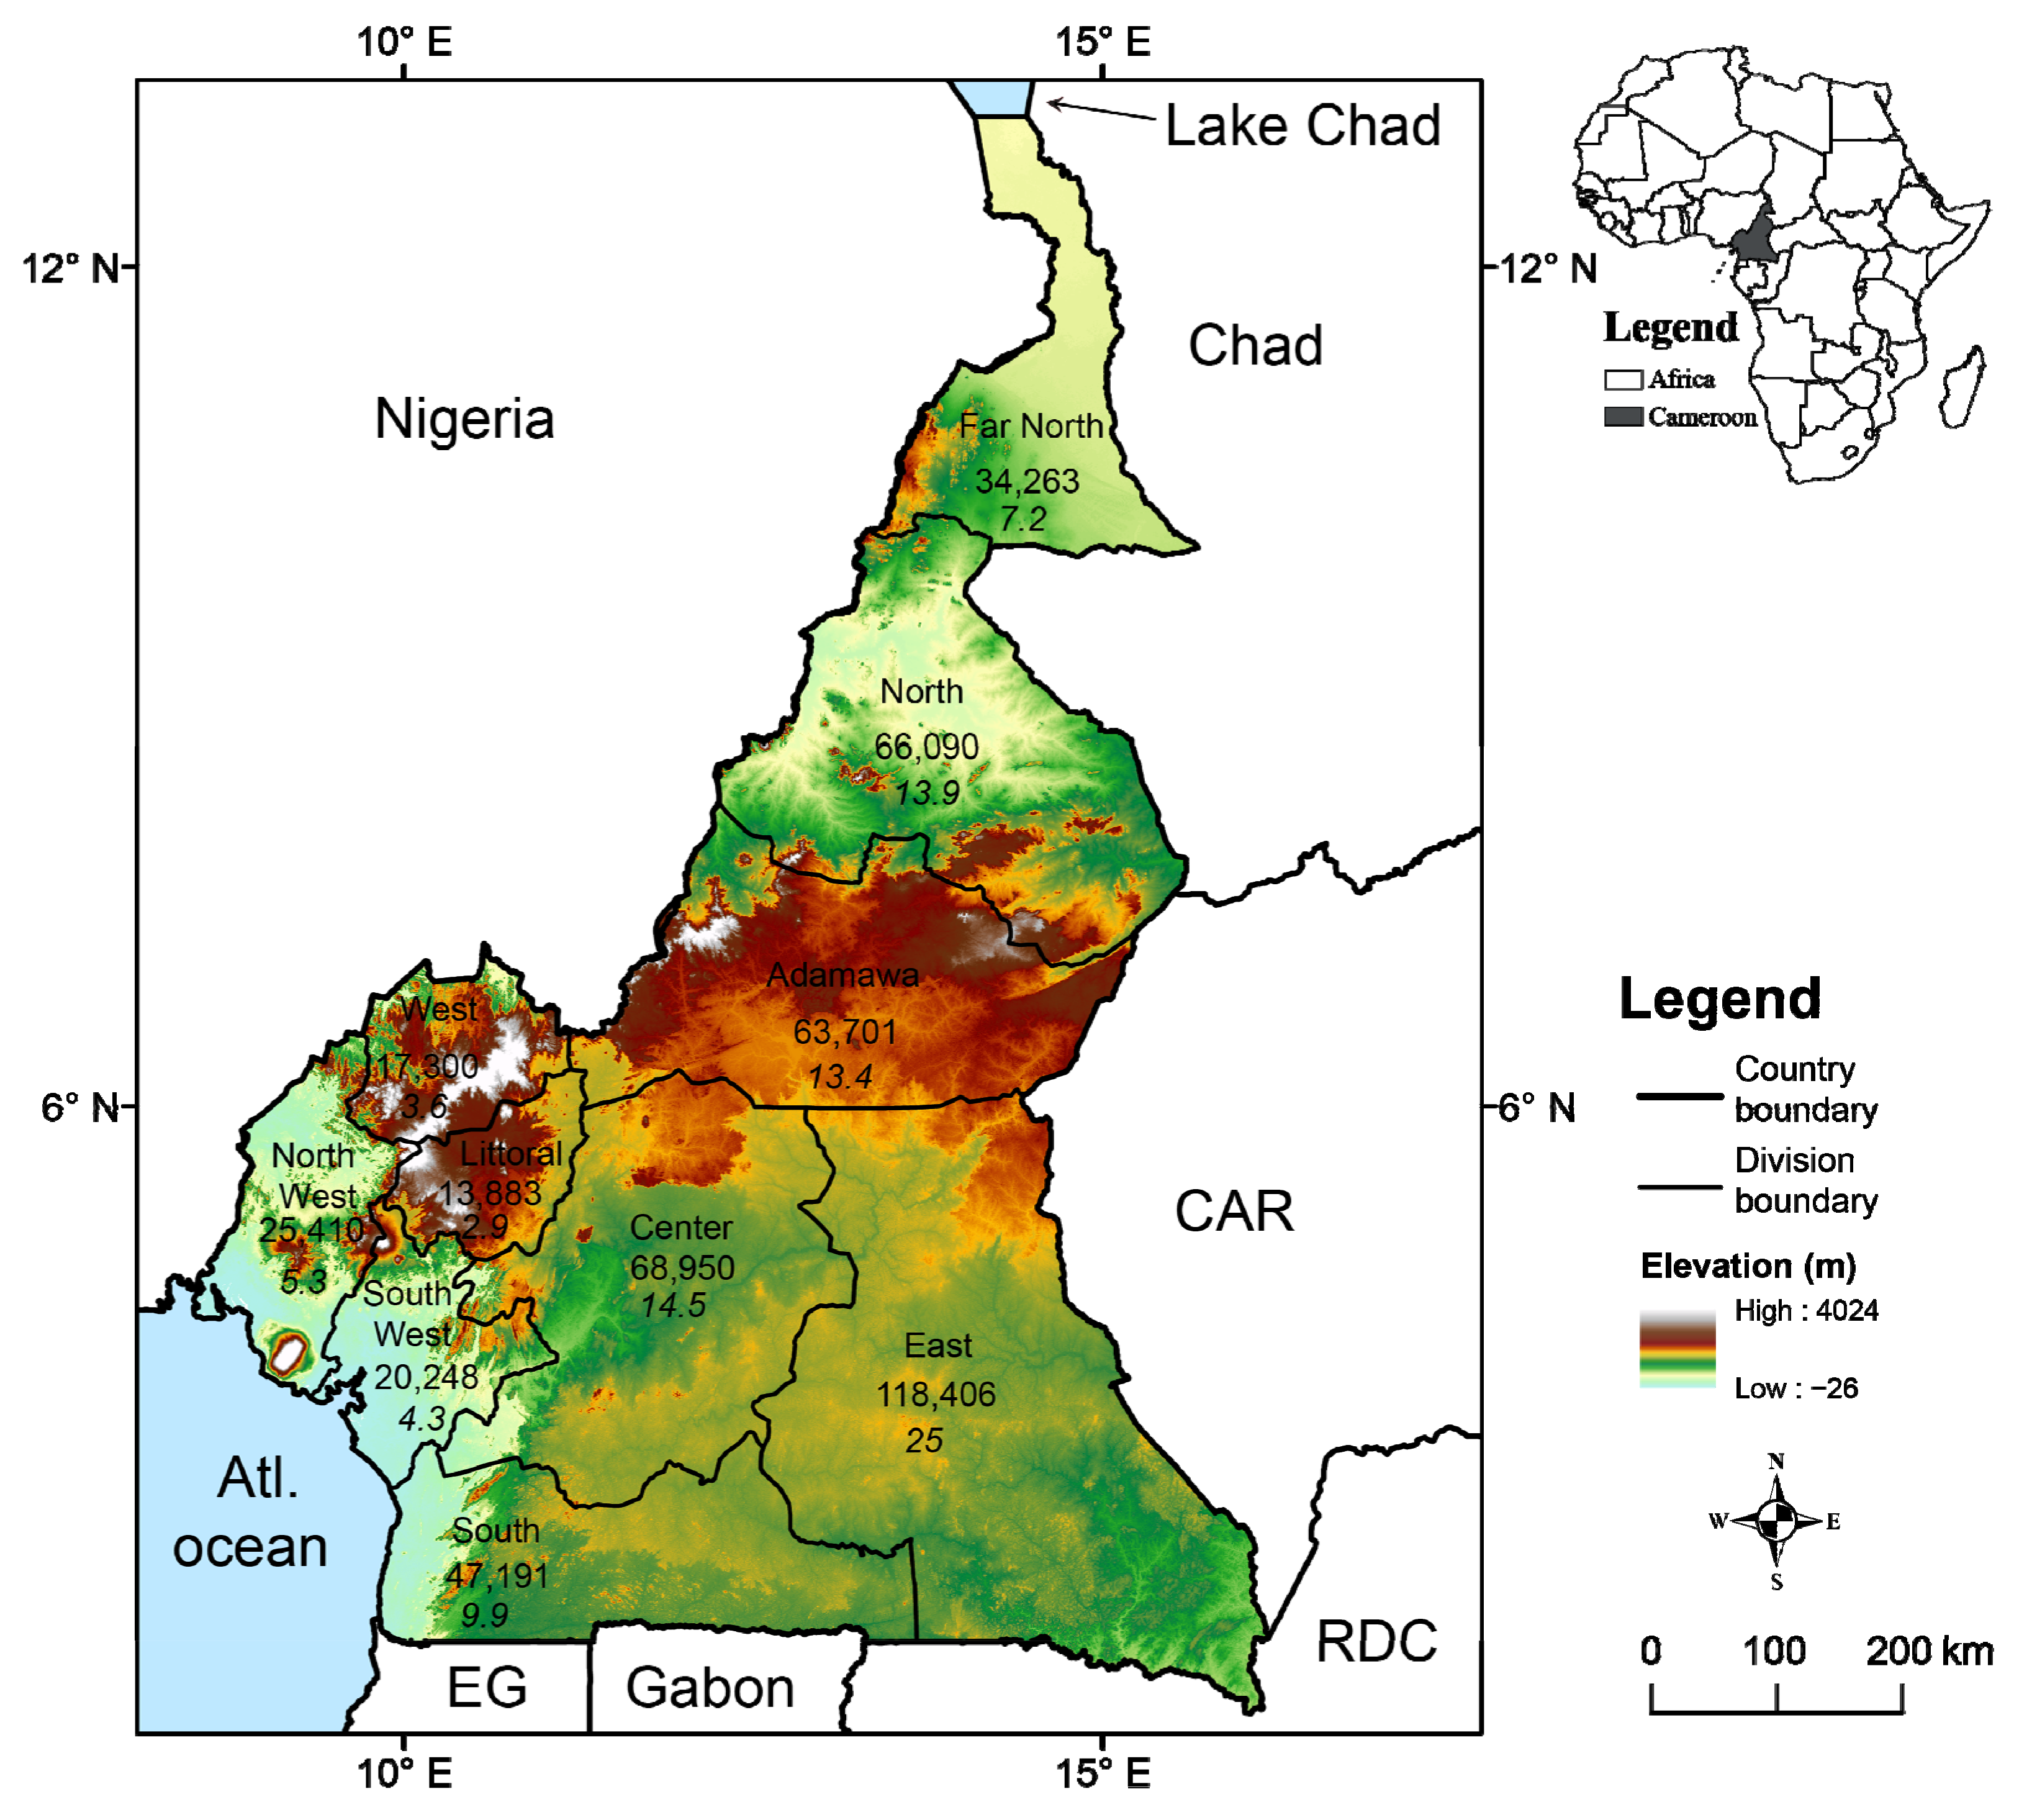
2.1. Study Area

Cameroon (475,442 km2) is a country in the Gulf of Guinea (Central Africa). Having a large extent in latitude (1200 km from north to south), the country has the shape of a triangle whose base runs along the 2nd degree of northern latitude, while the summit, bordering Lake Chad, reaches the 13th parallel. It is limited by Nigeria to the north-north-west, Chad to the north-north-east, the Central African Republic to the east, the Republic of Congo to the south-east, Gabon to the south, and Equatorial Guinea and the Gulf of Guinea to the south-west (Figure 1).
The relief of Cameroon is varied, and includes the lowlands (Mamfe basin in the South-West, Benoue basin, and the northern plain); the plateaus such as the South Cameroonian plateau, with an average altitude of 650 m, and the Adamaoua plateau, whose average altitude is 1000 m; and the highlands, the best known of which are the Mandara mountains (Far North), Alantika (North), and the still-active volcanoes of Oku (North-West) and Mount Cameroon (South-West) which is, at an altitude of 4095 m, the highest point in West Africa.
Climatically, the Adamaoua Plateau separates “wet/equatorial” Cameroon from “dry/tropical” Cameroon. The equatorial domain (southern Cameroon plateau, western highlands, and coastal lowlands) is characterized by abundant rainfall (Table 1 and Table 2). On the South Cameroonian plateau (encompassing the administrative regions of the Center, South, and East), there are four distinct seasons (spring, from march to June; summer, July and August; autumn, from September to November; winter, from December to February) (Table 1). In the western highlands (encompassing the North-West, West, and South-West Administrative Regions) and the coastal lowlands (Littoral), heavy rains fall for nine consecutive months from march to November (Table 2). The tropical domain is distinguished by scanty rainfall. It is characterized by a rainy season from April or May to October.
The vegetation encountered in Cameroonian territory is diversified and can be divided into two large zones: the equatorial part and the tropical part. The vegetation of the equatorial part is composed of the dense humid forest of the South and East formed of very tall trees; of the gallery forests of the West and North-West along the watercourses; and mangroves, in the lowlands on the Littoral and South-West coasts. The tropical part is covered with savannah, including the wooded savannah of Adamaoua, which is rich in shrubs, the grassy savannah of the North, and the steppe of the Far North, which is poor in trees and grass [24].

2.2. Data Sources

The rainfall series used in this work are those of the Climate Research Unit (CRU). CRU data are available since 1901, via the site https://climexp.knmi.nl/selectfield_obs2.cgi?id=2833fad3fef1bedc6761d5cba64775f0/ (accessed on 15 July 2022). They are available in NetCDF format, at a monthly time step and a spatial resolution of 0.25° × 0.25°. This precipitation product is obtained from gauge interpolations.

2.3. Data Analysis

The analysis of rainfall (at seasonal and annual time scales) was carried out using Mann–Kendall [25] and Pettitt [26] tests at the 95% significance level.
To analyze rainfall series, the Mann–Kendall test was first used to indicate if there are trends in the data and if these trends are significant. This test is based on the test statistic “S”, defined as follows:
S = i = 1 n 1 j = i + 1 n s g n   ( x j x i )  
where xj are the sequential data values; n is the length of the data set; and sgn = (θ) if θ > 1, 0 if θ = 0, and −1 if θ < 0. There is no significant trend in the series analyzed when the calculated p-value is above the chosen significance level.
In addition to the Mann–Kendall test, the Pettitt test was also used to analyze rainfall series. The approach after Pettitt [26] is commonly applied to detect a single change-point in hydrological series or climate series with continuous data. It tests the H0: The T variables follow one or more distributions that have the same location parameter (no change), against the alternative: a change-point exists. The Pettitt-test is conducted in such a way:
U t , N = i = 1 t i = t + 1 N D i j  
with Dij = Sign (XiXj) with: sign (x) = 1 if x > 0, 0 if x = 0, and −1 if x < 0. If the null hypothesis is rejected, an estimate of the date of discontinuity is given by defining the maximum in the absolute value of the variable Ut, N.

3. Results and Discussion

The precipitation variability results are presented by zone, including regions with similar climatic conditions from the point of view of the volumes precipitated and the seasonal distribution of the rains. Thus, the ten regions have been grouped into three main zones, namely: the northern part (including Adamaoua, the North, and the Far North), the western part (including the Littoral, the North-West, the West, and the South-West) and the southern part (including the Centre, the South, and the East).

3.1. Interannual Variability of Annual and Seasonal Rainfall

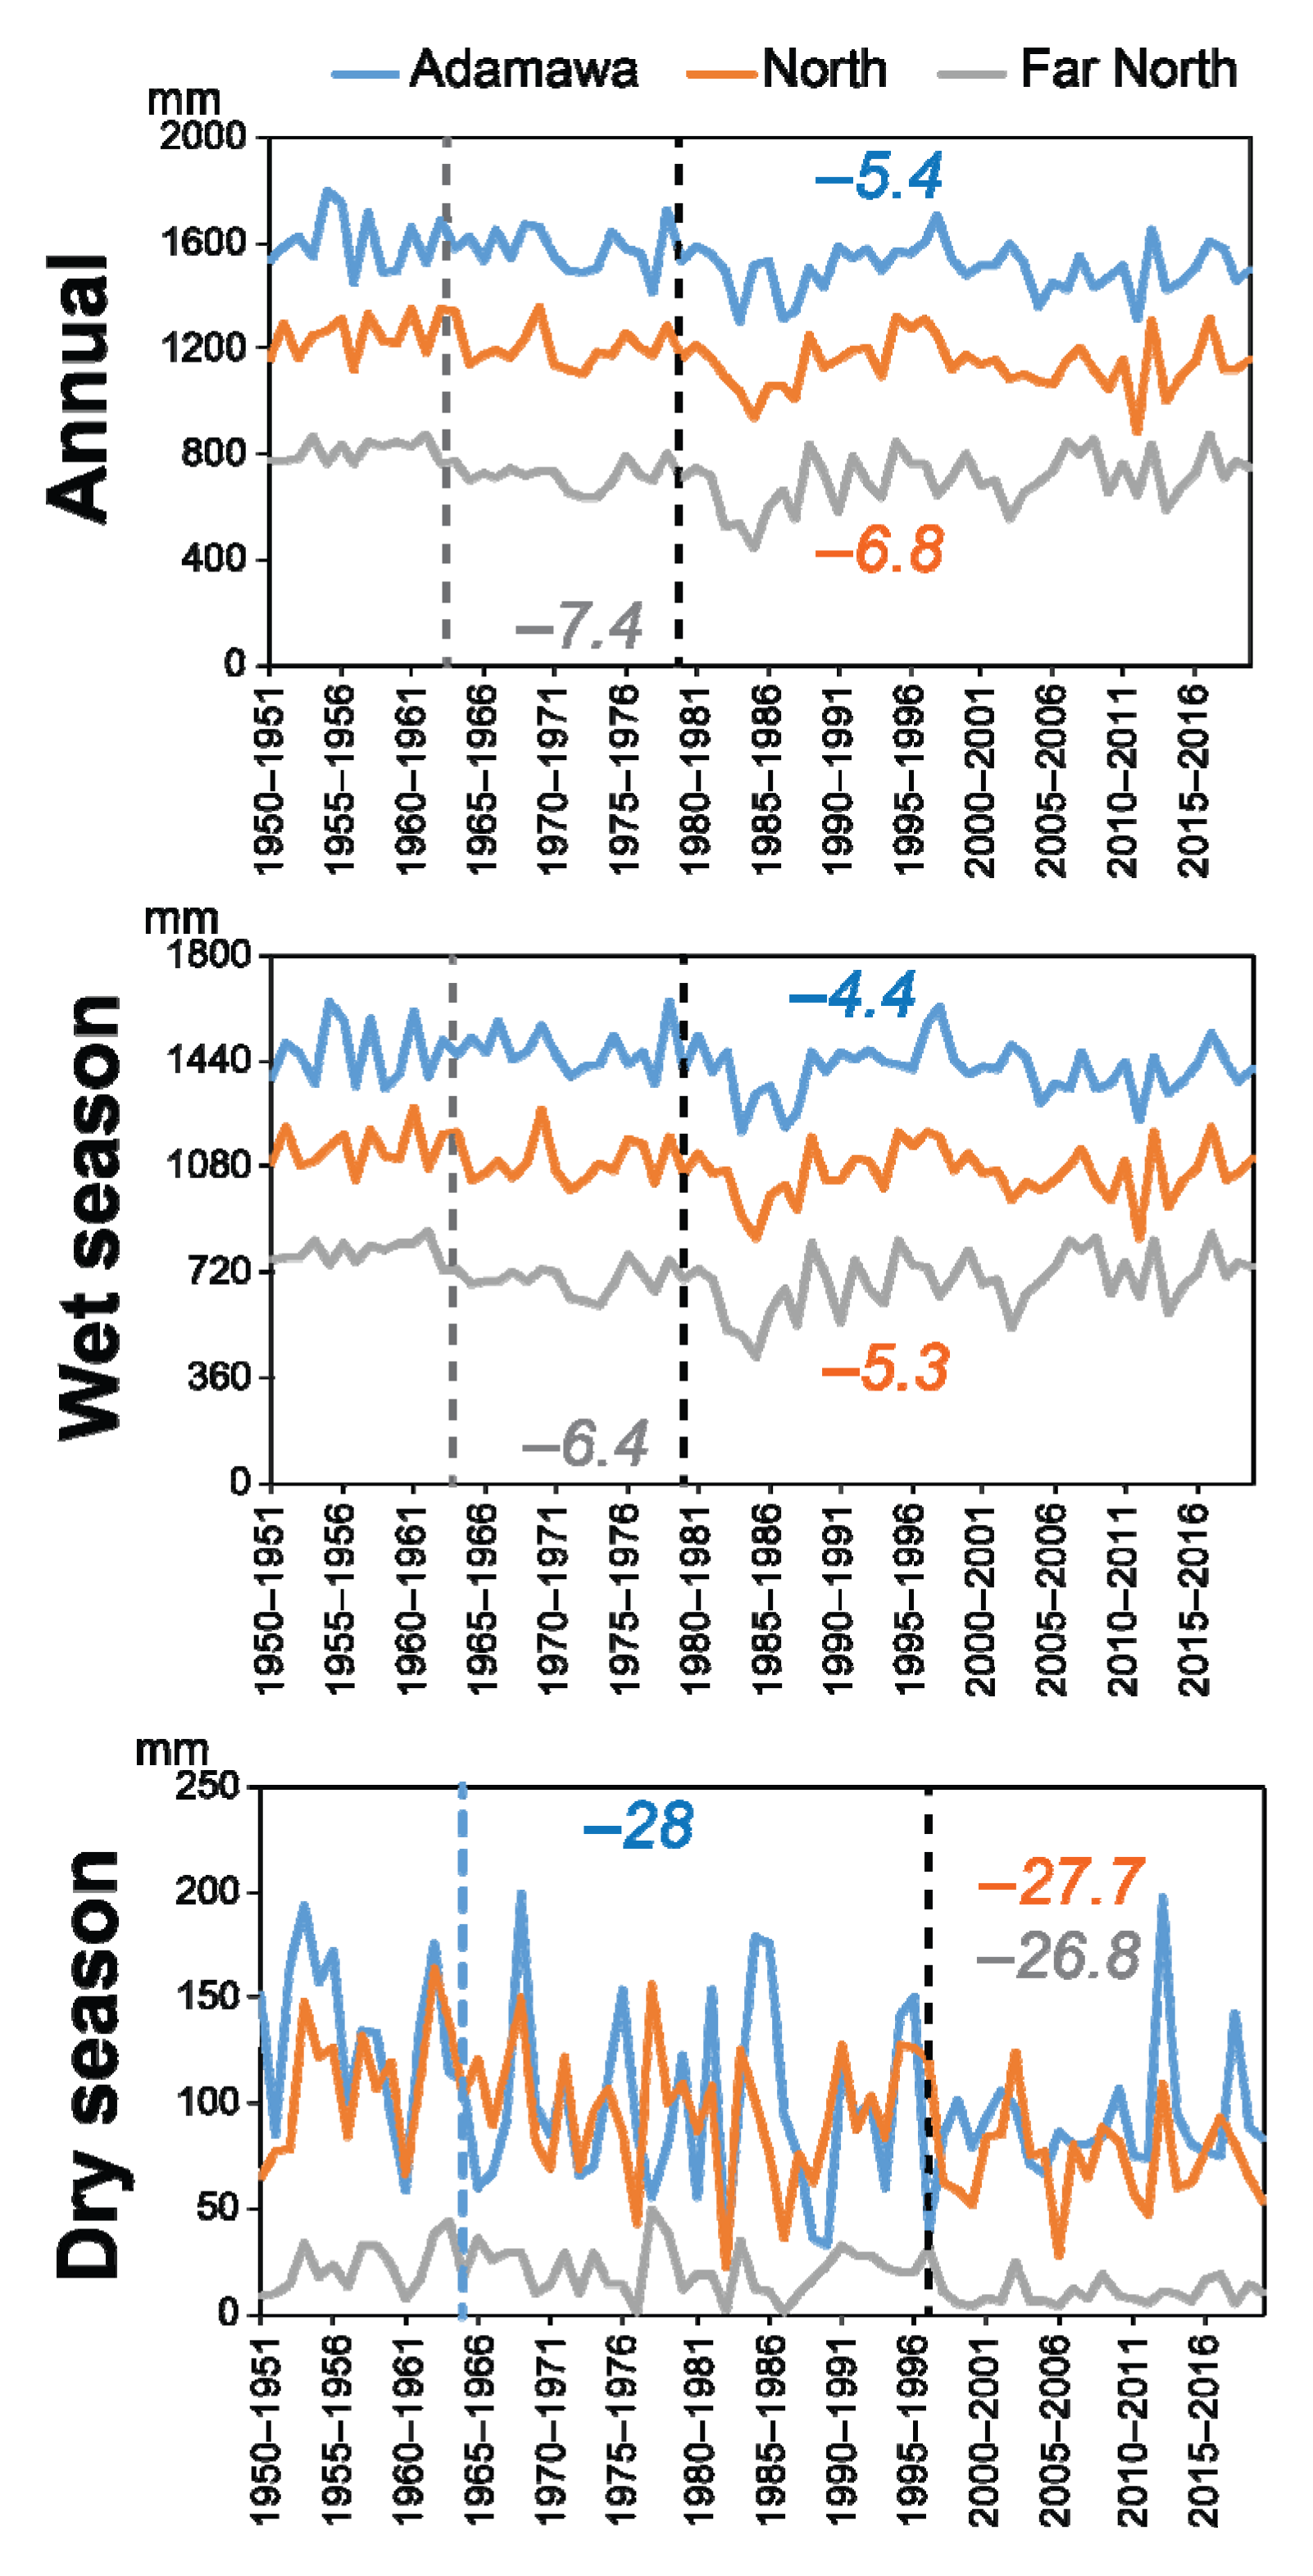
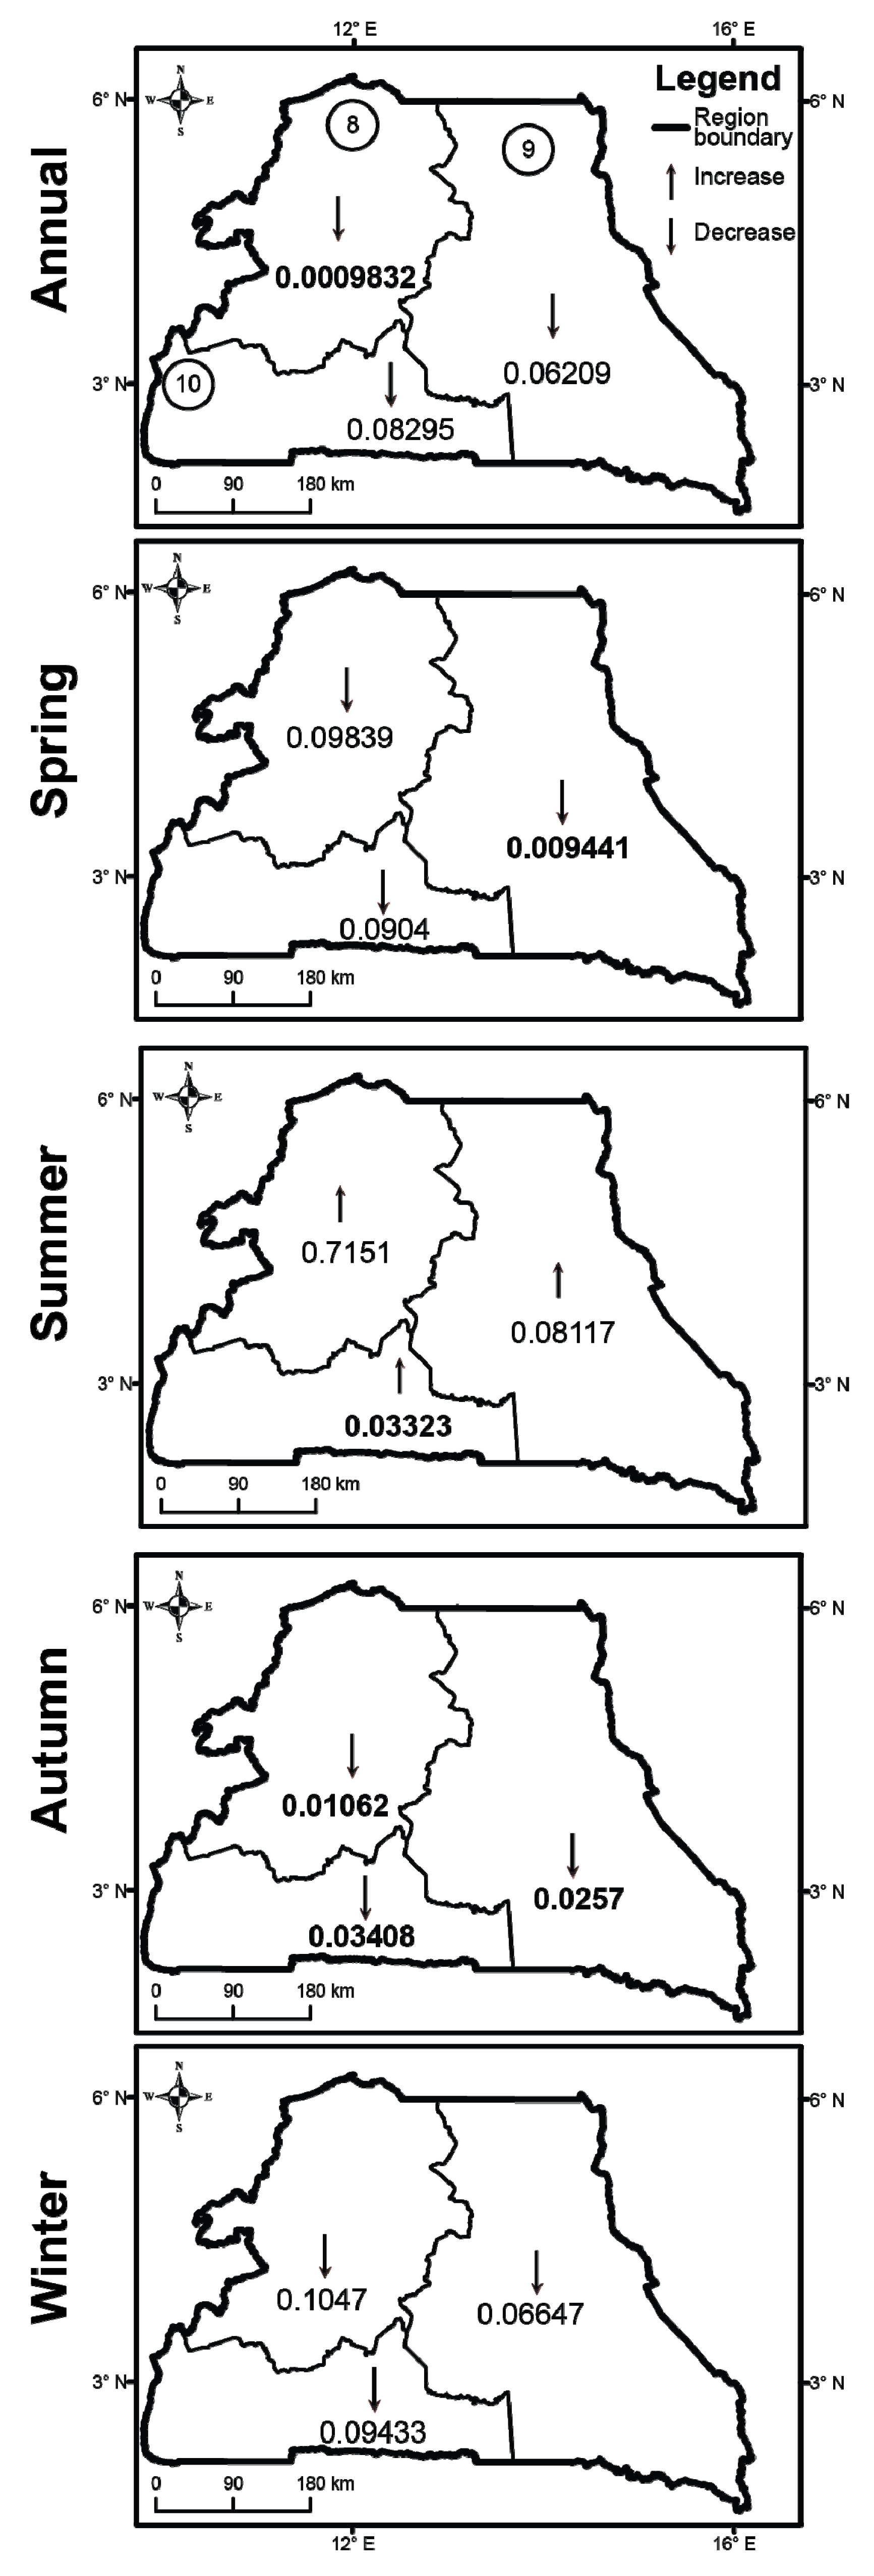
3.1.1. In the Northern Regions

The annual rainfall is decreasing in the regions of the northern part of Cameroon. According to the Mann–Kendall test, these decreases are statistically significant only for the North and Adamaoua regions (Figure 2). The Pettitt test revealed breaks in the annual rainfall series in these regions in 1962–1963 (Far North) and 1979–1980 (North and Adamaoua). The deficits recorded following these ruptures are −5.4% (Adamaoua), –6.8% (North), and −7.4% (Far North) (Figure 3). Through these deficits, we notice that the decrease in rainfall becomes more significant as one progresses in latitude towards the North. The decadal deviations from the interannual mean analysis shows a general drop in rainfall in the northern part regions of Cameroon from the 1970s (Table 3). However, in the Adamaoua and North regions, this decrease was only periodically interrupted during the 1990s (Table 3).
In the Far North region, on the other hand, the increase that began in the 1990s seems to have lasted until the current decade (Table 3). The precipitation evolution in the Adamaoua and North regions in recent decades is similar to that observed in equatorial central Africa [19,20,27]. Contemporary rainfall variations in the Far North region are similar to what has been observed in West Africa and nearby [15,16,28,29].
The rainfall of the rainy season recorded the same evolutions as the annual rainfall. According to the Mann–Kendall test, the decreases noted are only statistically significant for the Adamaoua and North regions (Figure 2). According to Pettitt’s test, the breaks occurred in this season’s rainfall series in the same years as the annual rainfall. The deficits recorded following these ruptures are between −4.4% (Adamaoua) and −6.4% (Far North) (Figure 3). The decadal deviations in rainfall in the rainy season in these three regions are similar to those in annual rainfall (Table 3). These similar trends observed between the annual rainfall and the rainy season are quite logical insofar as, for these three regions, the rainfall of the rainy season represents the bulk of the total rainfall recorded during the year.
The rainfall of the dry season is decreasing in the regions of the northern part of Cameroon. These decreases are all statistically significant according to the Mann–Kendall test (Figure 2). According to the Pettitt test, the breaking point occurred in the Adamaoua series in 1964–1965 (–28%). The rupture occurred in the North and Far North series in 1996–1997. The variations recorded following the latter are −27.7% and −26.8% (Figure 3). The analysis of decadal deviations shows, in the case of Adamaoua, a general decrease in rainfall since the 1970s (Table 3). In the case of the other two regions, the decrease in rainfall that occurred during the 1980s was only periodically interrupted during the following decade (Table 3).

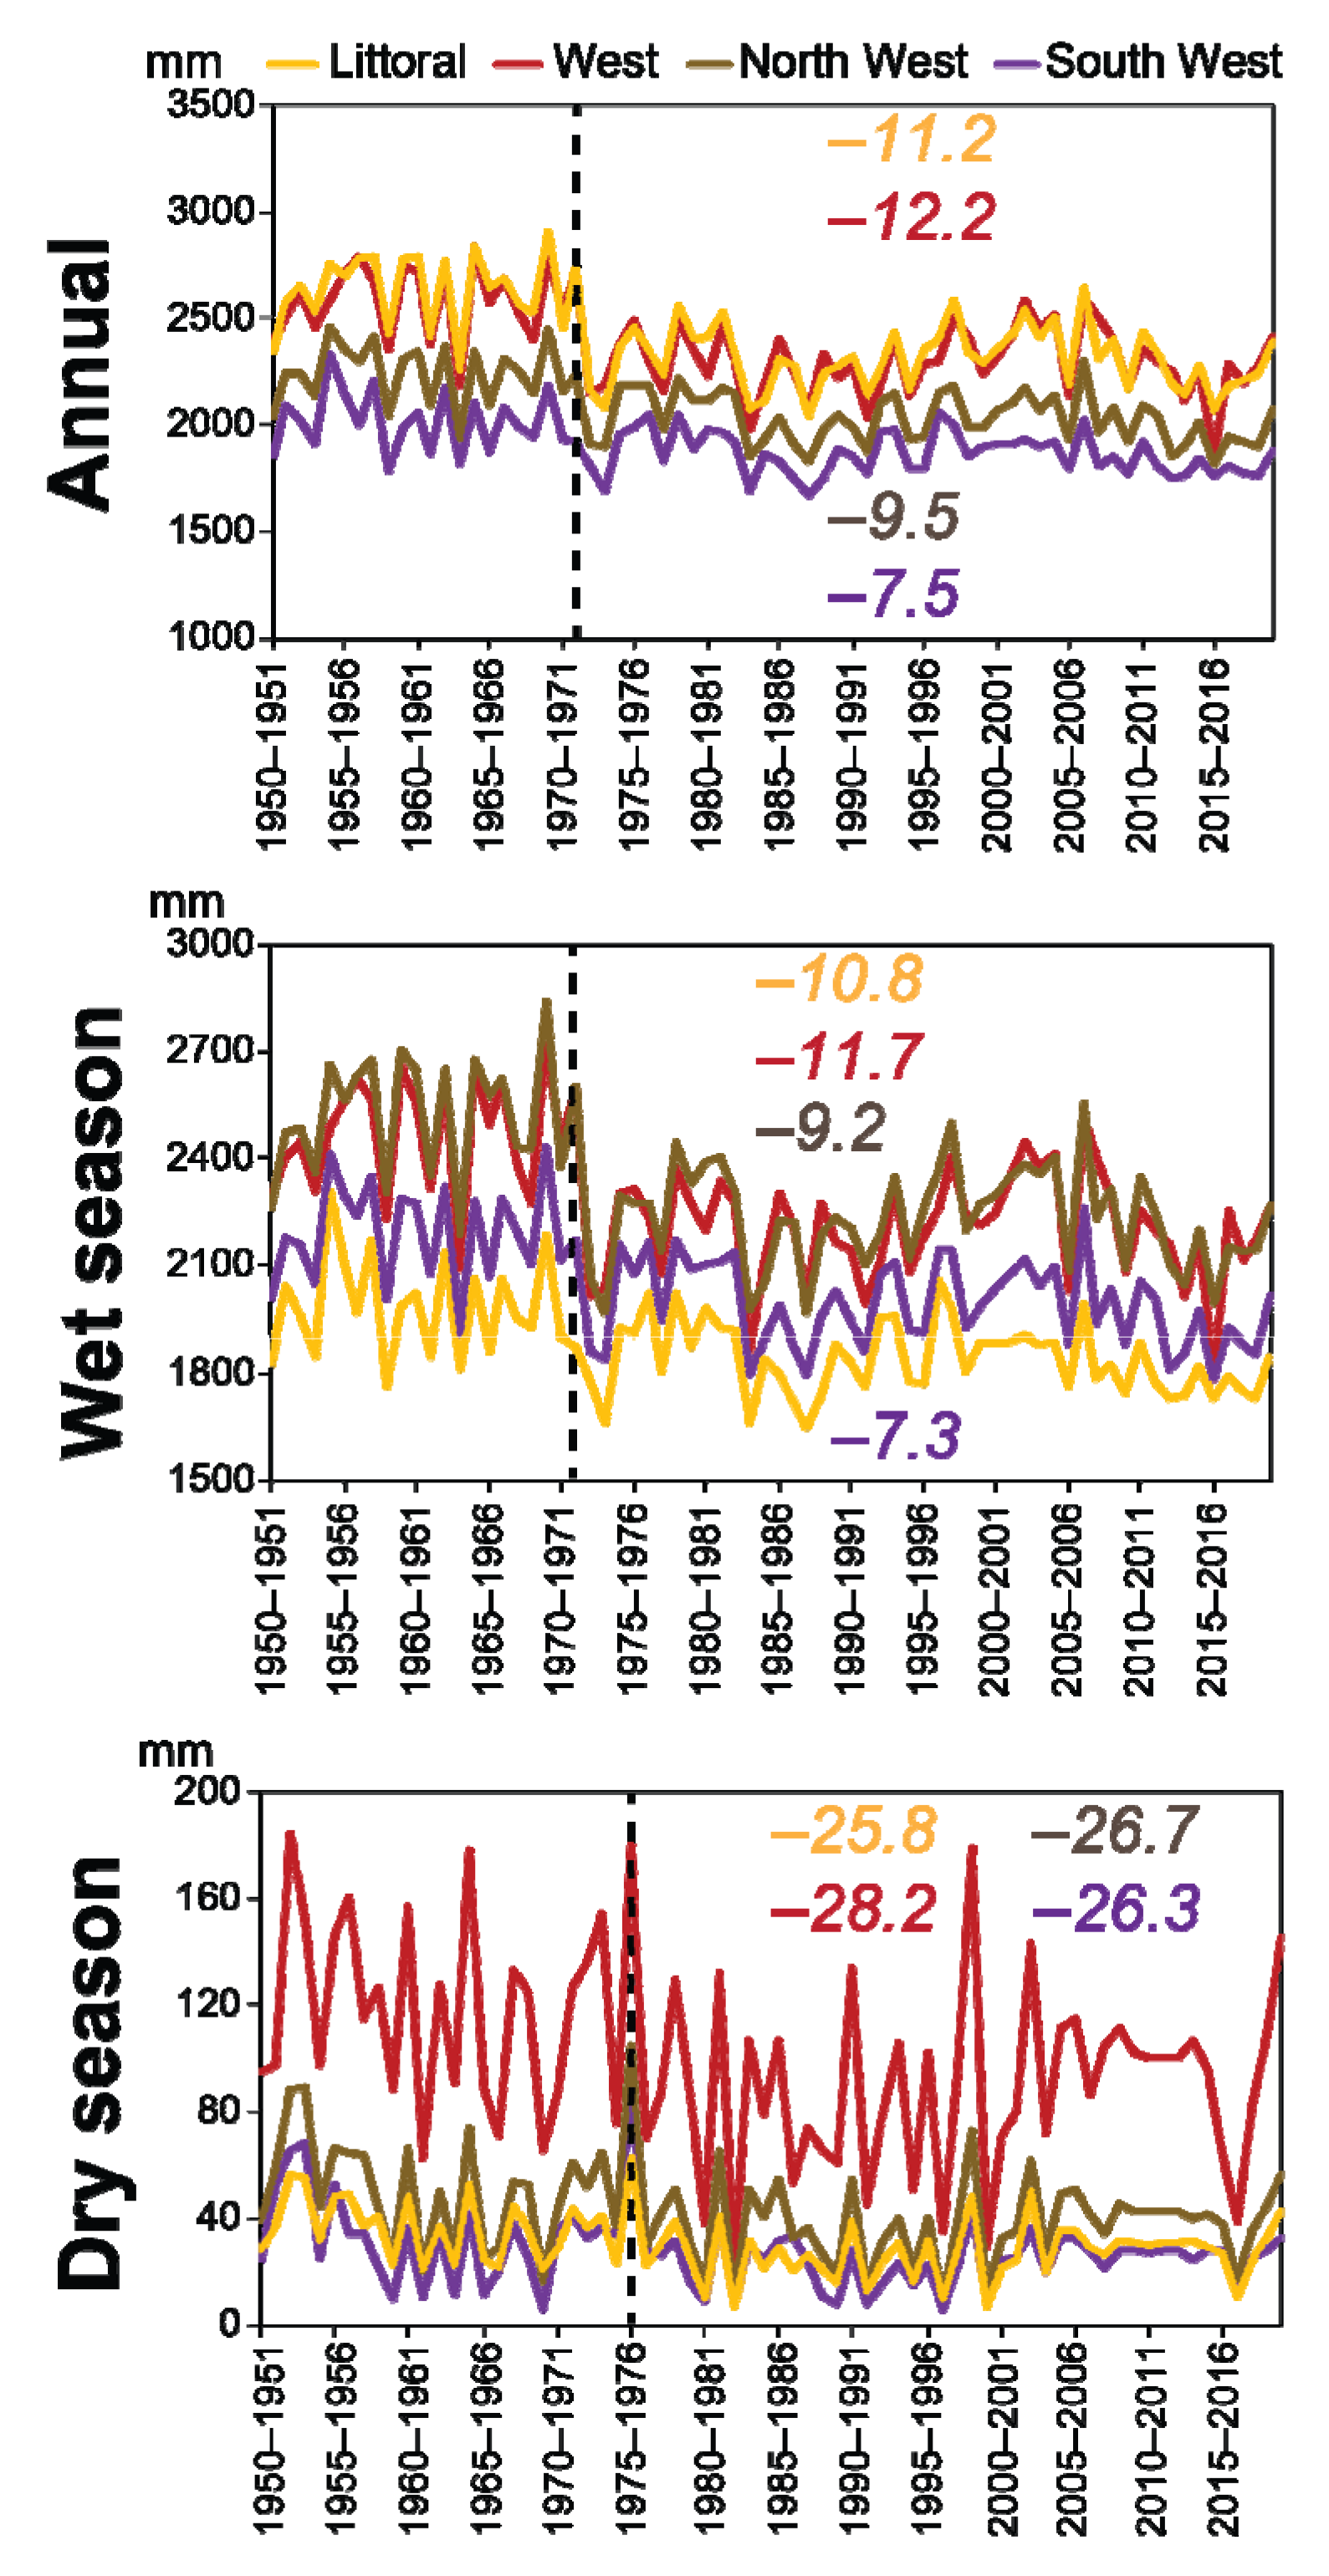
3.1.2. In the Western Regions

The annual rainfall in the western regions of Cameroon decreased significantly according to the Mann–Kendall test (Figure 4). According to the Pettitt test, a rupture was identified in their various series in 1971–1972. The deficits recorded following this rupture are between −7.5% (South-West) and −12.5% (West) (Figure 5). The analysis of decadal deviations shows that the decline in rainfall that began in the regions of the western regions of the country during the 1970s was only interrupted during the 1990s (Table 3). It also emerges from this analysis that the 2010 decade was the driest ever observed in these regions.
As in the annual time step, the rainfall of the rainy season decreased significantly according to the Mann–Kendall test in the different regions of the western part of Cameroon (Figure 4). According to the Pettitt test, they also record a break in 1971–1972. The deficits recorded following this rupture vary between −7.3% (South-West) and −11.7% (West) (Figure 5). The decadal variations of this season’s rainfall are similar to those highlighted for the annual rainfall (Table 3).
According to the Mann–Kendall test, the decreases observed for dry season rainfall are not significant in the case of the North-West and West regions (Figure 4). The Pettitt test, for its part, highlights a break in 1975–1976 in the different series of rainfall of this season. The deficits generated by this rupture oscillate between −25.8% (Littoral) and −28.2% (West) (Figure 5). The analysis of decadal deviations shows that, for this season, rainfall never again reached normal after the 1970s in these four (4) regions (Table 3).

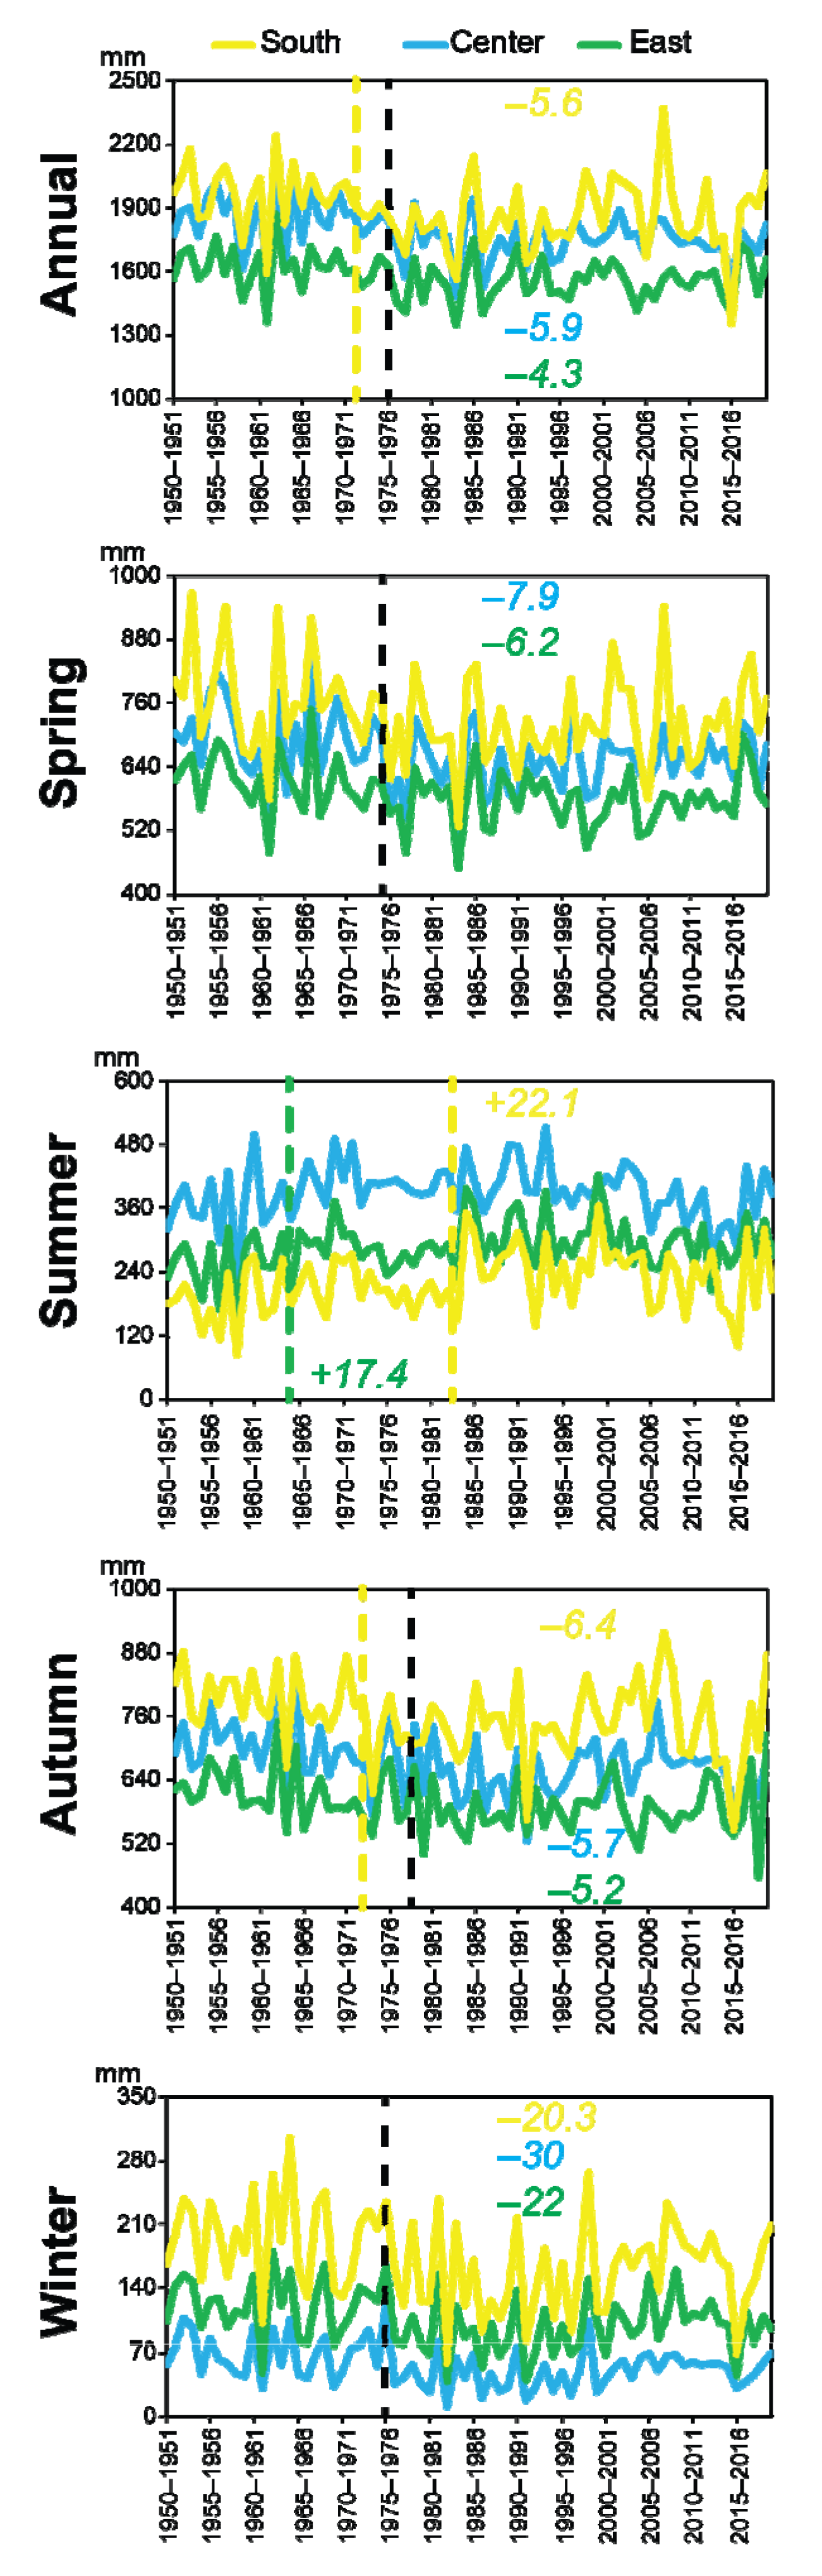
3.1.3. In the Southern Regions

In the southern regions of Cameroon, the annual rainfall in the Center region is the only one for which the observed drop is statistically significant according to the Mann–Kendall test (Figure 6). For its part, the Pettitt test highlights, in the case of the Center and East regions, a break in 1975–1976. The deficits observed following this rupture are respectively −5.9% and −4.3% (Figure 7). For the South region, the break highlighted by the Pettitt test occurred in 1971–1972 (−5.6%) (Figure 7). The decadal deviations show a general drop in annual rainfall during the 1970s. However, a slight increase was noted during the 2000s (Center and South) and 2010s (East) (Table 4).
Regarding the rainy seasons, in the case of spring, the East region is the only one to have recorded a significant drop according to the Mann–Kendall test (Figure 6). The Pettitt test identified in the series of spring rainfall of the Center and East regions a break in 1975–1975. The deficits caused by these ruptures are −7.9% and −6.2% (Figure 7). According to the Mann–Kendall test, the autumn rainfall statistically decreases in the three (3) regions of the southern part of Cameroon (Figure 6). The Pettitt test identified in the series of the Center and East regions a break in 1978–1979. The decreases recorded following the latter are −5.7% and −5.2% (Figure 7). The rupture identified in the series of autumn rainfall in the southern region occurred in 1972–1973 (−6.4%) (Figure 7). The decadal deviations of the rainy season’s rainfall are similar to those highlighted for the annual rainfall (Table 4).
In the case of the dry seasons (summer and winter), the rainfall evolved in opposite trends. According to the Mann–Kendall test, summer rainfall increases. This increase is only significant for the South region (Figure 6). The Pettitt test identifies breaks in the series of summer rainfall of the Center and South regions, respectively, in 1964–1965 (+17.6%) and 1982–1983 (+22.1%) (Figure 7). Decadal deviations reveal an increase in summer rainfall during the 1960s (Center) and 1980s (East and South), then a general decrease during the 2010s (Table 4). Overall, winter rainfall in the southern part regions of Cameroon decreases non-significantly according to the Mann–Kendall test (Figure 6). Pettitt’s test highlights a break in their series in 1975–1976. The deficits recorded are between –20.3% (South) and –30% (Center) (Figure 7). From the 1980s, winter rainfall in these regions experienced a decline that was only interrupted during the 2000s (Table 4).
This study had different results from those obtained by previous studies in the regions of the southern part of Cameroon. Previous studies indeed maintain that there is no break in their annual rainfall series [17,19], which is not the case with the present study, which identified downward breaks during the 1970s. The difference in results could arise from the difference in the rainfall sources used. This study is based on CRU data; however, the previous studies used other data sources (stationary, Tropical Rainfall Measuring Mission (TRMM), System of Environmental Information on Water Resources and their Modeling (SIEREM)).
Some studies in Central Africa have highlighted an evolution in opposite trends of the rainfall of the winter and summer dry seasons between the decades 1960/1980 and 1990 [17,19]. This is also the case in this study. However, this study reveals a reversal of these trends from the 2000s, which has only been demonstrated to date by very few studies [20,30,31].

3.2. Spatial Evolution of Annual and Seasonal Rainfall

The fact that the 1970s was identified as a pivotal period in the evolution of rainfall in Cameroon led us to verify whether the spatial distribution of rainfall was also modified after this decade. This is the reason why we chose to study the spatial distribution of rainfall in the regions investigated during the decades 1950–1970 and 1980–2010.

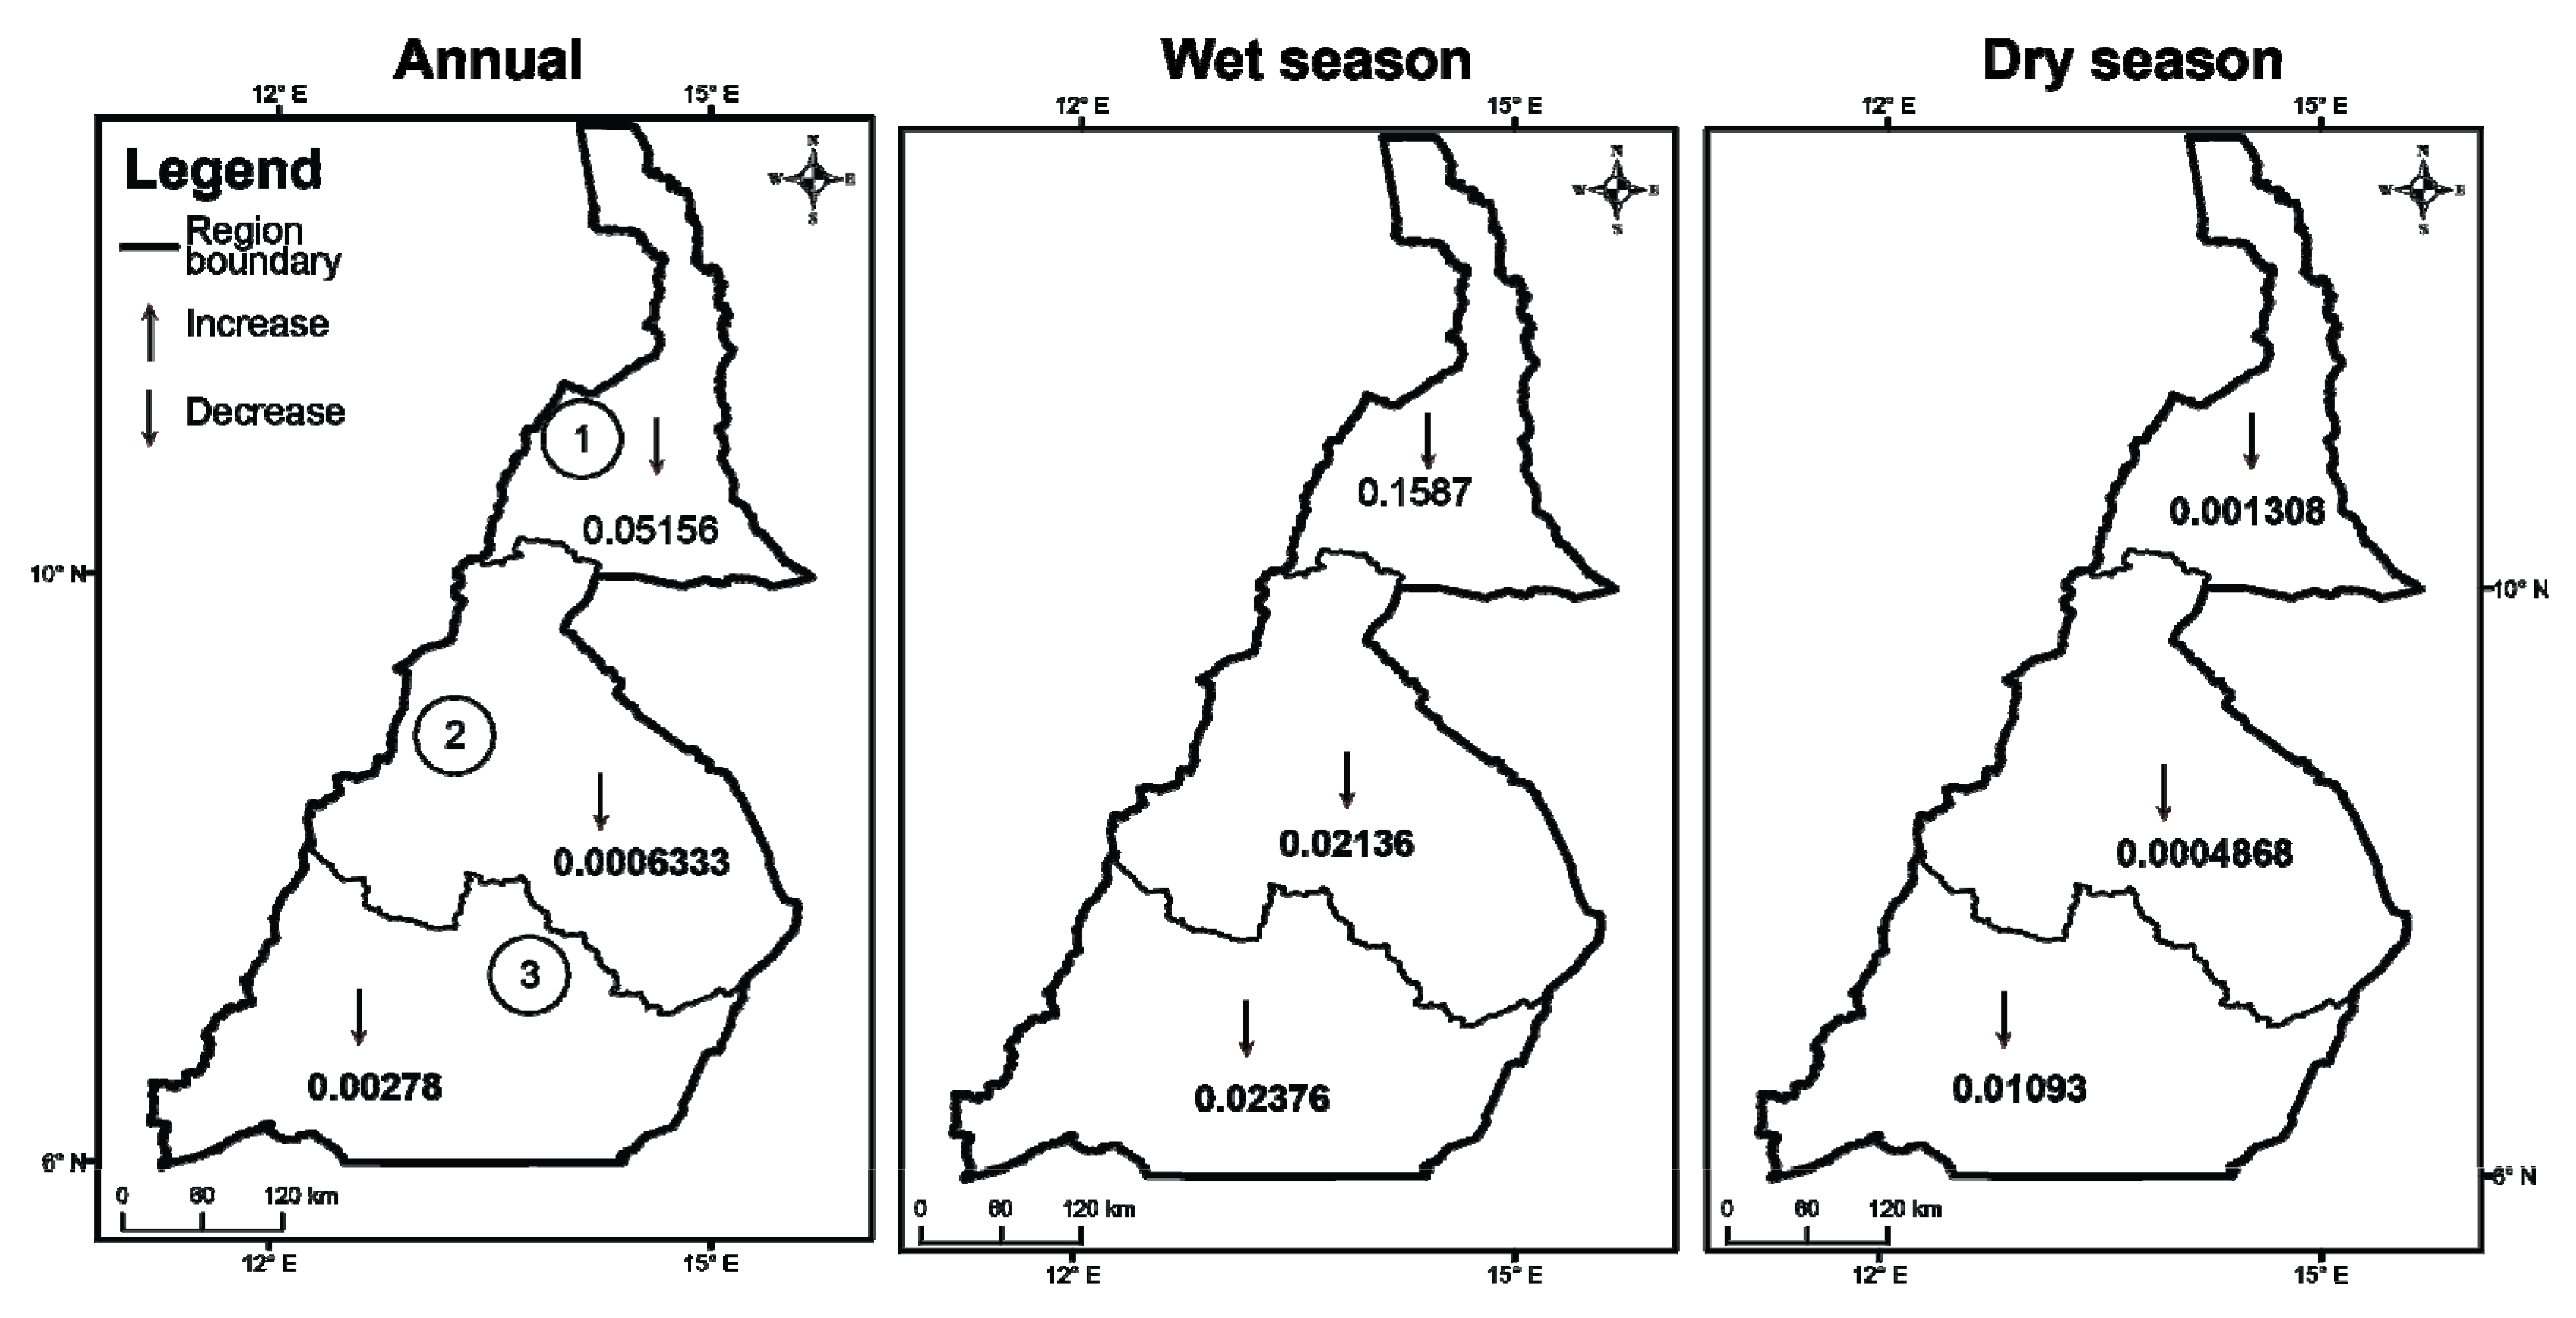
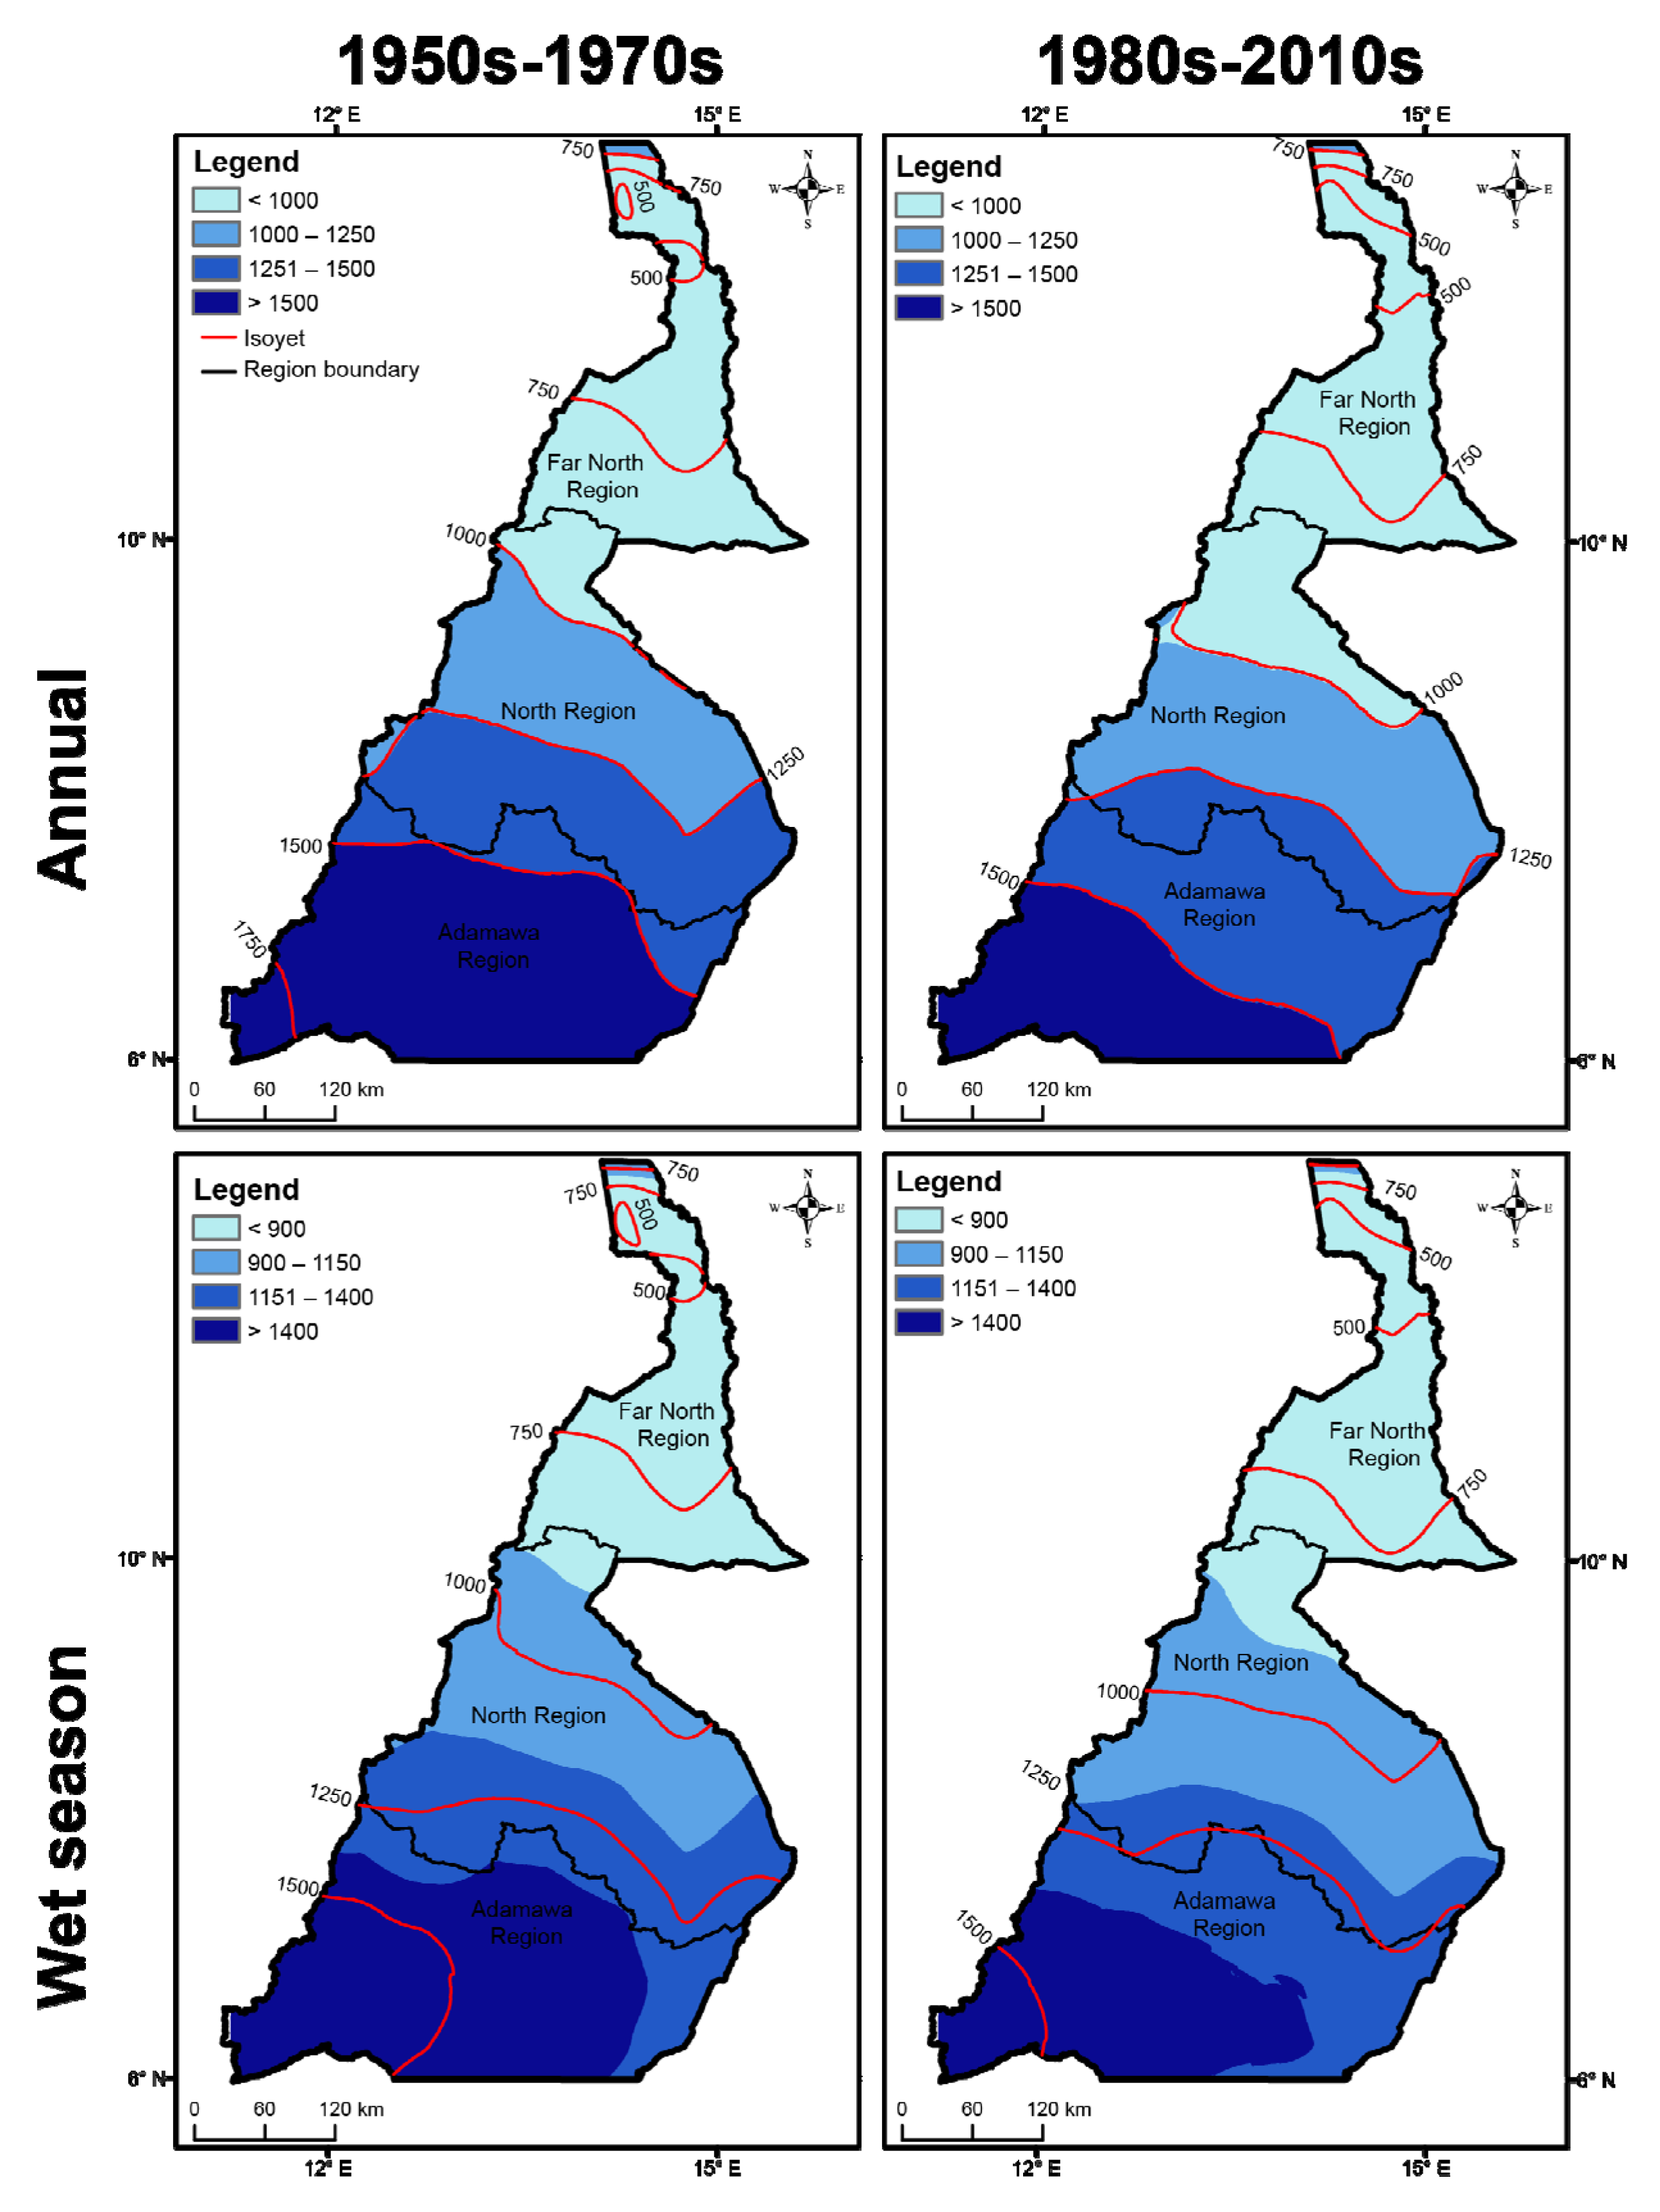
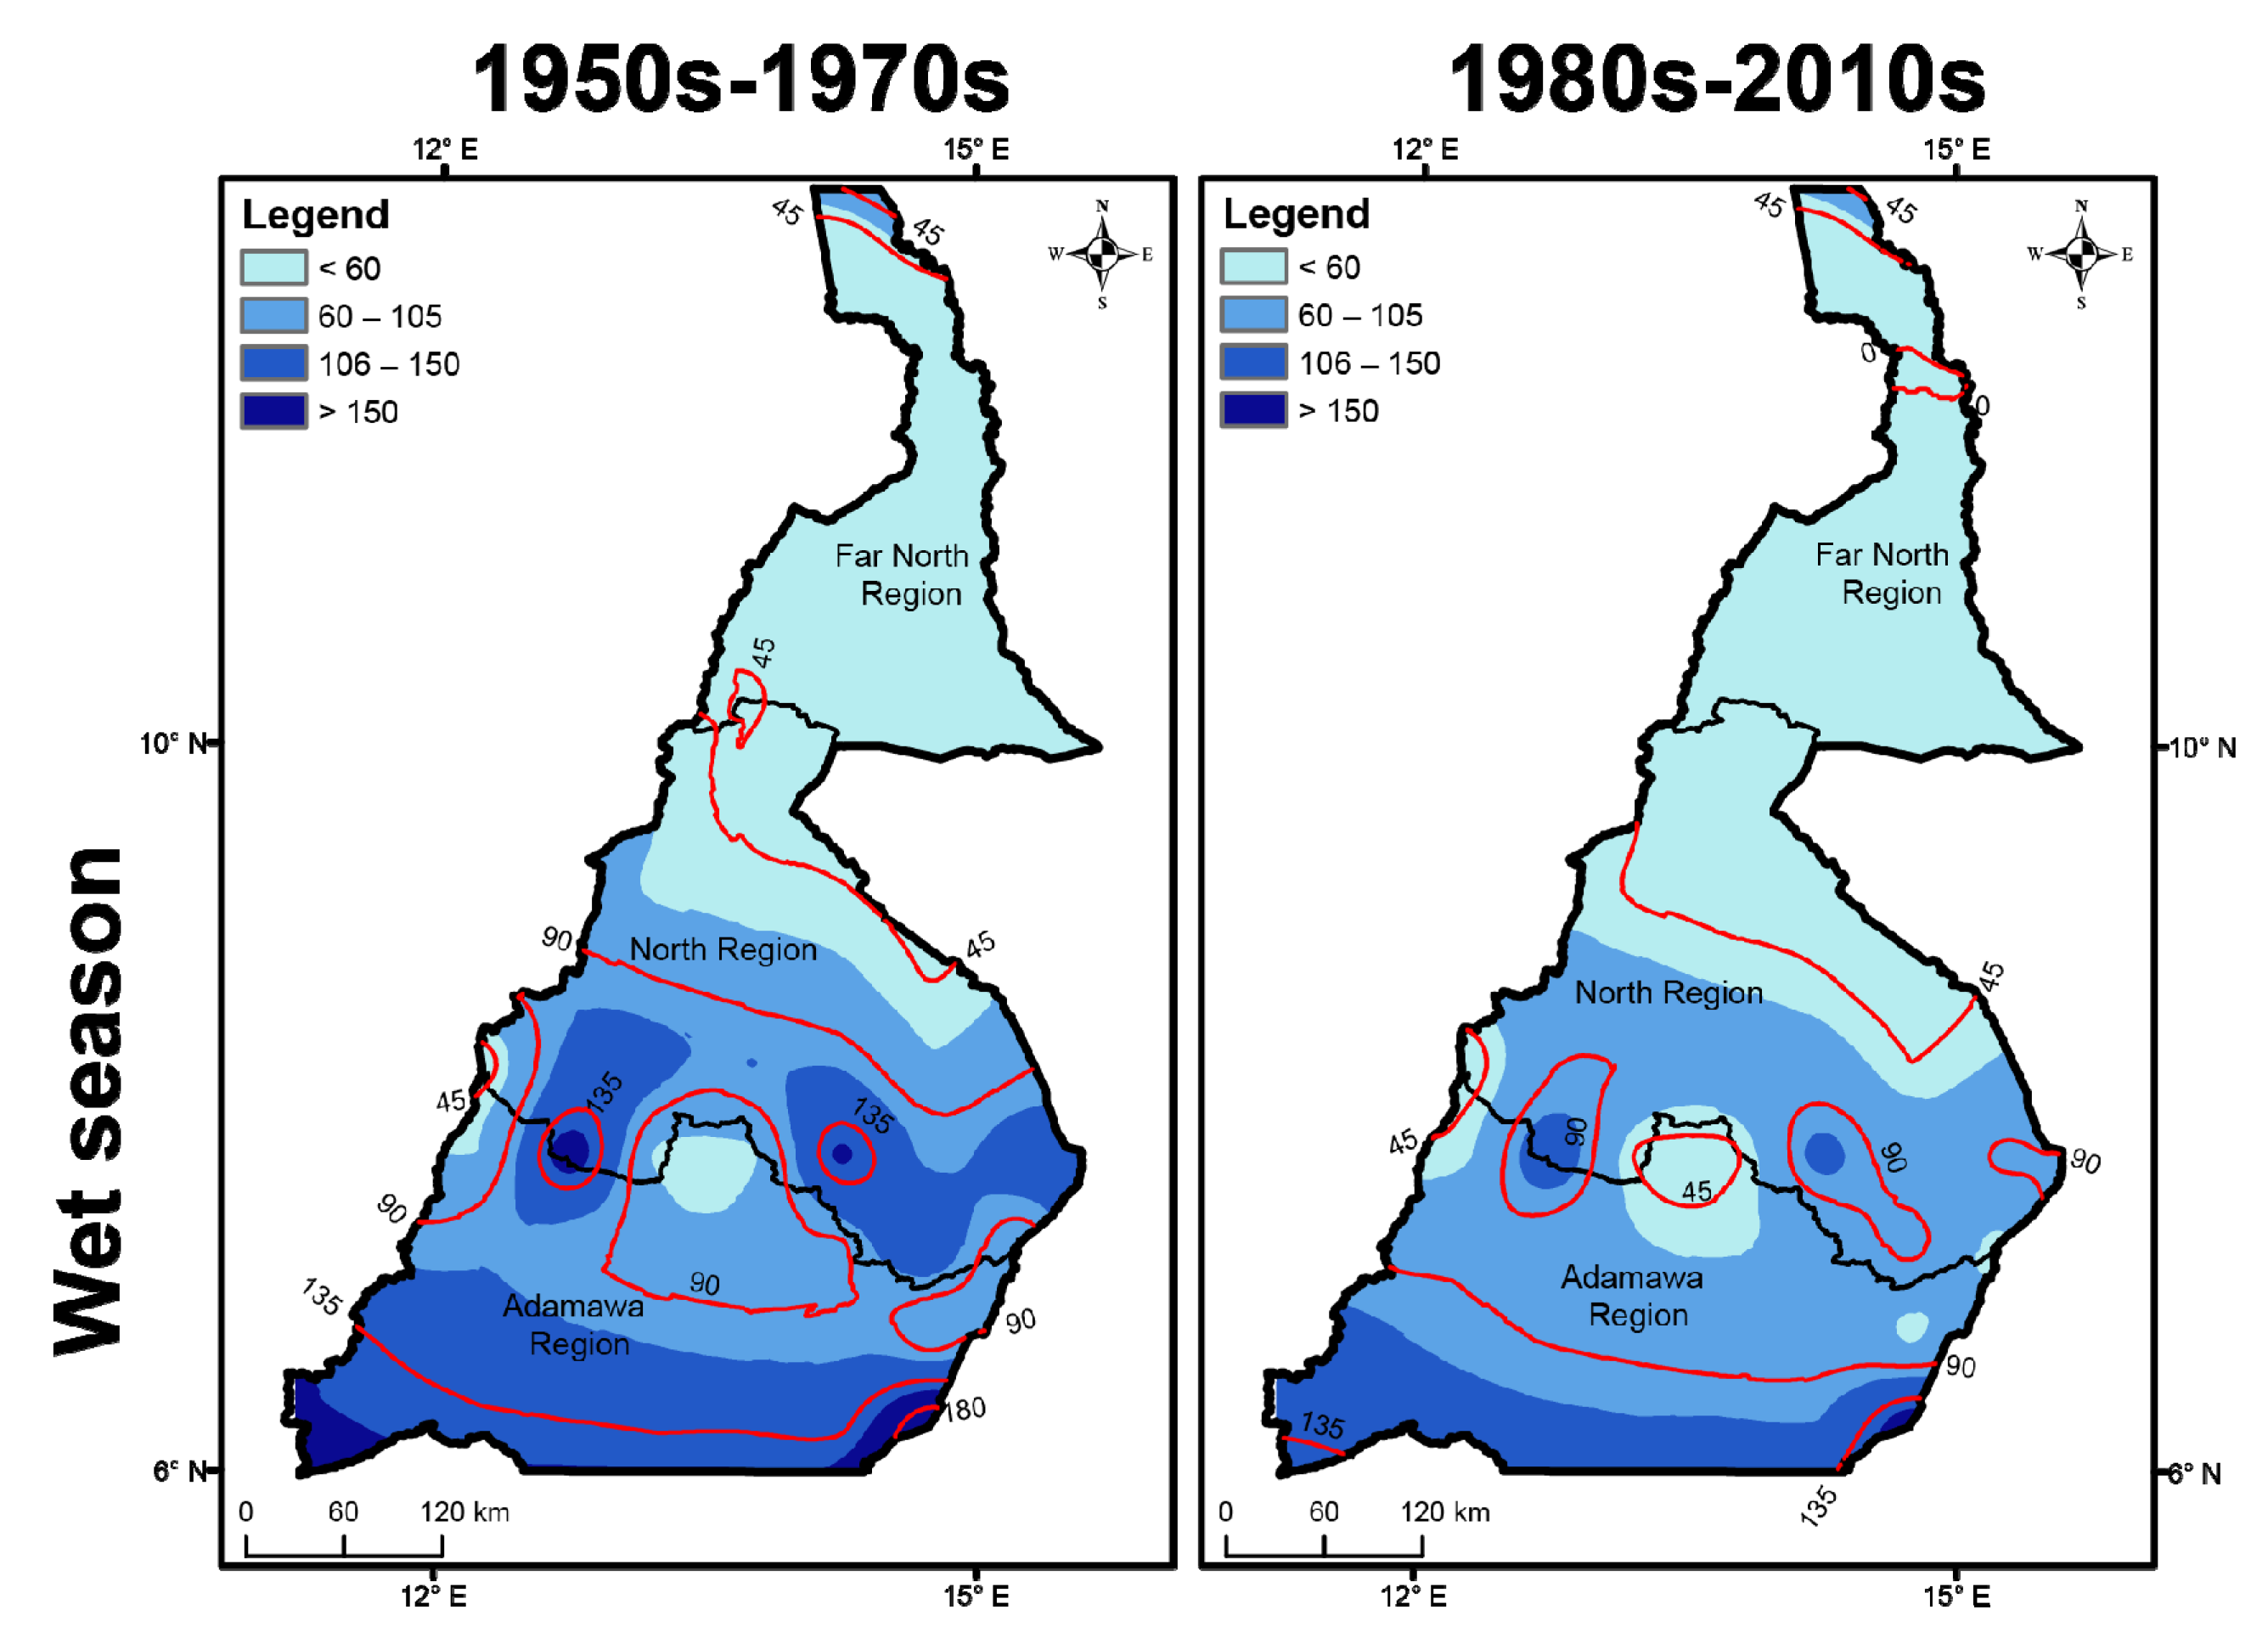
3.2.1. In the Northern Regions

Spatially, the rainfall decreased towards the South in the northern part of Cameroon from the first (decades 1950–1970) to the second defined period (decades 1980–2010). (Figure 8). There is indeed a shift of the isohyets (1000 and 1500 mm, for example) towards the South. In addition, we note that the lower limit of the weakest rainfall class (<1000 mm) progresses towards the South, as does the upper limit of the biggest rainfall class (>1500 mm) (Figure 8). The seasonal rainfall (wet and dry) follows the same spatial evolution as the annual rainfall. We also note in both cases a progression of the isohyets towards the South (Figure 8).

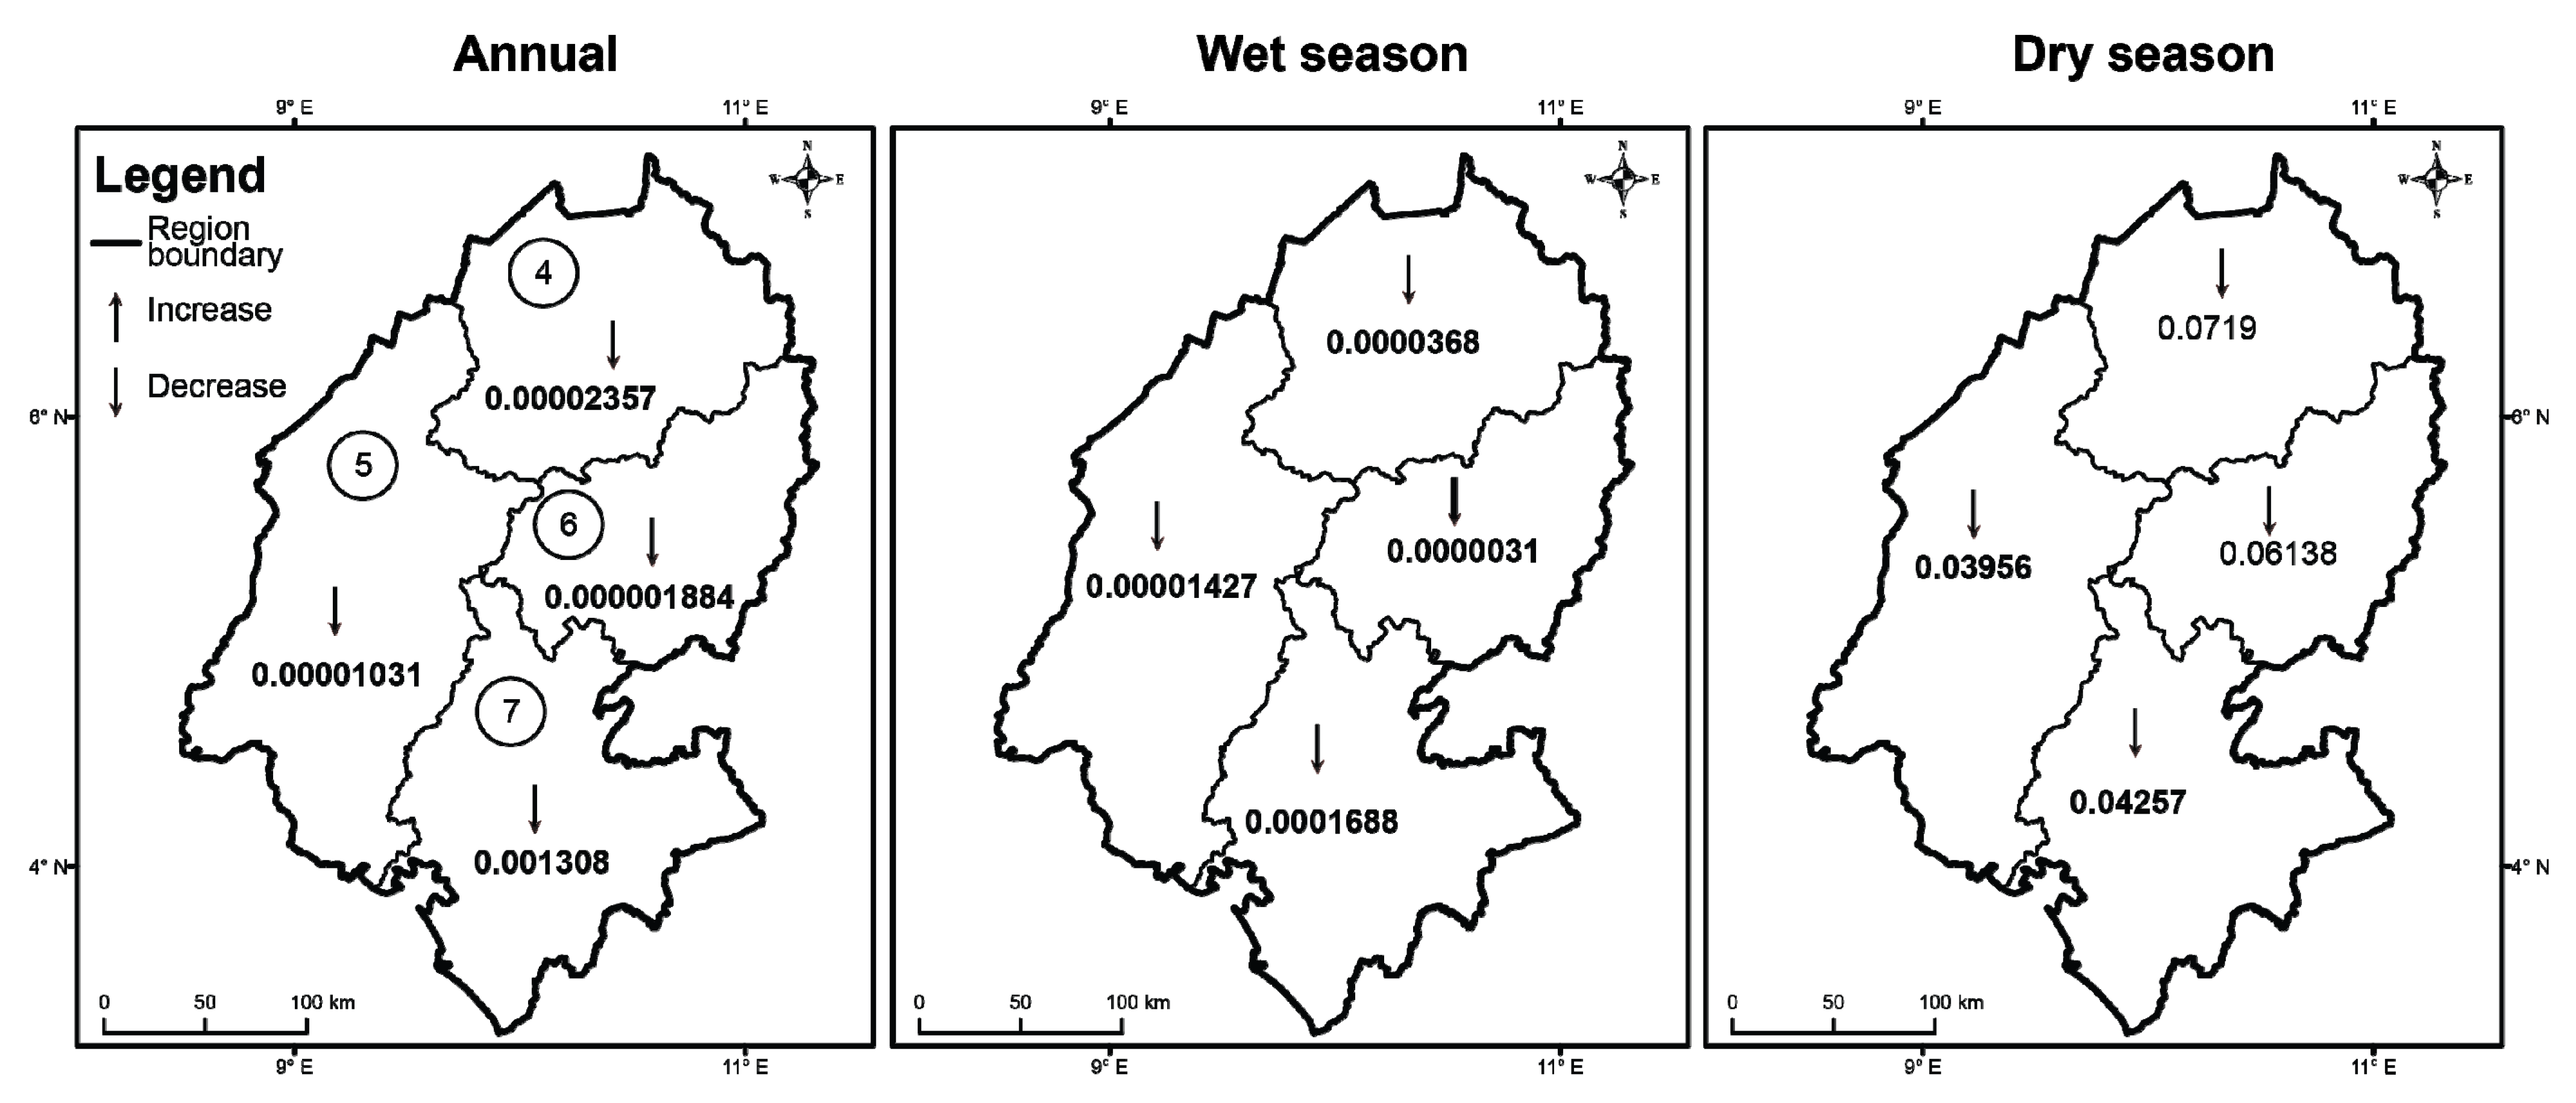
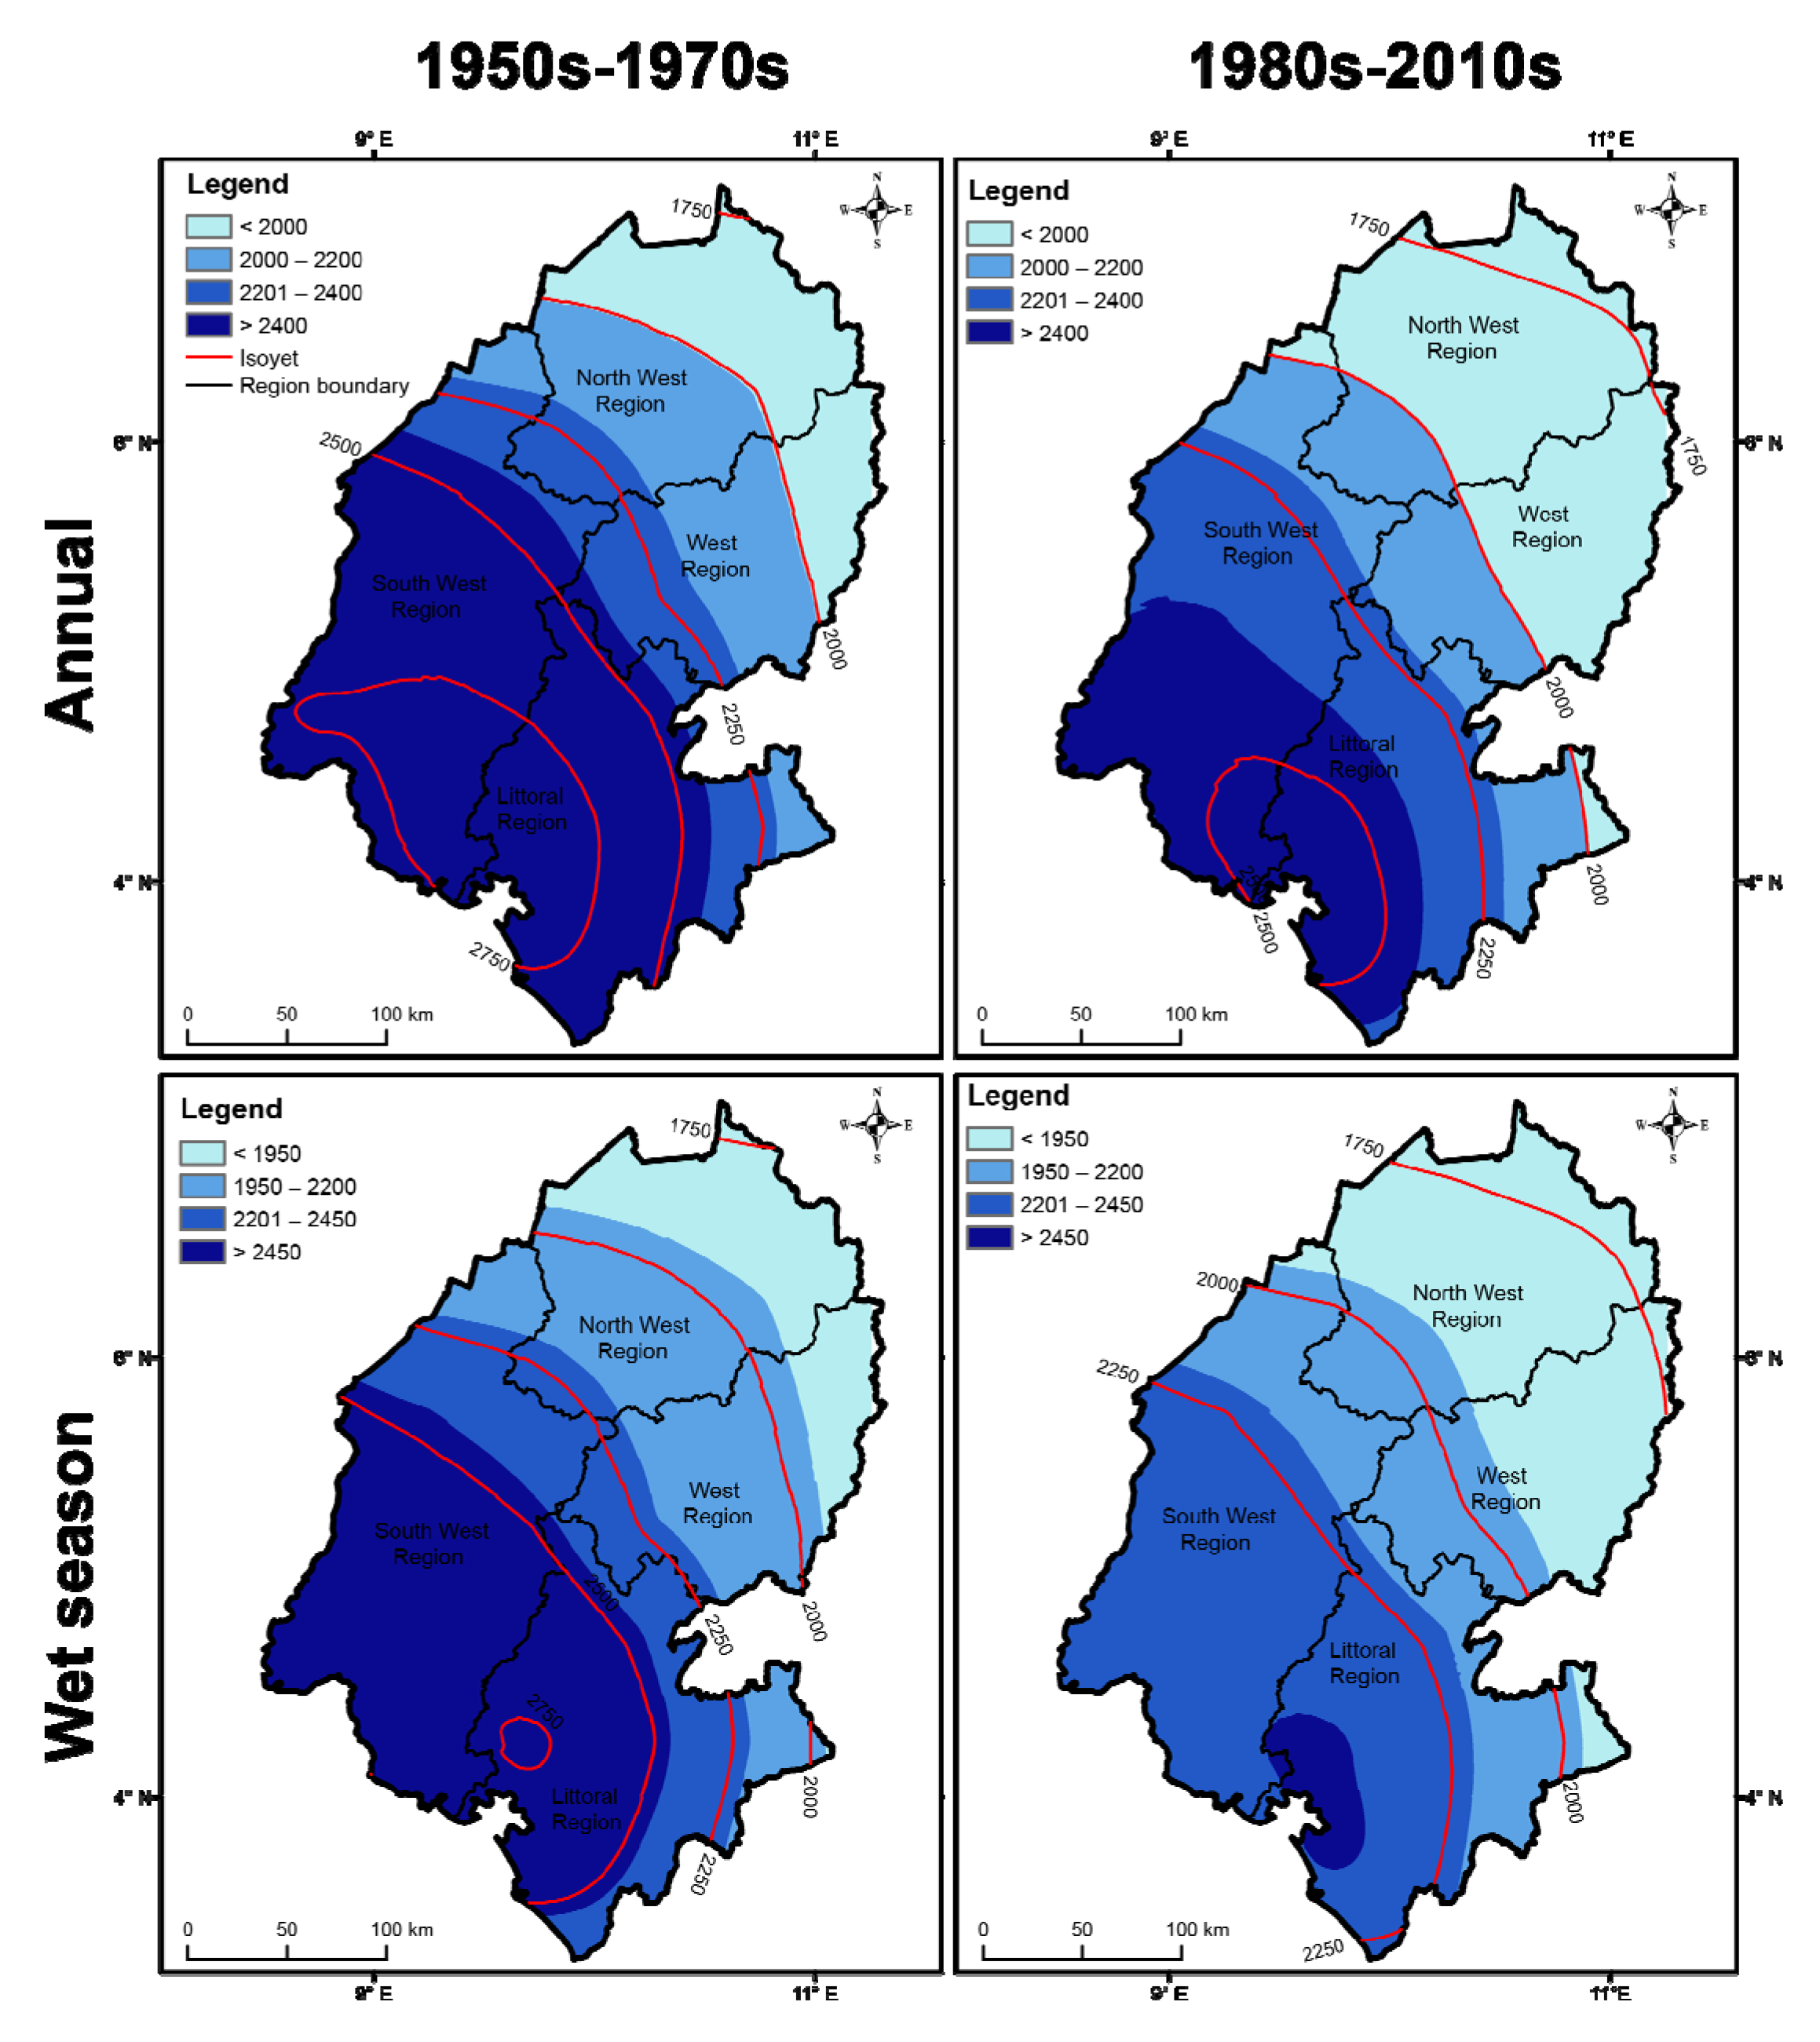
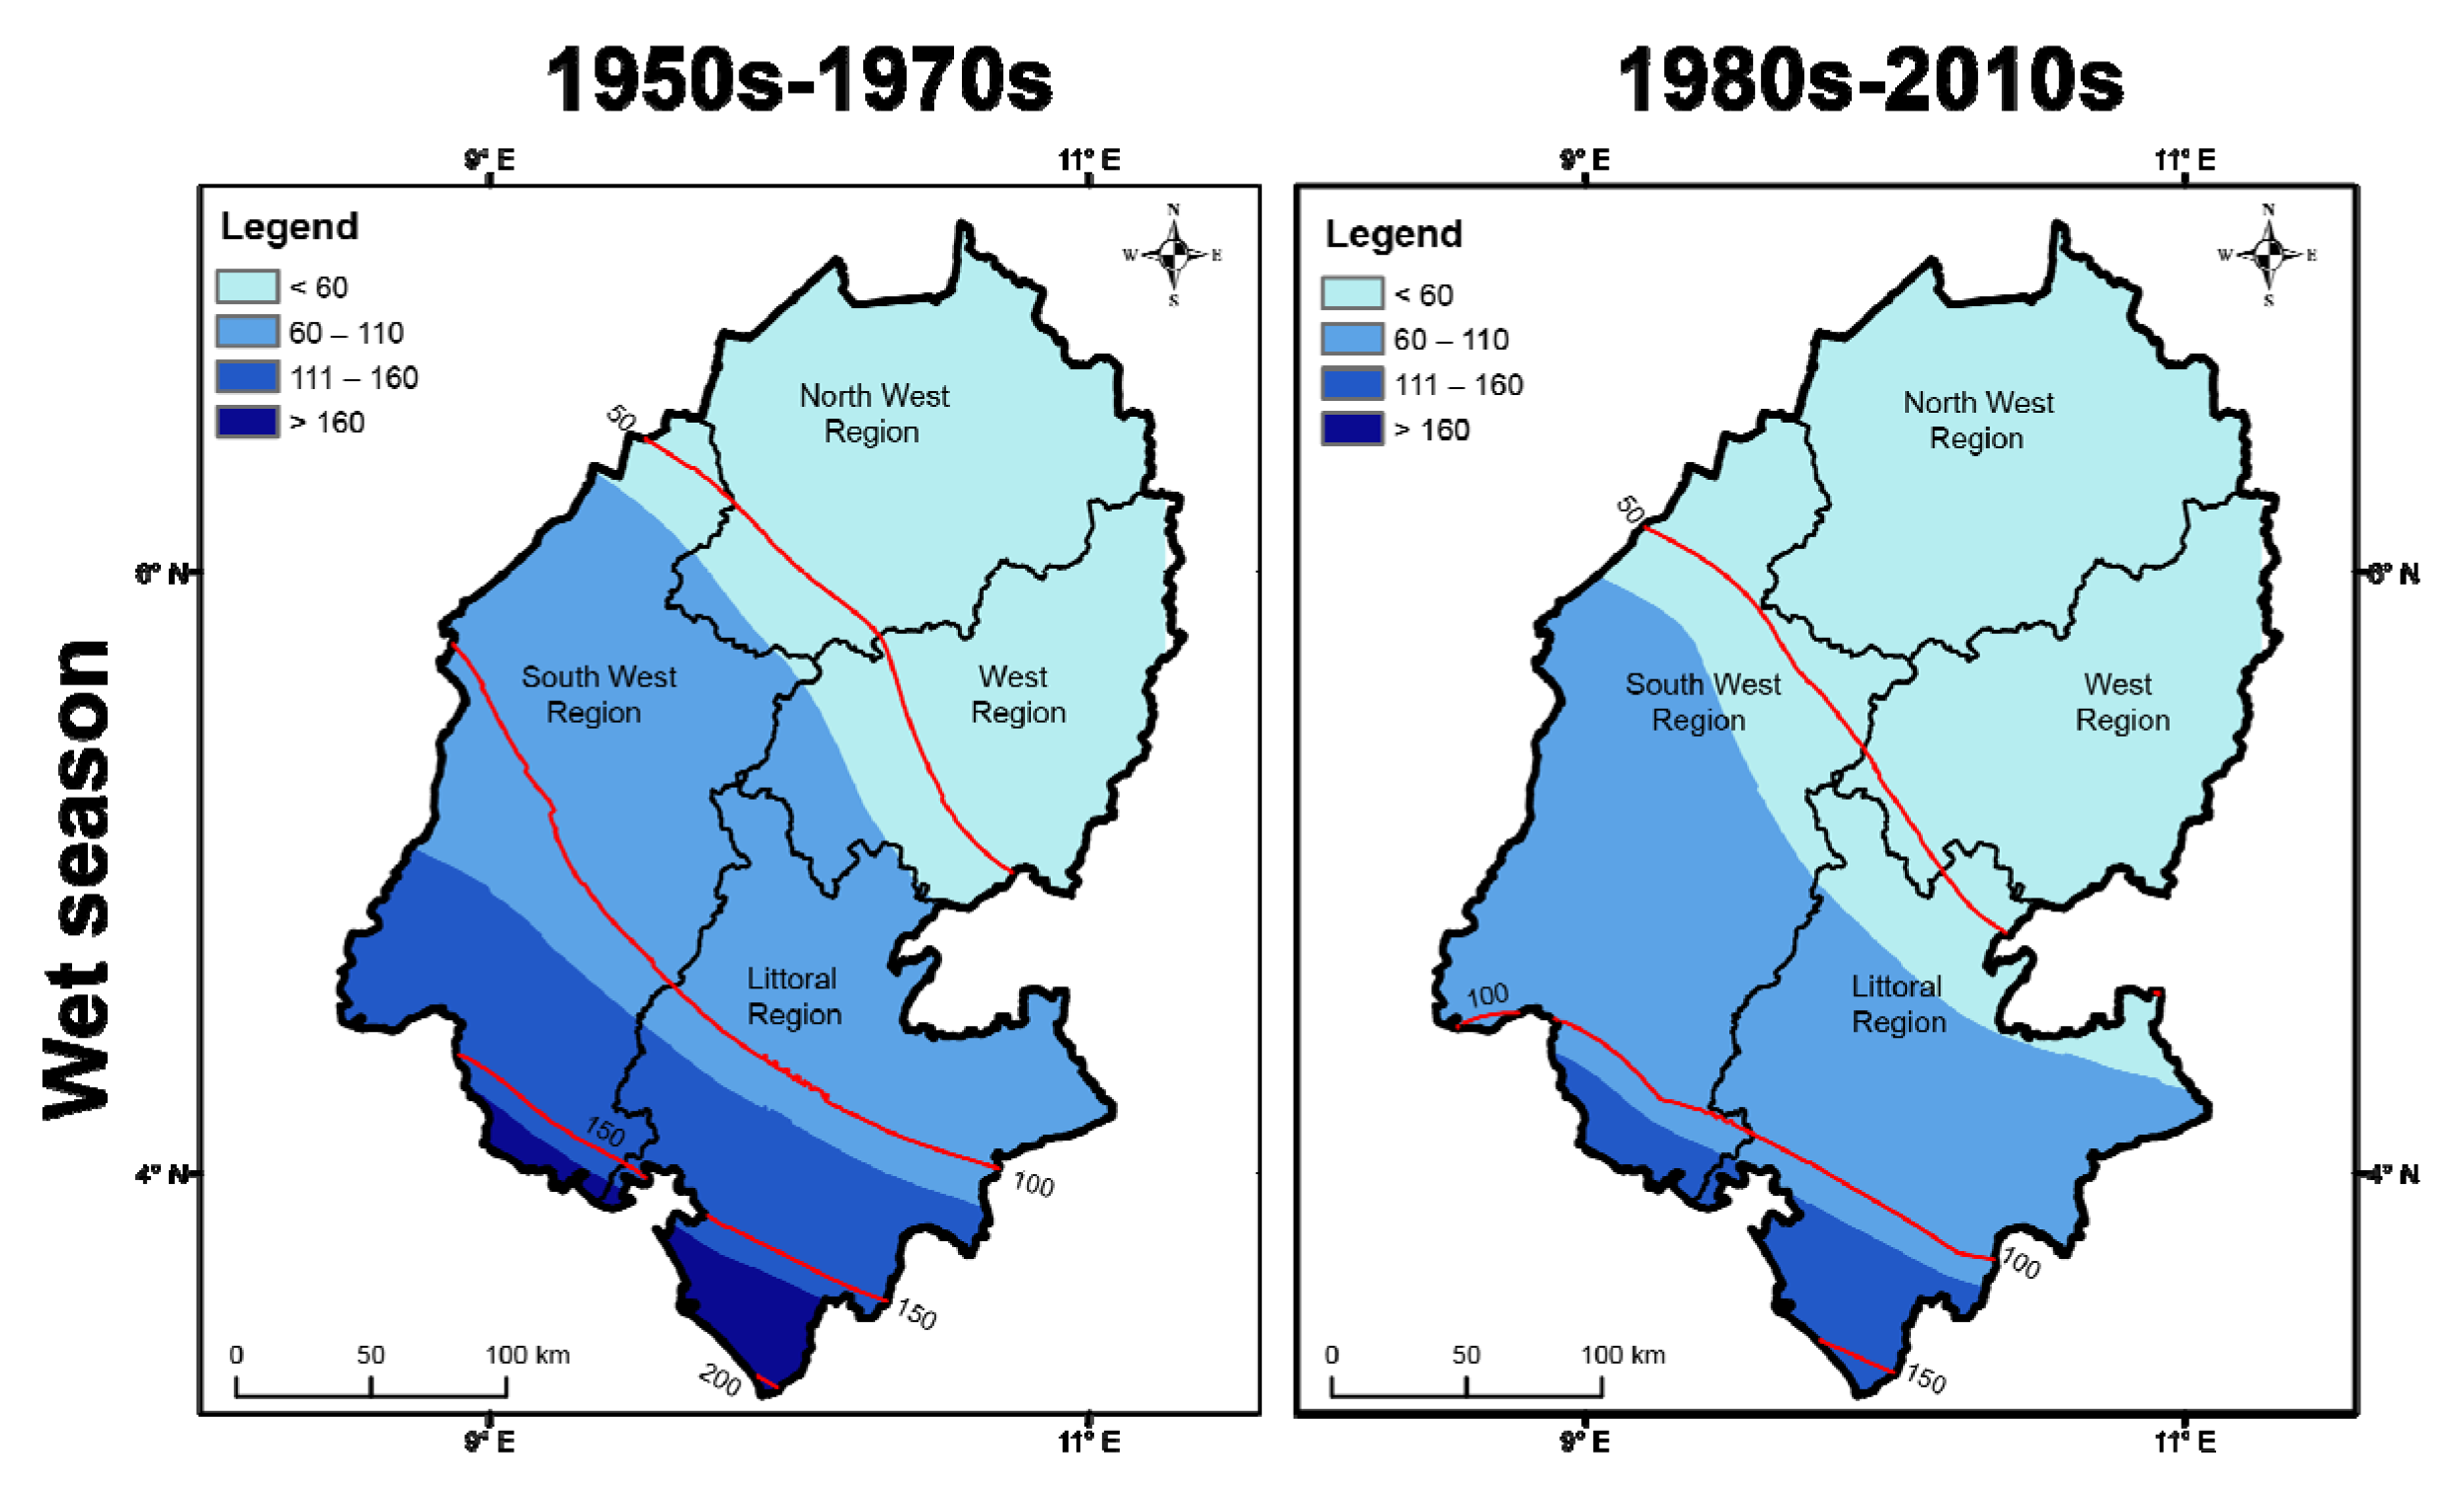
3.2.2. In the Western Regions

In the western regions of Cameroon, the annual and seasonal rainfall decreased towards the South-West during the second defined period (decades 1980–2010) (Figure 9). It is perceptible through the displacement of the lower limits of the smallest rainfall classes (<2000 mm for annual rainfall, <1950 mm for wet season rainfall, and <60 mm for dry season rainfall) and the upper limits of the heaviest rain classes in this direction (South-West) (Figure 9).

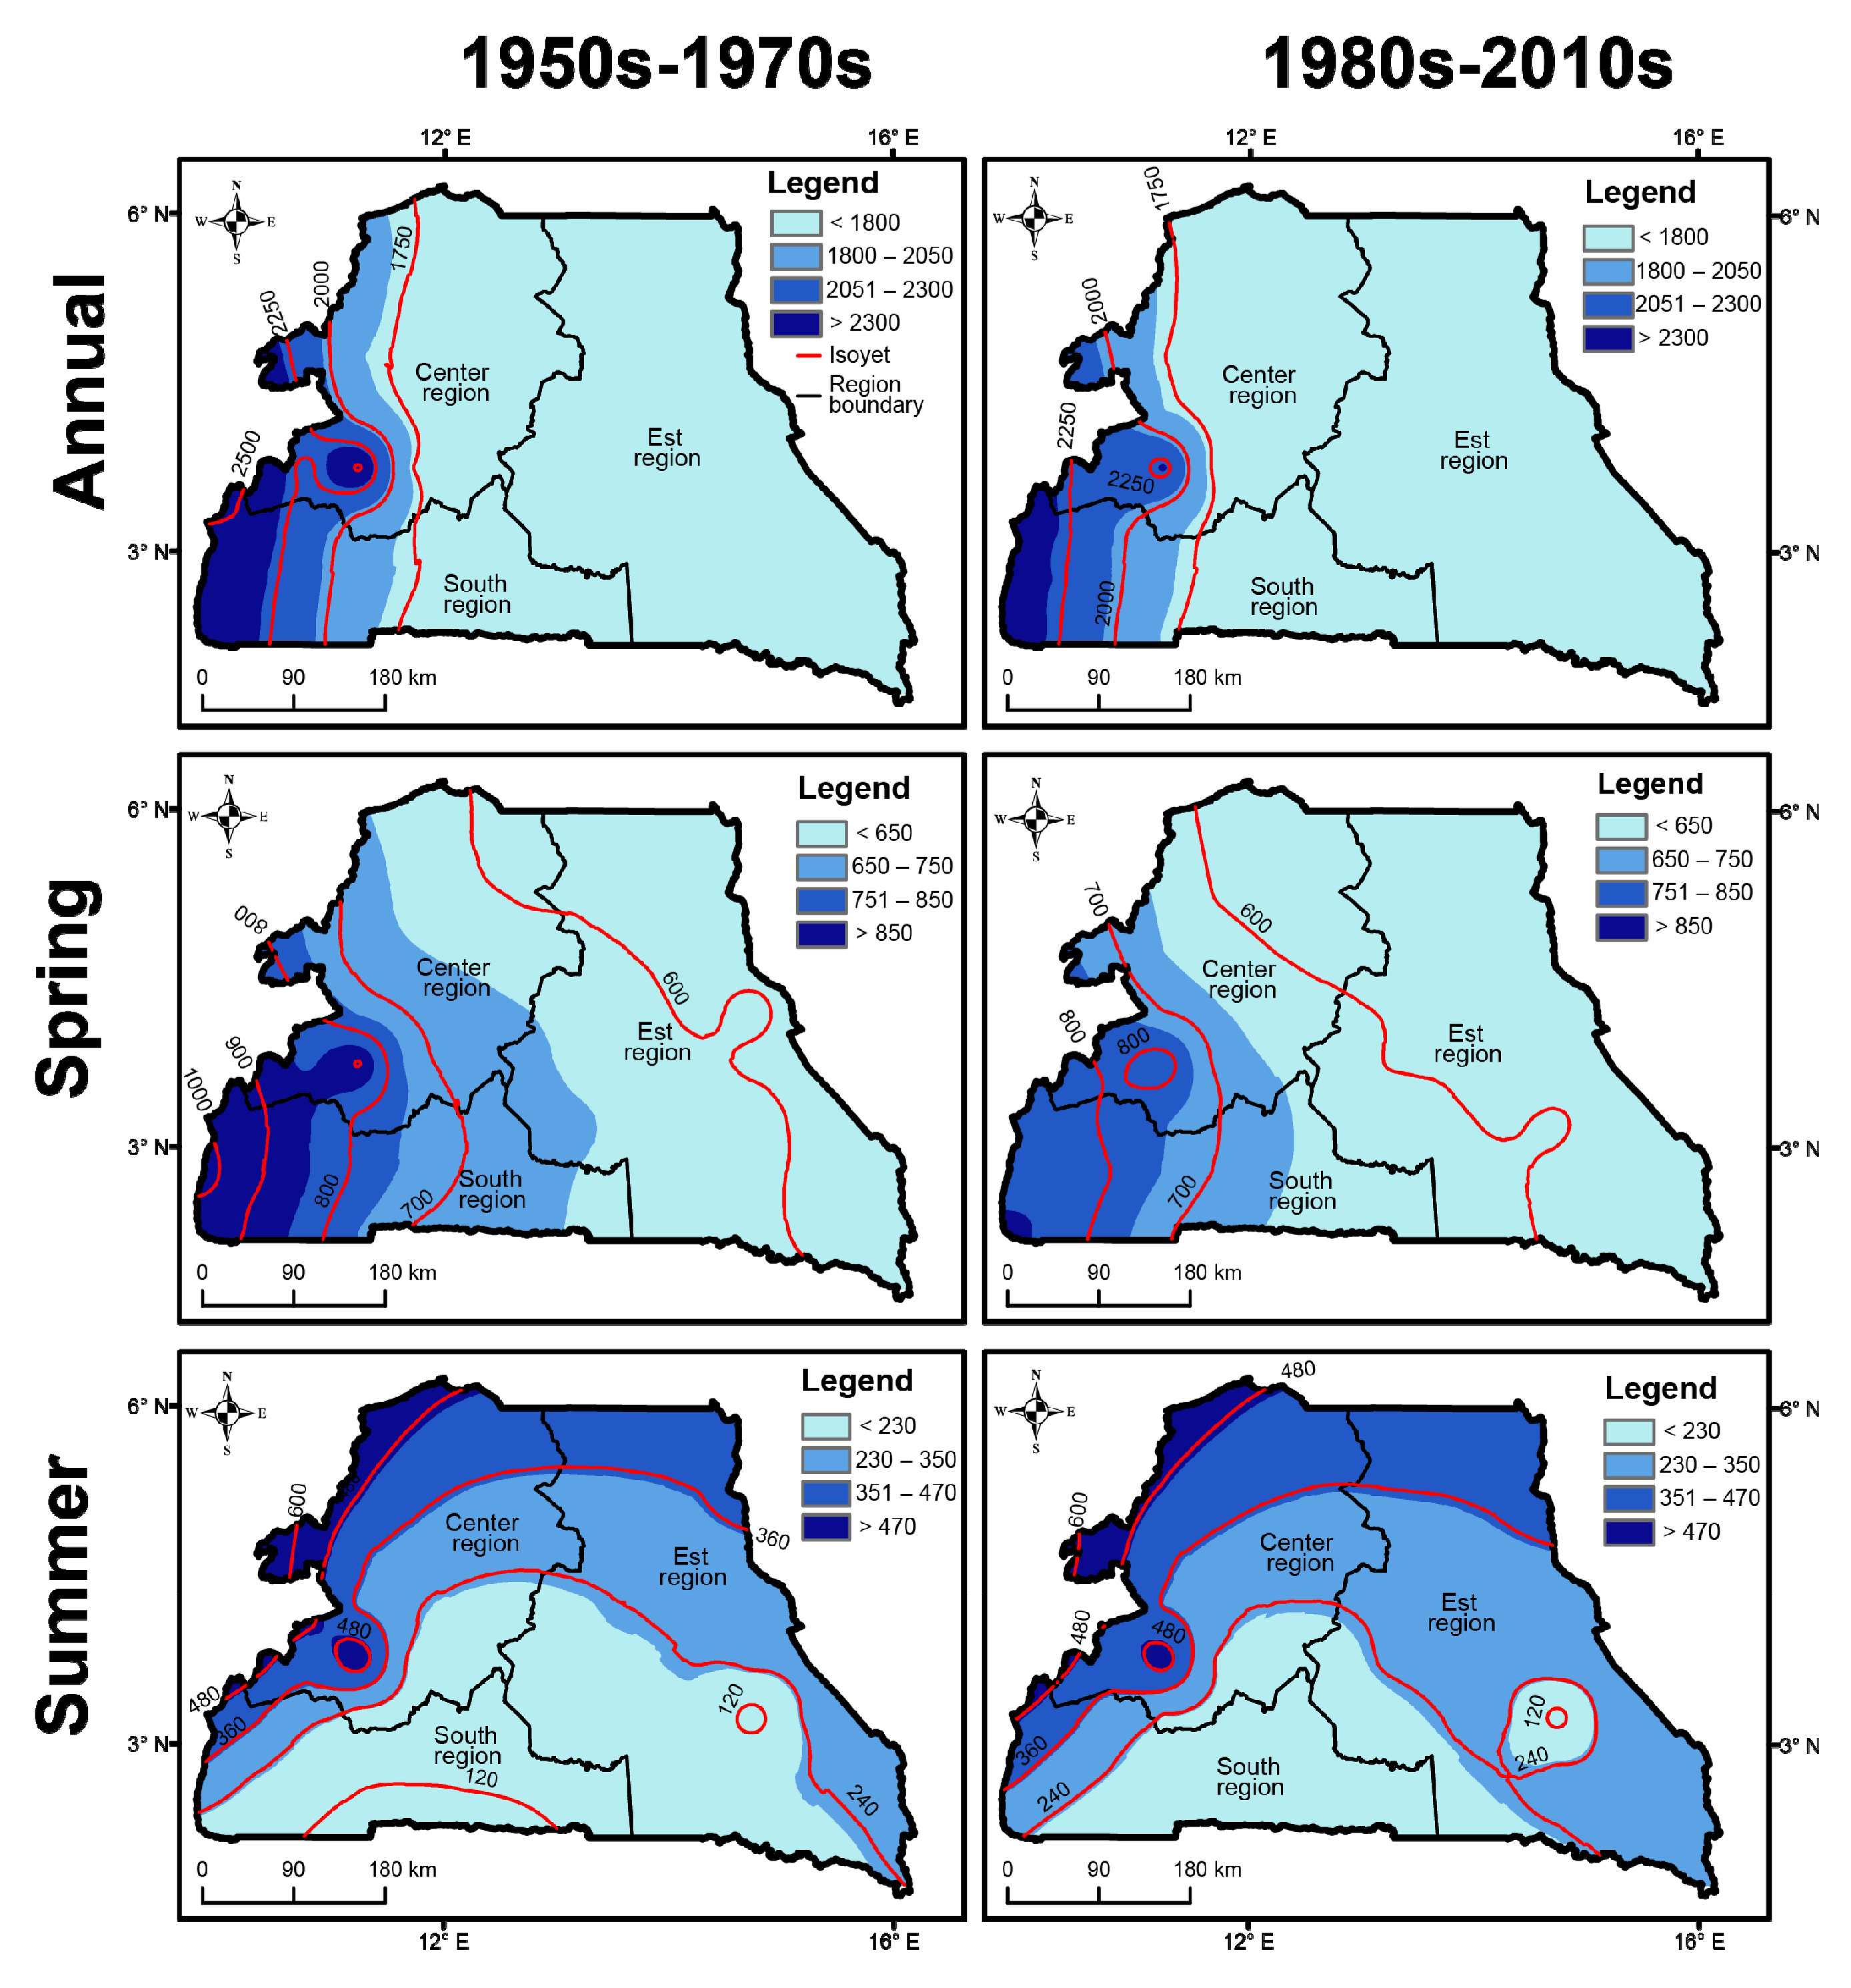
3.2.3. In the Southern Regions

In the southern regions of Cameroon, the annual rainfall and that of the two rainy seasons decreased towards the West after the 1970s (Figure 10). The isohyets and the limits of the rainfall classes progress towards the West (Figure 10). In the case of dry seasons, those of the summer dry season increase towards the South, while those of its winter counterpart decrease in the same direction, if we stick to the movements of the isohyets and the limits of their rainfall classes (Figure 10). Ebodé et al. [20] obtained similar results in their study in the Nyong basin (South Cameroon).

4. Conclusions

This study aimed to analyze, over the recent period (1950–2019), the rainfall spatio-temporal variability in Cameroon. Strong analytical methods (the Pettitt and Mann–Kendall tests) were used. The results show that, temporally, the different regions of Cameroon recorded significant drops in annual rainfall, which Pettitt’s test generally places around the 1970s. The decreases observed for the northern regions of Cameroon are between −5.4% (Adamaoua) and −7.4% (Far North). Those of the western regions of Cameroon oscillate between −7.5% (South-West) and −12.5% (West). The southern regions of Cameroon recorded decreases varying between −4.3% (East) and −5.9% (Center). Spatially, the divisions of the northern, western, and southern regions of Cameroon recorded after the 1970s (a pivotal period in the evolution of precipitation on temporal plan) a precipitation decrease towards the South, the South-West, and the West, respectively. The CRU data used in this study cover the whole country and are available over a long period (1901–2019), but they are only available in monthly time steps and in the form of grids. These data do not allow us to go further in the study of precipitation by addressing very detailed aspects, such as the evolution of the number of rainy days (Ray and Goel 2021). We recommend regular observation of rainfall in different parts of the country.

Funding

This research received no external funding.

Institutional Review Board Statement

Not applicable.

Informed Consent Statement

Not applicable.

Data Availability Statement

All relevant data are included in the paper.

Conflicts of Interest

The author declares no conflict of interest.

References

  1. Arati, P.; Riddhidipa, B.; Chowdary, V.M.; Dibyendu, D.; Sreedhar, U.; Sankar, R. Trend analysis of time series rainfall data using robust statistics. J. Water Clim. Chang. 2017, 8, 691–700. [Google Scholar]
  2. Han, H.; Hou, J.; Jiang, R.; Gong, J.; Bai, G.; Kang, Y.; Qi, W.; Li, Y.; Li, B. Spatial and temporal variation of precipitation characteristics in the semiarid region of Xi’an, northwest China. J. Water Clim. Chang. 2021, 12, 2697–2715. [Google Scholar] [CrossRef]
  3. Aher, M.; Yadav, S.M. Assessment of rainfall trend and variability of semi-arid regions of Upper and Middle Godavari basin, India. J. Water Clim. Chang. 2021, 12, 3992–4006. [Google Scholar] [CrossRef]
  4. Ray, L.; Goel, N. Spatio-temporal change in rainfall over five different climatic regions of India. J. Water Clim. Chang. 2021, 12, 3124–3142. [Google Scholar] [CrossRef]
  5. International Water Management Institute East Africa. 2014. Available online: http://eastafrica.iwmi.cgiar.org/ (accessed on 10 February 2022).
  6. Ogwang, B.A.; Chen, H.; Tan, G.; Ongoma, V.; Ntwali, D. Diagnosis of East African climate and the circulation mechanisms associated with extreme wet and dry events: A study based on RegCM4. Arab. J. Geosci. 2015, 8, 10255–10265. [Google Scholar] [CrossRef]
  7. Camberlin, P. Nile basin climates. In The Nile: Origin, Environments, Limnology and Human Use, Monographiae Biologicae; Dumont, H.J., Ed.; Springer: Dordrecht, The Netherlands, 2009; Volume 89, pp. 307–333. [Google Scholar]
  8. Jury, M.R. Climate trends in southern Africa. S. Afr. J. Sci. 2013, 109, 980. [Google Scholar] [CrossRef] [Green Version]
  9. Diem, J.E.; Hill, T.C.; Milligan, R.A. Diverse multi-decadal changes in streamflow within a rapidly urbanizing region. J. Hydrol. 2018, 556, 61–71. [Google Scholar] [CrossRef]
  10. Tierney, J.E.; Smerdon, J.E.; Anchukaitis, K.J.; Seager, R. Multidecadal variability in East African hydroclimate controlled by the Indian Ocean. Nature 2013, 493, 389–392. [Google Scholar] [CrossRef] [Green Version]
  11. Bigot, S.; Moron, V.; Melice, J.L.; Servat, E.; Paturel, J.E. Fluctuations pluviométriques et analyse fréquentielle de la pluviosité en Afrique centrale. In Water Ressources Variability in Africa during the XXth Century, Abidjan, Côte d’ivoire; Servat, E., Hughes, D., Fritsch, J.M., Hulme, M., Eds.; IHAS Press: Wallingford, UK, 1998; pp. 71–78. [Google Scholar]
  12. Ebodé, V.B.; Dzana, J.G.; Nkiaka, E.; Nka, N.B.; Braun, J.J.; Riotte, J. Effects of climate and anthropogenic changes on current and future variability in flows in the So’o River Basin (South of Cameroon). Hydrol. Res. 2022, 53, 1203–1220. [Google Scholar] [CrossRef]
  13. Cisse, M.T.; Sambou, S.; Dieme, Y.; Diatta, C.; Bop, M. Analyse des écoulements dans le bassin du fleuve Sénégal de 1960 à 2008. Rev. Des Sci. L’eau J. Water Sci. 2014, 27, 167–187. [Google Scholar] [CrossRef] [Green Version]
  14. Nka, N.B.; Oudin, L.; Karambiri, H.; Paturel, J.E.; Ribstein, P. Trends in floods in West Africa: Analysis based on 11 catchments in the region. Hydrol. Earth Syst. Sci. 2015, 19, 4707–4719. [Google Scholar] [CrossRef]
  15. Descroix, L.; Sané, Y.; Thior, M.; Manga, S.-P.; Ba, B.D.; Mingou, J.; Mendy, V.; Coly, S.; Dièye, A.; Badiane, A.; et al. Inverse Estuaries in West Africa: Evidence of the Rainfall Recovery? Water 2020, 12, 647. [Google Scholar] [CrossRef] [Green Version]
  16. Bodian, A.; Diop, L.; Panthou, G.; Dacosta, H.; Deme, A.; Dezetter, A.; Ndiaye, P.M.; Diouf, I.; Vischel, T. Recent Trend in Hydroclimatic Conditions in the Senegal River Basin. Water 2020, 12, 436. [Google Scholar] [CrossRef] [Green Version]
  17. Liénou, G.; Mahé, G.; Paturel, J.E.; Servat, E.; Sighomnou, D.; Ekodeck, G.E.; Dezetter, A.; Dieulin, C. Evolution des régimes hydrologiques en région équatoriale camerounaise: Un impact de la variabilité climatique en zone équatoriale? Hydrol. Sci. J. 2008, 53, 789–801. [Google Scholar] [CrossRef]
  18. Mahé, G.; Lienou, G.; Descroix, L.; Bamba, F.; Paturel, J.E.; Laraque, A.; Meddi, M.; Habaieb, H.; Adegea, O.; Dieulin, C.; et al. The rivers of Africa: Witness of climate change and the human impact on the environment. Hydrol. Process. 2013, 27, 2105–2114. [Google Scholar] [CrossRef]
  19. Ebodé, V.B.; Mahé, G.; Dzana, J.G.; Amougou, J.A. Anthropization and Climate Change: Impact on the Discharges of Forest Watersheds in Central Africa. Water 2020, 12, 2718. [Google Scholar] [CrossRef]
  20. Ebodé, V.B.; Braun, J.J.; Nnomo, B.N.; Mahé, G.; Nkiaka, E.; Riotte, J. Impact of Rainfall Variability and Land Use Change on River Discharge in South Cameroon. Water 2022, 14, 941. [Google Scholar] [CrossRef]
  21. Sighomnou, D. Analyse Et Redefinition Des Regimes Climatiques Et Hydrologiques Du Cameroun: Perspectives D’evolution Des Ressources En Eau. Ph.D. Thesis, Université de Yaoundé I, Yaoundé, Cameroun, 2004. [Google Scholar]
  22. Amougou, J.A.; Ndam, N.J.R.; Djocgoue, P.F.; Bessoh, B.S. Variabilité climatique et régime hydrologique dans un milieu bioclimatique de transition: Cas du bassin fluvial de la Sanaga. Afr. Sci. 2015, 11, N°5. [Google Scholar]
  23. Onyutha, C. Identification of sub-trends from hydro-meteorological series. Stoch. Environ. Res. Risk Assess. 2016, 30, 189–205. [Google Scholar] [CrossRef]
  24. Letouzey, R. Notice de la Carte Phytogéographique du Cameroun au 1/500000; Institut de la Carte Internationale de la Végétation: Toulouse, France, 1985. [Google Scholar]
  25. Yue, S.; Pilon, P.; Cavadias, G. Power of the Man–Kendall and Spearman’s rho tests for detecting monotonic trends in hydrological series. J. Hyrdol. 2002, 259, 254–271. [Google Scholar] [CrossRef]
  26. Pettitt, A.N. A non-parametric approach to the change-point problem. Appl. Stat. 1979, 28, 126–135. [Google Scholar] [CrossRef]
  27. Ebodé, V.B. Impact of rainfall variability and land-use changes on river discharge in Sanaga catchment (forest–savannah transition zone in Central Africa). Hydrol. Res. 2022, 53, 1017–1030. [Google Scholar] [CrossRef]
  28. Descroix, L.; Guichard, F.; Grippa, M.; Lambert, L.A.; Panthou, G.; Mahé, G.; Gal, L.; Dardel, C.; Quantin, G.; Kergoat, L.; et al. Evolution of Surface Hydrology in the Sahelo-Sudanian Strip: An Updated Review. Water 2018, 10, 748. [Google Scholar] [CrossRef] [Green Version]
  29. Ebodé, V.B.; Mahé, G.; Amoussou, E. Impact de la variabilité climatique et de l’anthropisation sur les écoulements de la Bénoué (nord Cameroun). Proc. IAHS 2021, 384, 261–267. [Google Scholar] [CrossRef]
  30. Ebodé, V.B.; Mahé, G.; Amoussou, E. Changement climatique dans le bassin versant de l’Ogooué: Évolution récente et impact sur les écoulements. Proc. IAHS 2021, 384, 247–253. [Google Scholar] [CrossRef]
  31. Ebodé, V.B. Variabilité Hydroclimatique en Afrique Centrale Occidentale Forestière: Entre Analyse Des Fluctuations Observées, Modélisation Prédictive et Recherche Des Facteurs Explicatifs. Ph.D. Thesis, Université de Yaoundé 1, Yaoundé, Cameroun, 2022. [Google Scholar]
Figure 1. Regional map of Cameroon. The numbers at the top in each region indicate the area in km2, and those below indicate the percentage (%) of occupation of this region in the national territory (Cameroon).
Atmosphere 13 01769 g001
Figure 2. Results of annual and seasonal rainfall for the northern regions of the country (Adamawa (3), North (2), and Far North (1)), using Mann–Kendall’s test. There is a significant trend in the series when the calculated p-values are below the significance level (α = 0.05). Significant trends are indicated by values in bold.
Atmosphere 13 01769 g002
Figure 3. Temporal variation of annual and seasonal rainfall for the northern regions of the country (Adamawa, North and Far North), according to the Pettitt test. The rupture years are indicated by the vertical dashed lines. On their right sides appear the corresponding rates of change. The ruptures in black are those which are identical to several regions.
Atmosphere 13 01769 g003
Figure 4. Results of annual and seasonal rainfall for the western regions of the country (Littoral (7), West (6), South-West (5), and North-West (4)), using Mann–Kendall’s test. There is a significant trend in the series when the calculated p-values are below the significance level (α = 0.05). Significant trends are indicated by values in bold.
Atmosphere 13 01769 g004
Figure 5. Temporal variation of annual and seasonal rainfall for the western regions of the country (Littoral, West, North-West, and South-West), according to the Pettitt test. The rupture years are indicated by the vertical dashed lines. On their right sides appear the corresponding rates of change. The ruptures in black are those which are identical to several regions.
Atmosphere 13 01769 g005
Figure 6. Results of annual and seasonal rainfall for the southern regions of the country (South (10), East (9), and Center (8)), using Mann–Kendall’s test. There is a significant trend in the series when the calculated p-values are below the significance level (α = 0.05). Significant trends are indicated by values in bold.
Atmosphere 13 01769 g006
Figure 7. Temporal variation of annual and seasonal rainfall for the southern regions of the country (South, Center, and East), according to the Pettitt test. The rupture years are indicated by the vertical dashed lines. On their right sides appear the corresponding rates of change. The ruptures in black are those which are identical to several regions.
Atmosphere 13 01769 g007
Figure 8. Spatial distribution of mean rainfall for the northern regions of the country (Adamawa, North, and Far North) at seasonal and annual time scales, between the decades 1950–1970 and 1980–2010.
Atmosphere 13 01769 g008aAtmosphere 13 01769 g008b
Figure 9. Spatial distribution of mean rainfall for the western regions of the country (Littoral, North-West, West, and South-West) at seasonal and annual time scales, between the decades 1950–1970 and 1980–2010.
Atmosphere 13 01769 g009aAtmosphere 13 01769 g009b
Figure 10. Spatial distribution of mean rainfall for the southern regions of the country (Center, East, and South) at seasonal and annual time scales, between the decades 1950–1970 and 1980–2010.
Atmosphere 13 01769 g010aAtmosphere 13 01769 g010b
Table 1. Statistical properties of annual and seasonal rainfall for the southern regions of the country (Center, East, and South). Each of these regions has 4 seasons.
AnnualSpringSummerAutumnWinter
CenterEastSouthCenterEastSouthCenterEastSouthCenterEastSouthCenterEastSouth
Mean rainfall (mm)17841580189166458973639028722267359779557106172
Maximum rainfall (mm)205718692368847746966511422364828750917120180306
Minimum rainfall (mm)1479134813564724485262321598552445854410.238.457.9
CV0.070.0650.090.100.090.120.140.20.270.090.090.100.410.310.3
CV: coefficient of variation.
Table 2. Statistical properties of annual and seasonal rainfall for the northern regions (Adamawa, North, and Far North) and western regions (Littoral, North-West, West, and South-West) of the country. Each of these regions has 2 seasons.
AdamawaNorthFar NorthLittoralNorth-WestWestSouth-West
Annual
Mean rainfall (mm)154011747262387191120952413
Maximum rainfall (mm)179913568782834233424572907
Minimum rainfall (mm)13058814441849167018242044
CV0.070.080.130.090.070.080.09
Wet season
Mean rainfall (mm)143710837092288188320522321
Maximum rainfall (mm)164712838612720230924342845
Minimum rainfall (mm)1196834.24311785164617861962
CV0.070.080.130.090.070.080.09
Dry season
Mean rainfall (mm)1039117.7100284331
Maximum rainfall (mm)200164.449.8184.38610563
Minimum rainfall (mm)2722.740.622.2469.527
CV0.40.340.640.380.520.450.39
CV: coefficient of variation.
Table 3. Deviations (%) of the decadal annual and seasonal averages of rainfall compared to their interannual means for the northern regions (Adamawa, North, and Far North) and western regions (Littoral, North-West, West, and South-West) of the country.
DecadesAdamawaNorthFar NorthLittoralNorth-WestWestSouth-West
Annual
19503.95.311.58.36.57.69.1
19604.86.54.58.25.26.79.4
19700.70.6−2.5−0.40.10.6−1.3
1980−5.3−6.8−12.4−5.9−4.2−4.4−6.3
19901.83.3−0.3−4.5−0.7−3−3.5
2000−4.7−4.8−1.11.1−1.5−0.9−0.7
2010−2.5−3.71.2−6.5−5.4−6.6−6.8
Wet season
19501.74.411.27.567.18.2
19604.64.83.38.15.56.99.5
19701.30.2−3.1−1−0.30.2−2
1980−5−6.2−12.4−5−3.9−4.1−5.4
19902.43.2−0.8−4.1−0.3−2.6−2.8
2000−2.7−4.1−0.21.2−1.5−0.9−0.6
2010−2.4−2.12.1−6.5−5.4−6.6−6.9
Dry season
195034.816.61926.439.135.432.1
19608.425.84510−16.5−4.27.4
1970−8.25.320.213.130.92014.8
1980−8.8−13.7−16.5−26−22.1−18−27.2
1990−64.416−14.4−31.5−23−19.9
2000−15.1−13.1−42.8−0.1−1.5−2.1−1
2010−4−22.3−40.3−5.9−5−6.9−5.7
Table 4. Deviations (%) of the decadal annual and seasonal averages of rainfall compared to their interannual means for the southern regions of the country (Center, East, and South).
DecadesAnnualSpringSummerAutumnWinter
CenterEastSouthCenterEastSouthCenterEastSouthCenterEastSouthCenterEastSouth
19503.92.847.66.47−9.1−14−216.55.46.419.215.313.3
19604.33.43.83.63.84.83.70.4−3.84.32.91.916.313.417.4
19700.9−1.3−1.6−0.9−1.8−1.34.4−3.7−4.8−0.4−0.8−2.212.95.63.4
1980−3.5−2.3−3.6−5.7−1.7−4.95.65.89.3−4.6−3.9−2.4−26−18−20
1990−2.2−0.7−2.6−4−3.2−5.34.61113.6−3−1.5−2.7−19−13−12
20000.2−1.83.2−0.4−41.30.225.80.8−2.24.51.23.22.5
2010−3.6−0.3−3.3−0.41−1.2−8.7−1−0.4−3.60−5.7−6.6−6.9−5.5
Publisher’s Note: MDPI stays neutral with regard to jurisdictional claims in published maps and institutional affiliations.

